-
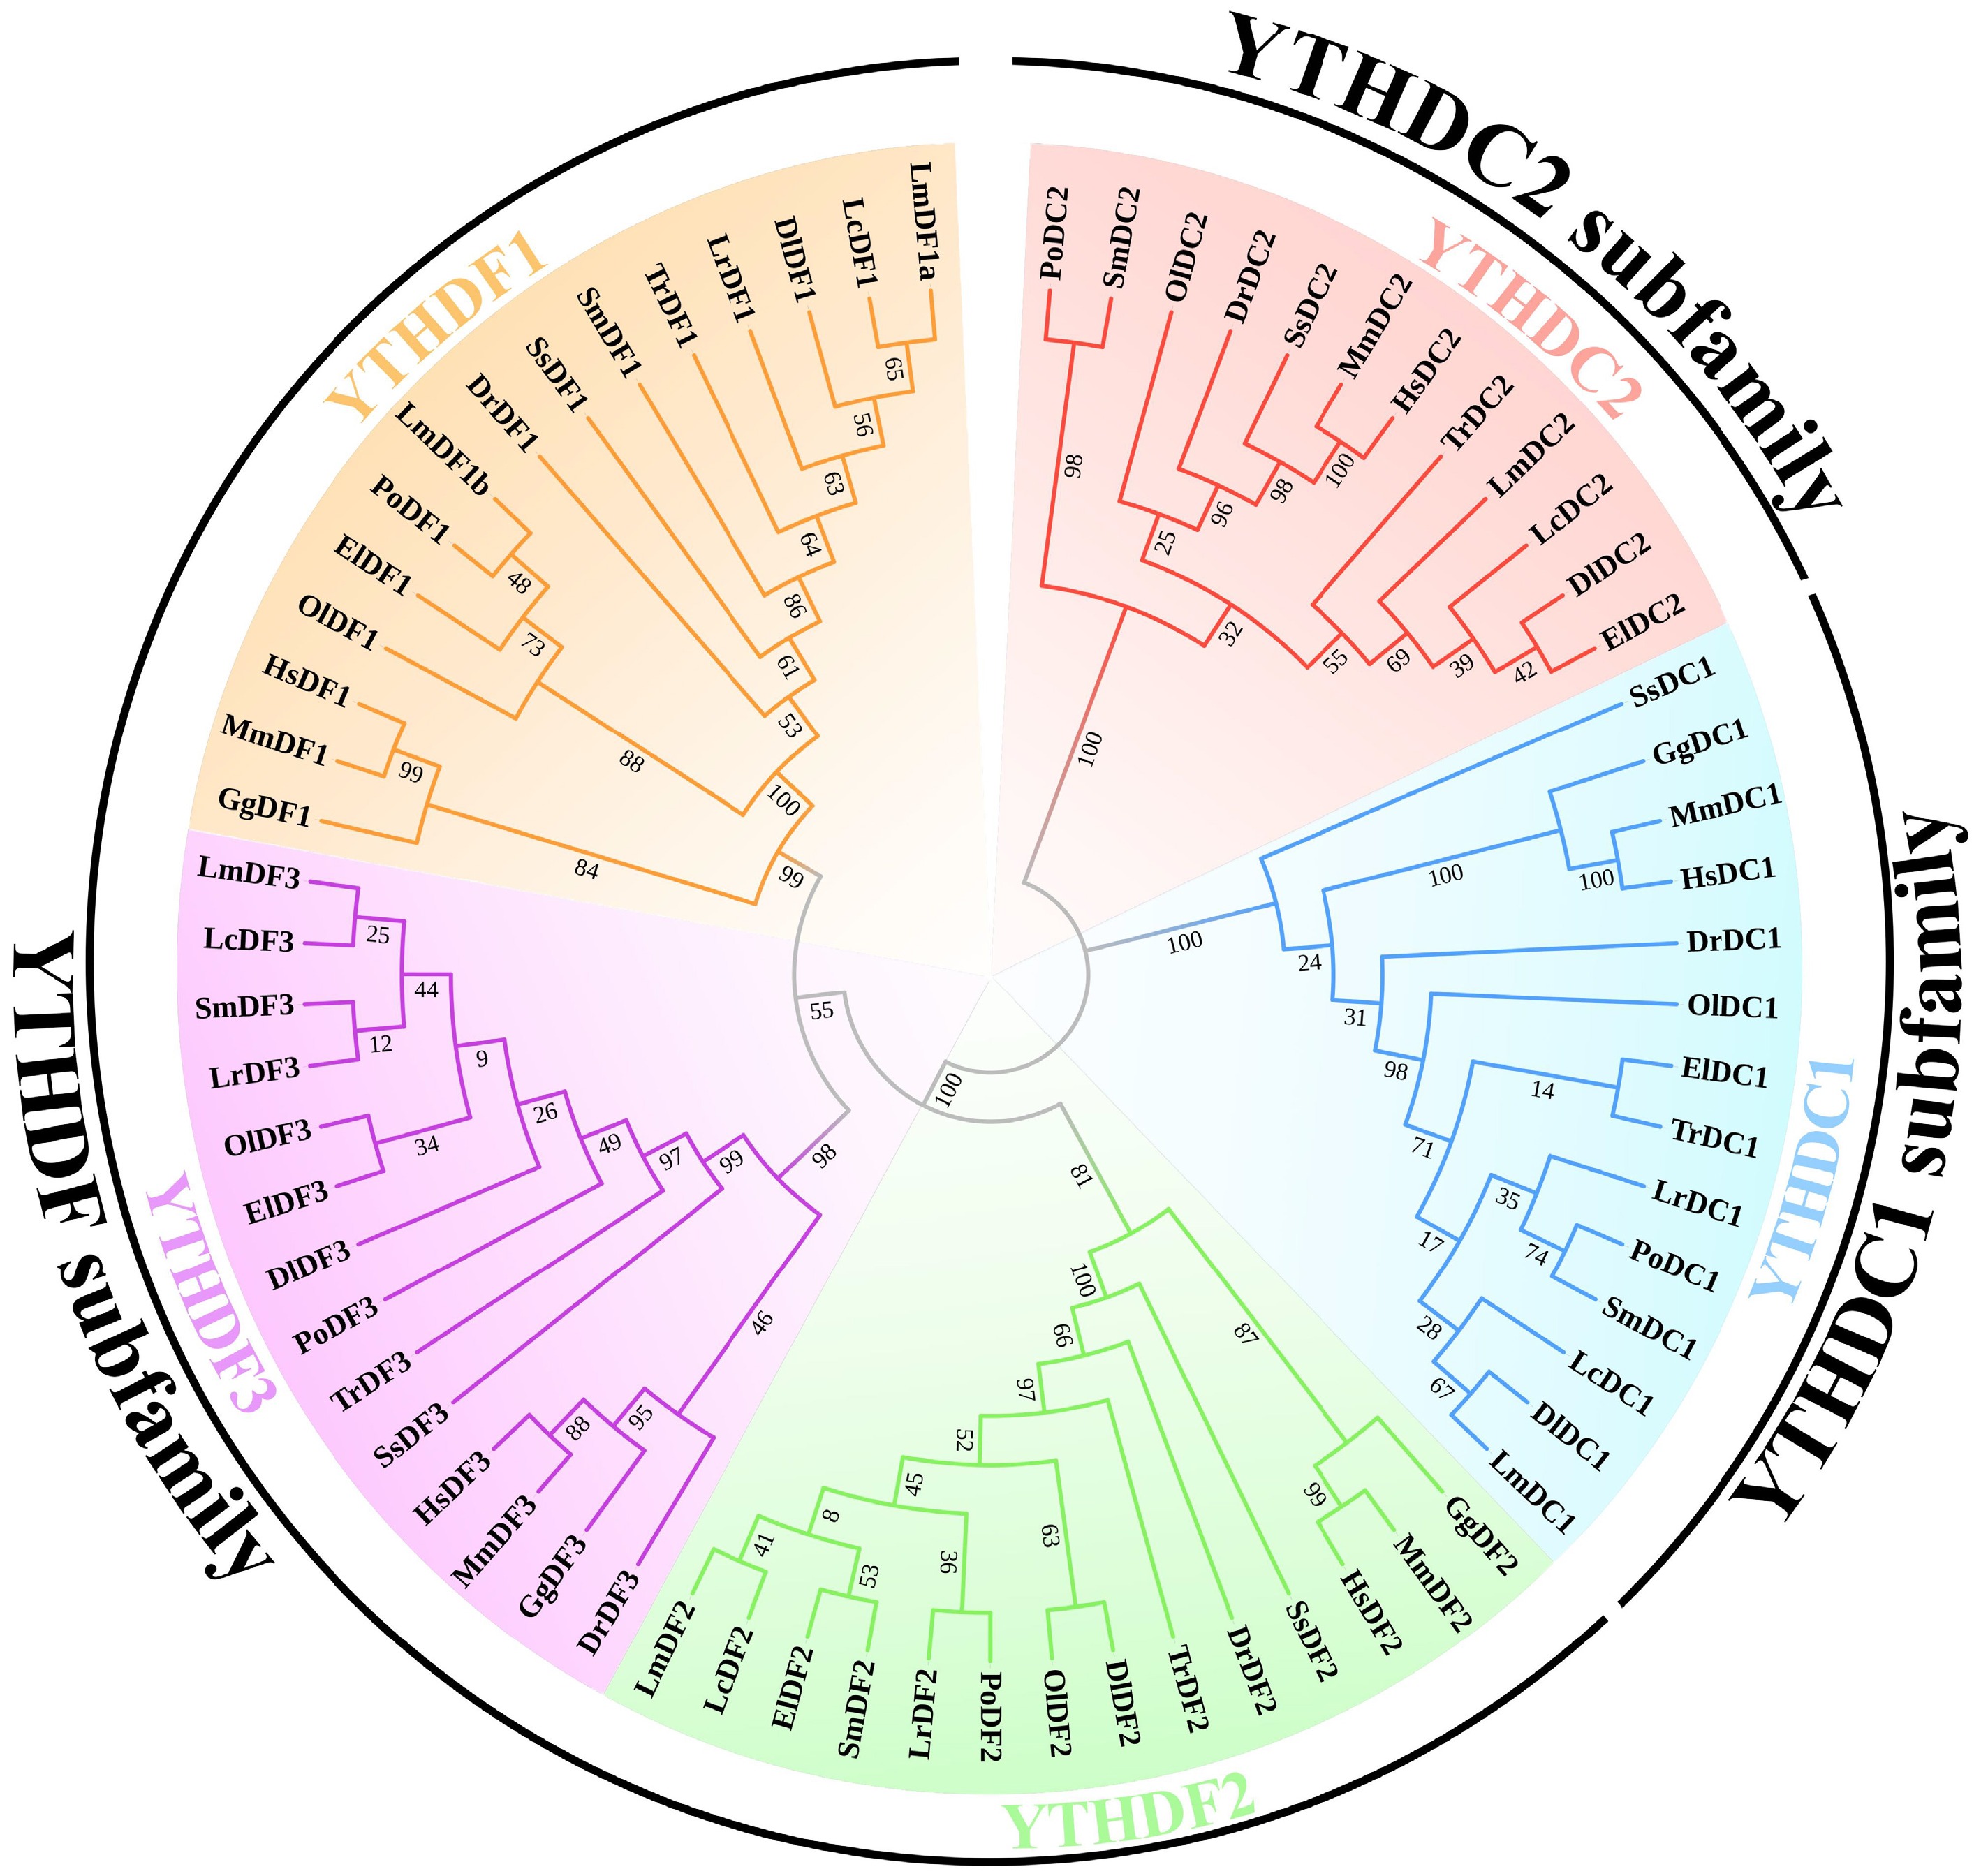
Figure 1.
Phylogenetic tree of YTH domain-containing genes. The phylogenetic tree was constructed using the maximum likelihood (ML) method with 1,000 bootstrap replications. Amino acid sequences of the YTH domain-containing genes in human, mouse, spotted sea bass, and representative teleosts were aligned to build the phylogenetic tree. The five subclades of YTHDC1, YTHDC2, YTHDF1, YTHDF2, and YTHDF3 are distinguished with different colours. The abbreviations used are as follows: YTH domain-containing genes in Homo sapiens are labeled as Hs; Mus musculus, Mm; Danio rerio, Dr; Dicentrarchus labrax, Dl; Epinephelus lanceolatus, El; Gallus gallus, Gg; Larimichthys crocea, Lc; Lateolabrax maculatus, Lm; Lates calcarifer, Lr; Oryzias latipes, Ol; Paralichthys olivaceus, Po; Scophthalmus maximus, Sm; Salmo salar, Ss; Takifugu rubripes, Tr.
-
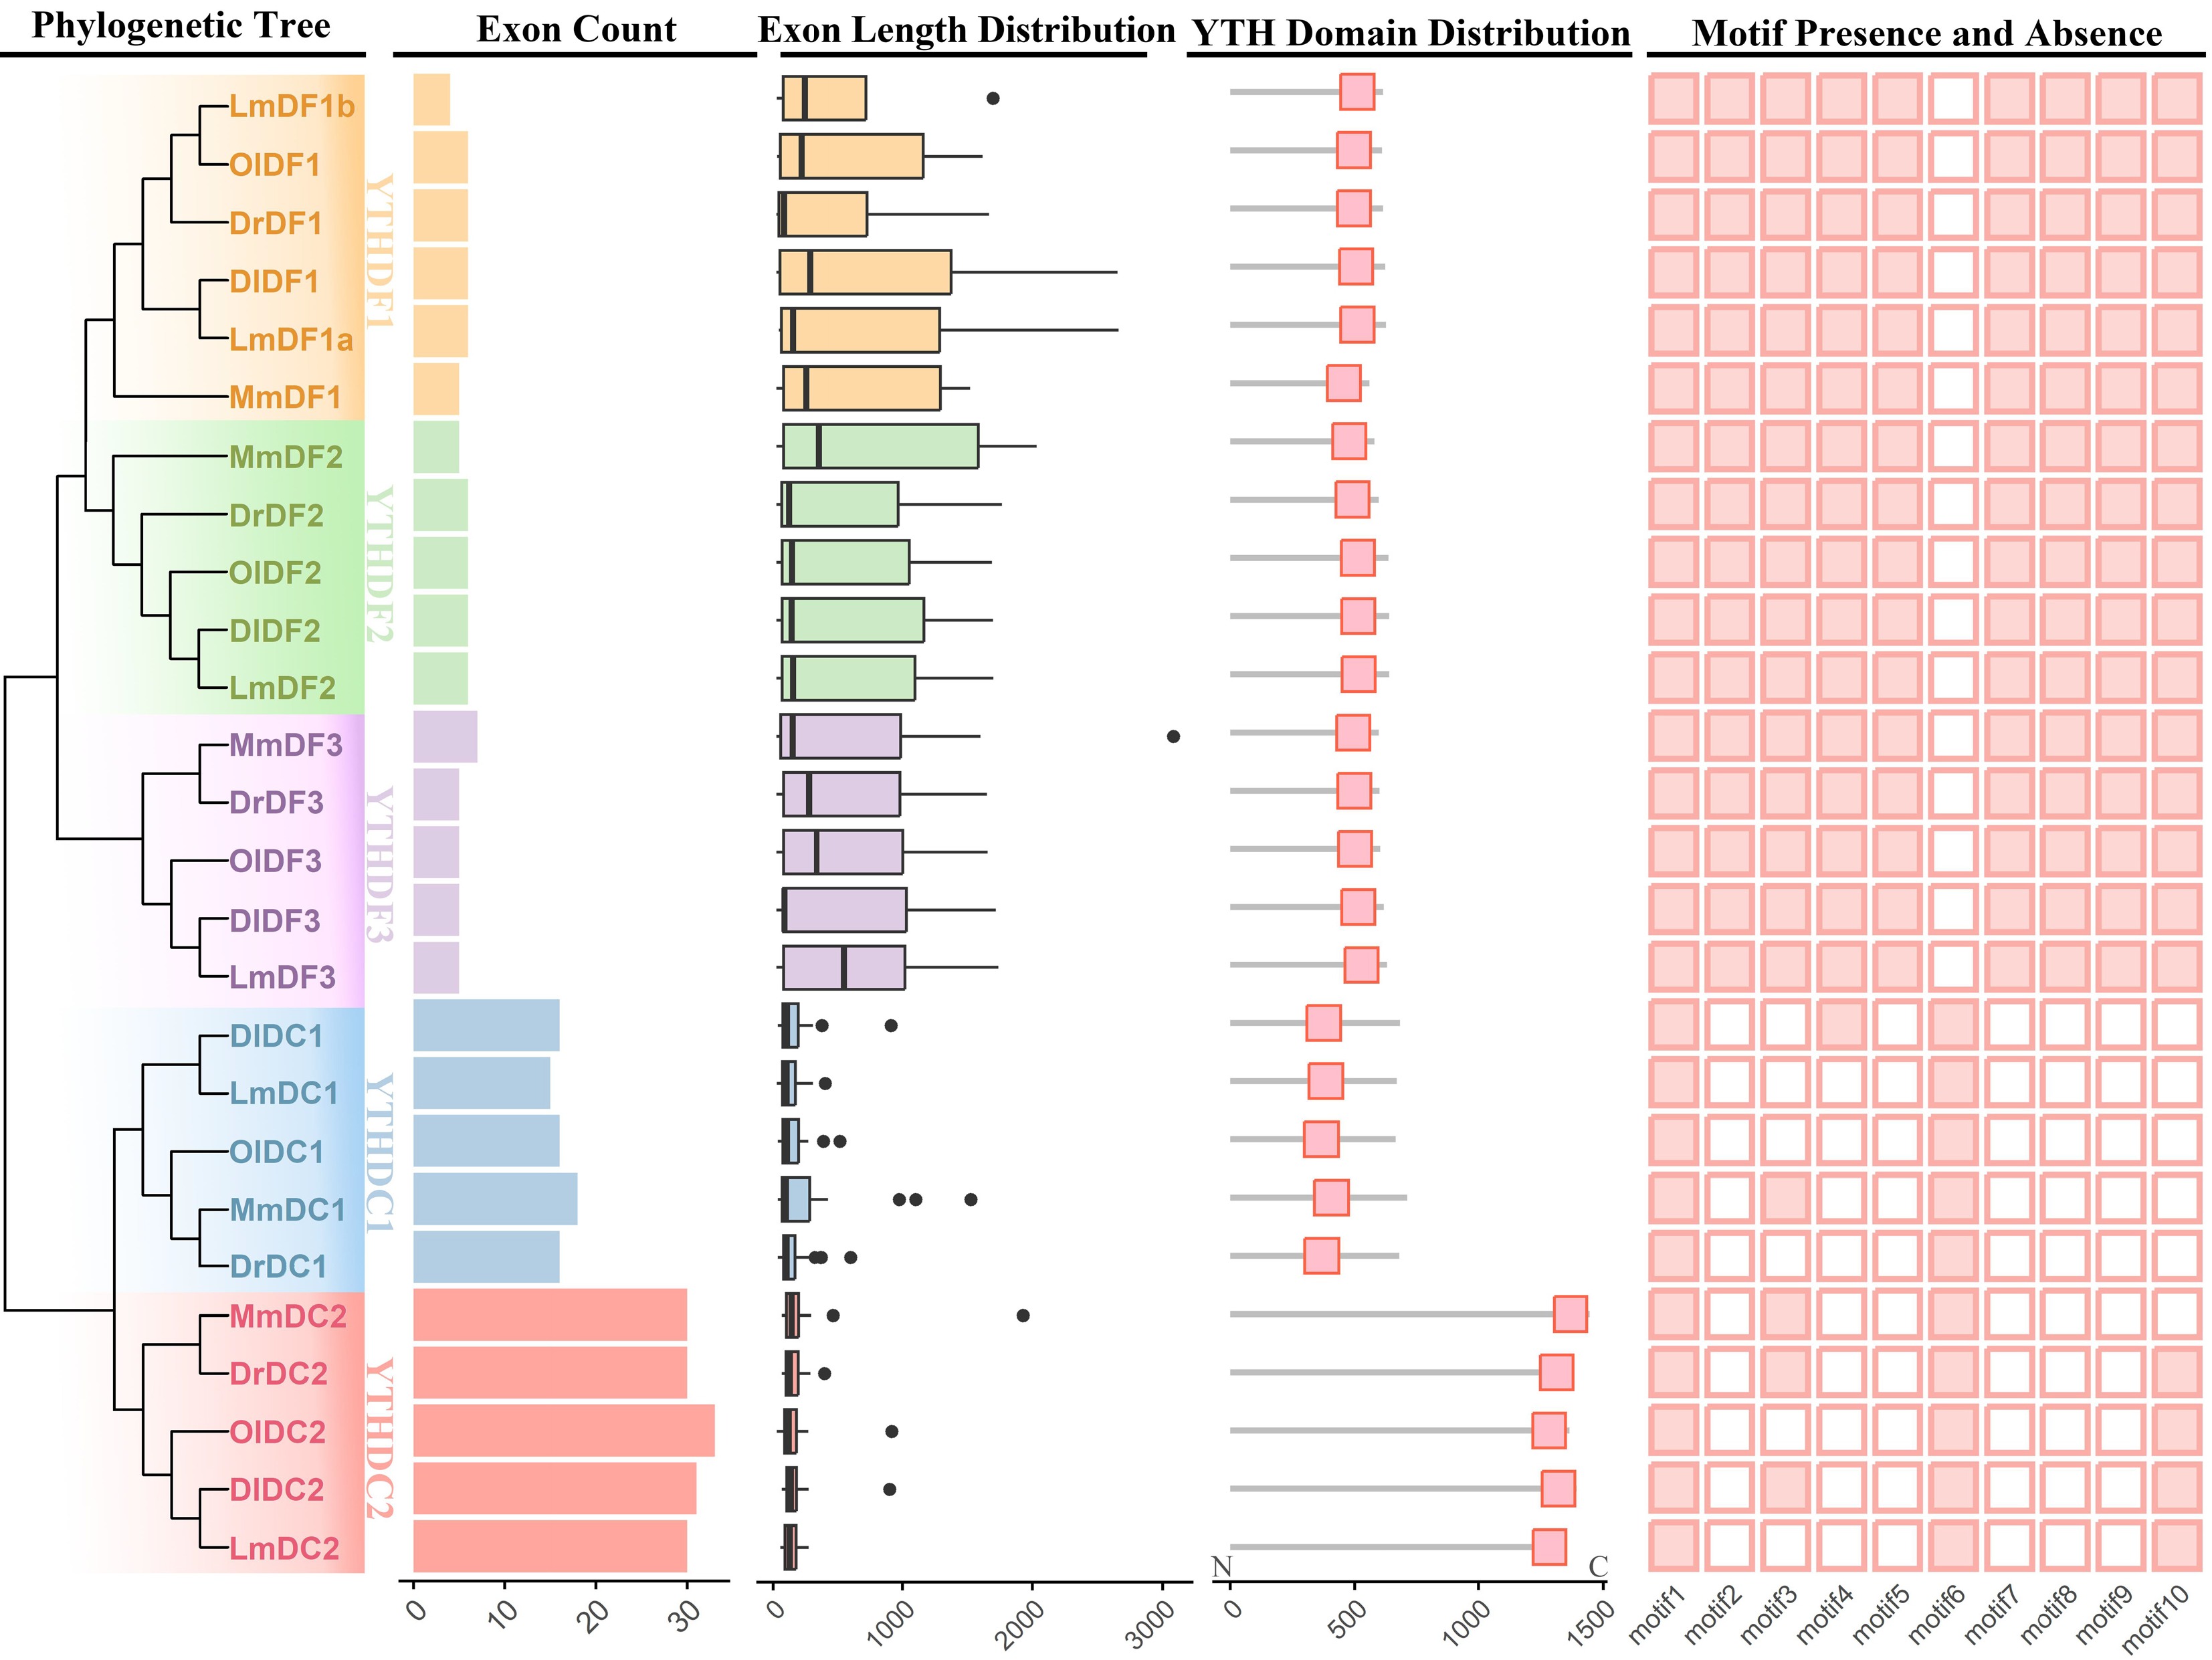
Figure 2.
Gene structure and conserved motif analysis of YTH domain-containing genes. Exon counts, exon lengths, the YTH domain's distribution, and conserved motifs were integrated in accordance with the phylogenetic tree that was constructed using the neighbour-joining method with 1,000 bootstrap replications. The five subclades, YTHDC1, YTHDC2, YTHDF1, YTHDF2, and YTHDF3, are distinguished by distinct colours. The presence and absence of different motifs are represented as solid and open boxes, respectively. The abbreviations used are as follows: YTH domain-containing genes in Mus musculus are denoted as Mm; Lateolabrax maculatus, Lm; Danio rerio, Dr; Oryzias latipes, Ol; Dicentrarchus labrax, Dl.
-
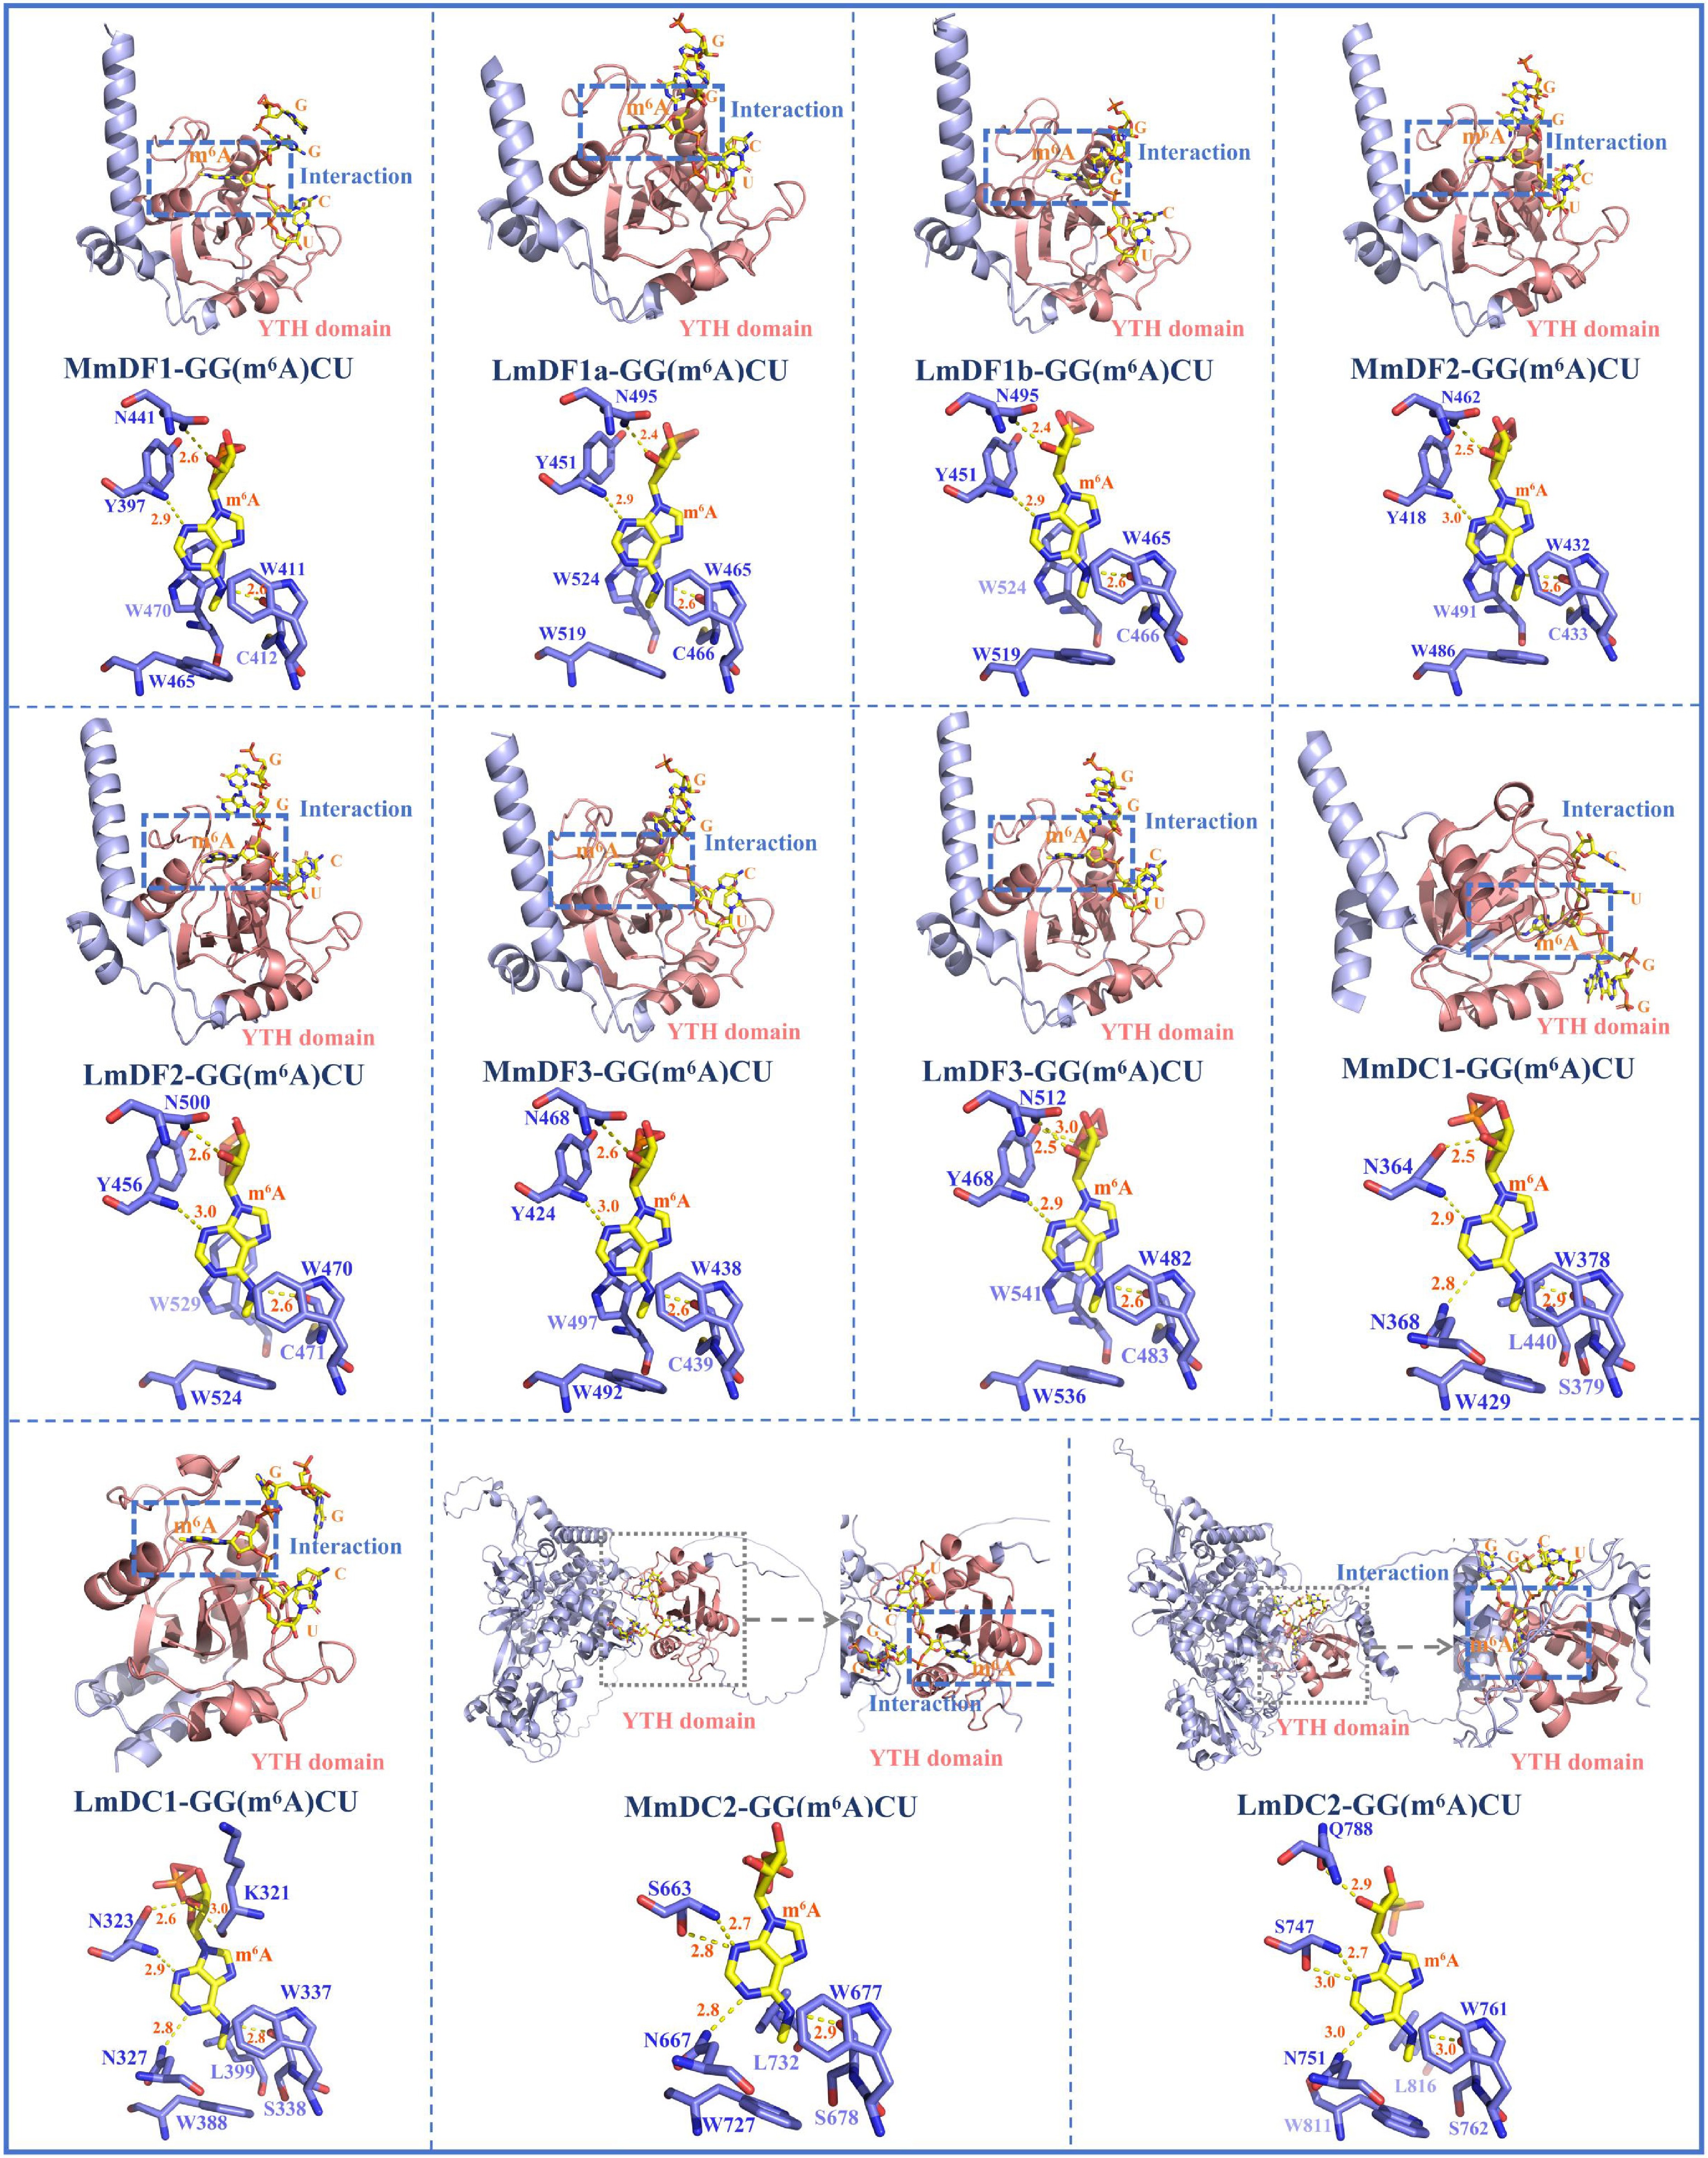
Figure 3.
Three-dimensional protein structure models of YTH domain-containing genes and their interactions with m6A-modified adenine. The structure of the YTH domain is depicted in shades of pink. The other secondary structural elements, including α-helices, β-strands, and coils, are marked with cyan colour. In the YTH-GC (m6A) CU complexes, the RNA molecules and m6A modifications are represented with yellow colour, and the amino acid residues of YTH domain-containing proteins are shown with blue colour. Hydrogen bonds between the binding pocket and the m6A modification are indicated using dashed yellow lines (2.2 Å ≤ cutoff ≤ 3.0 Å). Abbreviations: Mus musculus, Mm; Lateolabrax maculatus, Lm.
-
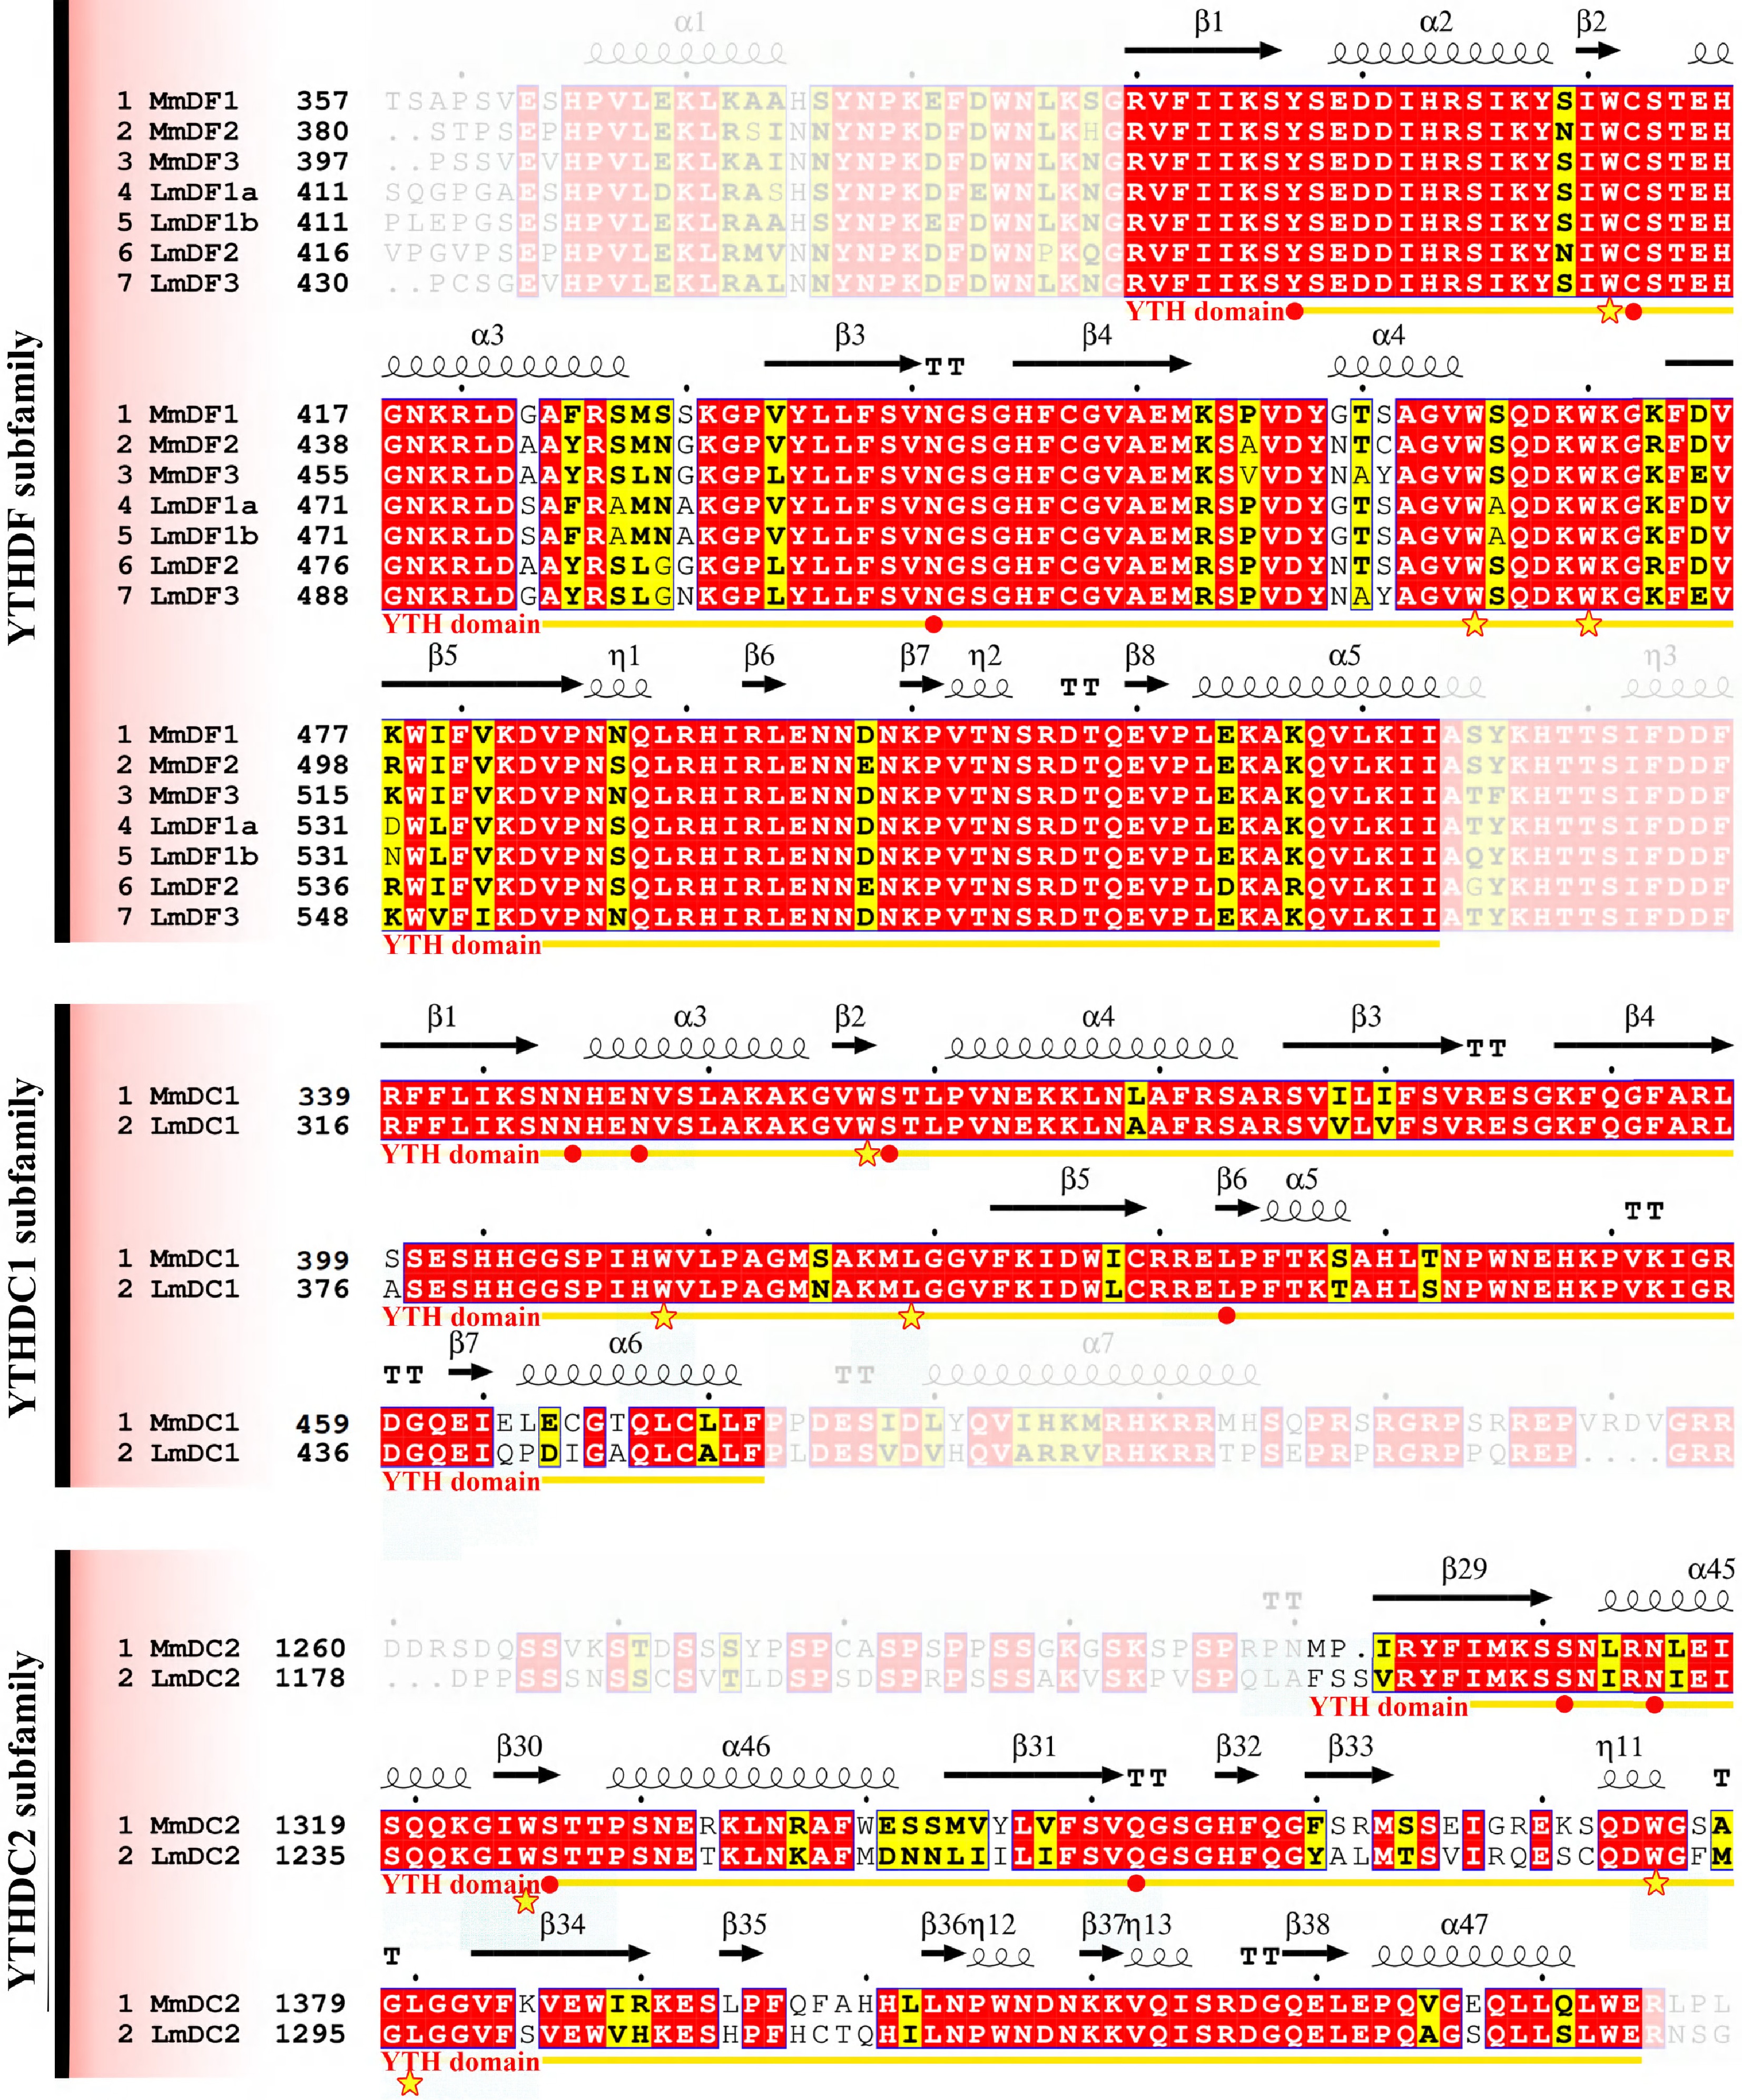
Figure 4.
Multiple sequence alignments of YTH domains in mouse and spotted sea bass. Gene names and the corresponding amino acid positions are presented on the left of the sequence alignments. YTH domain-containing genes in mouse and spotted sea bass are designated as Mm and Lm, respectively. Predicted secondary structural elements are displayed above the sequence alignment, with medium squiggles representing α-helices, arrows indicating β-strands, and the letters TT denoting strict β-turns. In the sequence alignment, strictly conserved amino acid residues with 100% identity are highlighted in red with white lettering, whereas highly similar sequences are enclosed in blue frames and marked with blocks. The YTH domain is denoted by yellow arrows below the alignment, the cage residues are denoted by stars, and red solid points represent amino acids with the ability to form hydrogen bonds (hydrogen bond residues).
-
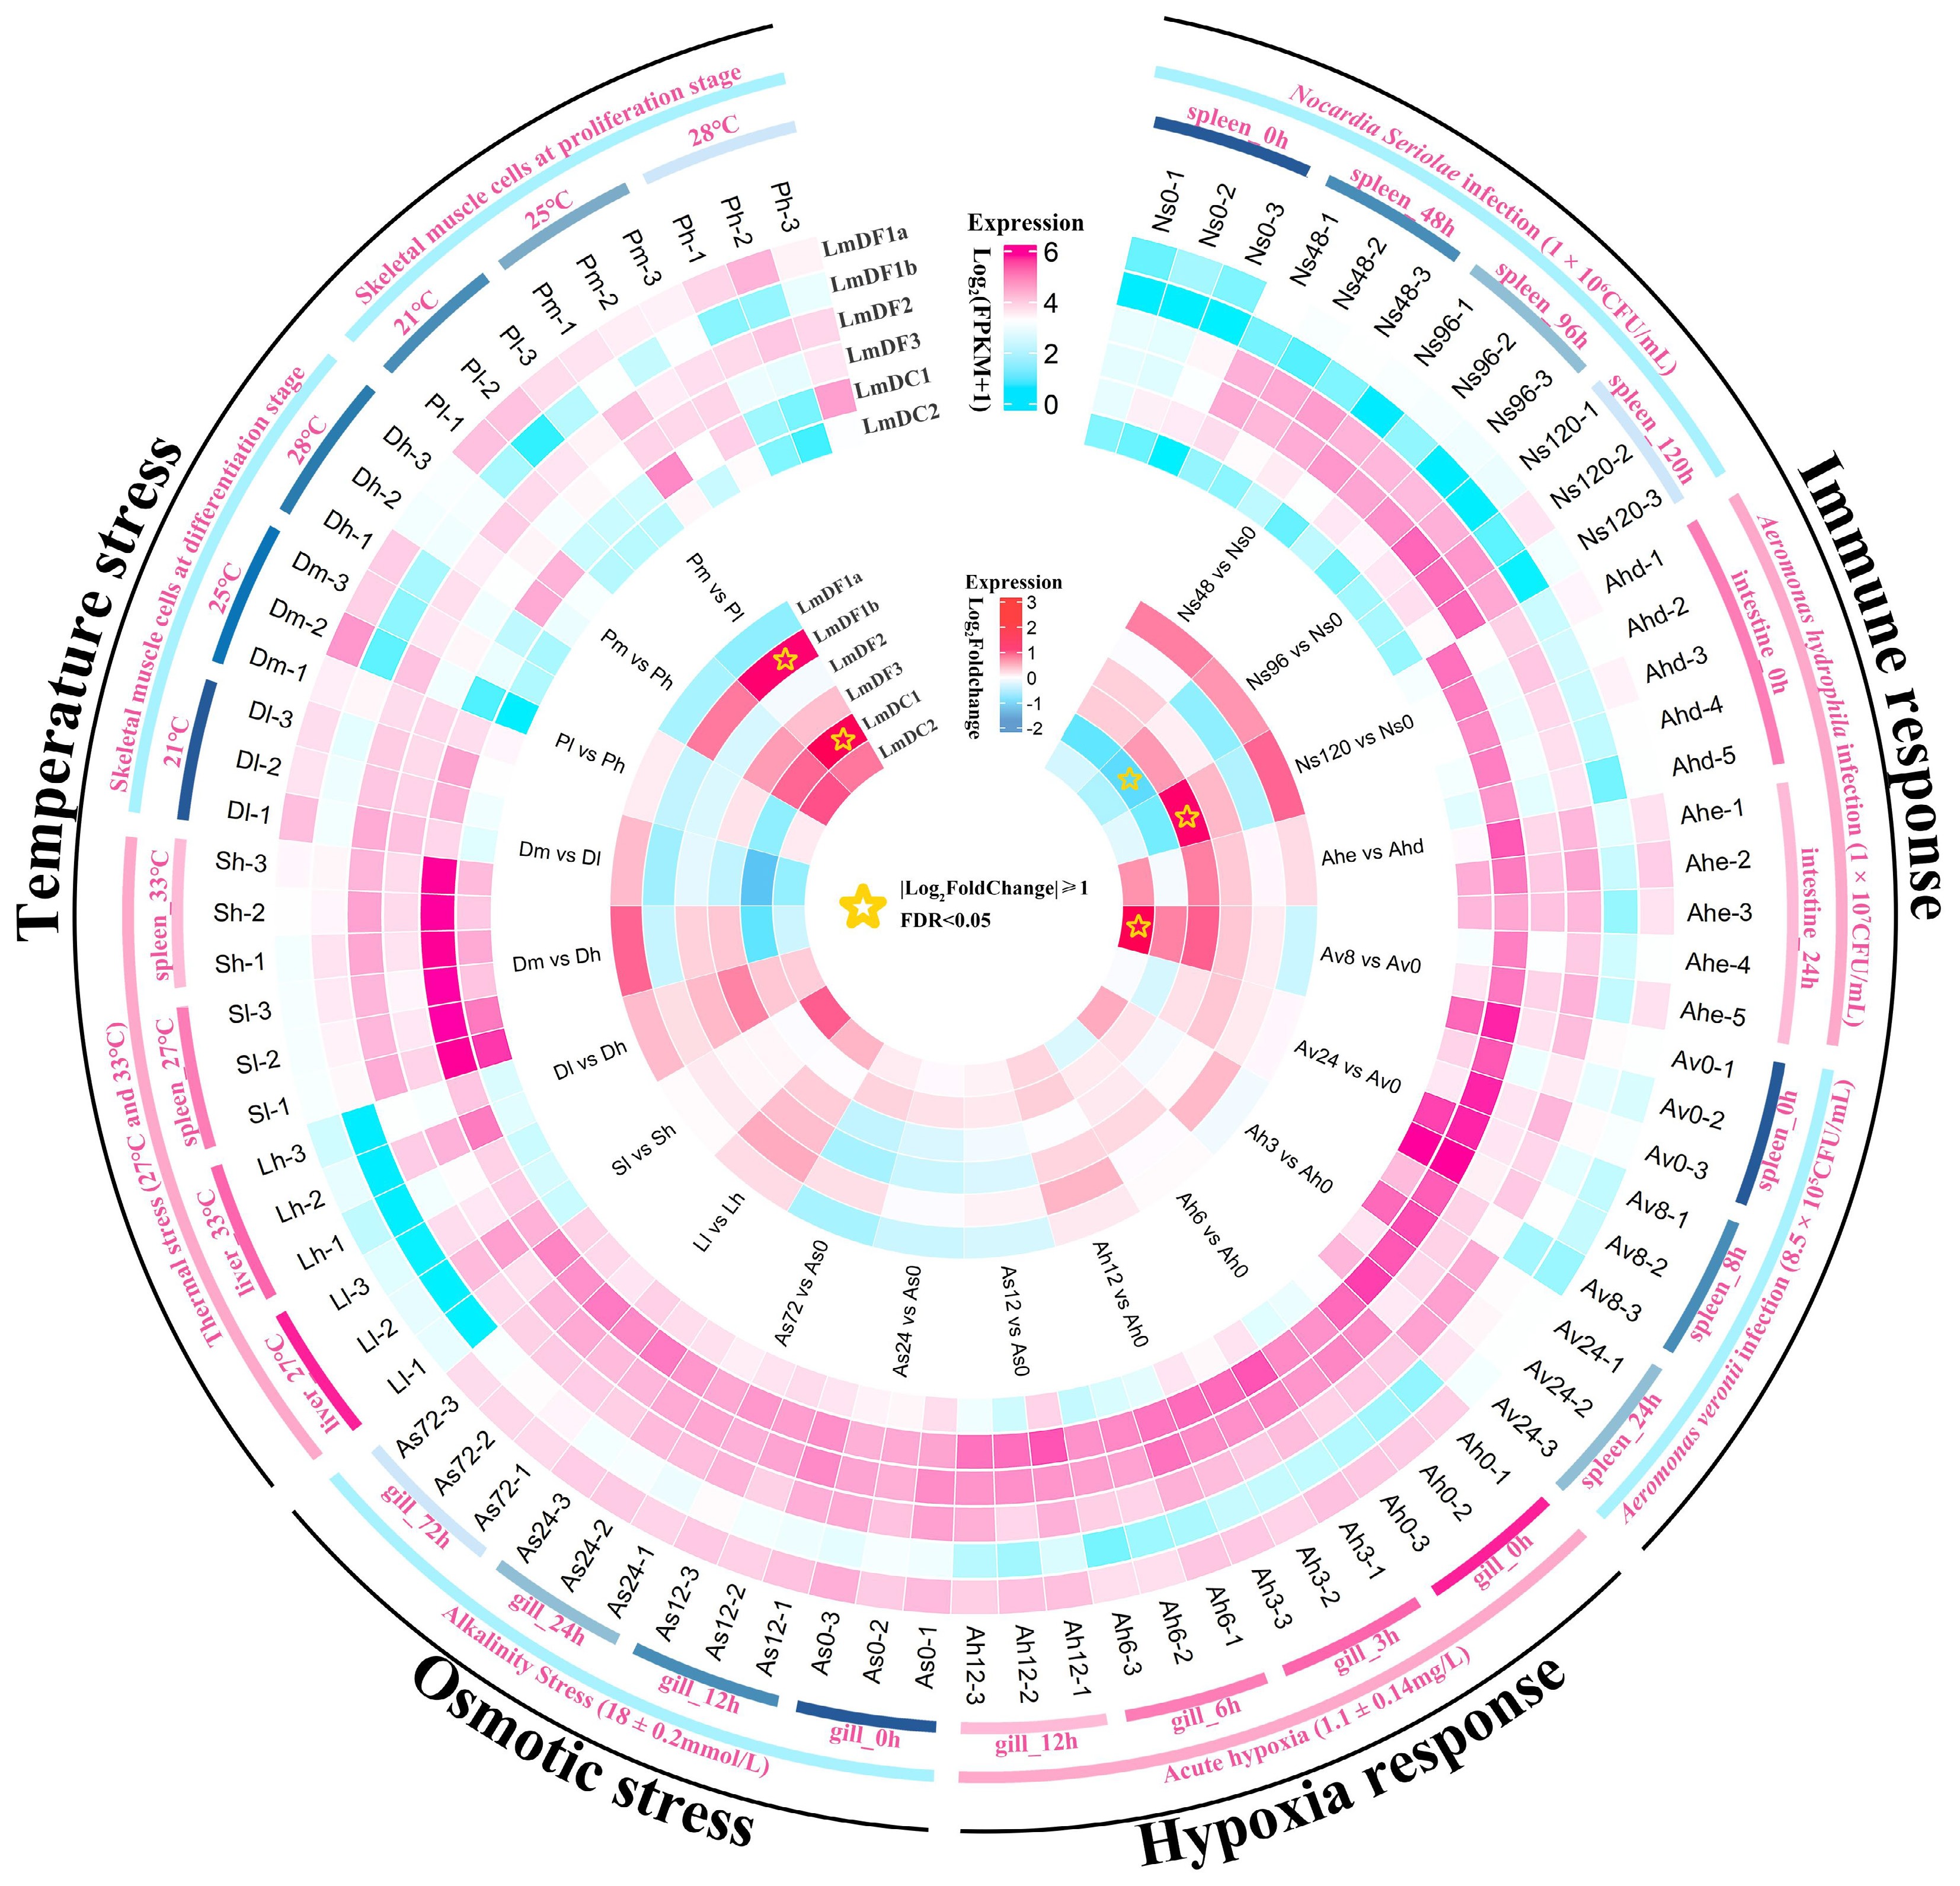
Figure 5.
Expression patterns of YTH domain-containing genes in spotted sea bass in response to biotic and abiotic stresses. The expression levels are normalized as the FPKM values and shown as log10(FPKM + 1), which are displayed in the outer heatmap. The significance of differential gene expression was determined using the DESeq2 v1.44.0 R package based on the criteria of | log2(Fold Change) | ≥ 1 and FDR < 0.05. The differentially expressed genes are marked using stars in the inner heatmap.
-
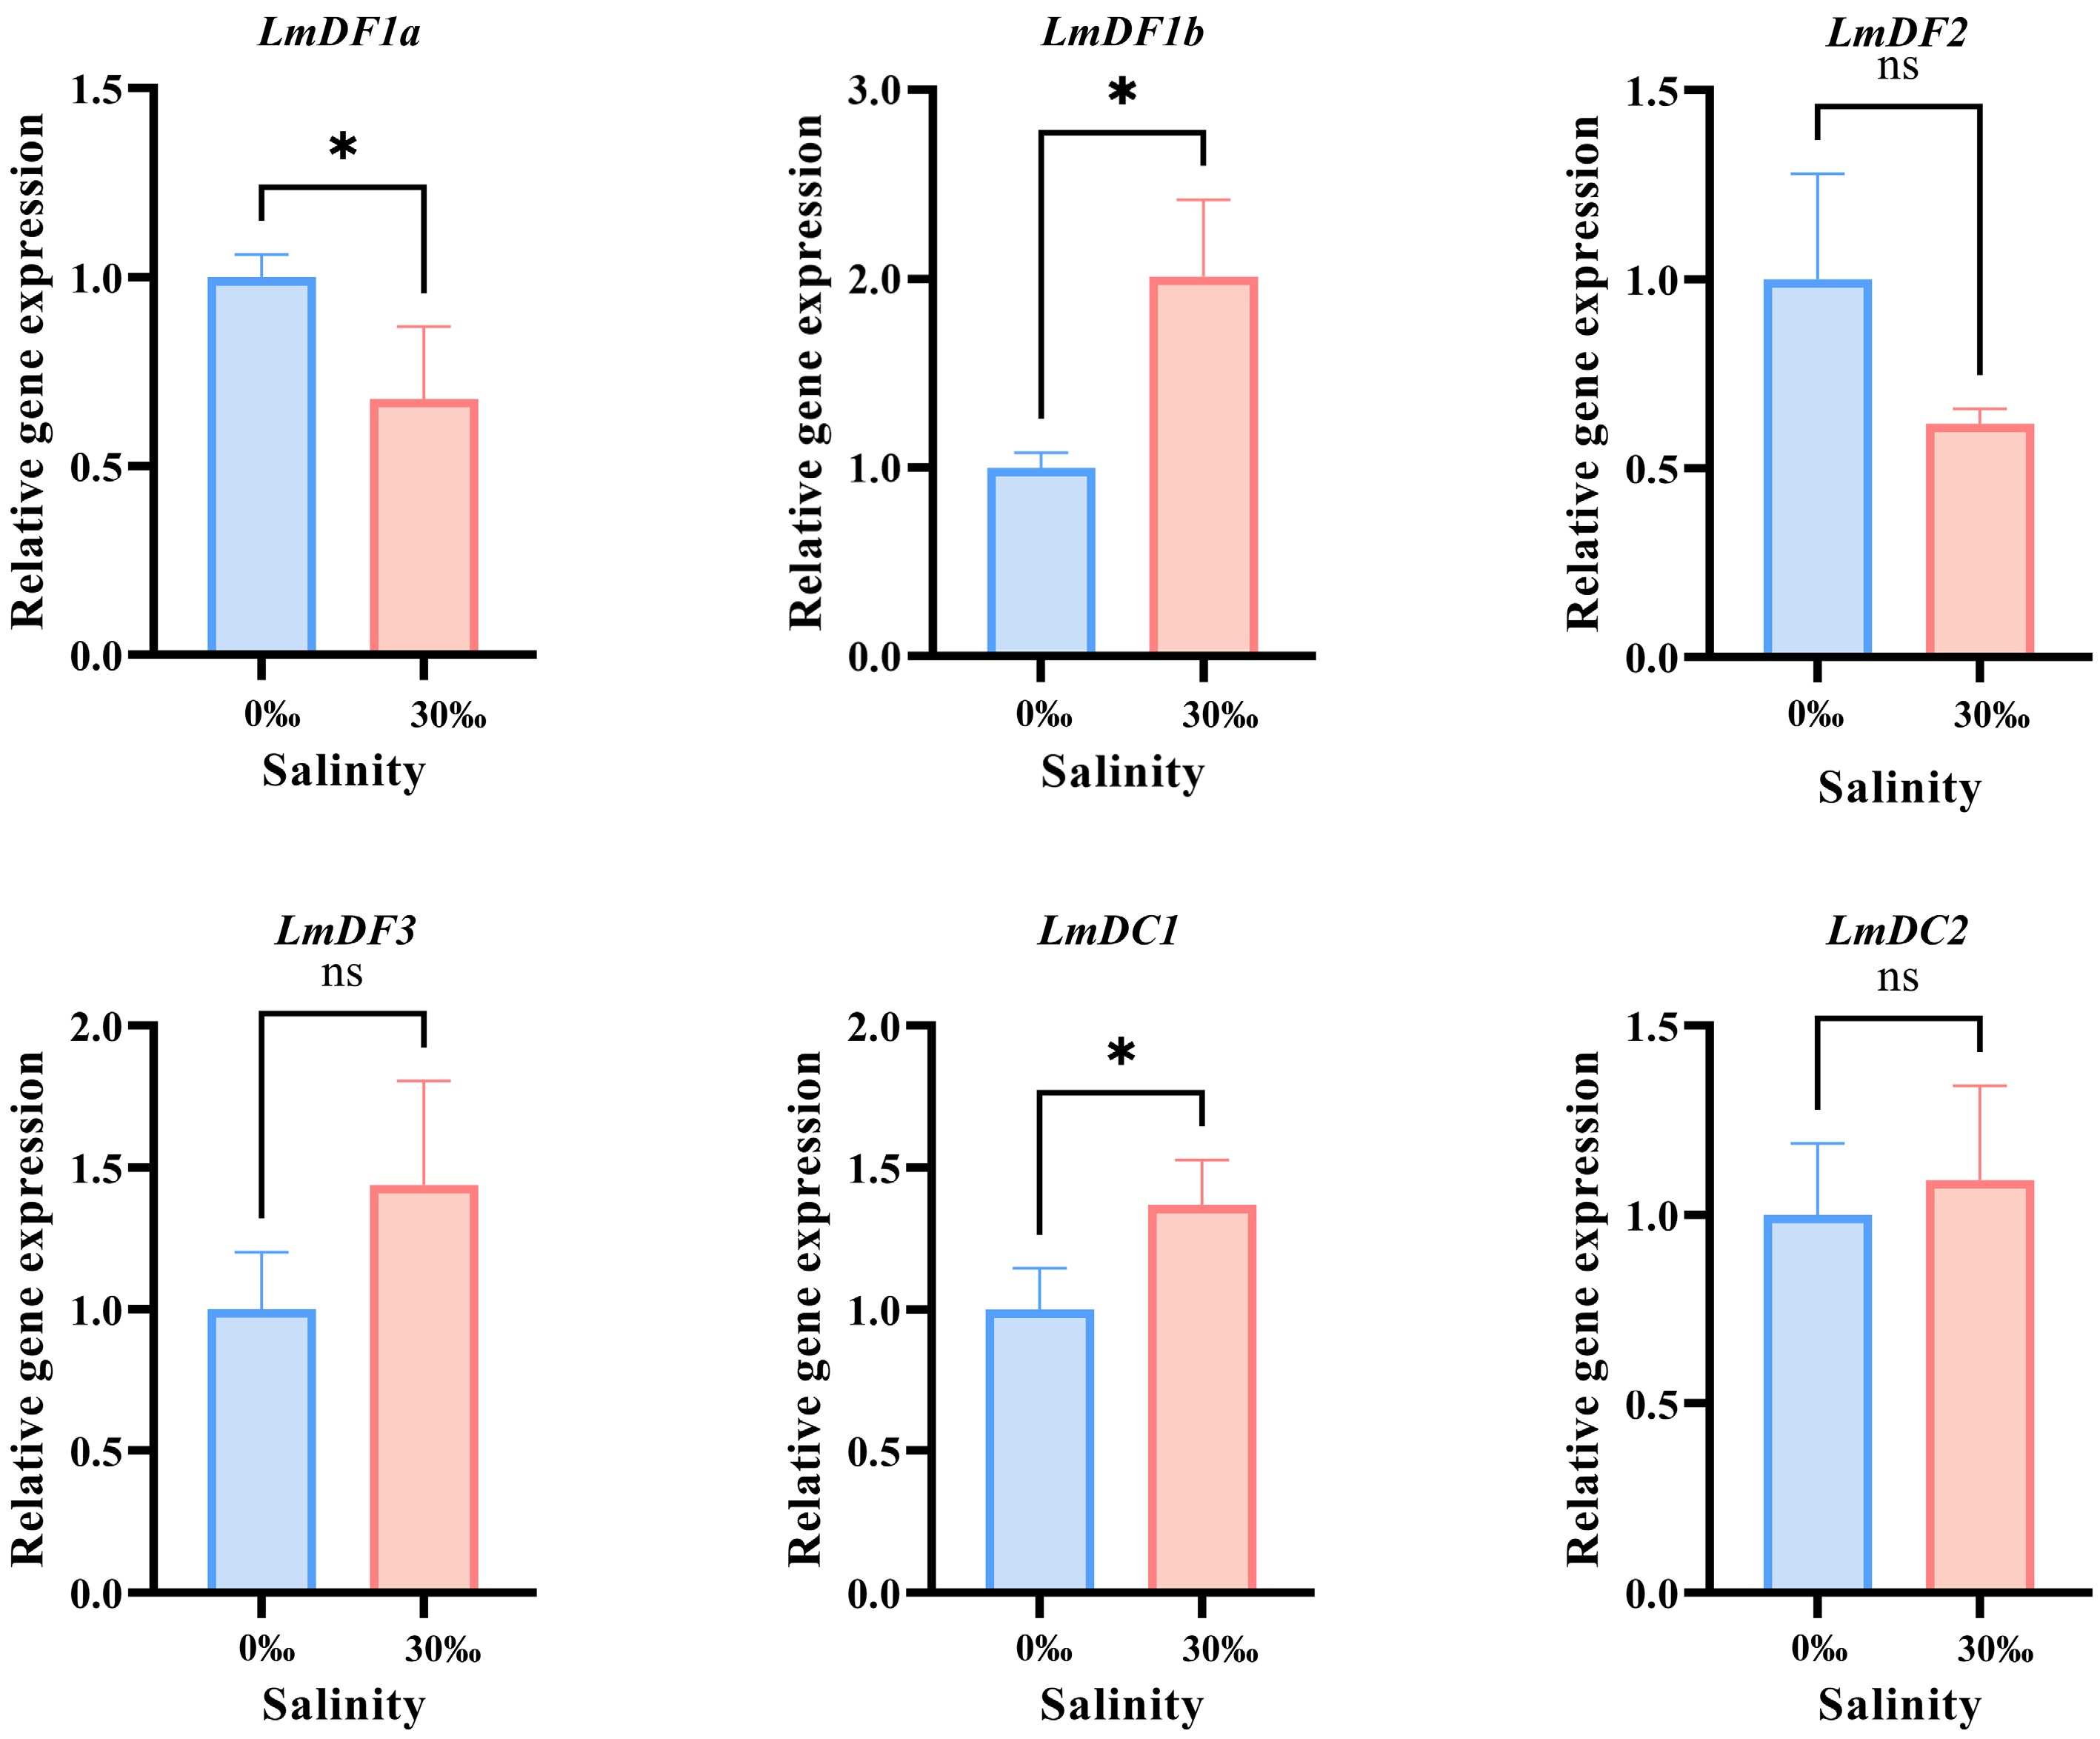
Figure 6.
RT-qPCR verification and statistical analysis. All the RT-qPCR experiments were performed with three biologically independent replicates. The relative expression levels were calculated using the 2−ΔΔCᴛ method and normalized against 18S rRNA. Results are presented as the mean ± standard deviation (SD). Asterisks indicate the statistically significant differences (* p < 0.05), while 'ns' indicates no significant difference.
-
Gene name Gene_ID Chromosome position Gene length (bp) Exon number CDS (amino acids) Molecular weight (kDa) Theoretical
pIPutative localization LmDF1a evm.TU.scaffold_235.11 Chr6 (+): 10,274,451–10,282,610 8,160 6 625 68,102.75 8.81 Cytoplasm LmDF1b evm.TU.scaffold_11.218 Chr6 (–): 5,887,283–5,890,556 3,274 4 614 66,271.48 7.85 Cytoplasm, nucleus, extracellular matrix LmDF2 evm.TU.scaffold_8.5 Chr22 (+): 10,207,118–10,215,610 8,493 6 639 68,286.14 8.86 Cytoplasm LmDF3 evm.TU.scaffold_7.115 Chr4 (–): 11,565,042–11,572,492 7,451 5 629 69,371.54 9.03 Cytoplasm LmDC1 evm.TU.scaffold_318.9 Chr16 (+): 119,607–131,643 12,037 15 669 76,962.88 6.49 Nucleus LmDC2 evm.TU.scaffold_71.73 Chr16 (+): 20,863,917–20,882,156 18,240 30 1,356 152,046.47 7.87 Cell membrane, nucleus Table 1.
Characteristics of YTH domain-containing genes in Lateolabrax maculatus.
Figures
(6)
Tables
(1)