-
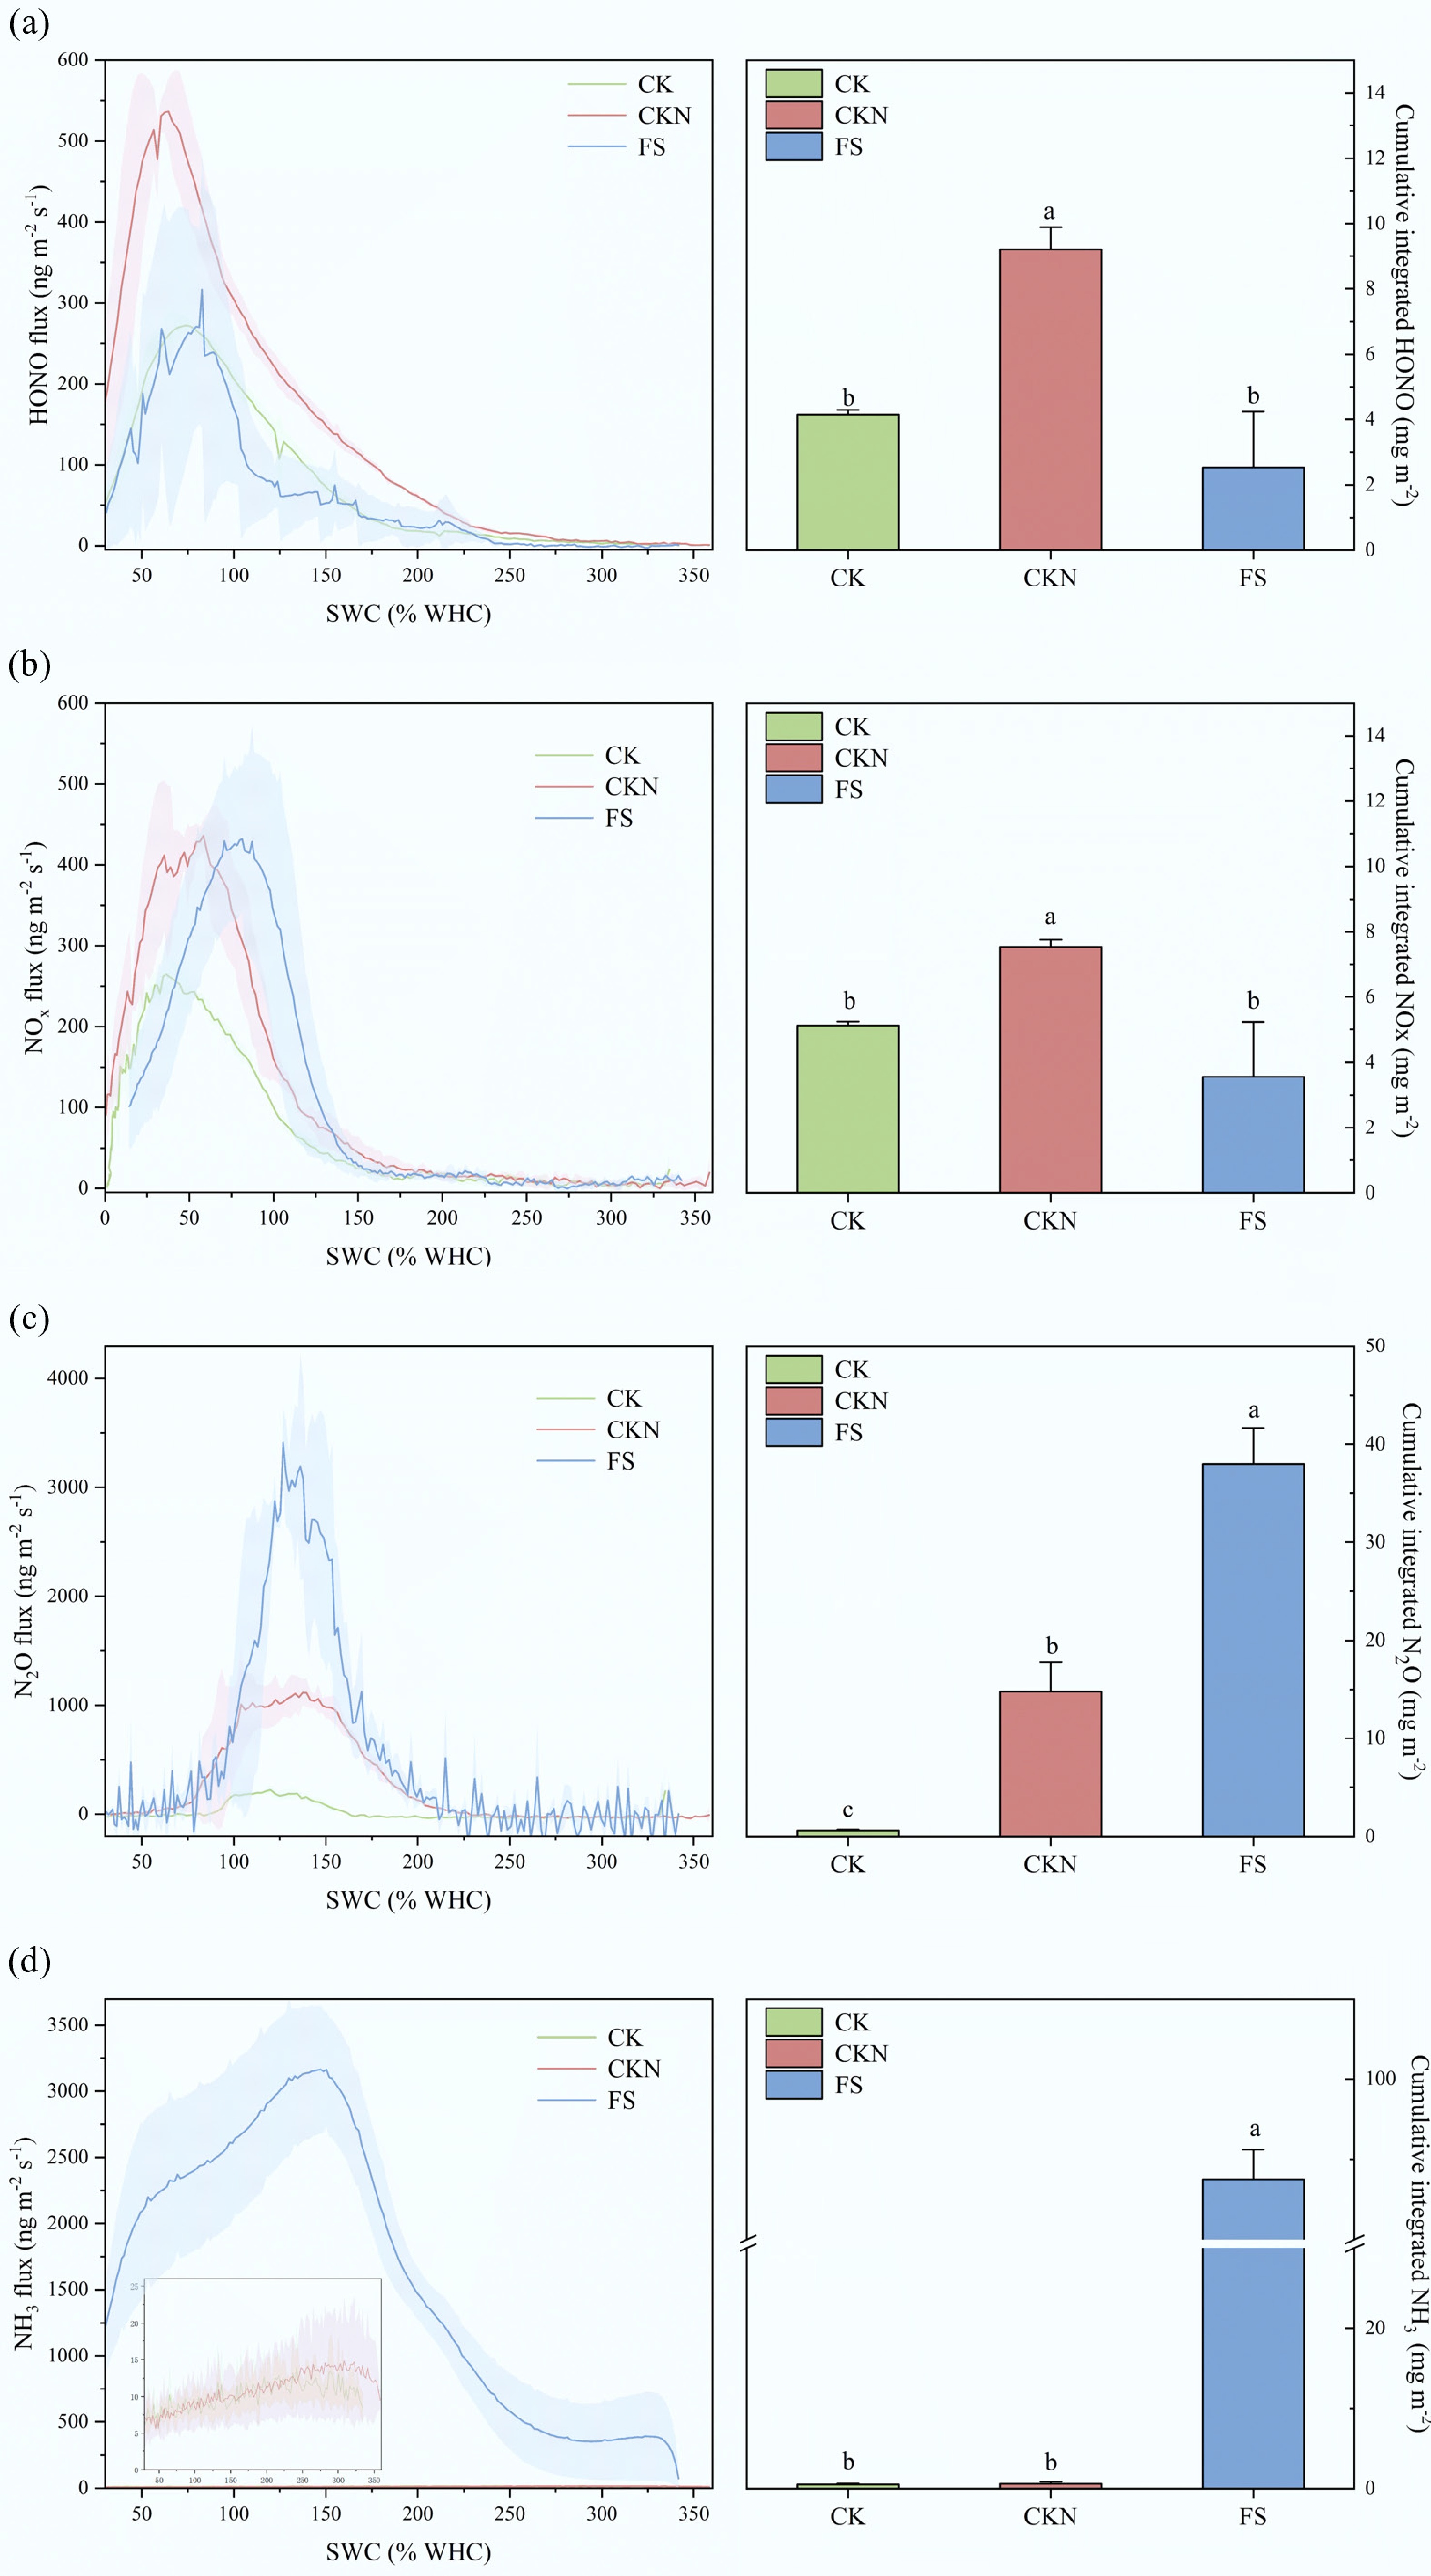
Figure 1.
Soil Nr fluxes change as a function of soil water content (% WHC). Soil (a) HONO, (b) NOx, (c) N2O, and (d) NH3 emissions from CK (green lines and bars), CKN (red lines and bars), and FS (blue lines and bars), respectively. The lines indicate the average results during incubation, and the shadow areas represent the standard deviations (n = 3). The right part of (a)–(d) shows the cumulative integrated Nr gas emissions from CK, CKN, and FS, respectively. Error bars represent standard errors of the means (n = 3). CK: control group; CKN: nitrogen-fertilized control; FS: nitrogen-fertilized treatments with duckweed addition. Different lowercase letters indicate significant differences according to the LSD test for one-way ANOVA at p < 0.05 (n = 3).
-

Figure 2.
Dynamic of physical and chemical properties of the soil, including (a) pH, (b) EC, (c) TN, (d) NH4+, (e) NO2−, (f) NO3−, (g) MBN, and (h) MBC at the emission peaks of NOy, N2O, and NH3, respectively, and at the end of the measurement. Different letters denote significant differences between treatments (p < 0.05).
-
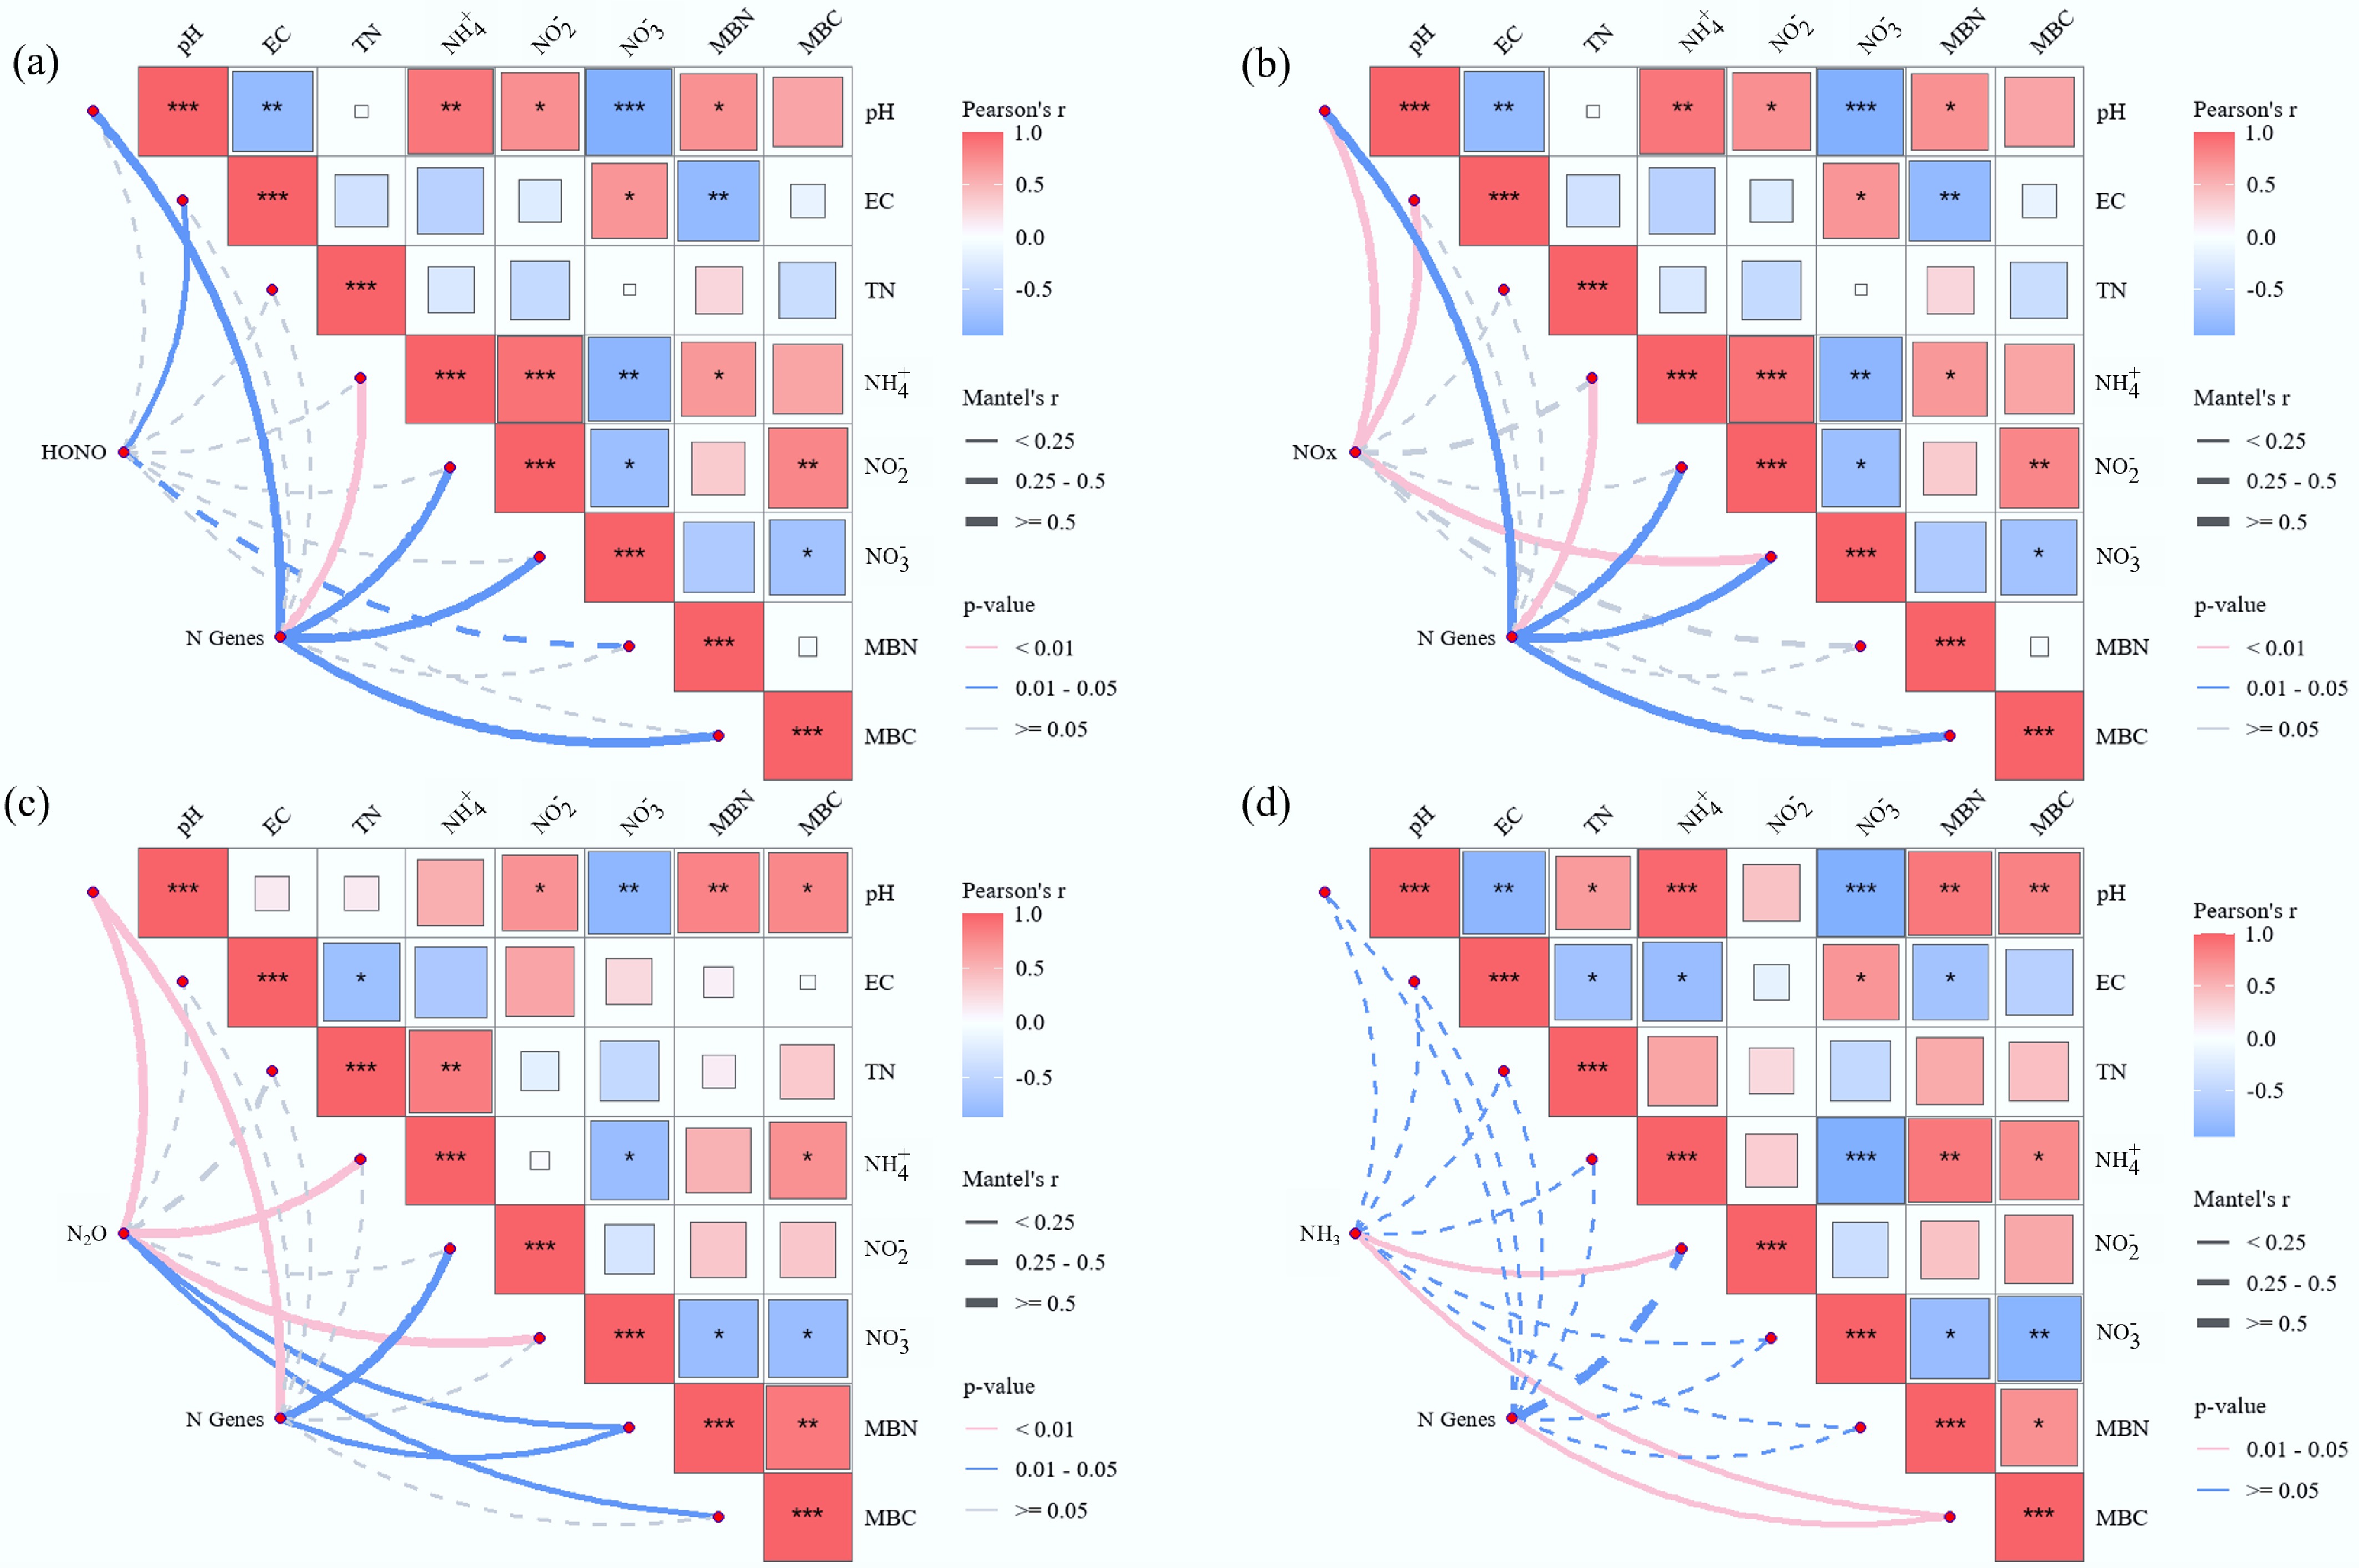
Figure 3.
Pearson's correlation analysis of soil environmental drivers on Nr gas emissions, (a) HONO, (b) NOx, (c) N2O, and (d) NH3. Pairwise comparisons of environmental factors are shown in squareness, with a color gradient denoting Pearson's correlation coefficient. Microbial functional genes and Nr gas emissions were related to each soil environmental factor by partial Mantel tests. Line thickness corresponds to correlation strength; color scale indicates coefficient value (blue = negative, red = positive). The asterisks indicate the statistical significance (* p < 0.05; ** p < 0.01; *** p < 0.001).
-
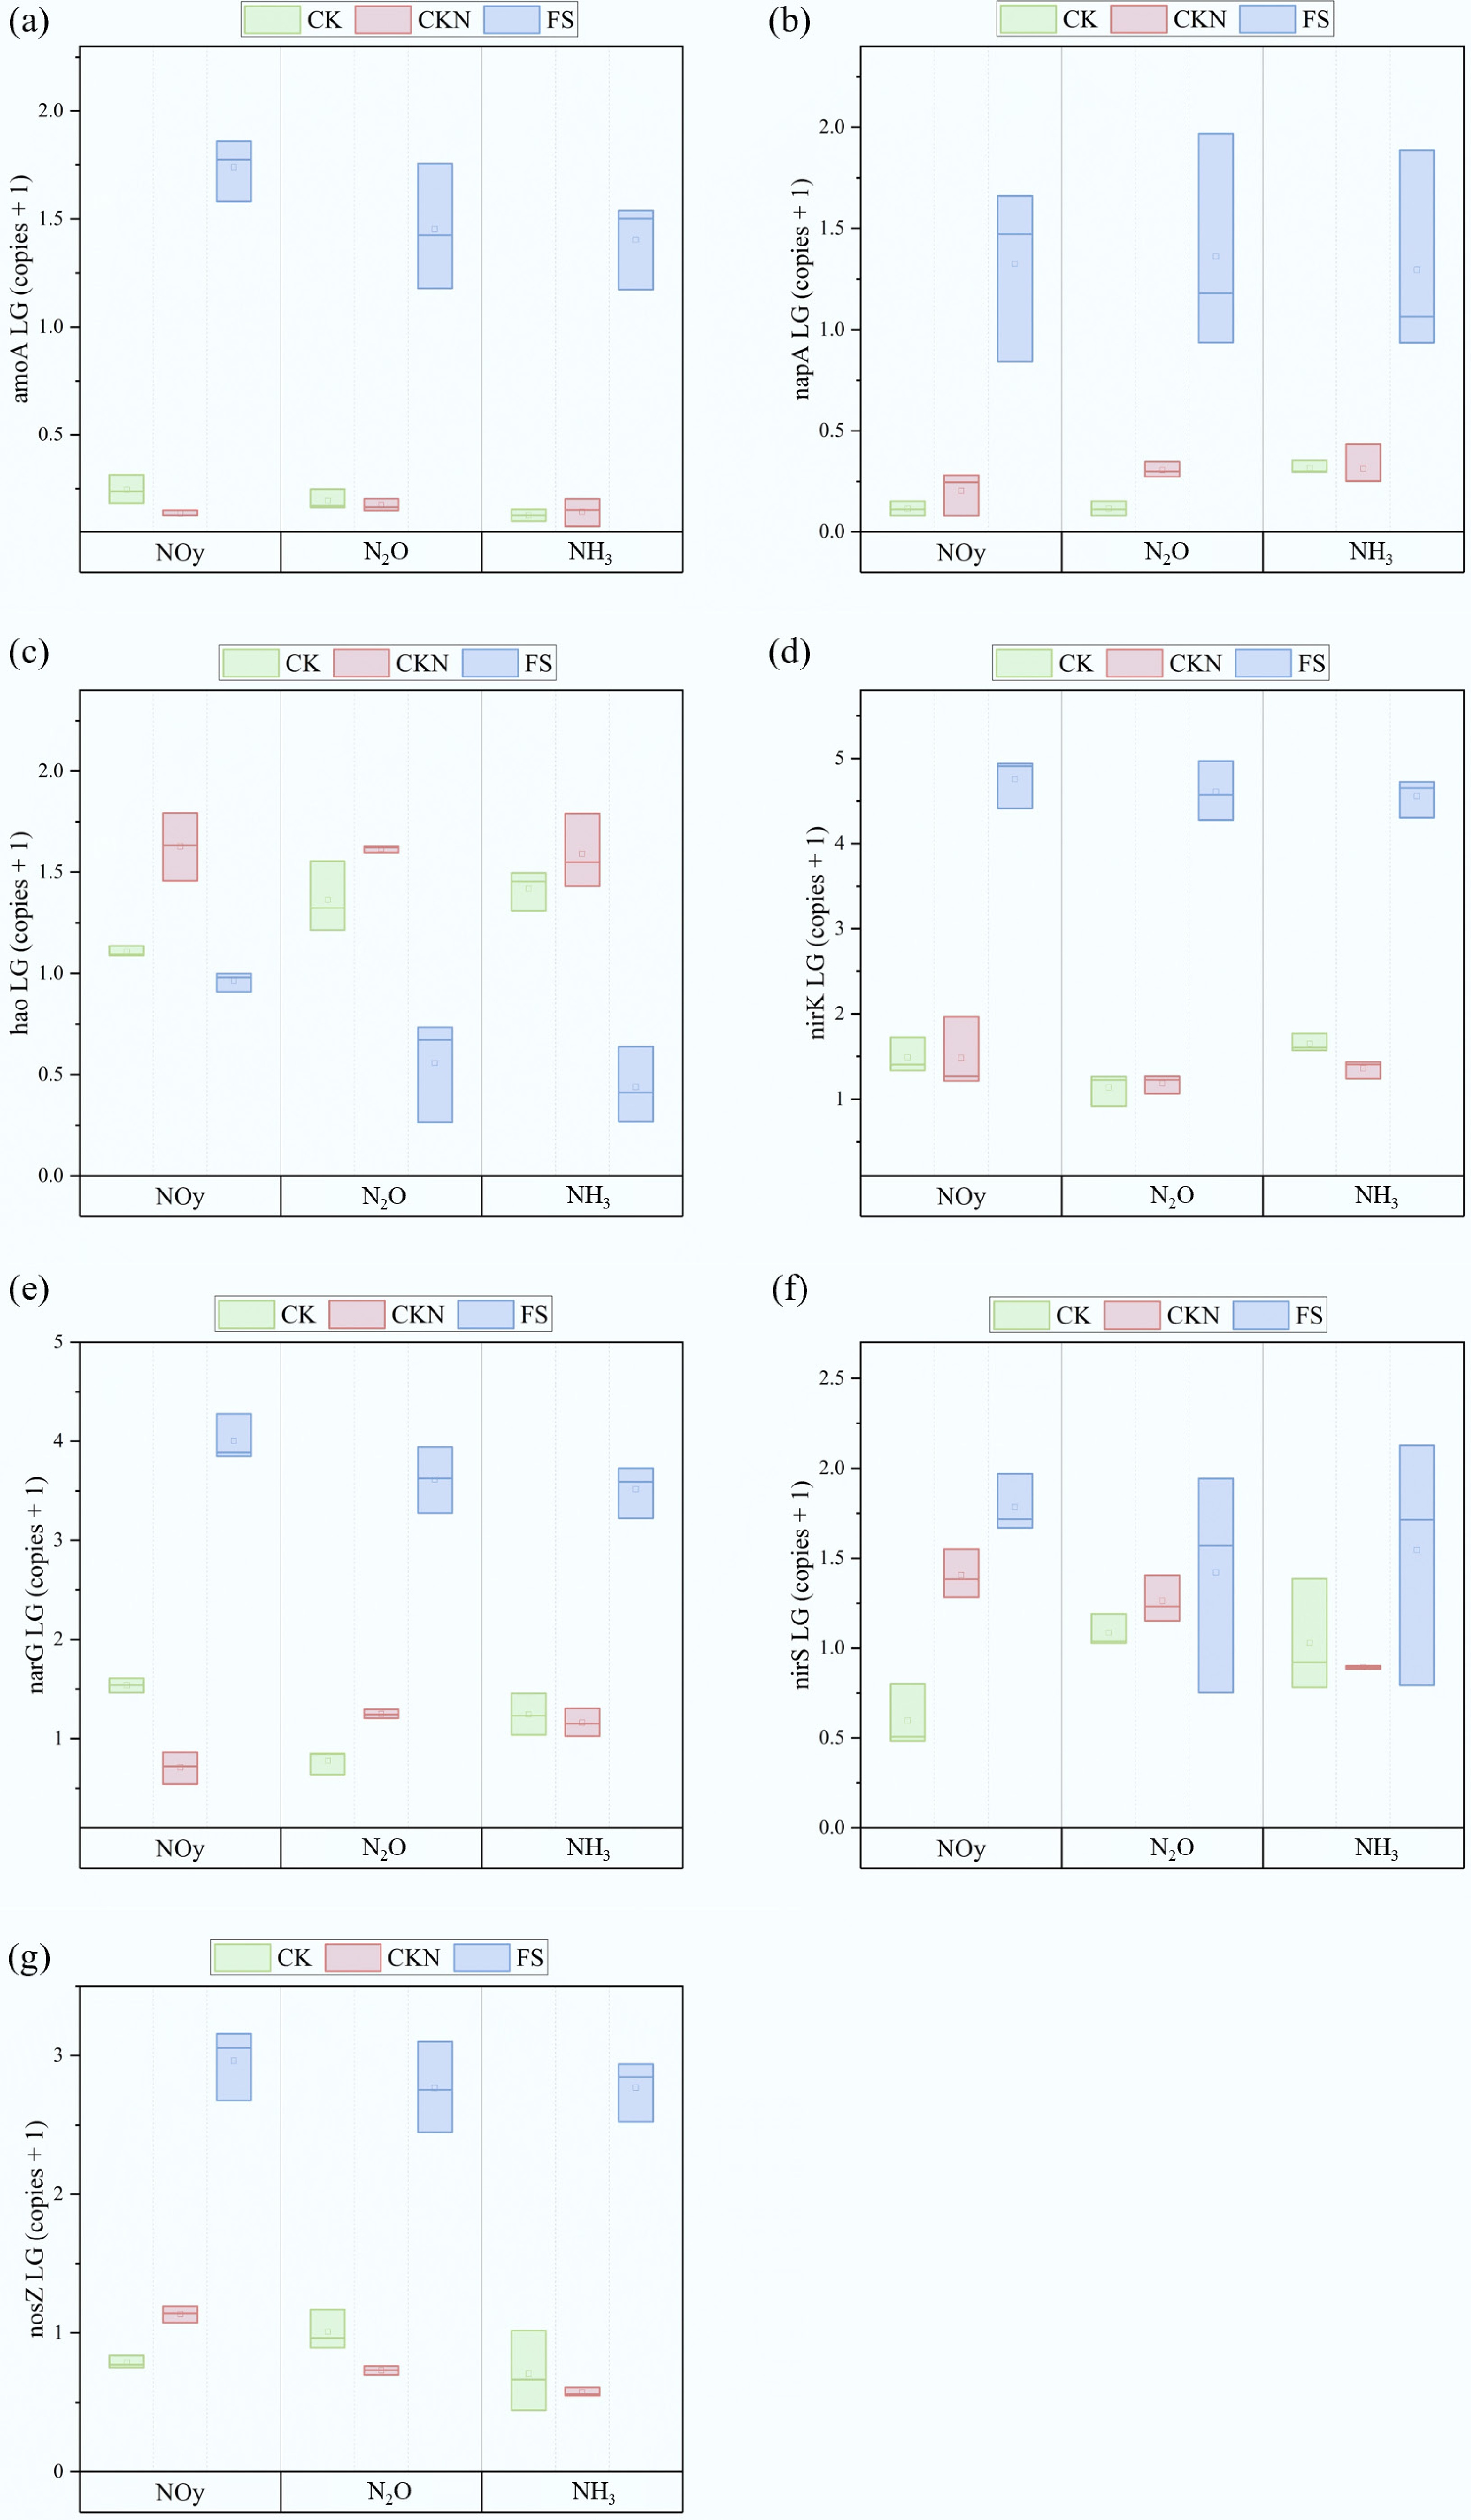
Figure 4.
The copy numbers of functional genes, including (a) amoA, (b) napA, (c) hao, (d) nirK, (e) narG, (f) nirS, and (g) nosZ at the peak of Nr fluxes in CK, CKN, and FS groups.
-
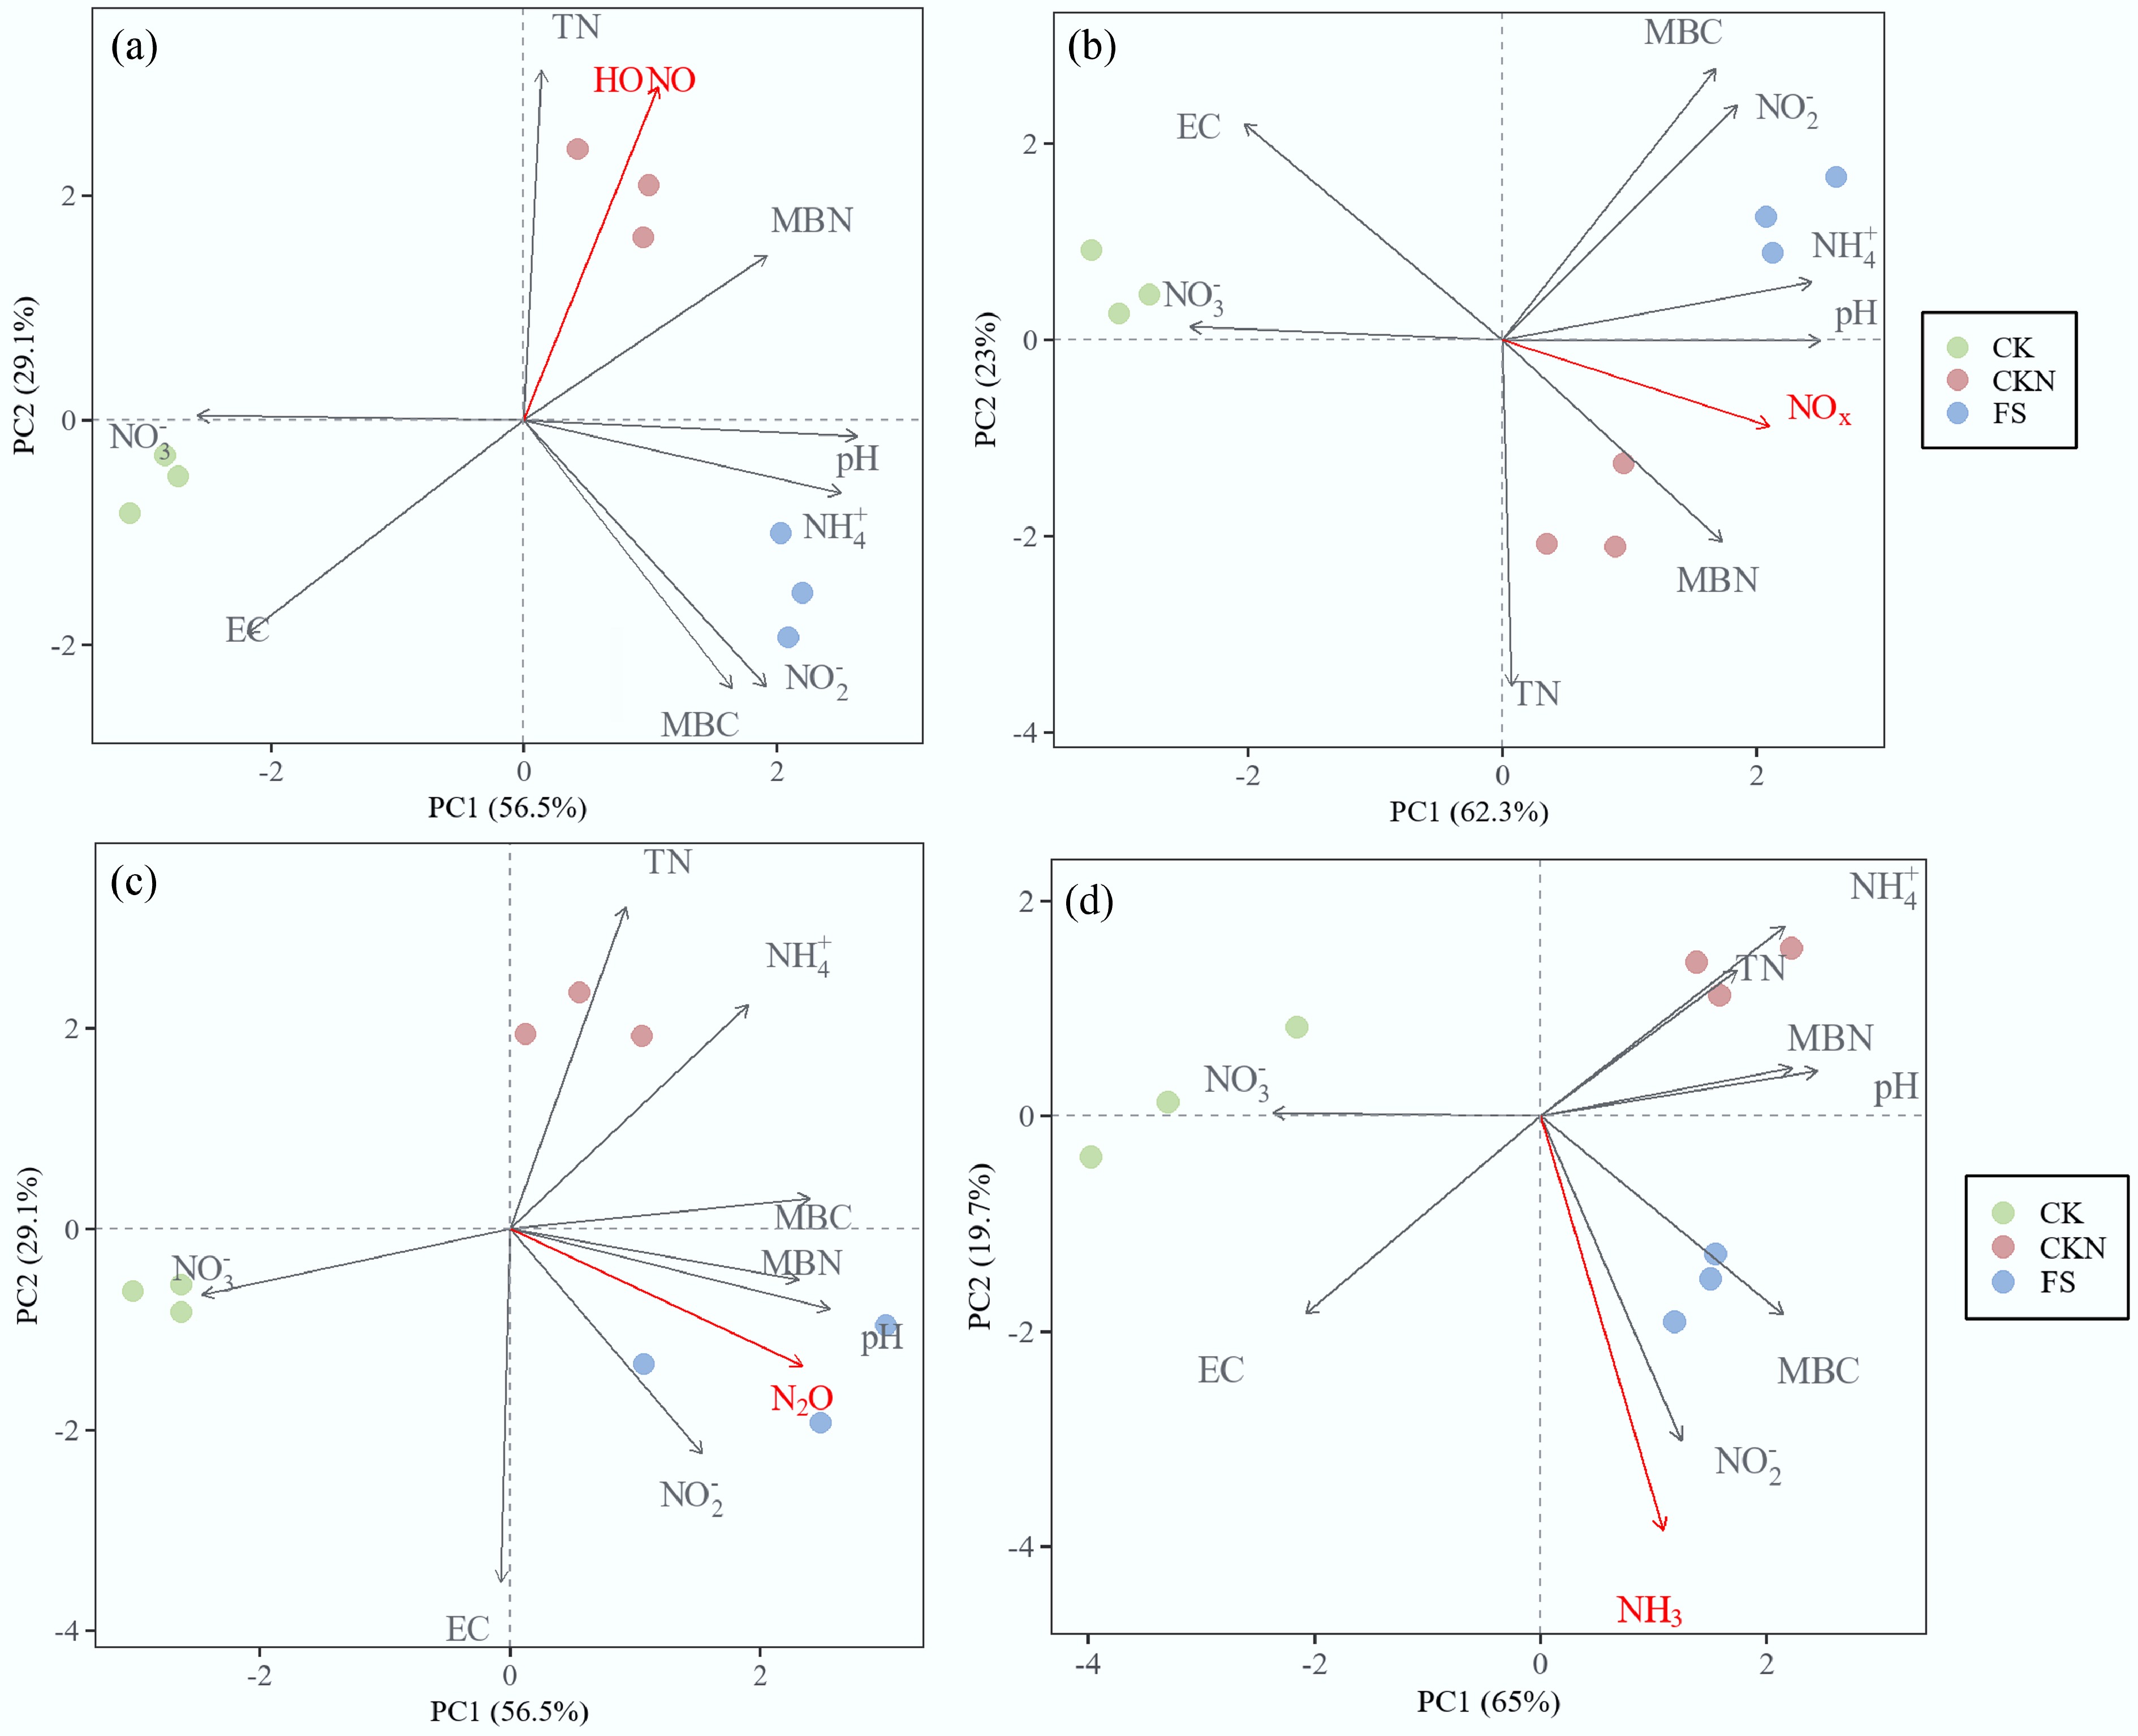
Figure 5.
Principal component analysis (PCA) of the maximum flux of different treatments (CK, CKN, and FS) and their relationships with soil physiochemical properties at the emission peaks of: (a) HONO, (b) NOx, (c) N2O, and (d) NH3. Vector represent explanatory variables; treatment centroids show group positions in multivariate space.
-
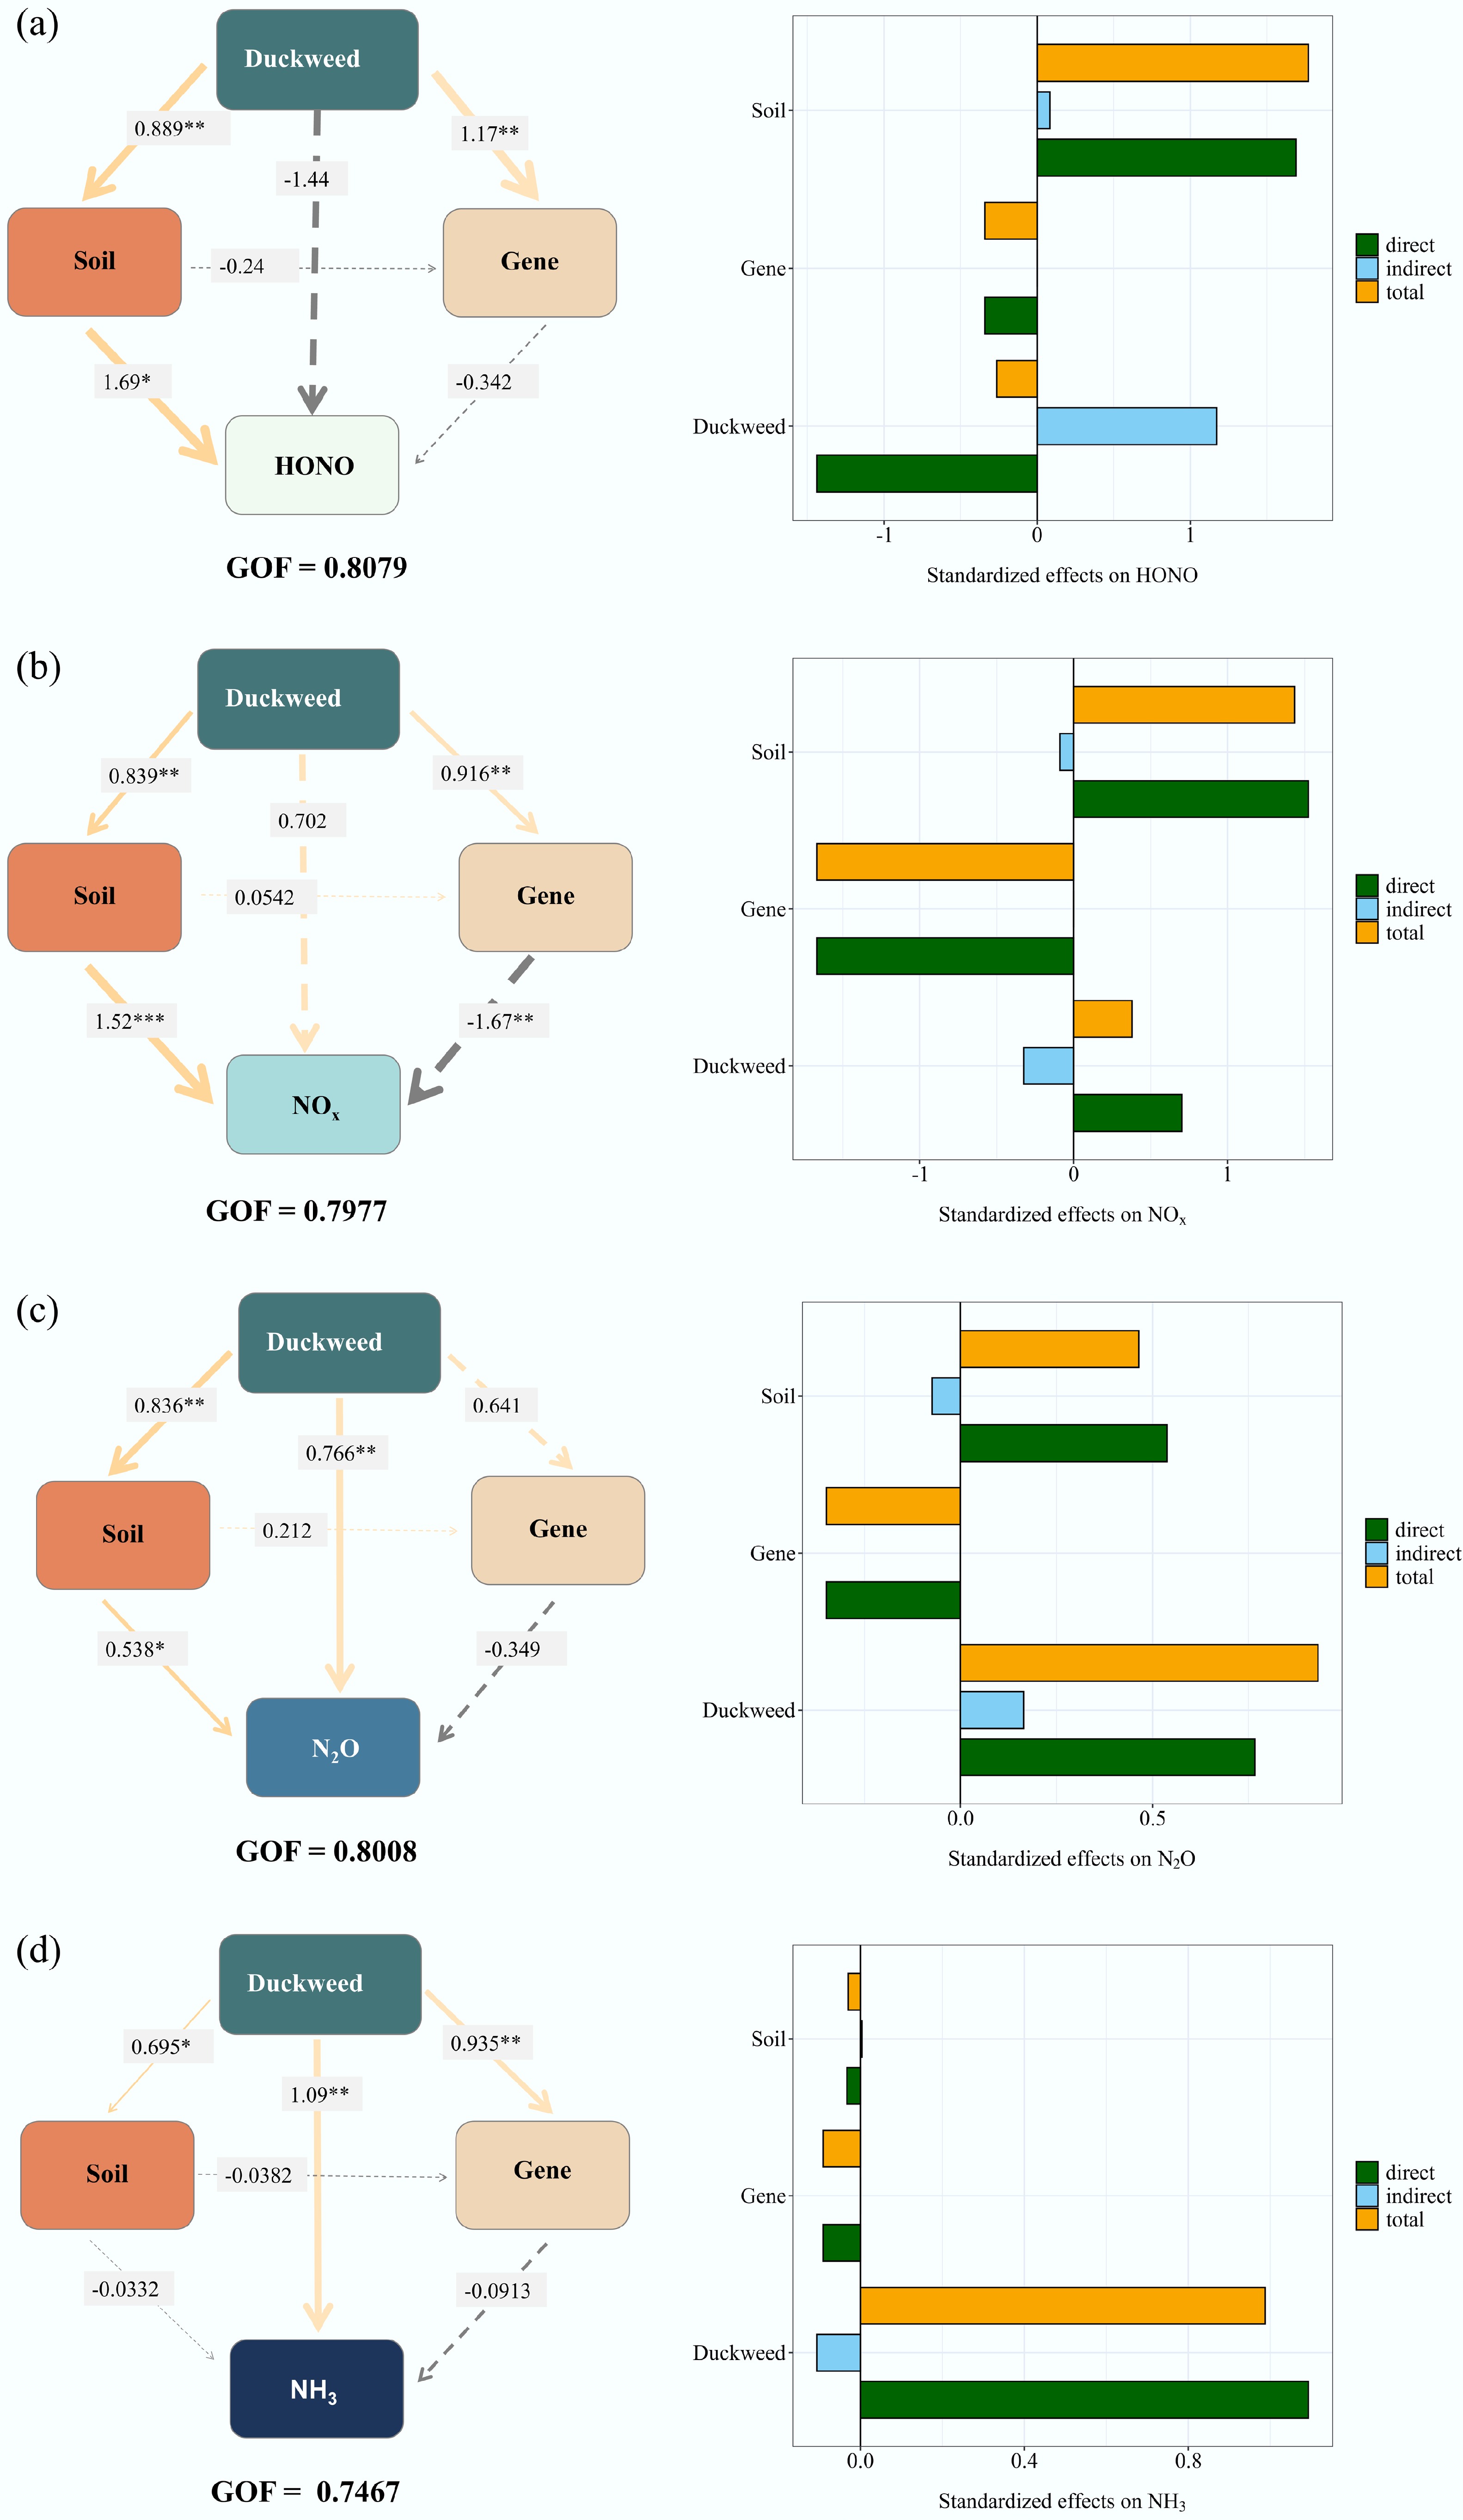
Figure 6.
Partial least squares path model (PLS-PM) illustrating the direct and indirect effects of duckweed on Nr emissions, including (a) HONO, (b) NOx, (c) N2O, and (d) NH3. The goodness-of-fit (GOF) values were 0.8079, 0.7977, 0.8008, and 0.7467, respectively. The asterisks indicate the statistical significance (* p < 0.05; ** p < 0.01; *** p < 0.001).
-
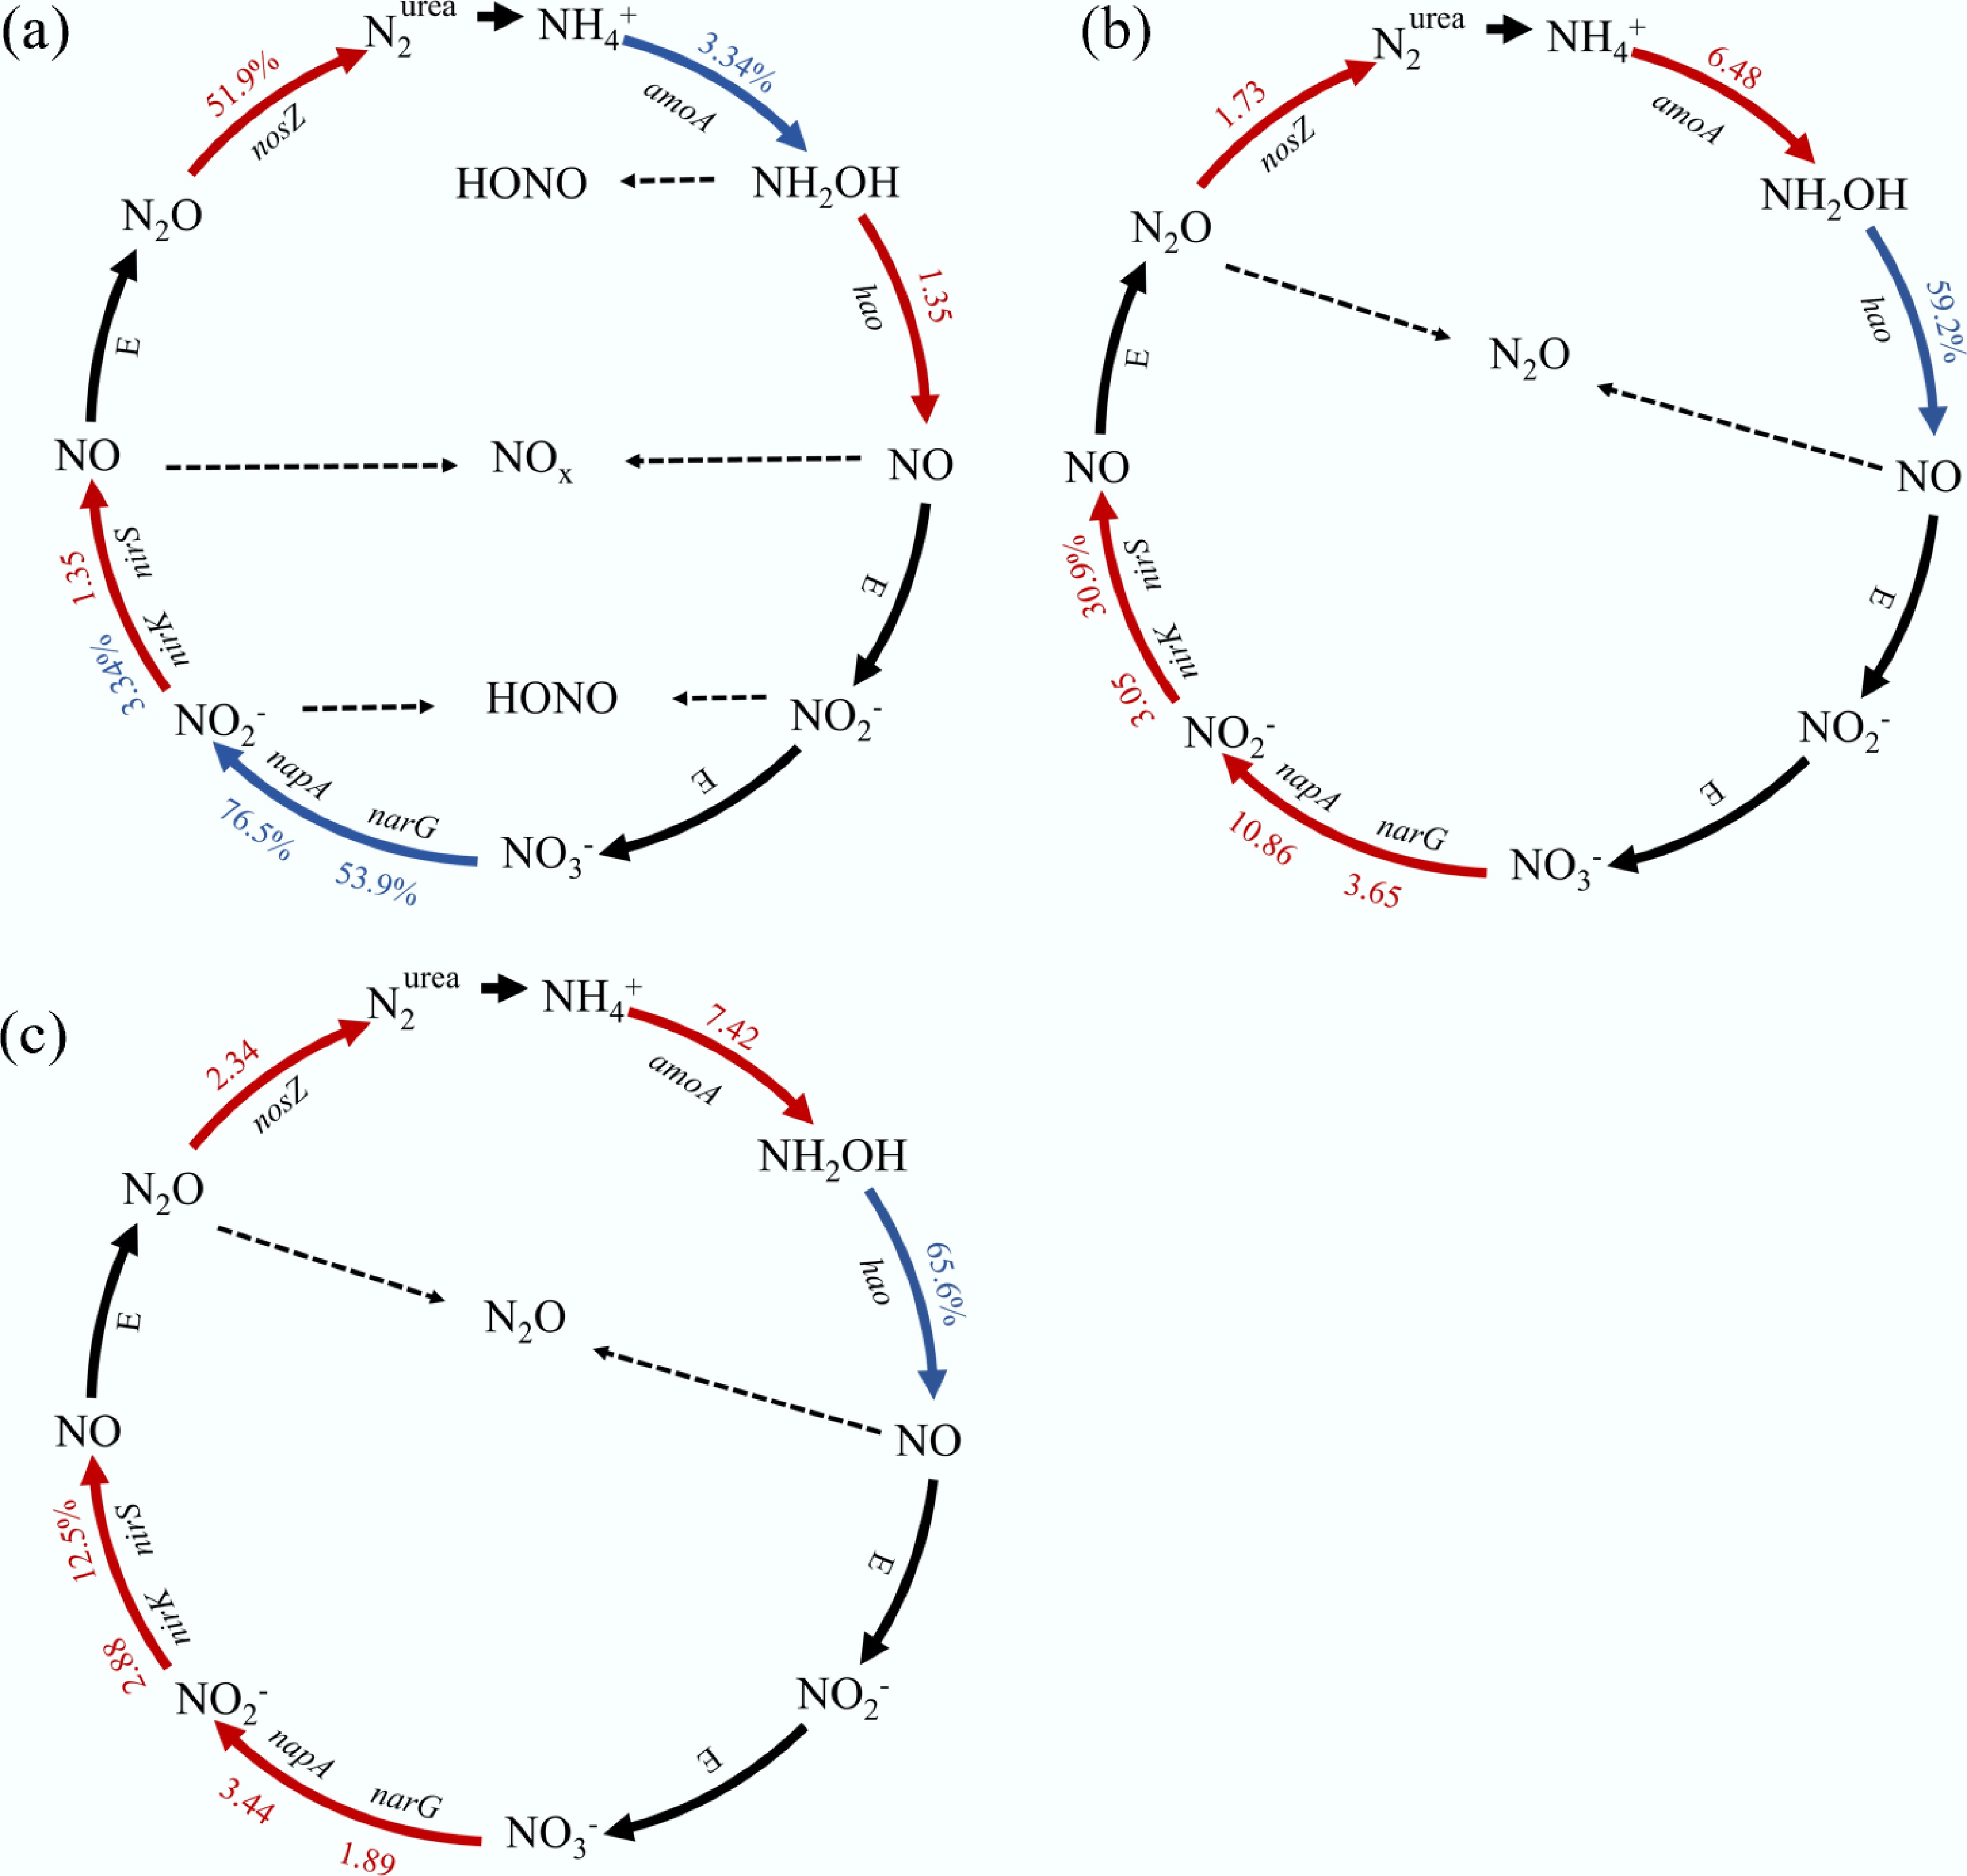
Figure 7.
The differences of N cycle functional gene transcripts between duckweed and unamended soil, including (a) differences between CK and CKN at the HONO and NOx peak, (b) differences between CK and FS at the N2O peak, and (c) differences between CKN and FS at the N2O peak.
-
Emission Predictor Estimate p-value HONO~ EC −1.21 0.0227 NH4+ −2.20 0.0982 MBN 0.317 0.441 NO2− 1.09 0.248 NO3− −0.313 0.336 NOx~ pH 3.175 0.2343 EC 1.359 0.4504 TN −0.325 0.502 NH4+ −3.156 0.2595 MBN 0.9231 0.4986 NO3− −0.8958 0.306 N2O~ pH 3.99 0.1793 EC 0.407 0.3504 NH4+ −0.801 0.2185 MBN −0.687 0.2376 NO2− −1.66 0.2347 NO3− 1.14 0.2868 TN 0.640 0.303 NH3~ pH 5.59 0.002042 EC 1.84 0.002723 NH4+ −3.48 0.005094 MBN −0.284 0.353 Model statistics are as follows. HONO ~ EC + NH4+ + MBN + NO2− + NO3−; AIC = 5.74; F(5, 3) = 22.22, p = 0.01414; R2 = 0.9737, adjusted R2 = 0.9299; NOx ~ pH + EC + TN + NH4+ + MBN + NO3−; AIC = 13.71; F(6, 2) = 6.197, p = 0.1454; R2 = 0.949, adjusted R2 = 0.7958; N2O ~ pH + EC + NH4+ + MBN + NO2− + NO3− + TN; AIC = −12.74; F(7, 1) = 65.84, p = 0.09462; R2 = 0.9978, adjusted R2 = 0.9827; NH3 ~ pH + EC + NH4+ + MBN; AIC = 11.37; F(4, 4) = 15.28, p = 0.01086; R2 = 0.9386, adjusted R2 = 0.8771. Table 1.
Stepwise regression results of soil physical and chemical properties on emission peaks
Figures
(7)
Tables
(1)