-
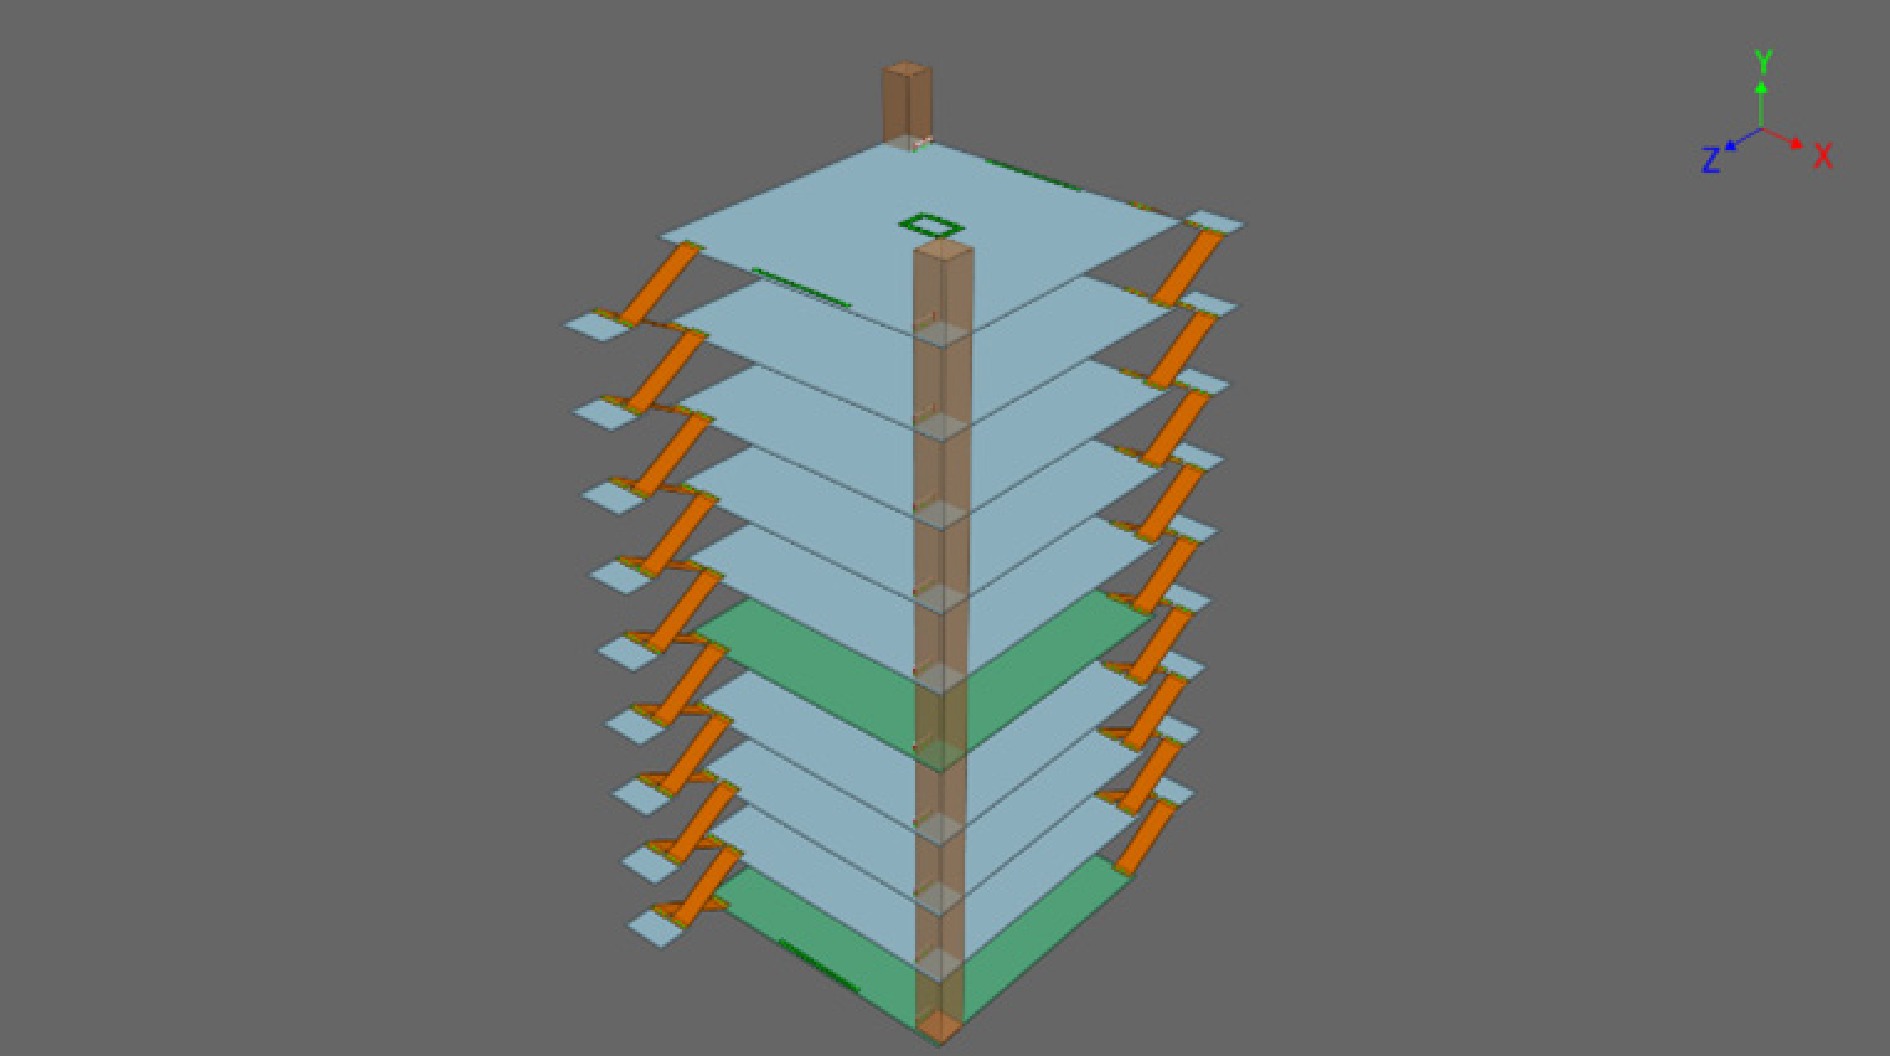
Figure 1.
Simulation scenario of the building model.
-
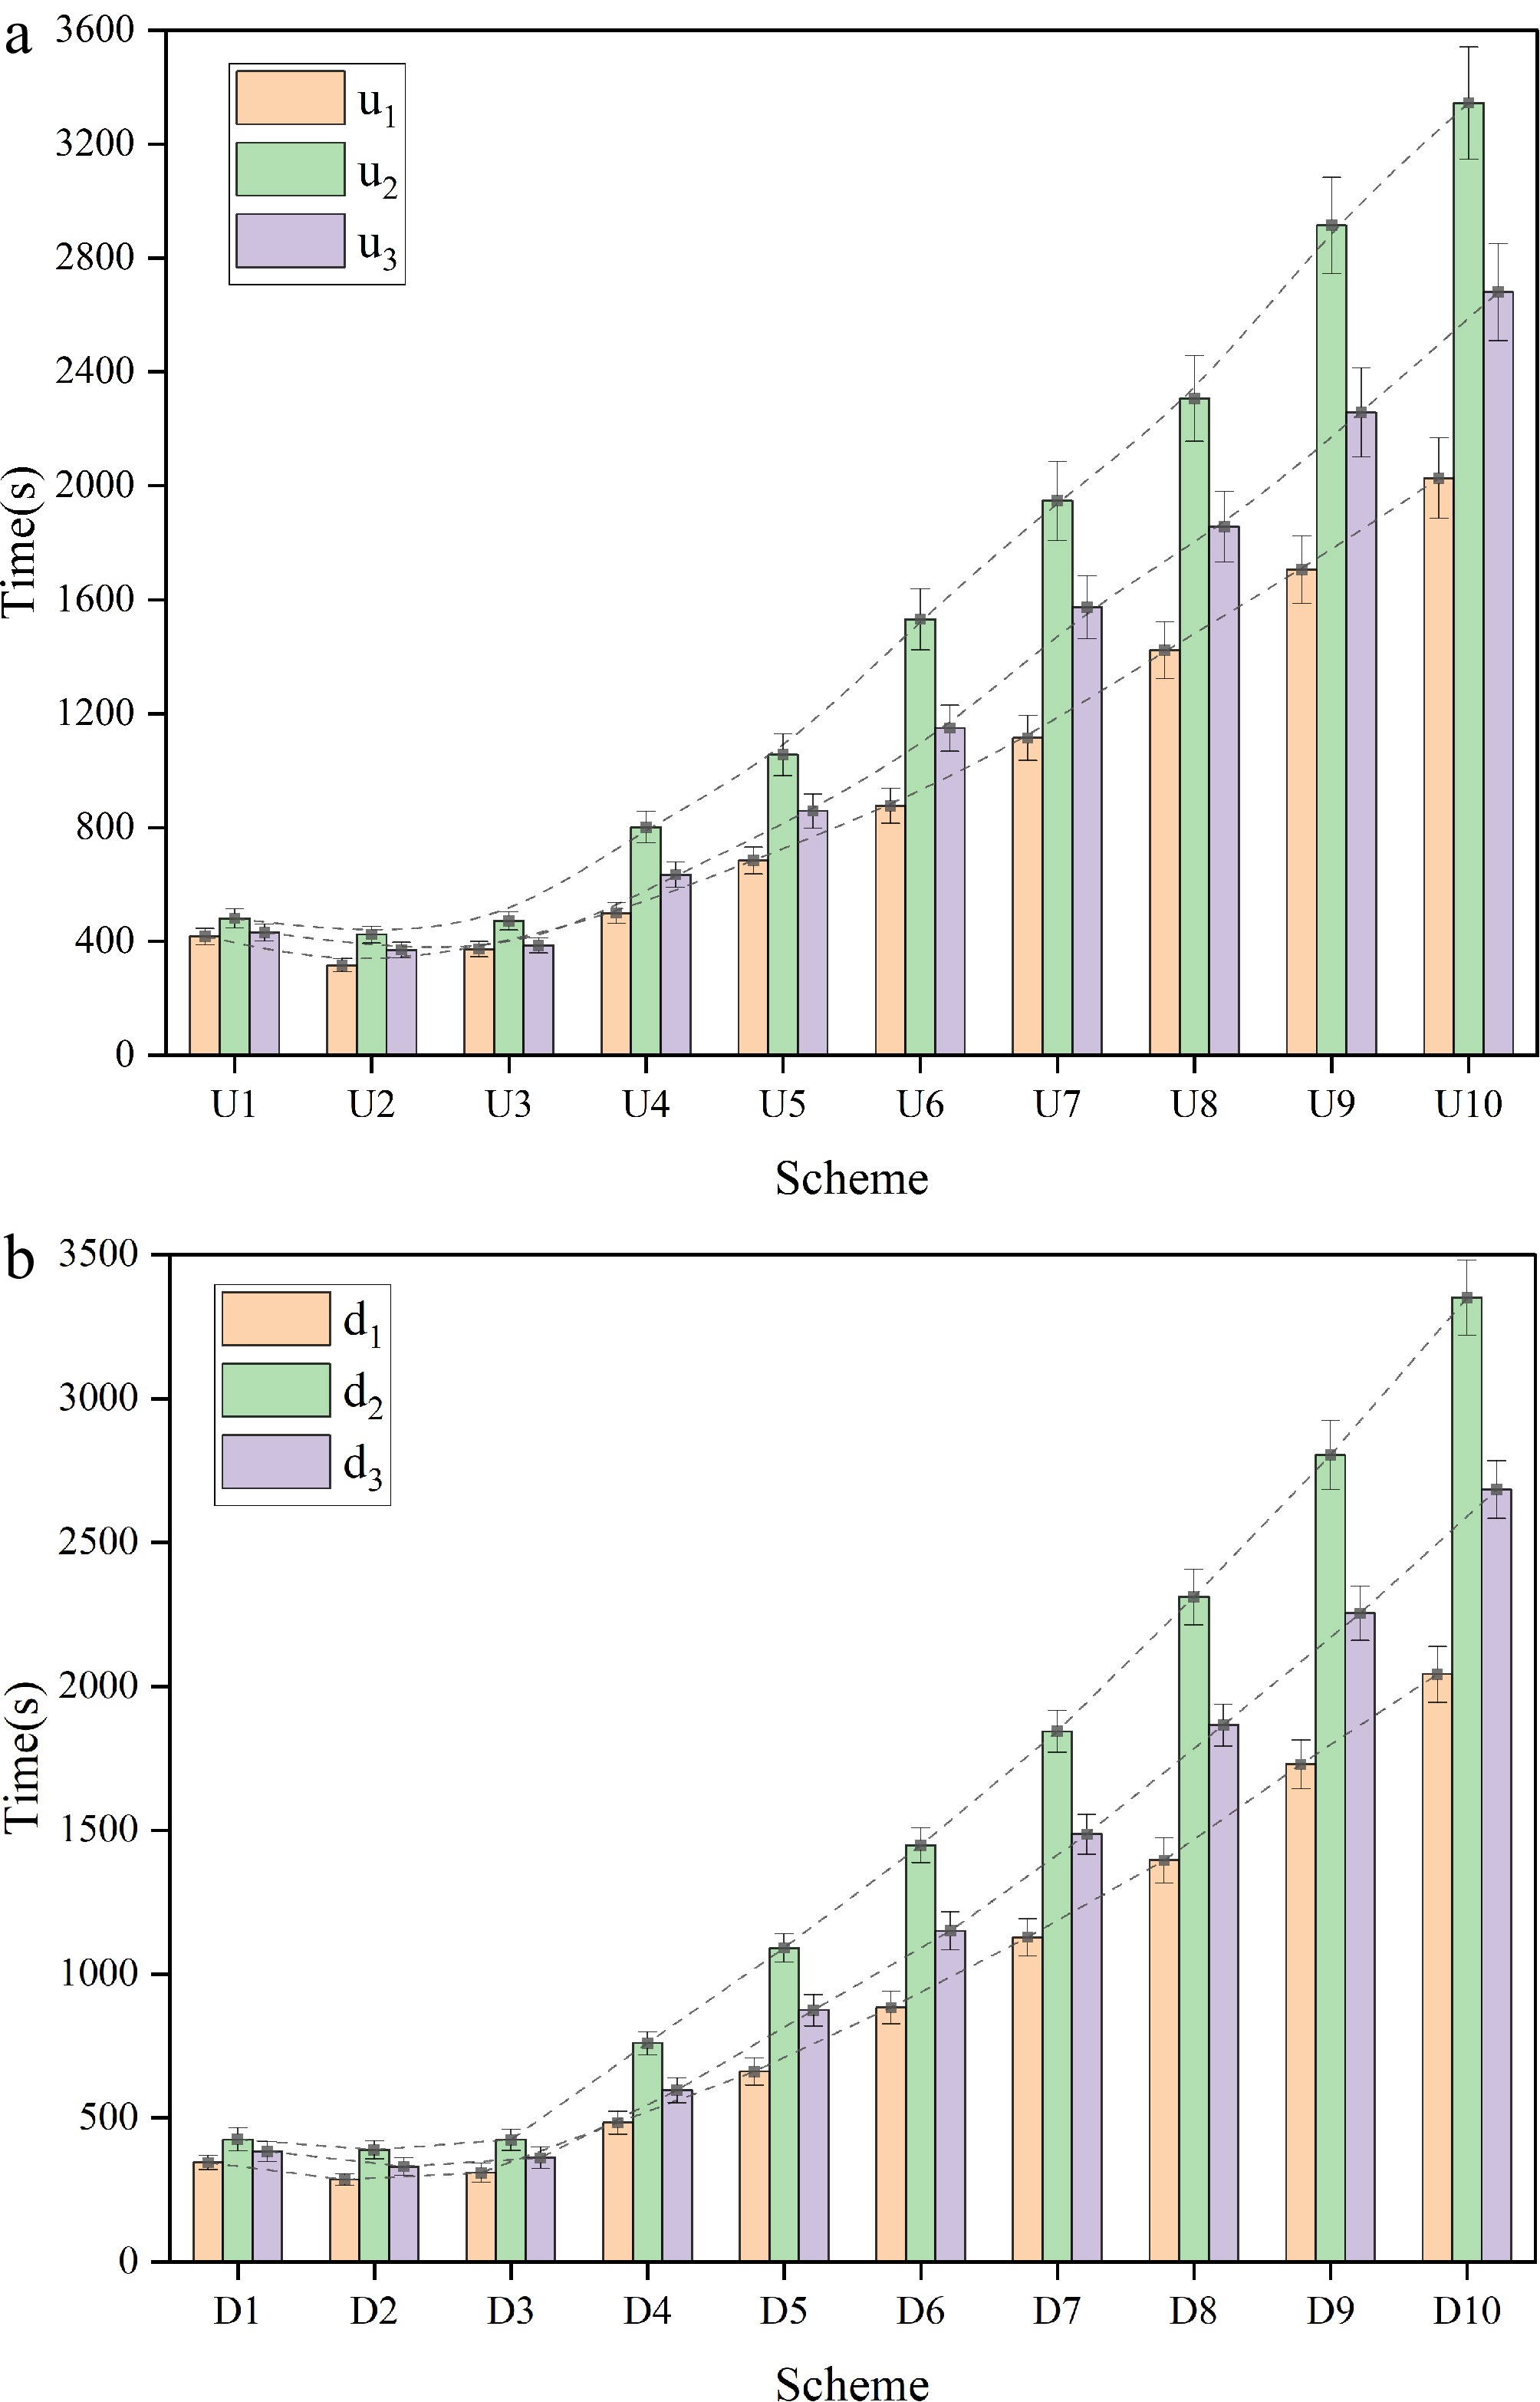
Figure 2.
Evacuation time results for different elevator floors for upward and downward movement. (a) Upward evacuation. (b) Downward evacuation.
-
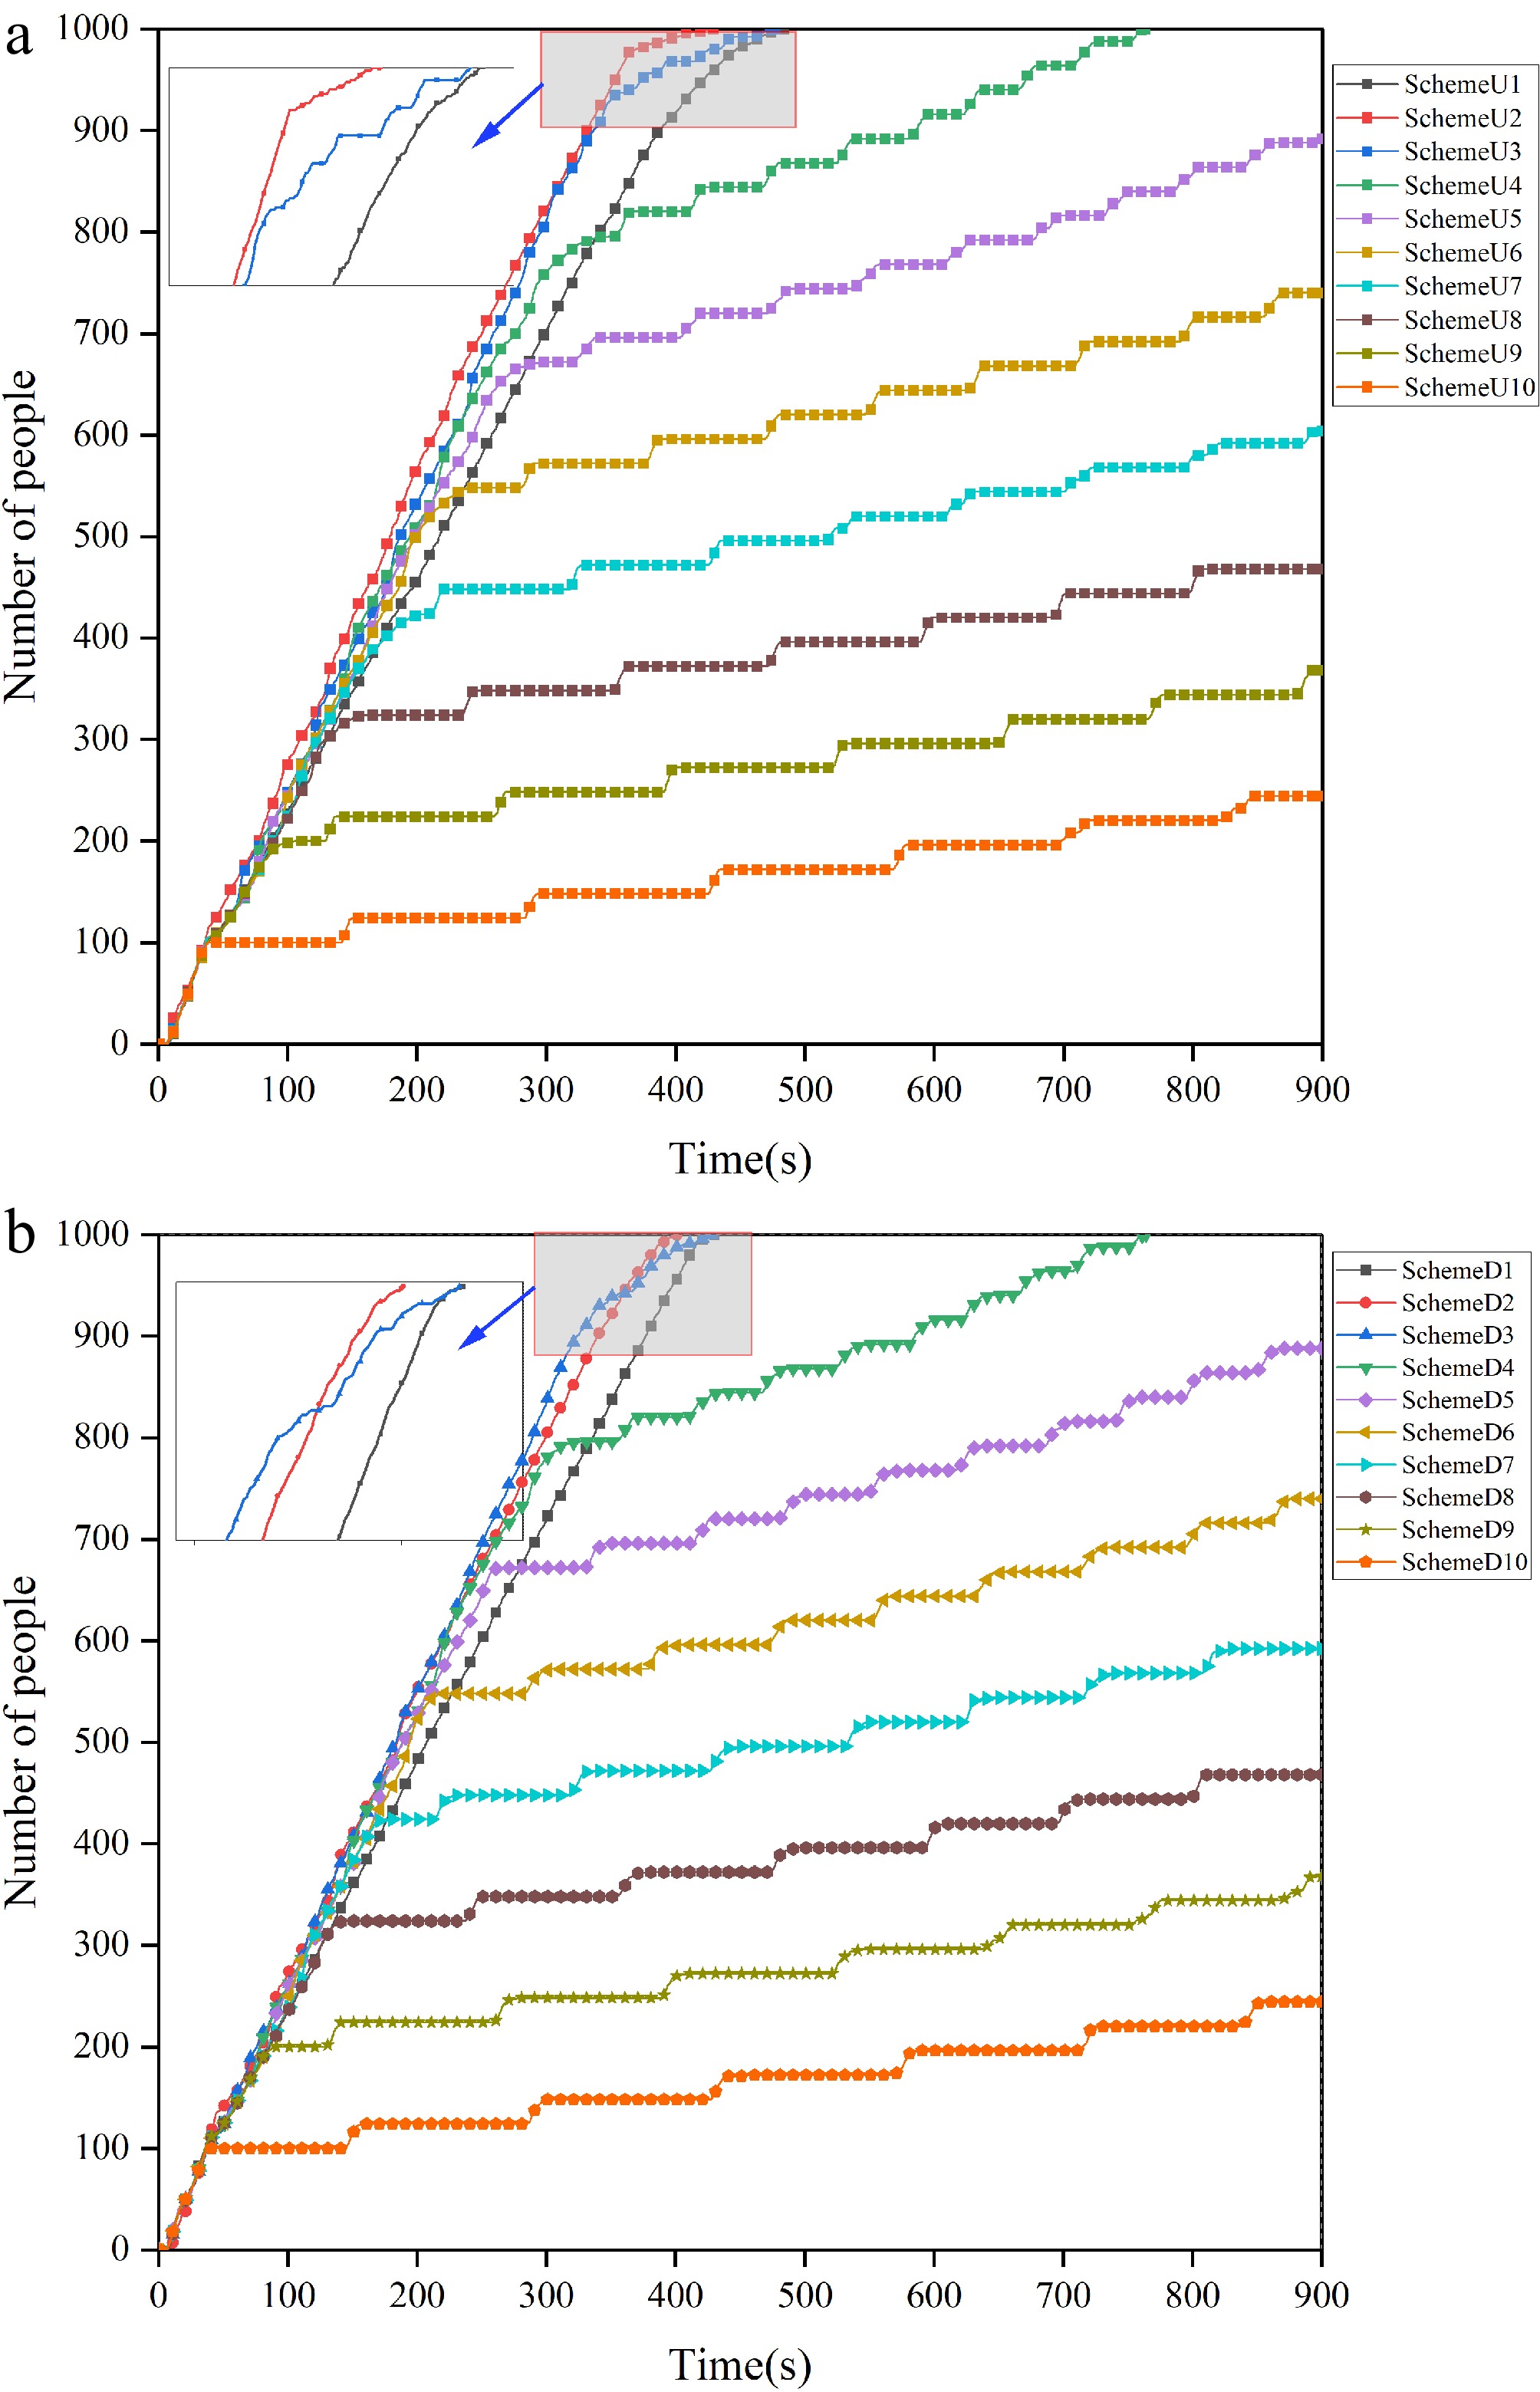
Figure 3.
Comparison of cumulative pedestrian flow for upward and downward evacuation. (a) Upward evacuation. (b) Downward evacuation.
-
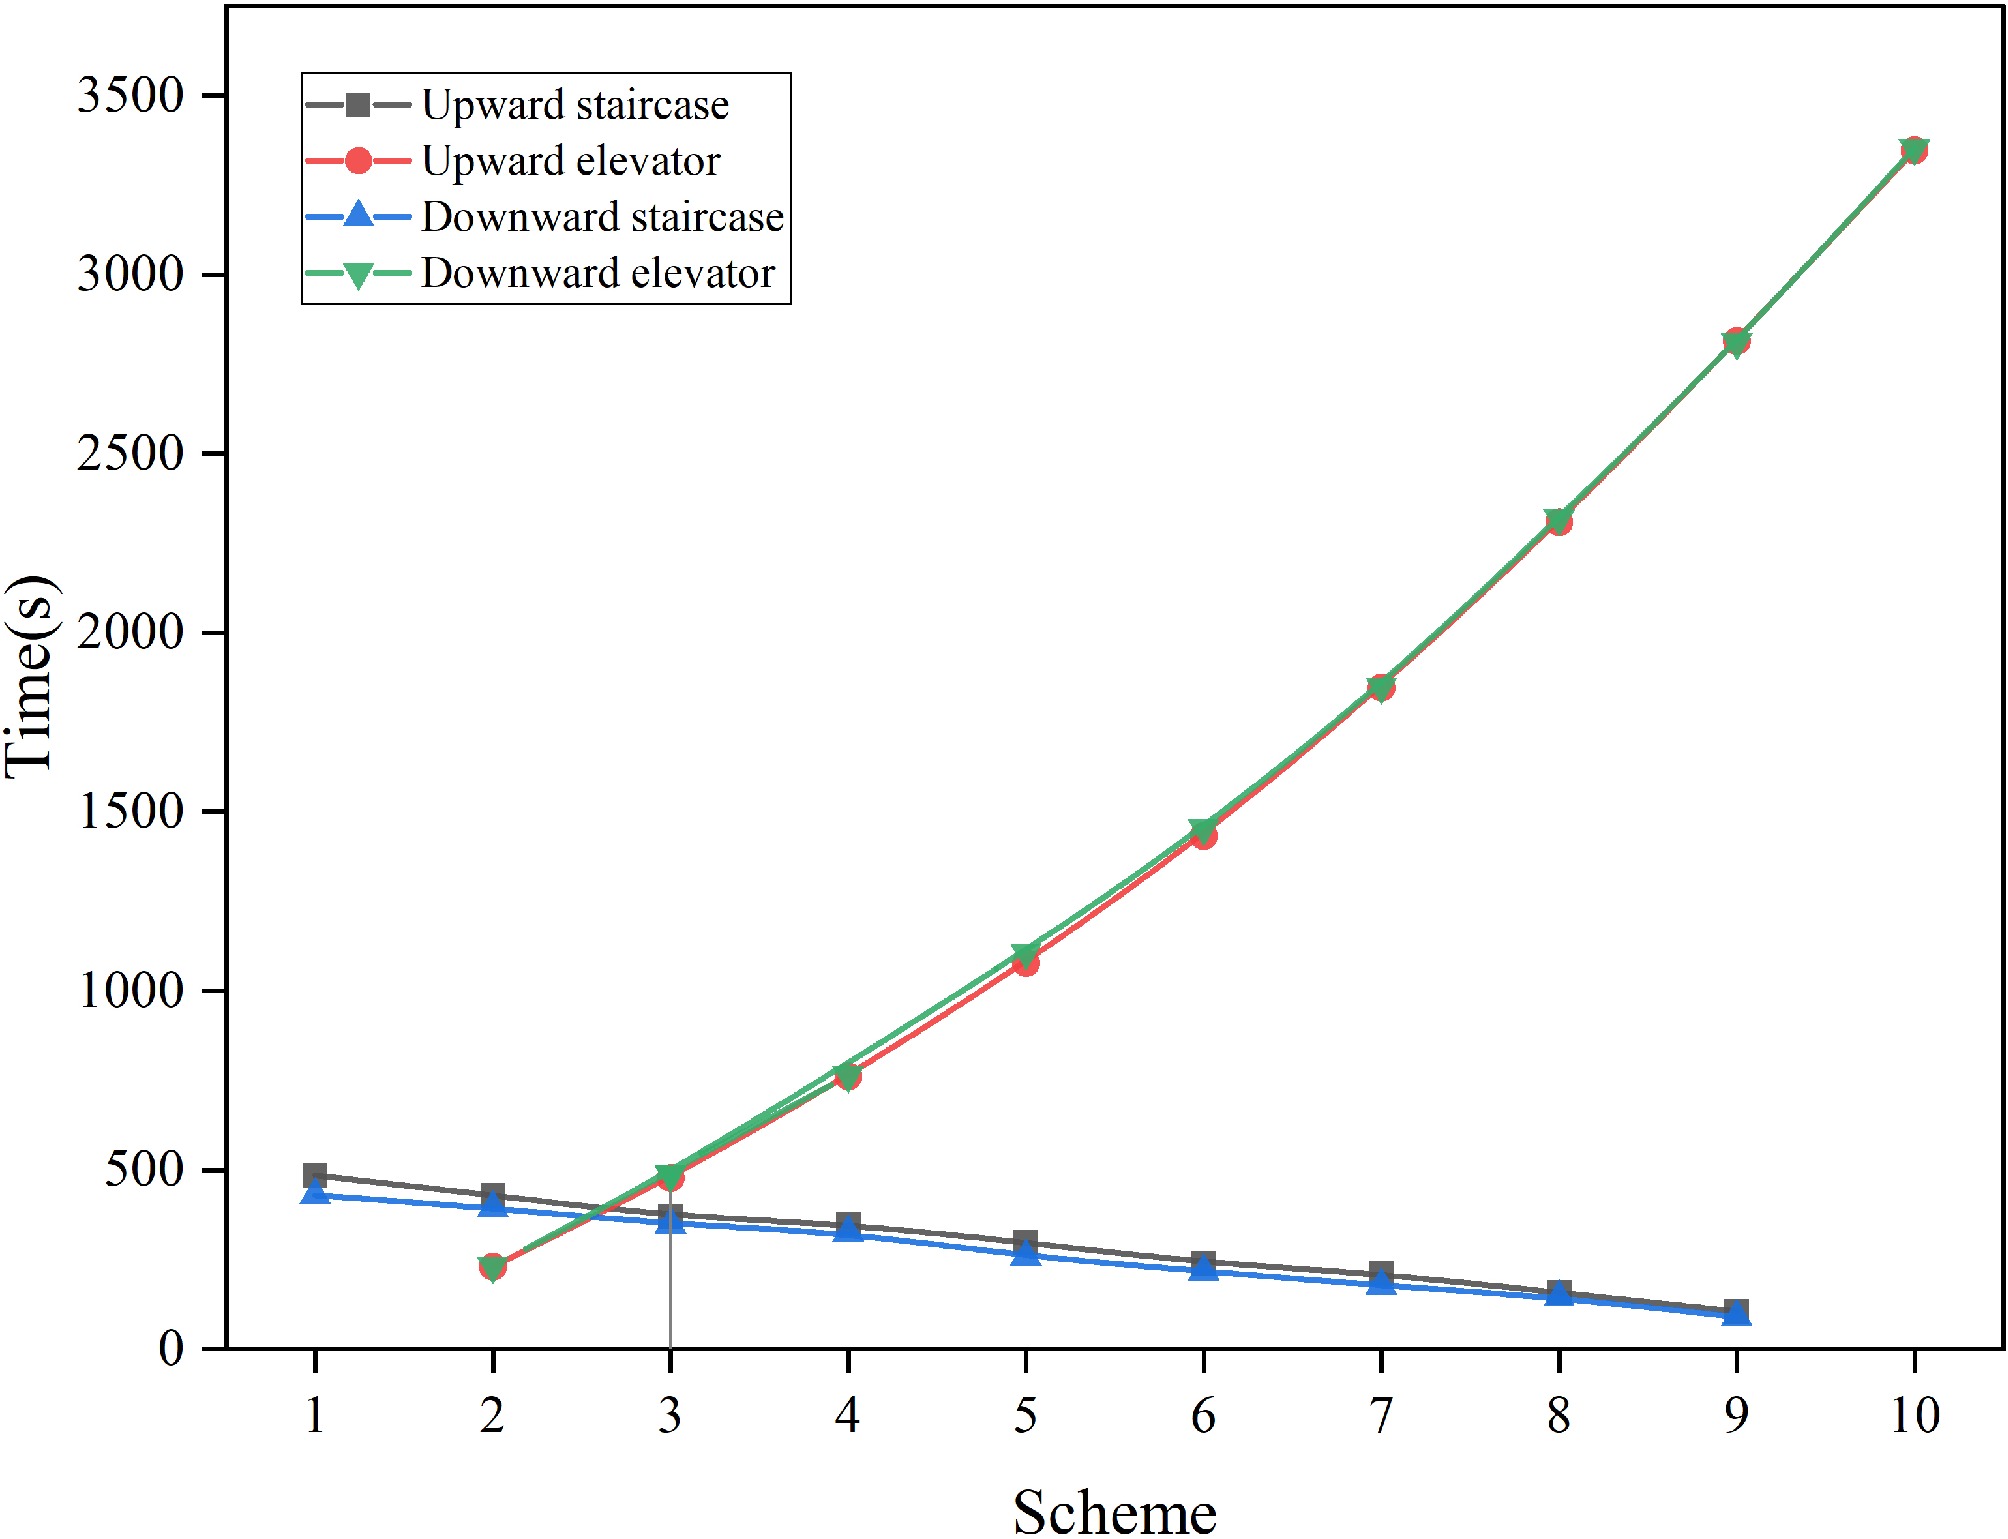
Figure 4.
Comparison of evacuation times for upward and downward stairs and elevators.
-
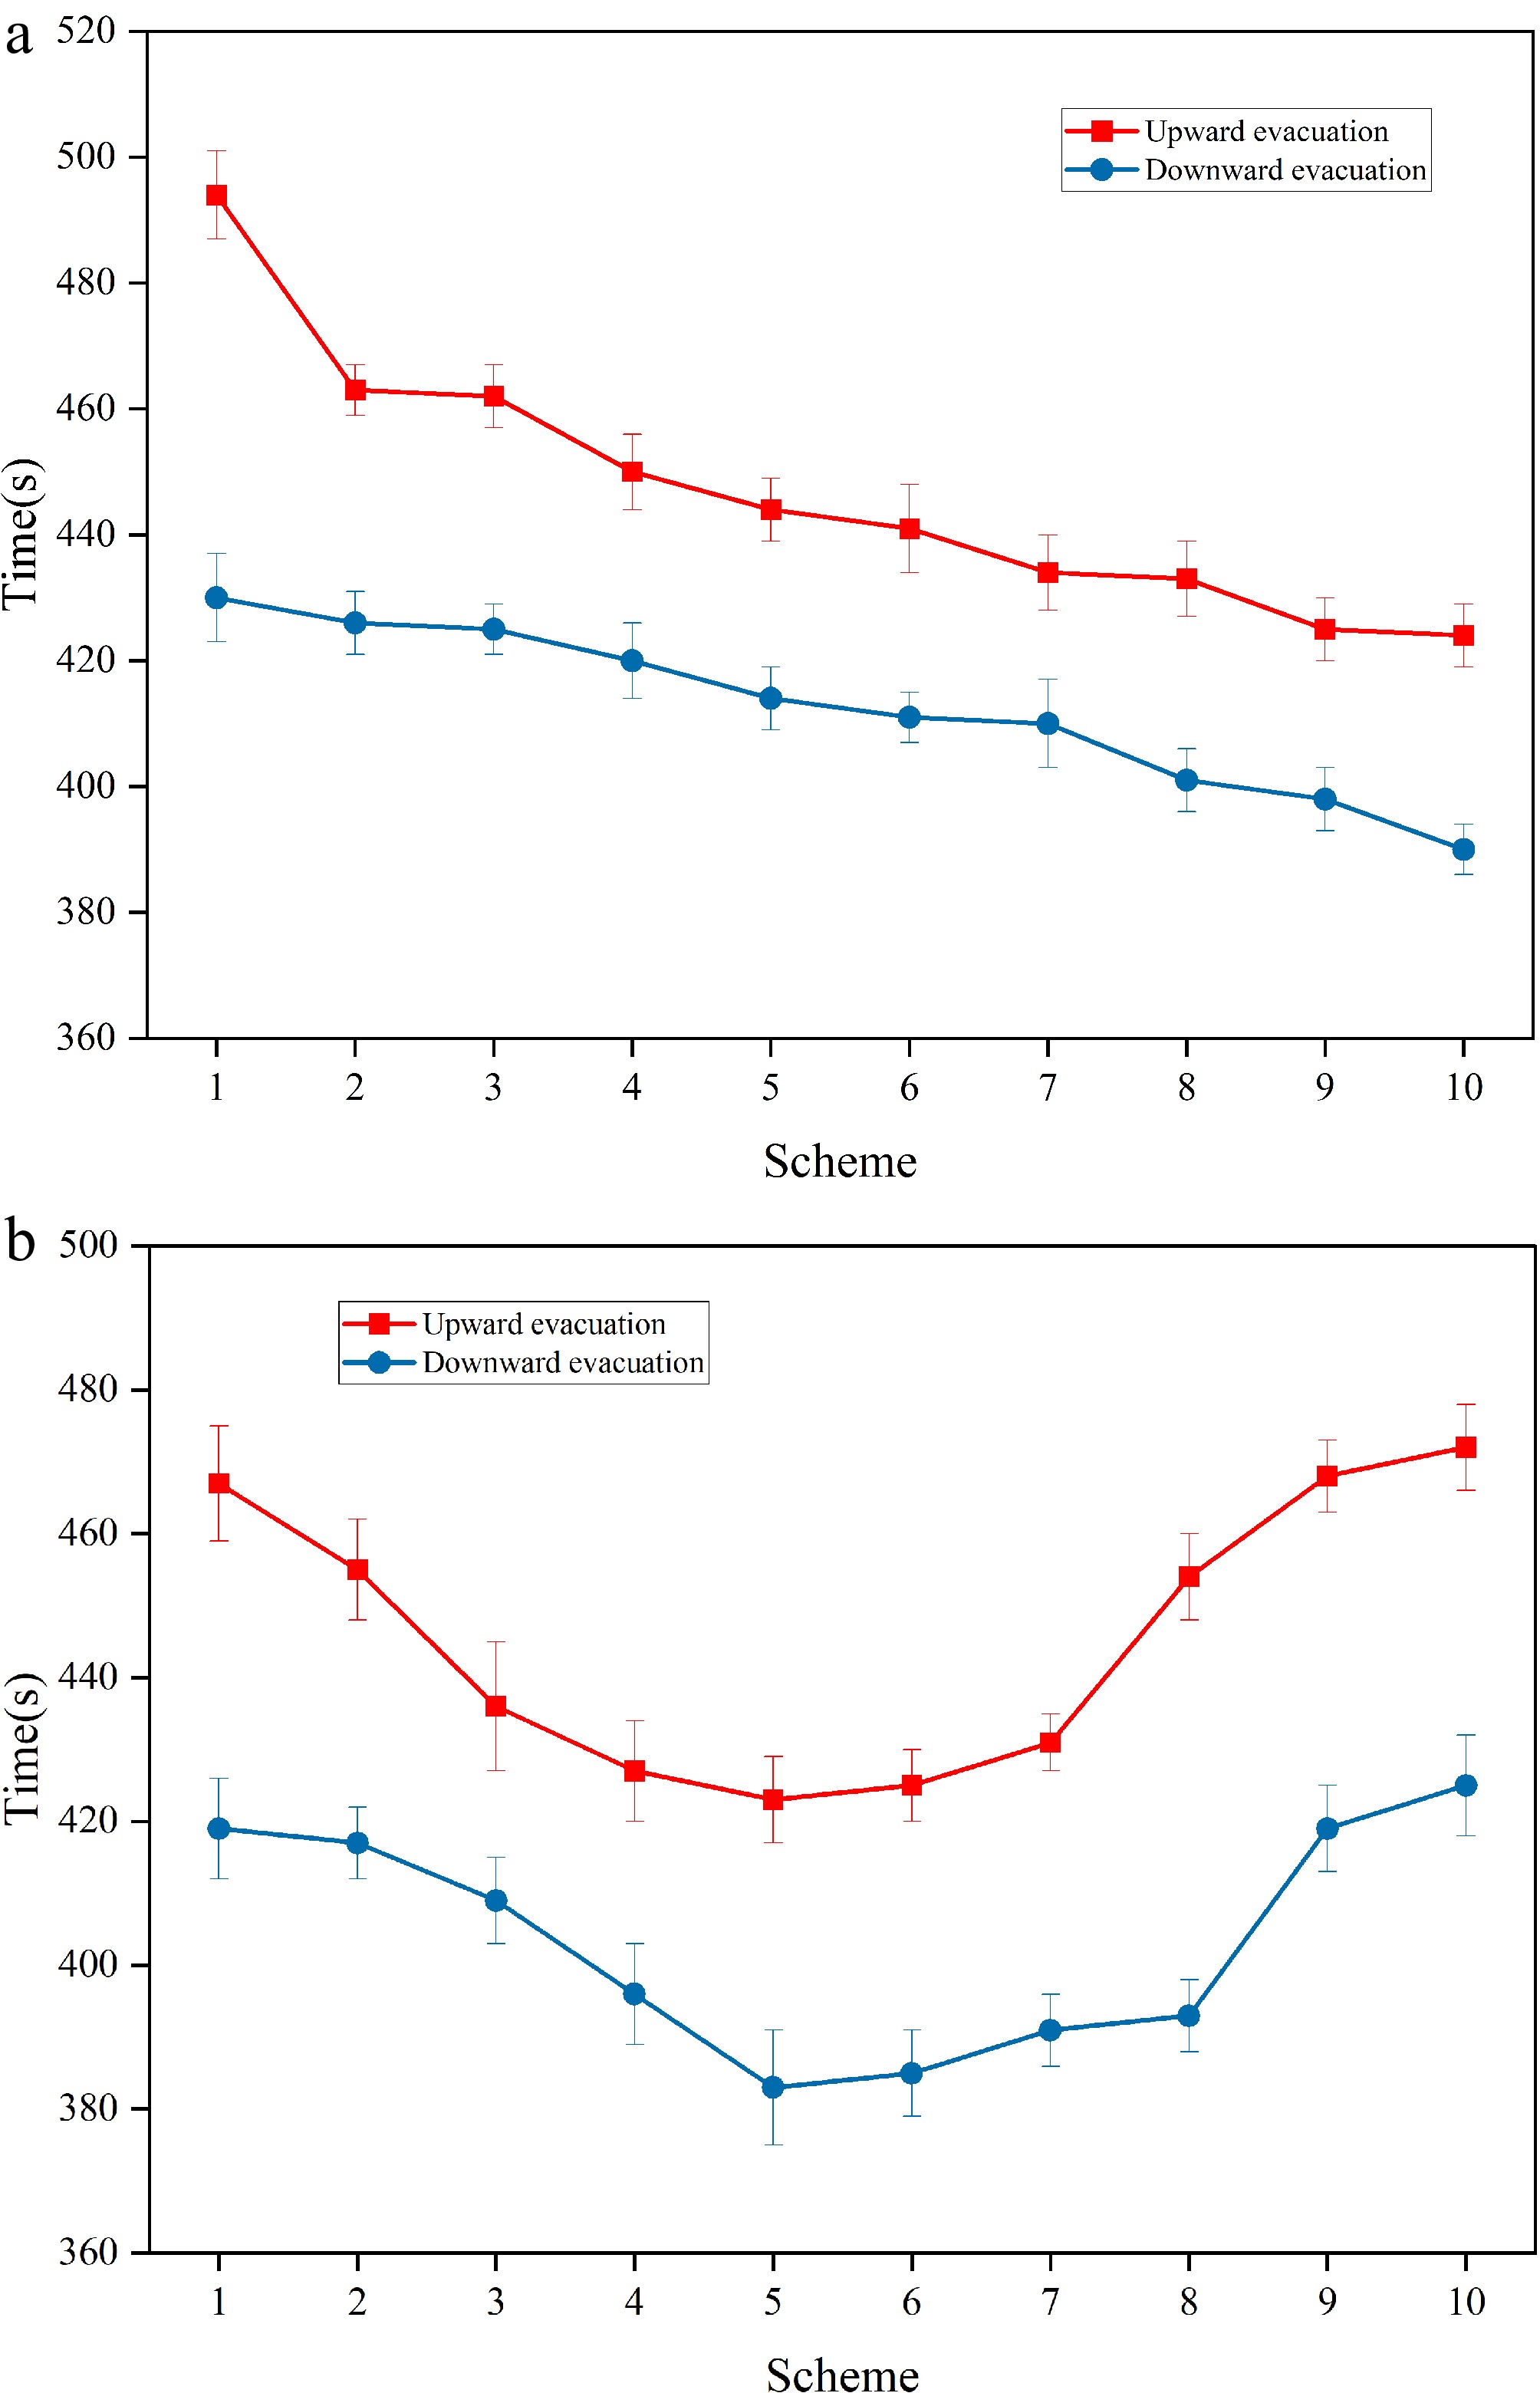
Figure 5.
Simulation results of the use of elevators by different proportions of people during upward and downward evacuations. (a) Scheme A. (b) Scheme B.
-
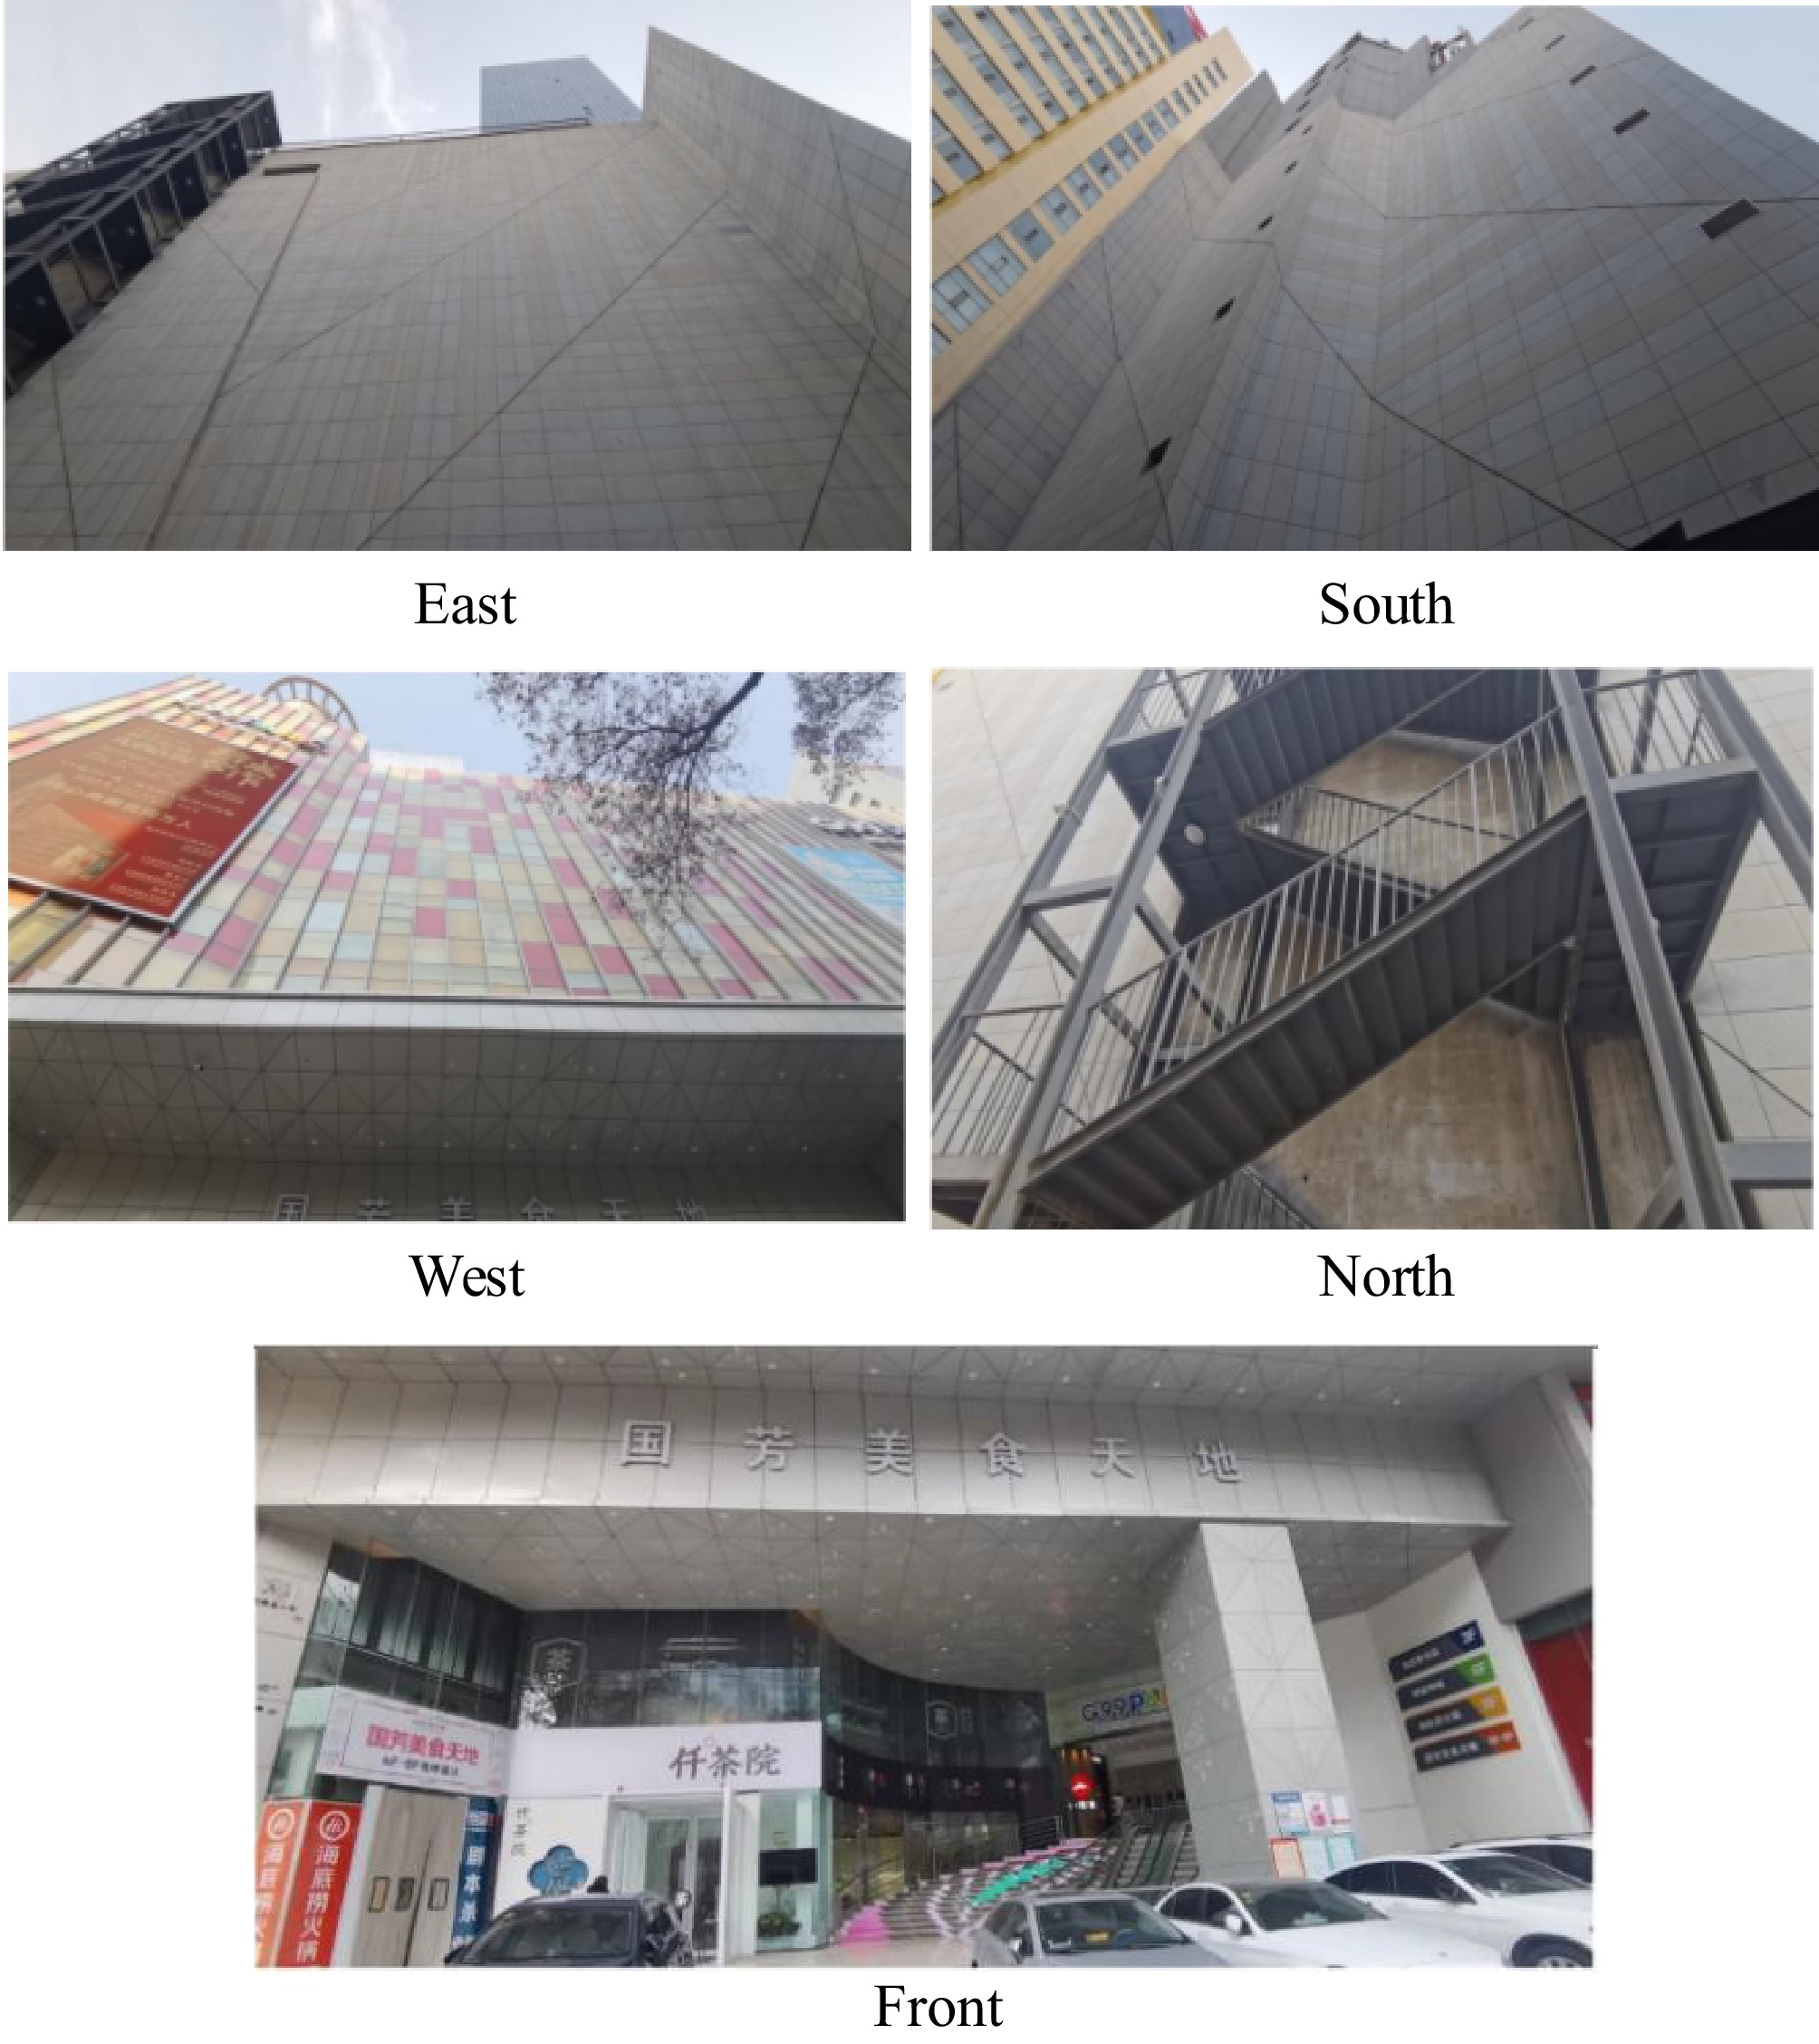
Figure 6.
Building elevation and the panorama of Guofang Parkside.
-
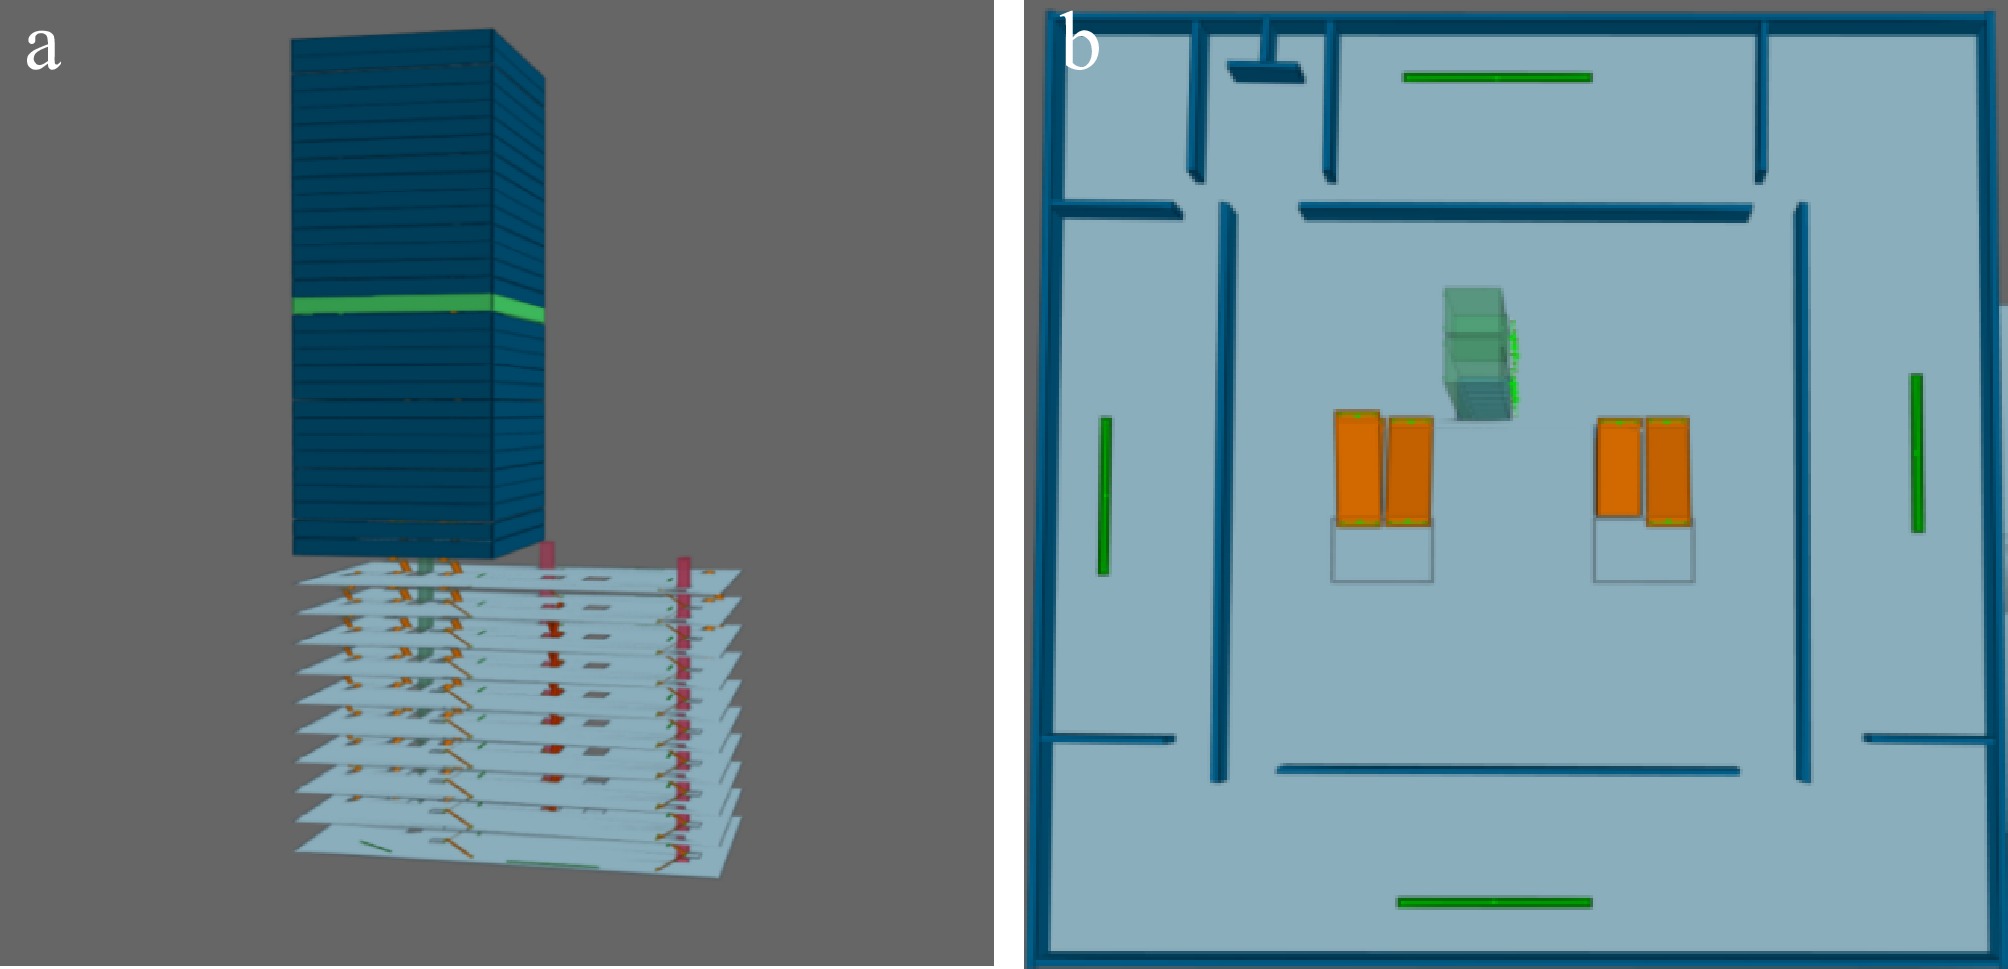
Figure 7.
Simplified structural diagrams of super high-rise buildings. (a) Perspective view. (b) Top view.
-
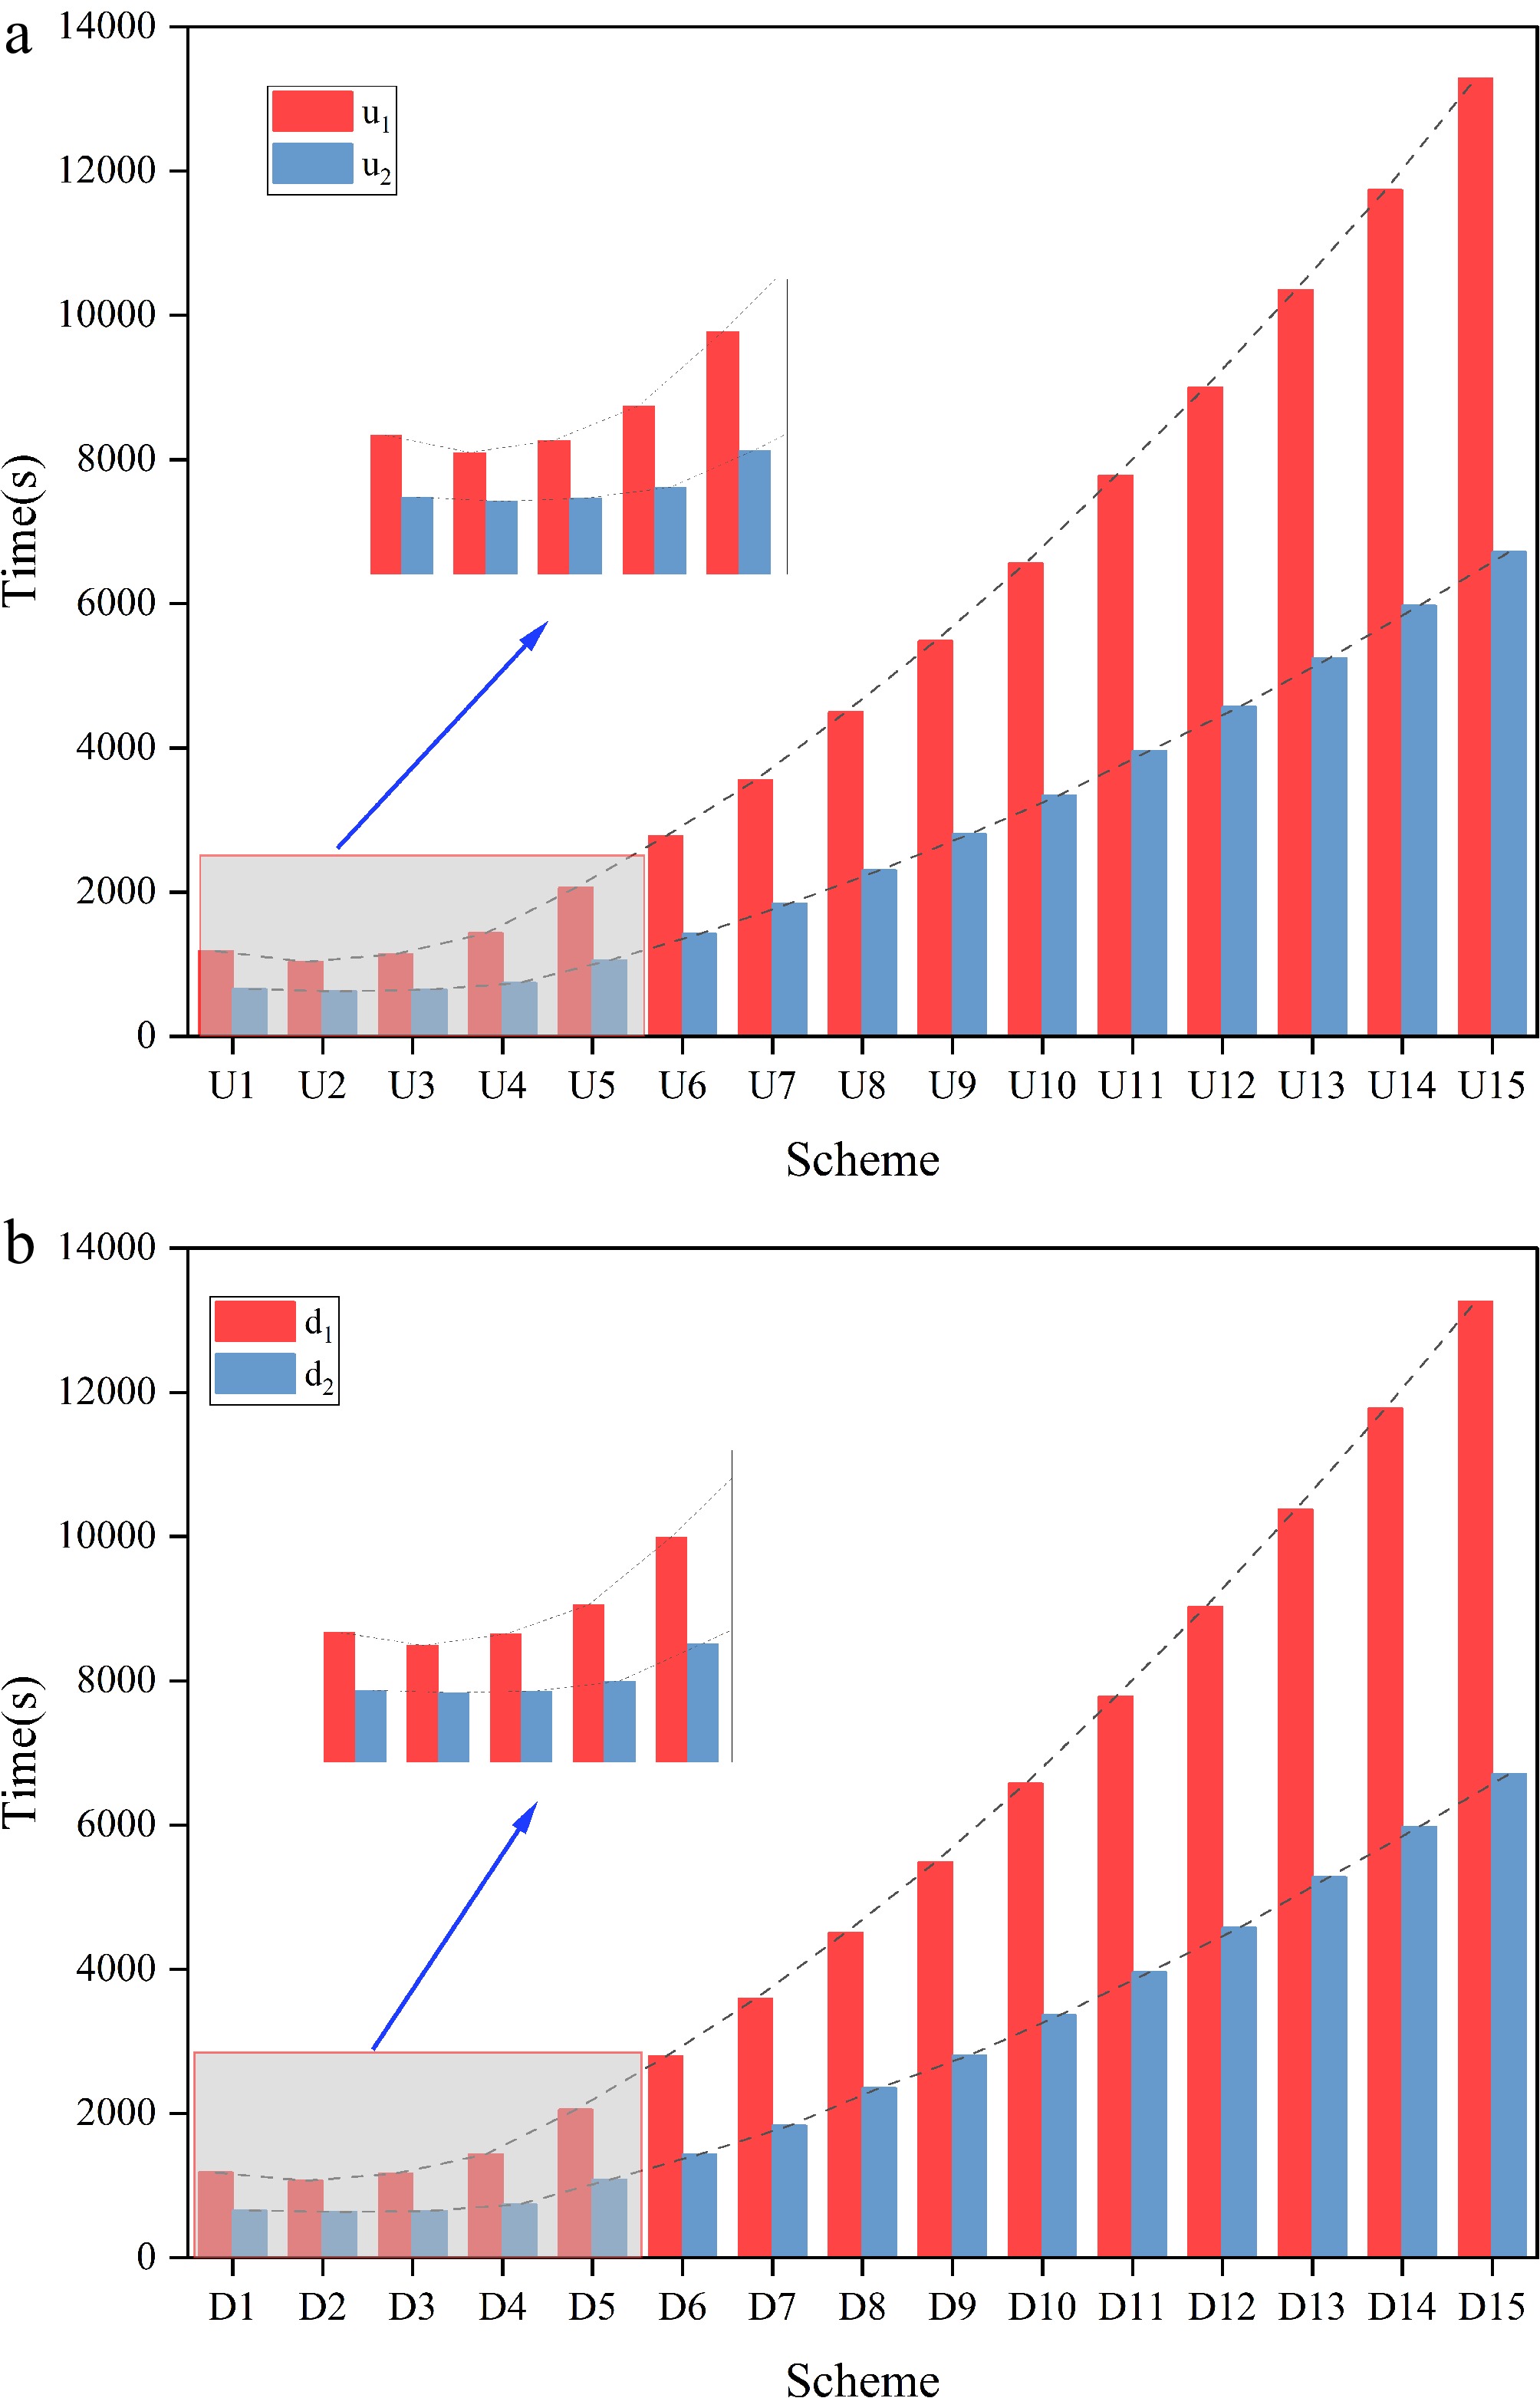
Figure 8.
Evacuation time results for different floors used by upward and downward elevators. (a) Upward evacuation. (b) Downward evacuation.
-
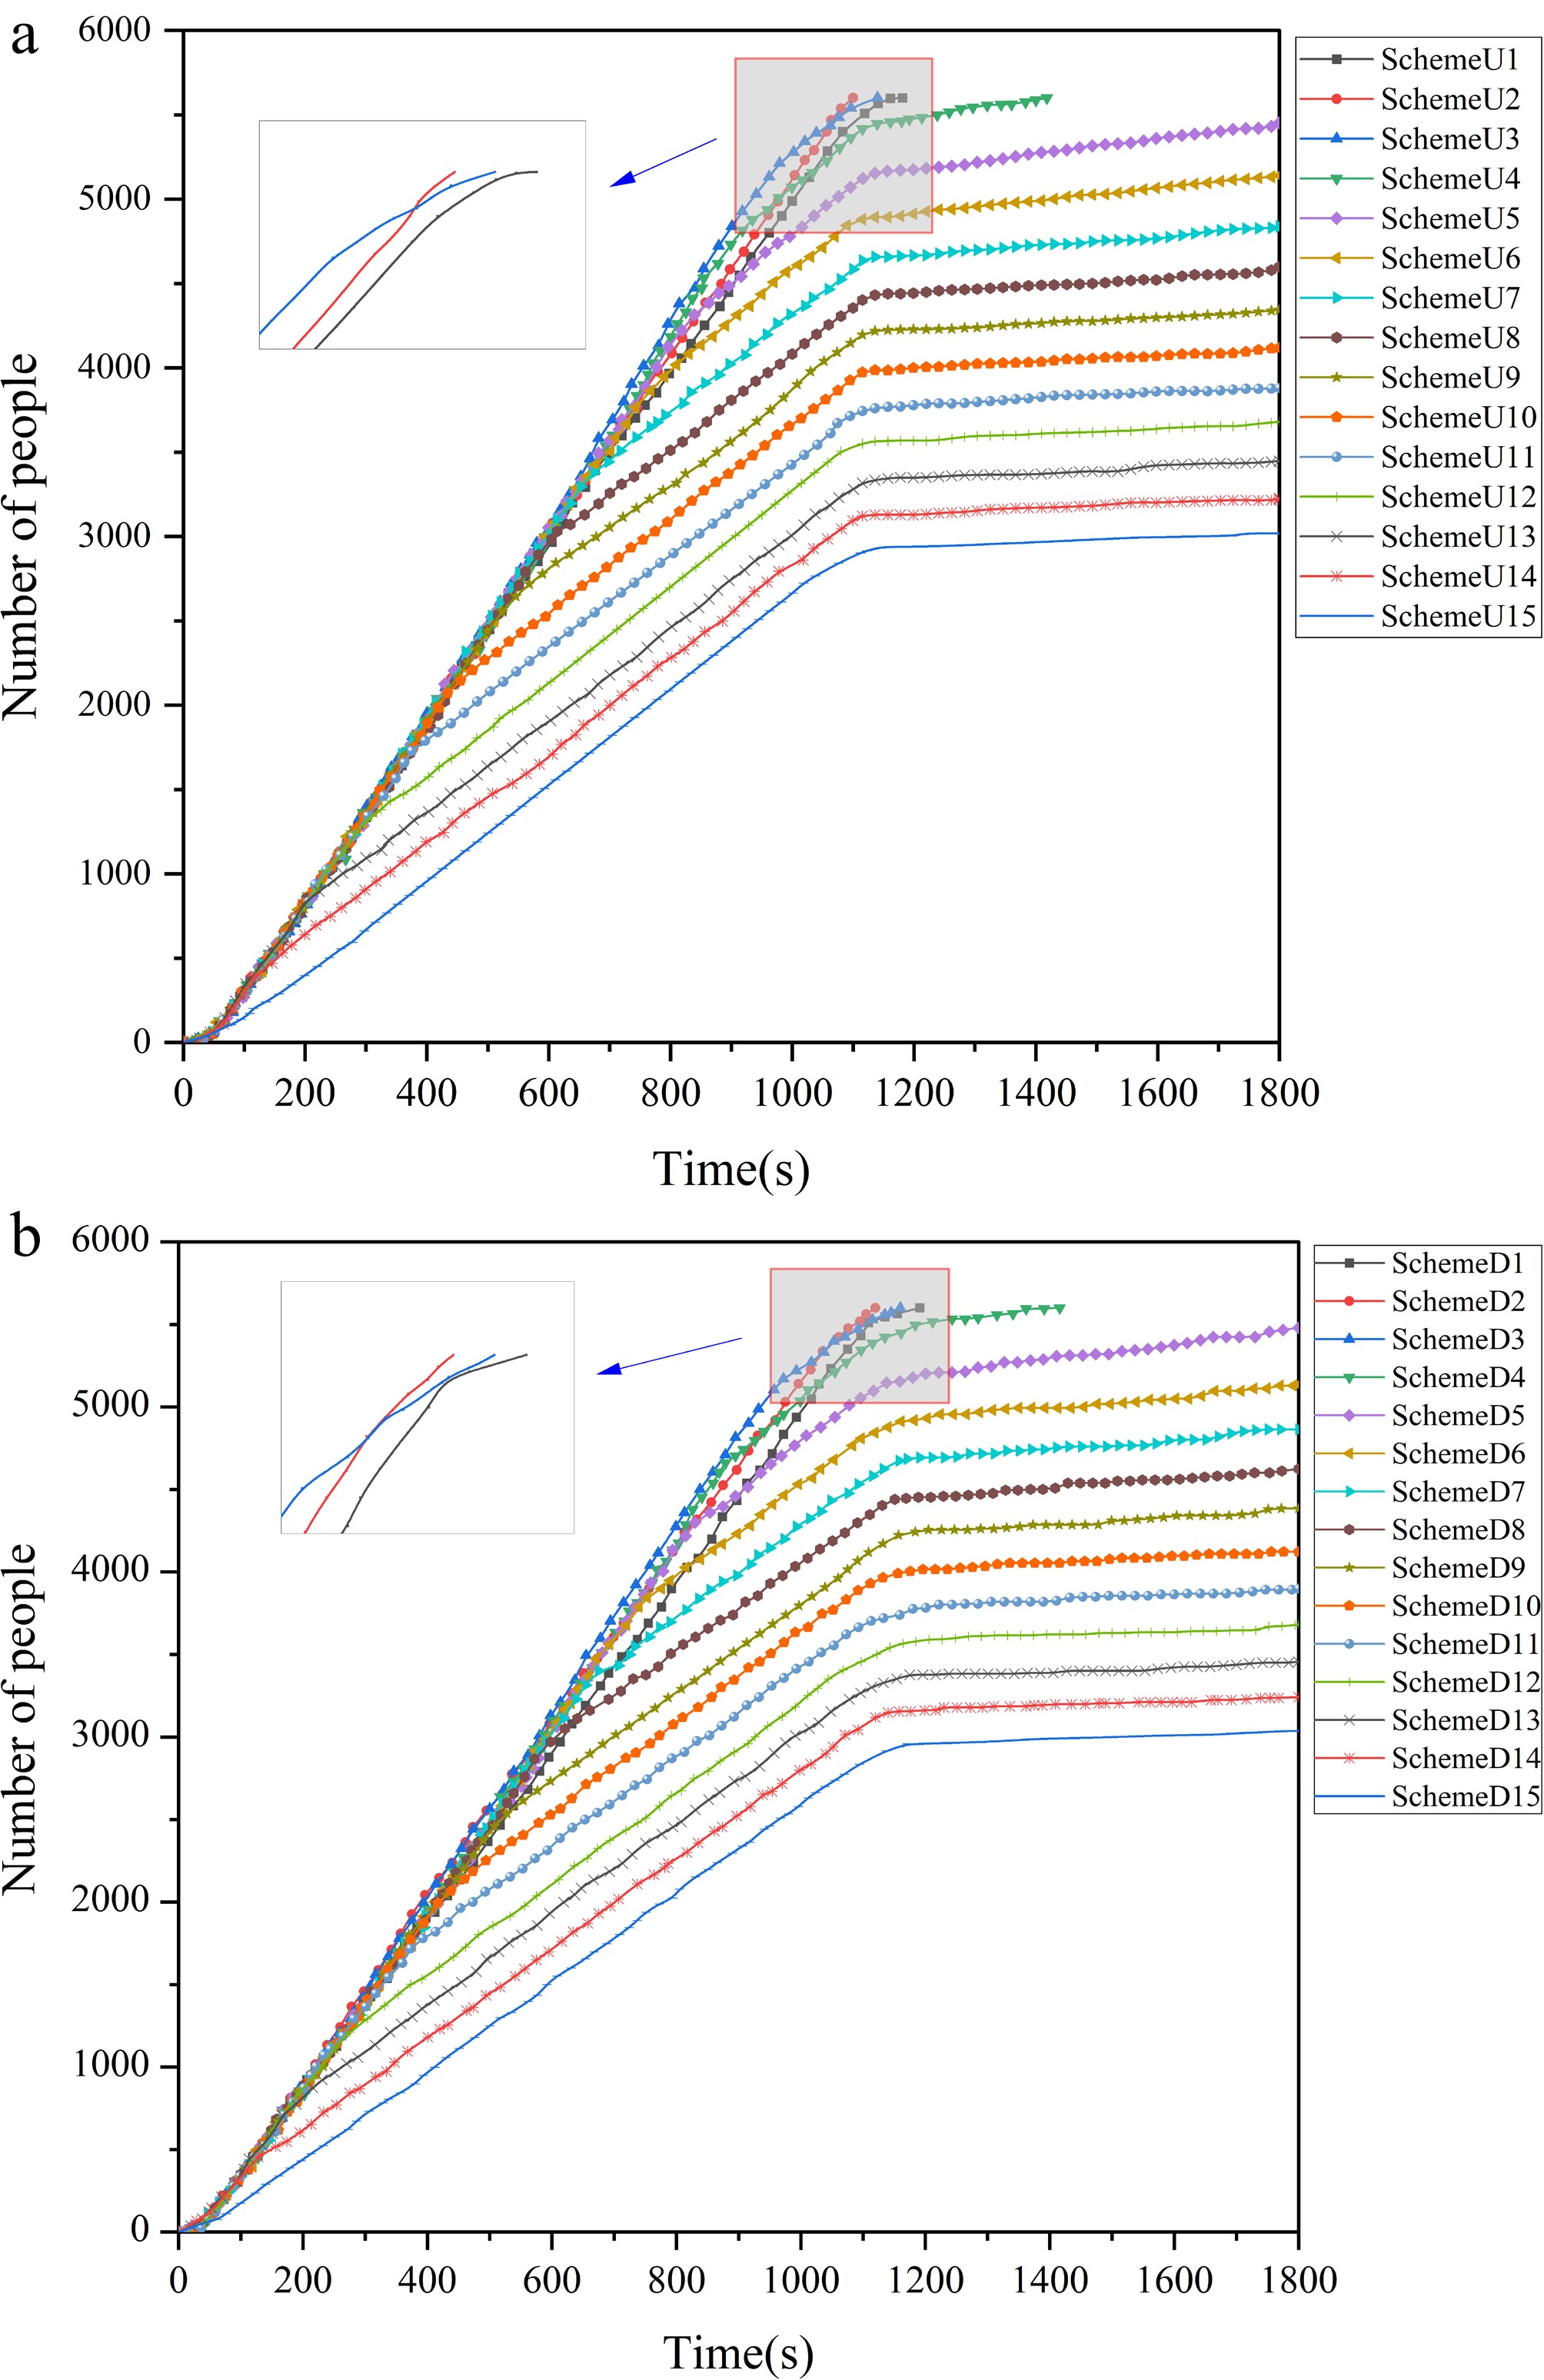
Figure 9.
Cumulative flow of people at the upward and downward evacuation levels. (a) Upward evacuation. (b) Downward evacuation.
-
No. Upward scenario (Un) Downward scenario (Dn) Staircase evacuation floor Elevator evacuation floor Staircase evacuation floor Elevator evacuation floor 1 1–9 floor − 2–10 floor − 2 2–9 floor 1 floor 2–9 floor 10 floor 3 3–9 floor 1–2 floor 2–8 floor 9–10 floor 4 4–9 floor 1–3 floor 2–7 floor 8–10 floor 5 5–9 floor 1–4 floor 2–6 floor 7–10 floor 6 6–9 floor 1–5 floor 2–5 floor 6–10 floor 7 7–9 floor 1–6 floor 2–4 floor 5–10 floor 8 8–9 floor 1–7 floor 2–3 floor 4–10 floor 9 9 floor 1–8 floor 2 floor 3–10 floor 10 − 1–9 floor − 2–10 floor Table 1.
Simulation scenarios for the use of elevators on different floors during upward and downward evacuation.
-
Scheme 1 2 3 4 5 6 7 8 9 10 u1/s 480 424 472 801 1,055 1,531 1,947 2,307 2,915 3,344 Optimization rate − 11.7% 1.7% − − − − − − − u2/s 431 370 386 634 858 1,149 1,573 1,856 2,257 2,685 Optimization rate − 14.2% 10.4% − − − − − − − u3/s 417 316 373 499 684 876 1,115 1,422 1,705 2,027 Optimization rate − 24.2% 10.6% − − − − − − − d1/s 426 390 425 761 1,130 1,409 1,844 2,211 2,805 3,331 Optimization rate − 8.4% 0.2% − − − − − − − d2/s 385 332 363 597 875 1,131 1,487 1,806 2,255 2,680 Optimization rate − 13.8% 5.7% − − − − − − − d3/s 346 286 311 484 662 885 1,109 1,396 1,700 2,003 Optimization rate − 17.3% 10.1% − − − − − − − Table 2.
Statistics on the results of assisted evacuation using elevators for upward and downward movement.
-
No. Scenarios A Scenarios B Upward scenario description Um Downward scenario description Dm Upward scenario description Uk Downward scenario description Dk 1 10% by elevator on the 1st floor 10% by elevator on the 10th floor 10% by elevator on floors 1–2 10% by elevator on floors 9–10 2 20% by elevator on the 1st floor 20% by elevator on the 10th floor 20% by elevator on floors 1–2 20% by elevator on floors 9–10 3 30% by elevator on the 1st floor 30% by elevator on the 10th floor 30% by elevator on floors 1–2 30% by elevator on floors 9–10 4 40% by elevator on the 1st floor 40% by elevator on the 10th floor 40% by elevator on floors 1–2 40% by elevator on floors 9–10 5 50% by elevator on the 1st floor 50% by elevator on the 10th floor 50% by elevator on floors 1–2 50% by elevator on floors 9–10 6 60% by elevator on the 1st floor 60% by elevator on the 10th floor 60% by elevator on floors 1–2 60% by elevator on floors 9–10 7 70% by elevator on the 1st floor 70% by elevator on the 10th floor 70% by elevator on floors 1–2 70% by elevator on floors 9–10 8 80% by elevator on the 1st floor 80% by elevator on the 10th floor 80% by elevator on floors 1–2 80% by elevator on floors 9–10 9 90% by elevator on the 1st floor 90% by elevator on the 10th floor 90% by elevator on floors 1–2 90% by elevator on floors 9–10 10 100% by elevator on the 1st floor 100% by elevator on the 10th floor 100% by elevator on floors 1–2 100% by elevator on floors 9–10 Table 3.
Simulation scenarios for different proportions of people using elevators during upward and downward evacuation in scenarios A and B.
-
No. Upward scenario description Un Downward scenario description Dn 1 11–39 floors by stairs only 11–39 floors by stairs only 2 11 floors by elevator, the rest by stairs 39 floors by elevator, the rest by stairs 3 11–12 floors by elevator, the rest by stairs 38–39 floors by elevator, the rest by stairs 4 11–13 floors by elevator, the rest by stairs 37–39 floors by elevator, the rest by stairs 5 11–14 floors by elevator, the rest by stairs 36–39 floors by elevator, the rest by stairs 6 11–15 floors by elevator, the rest by stairs 35–39 floors by elevator, the rest by stairs 7 11–16 floors by elevator, the rest by stairs 34–39 floors by elevator, the rest by stairs 8 11–17 floors by elevator, the rest by stairs 33–39 floors by elevator, the rest by stairs 9 11–18 floors by elevator, the rest by stairs 32–39 floors by elevator, the rest by stairs 10 11–19 floors by elevator, the rest by stairs 31–39 floors by elevator, the rest by stairs 11 11–20 floors by elevator, the rest by stairs 30–39 floors by elevator, the rest by stairs 12 11–21 floors by elevator, the rest by stairs 29–39 floors by elevator, the rest by stairs 13 11–22 floors by elevator, the rest by stairs 28–39 floors by elevator, the rest by stairs 14 11–23 floors by elevator, the rest by stairs 27–39 floors by elevator, the rest by stairs 15 11–24 floors by elevator, the rest by stairs 26–39 floors by elevator, the rest by stairs Table 4.
Simulation scenarios for the use of elevators on different floors during upward and downward evacuation.
Figures
(9)
Tables
(4)