-
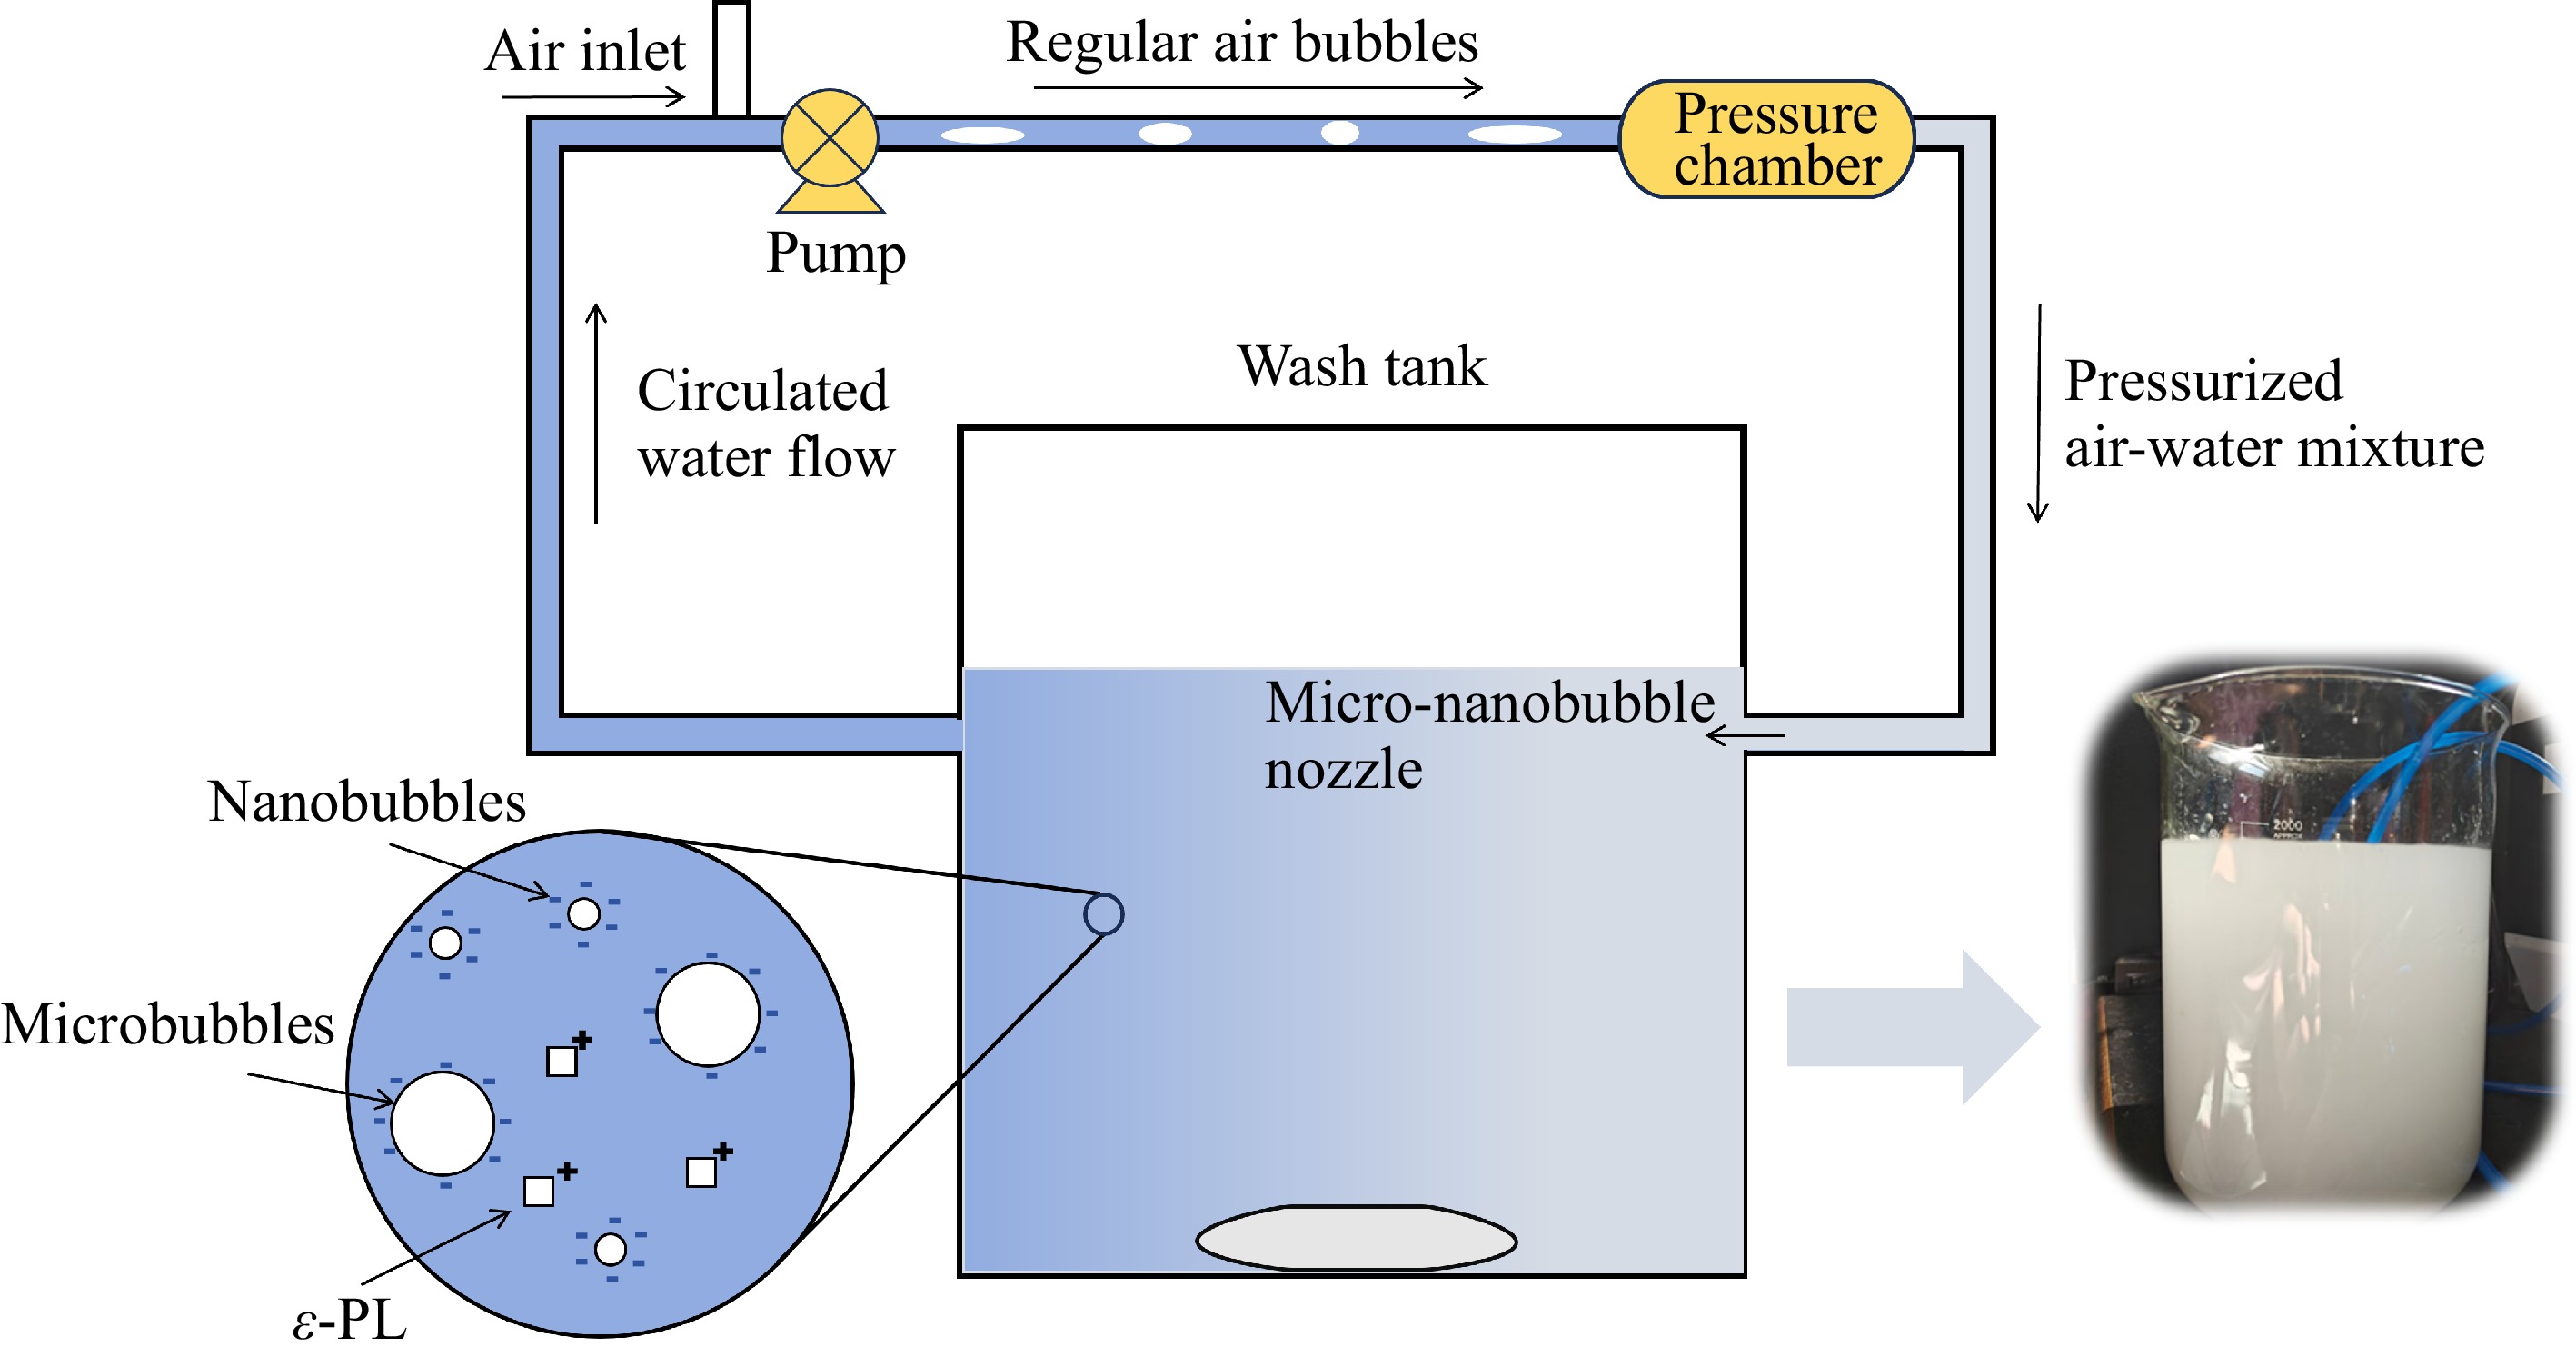
Figure 1.
Micro-nanobubble recirculation fresh produce washing set-up along with the milky physical image of air micro-nanobubbles.
-
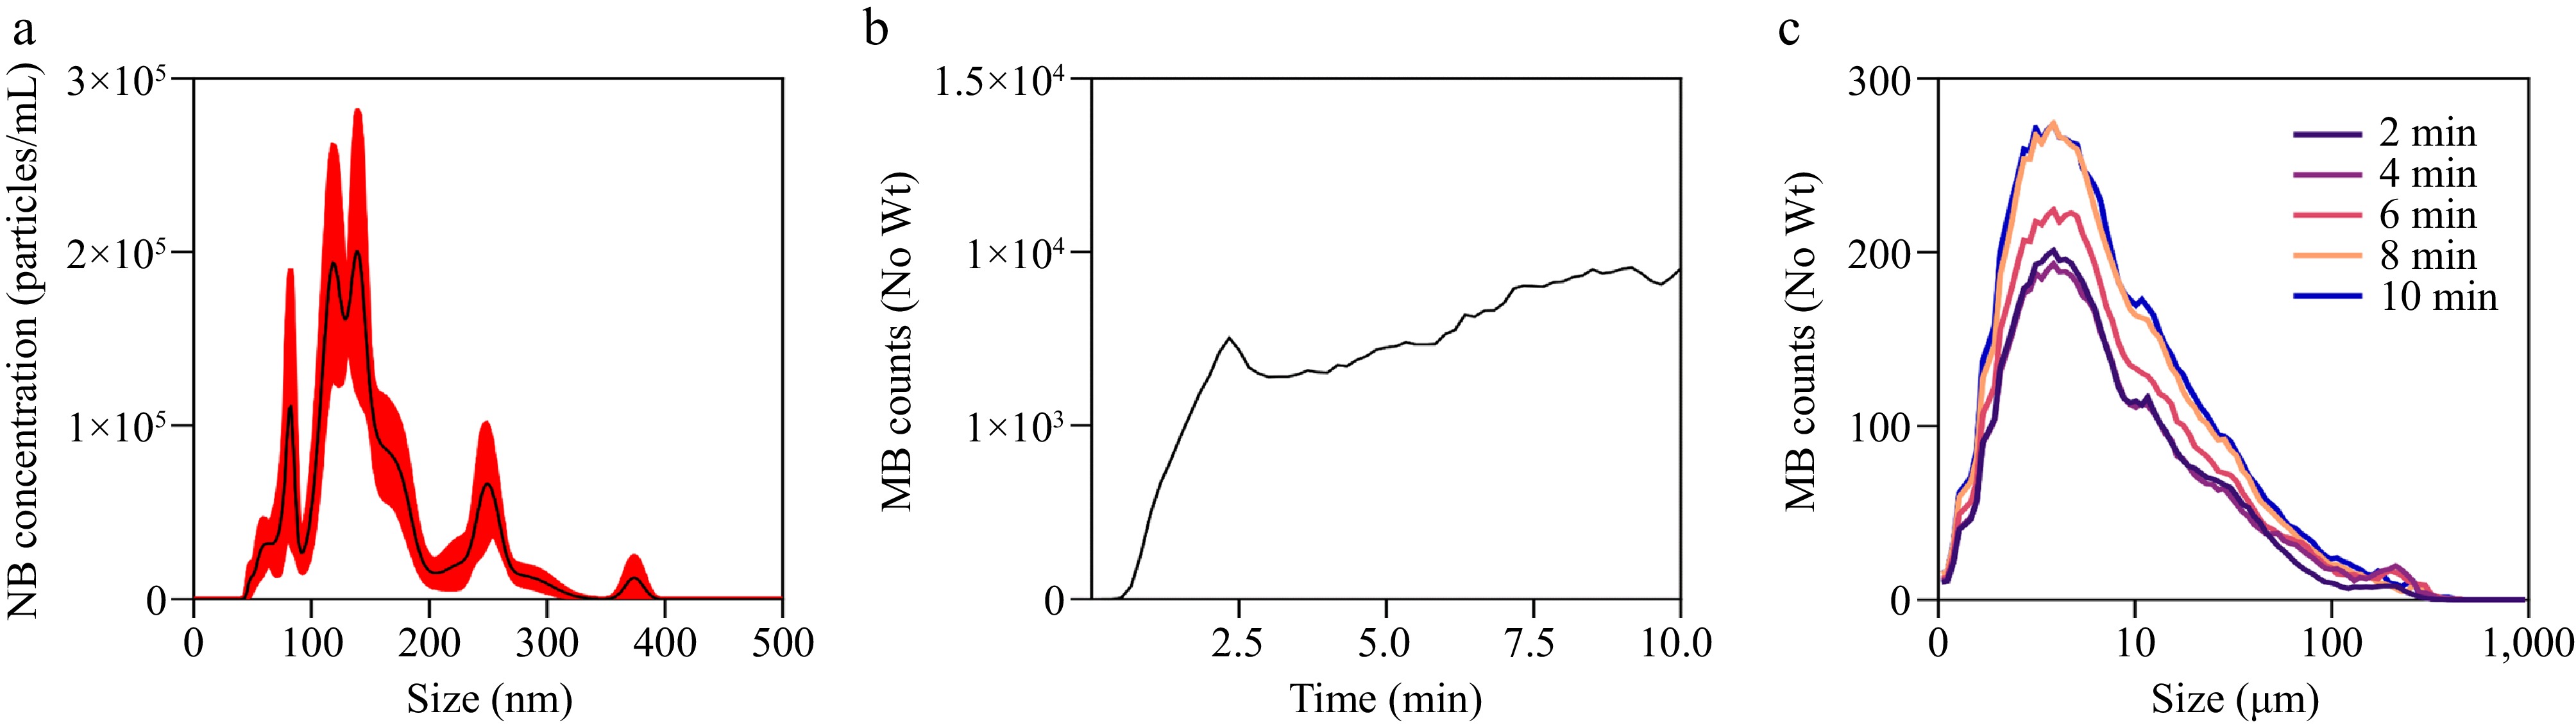
Figure 2.
Characteristics of air micro-nanobubble. (a) Nanobubble number-size of air MNB. (b) Microbubble number of air MNB affected by time. (c) Microbubble number-size curves of air MNB affected by time ( 'No Wt' means that the counts of bubbles did not consider the weight).
-
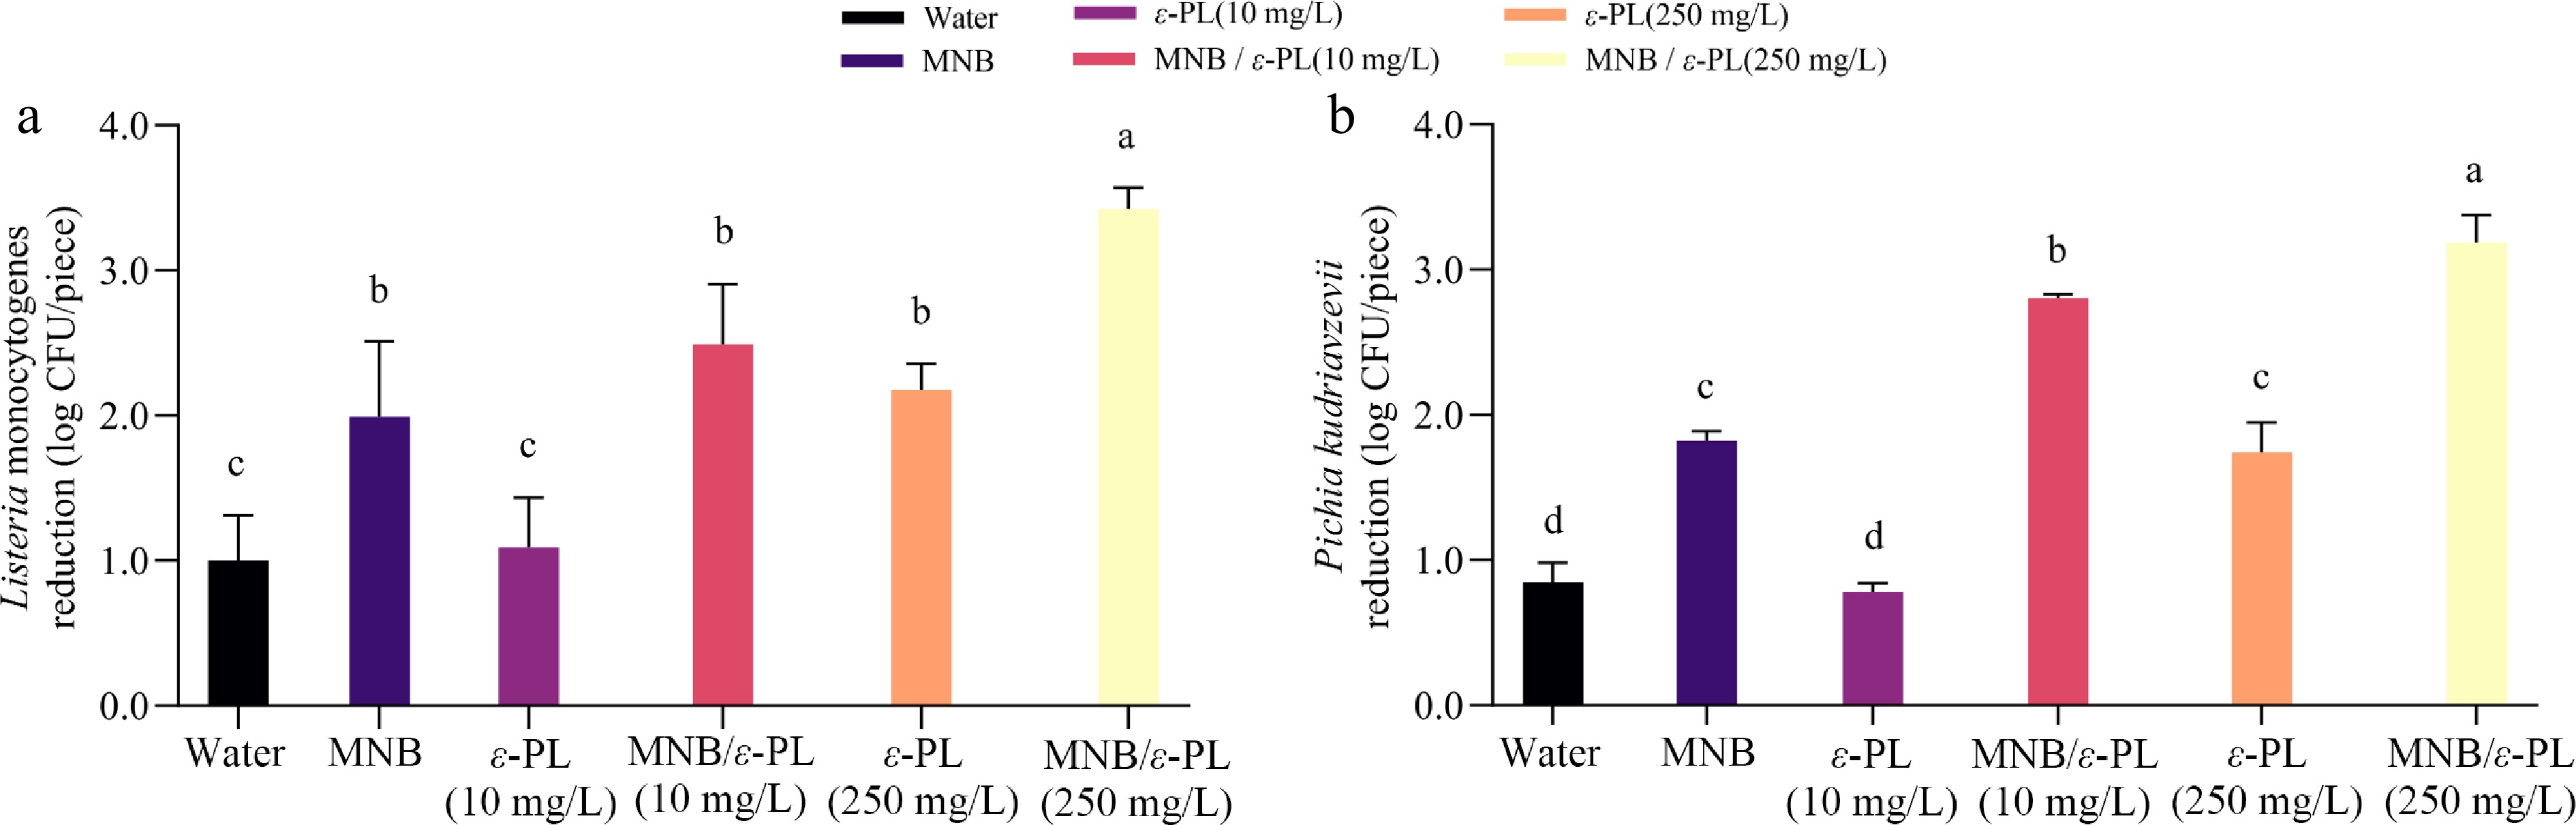
Figure 3.
Effect of MNB-assisted washing with ε-PL on microbial reduction against (a) Listeria monocytogenes, and (b) Pichia kudriavzevii. Difference analysis p < 0.05.
-
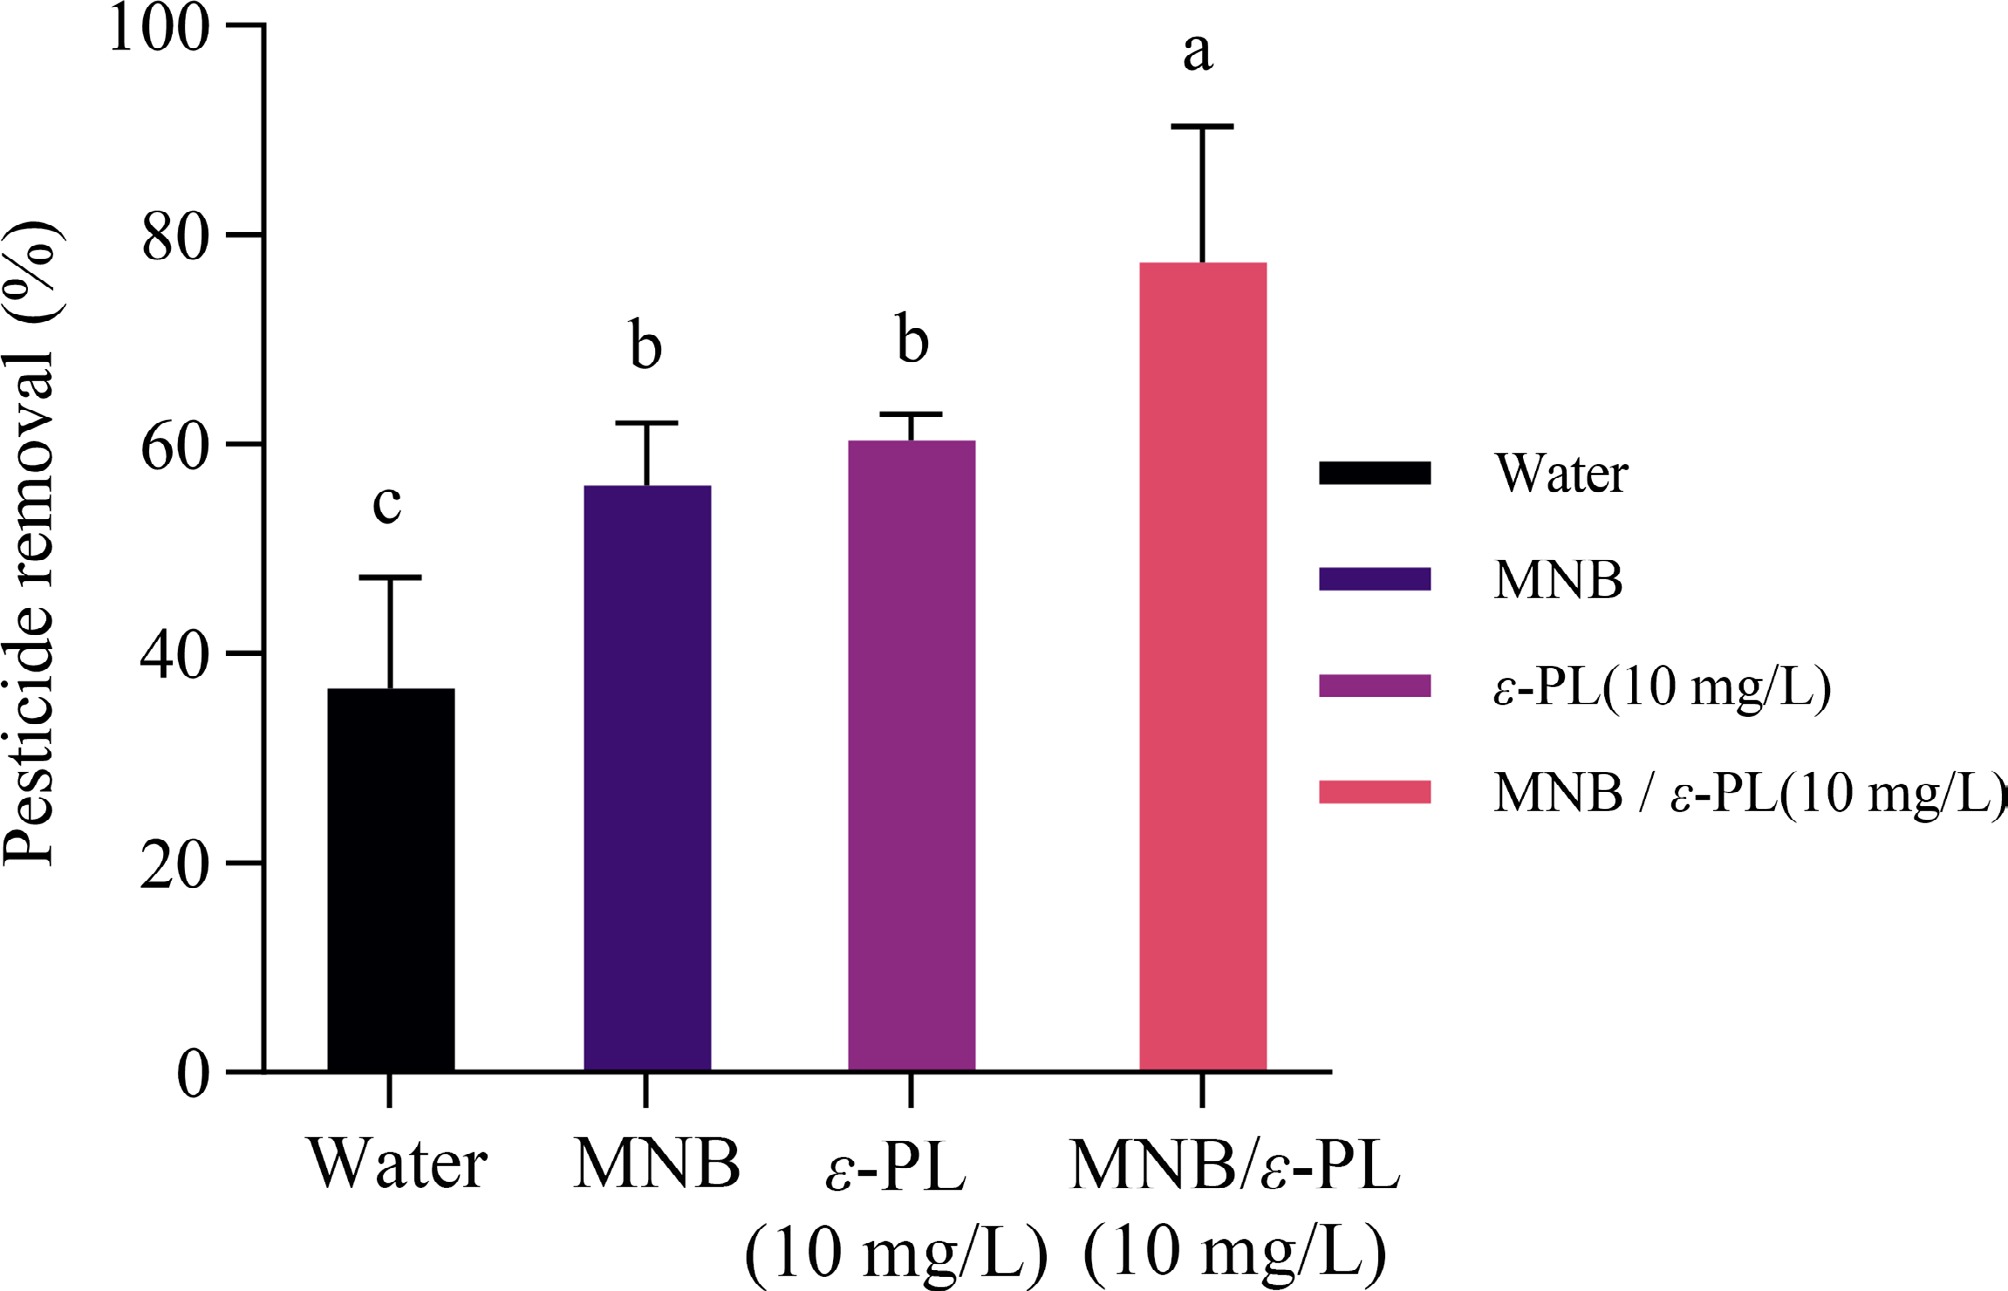
Figure 4.
Effect of micro-nanobubbles combined with ε-PL on the removal rate of trichlorfon residues. Difference analysis p < 0.05.
-
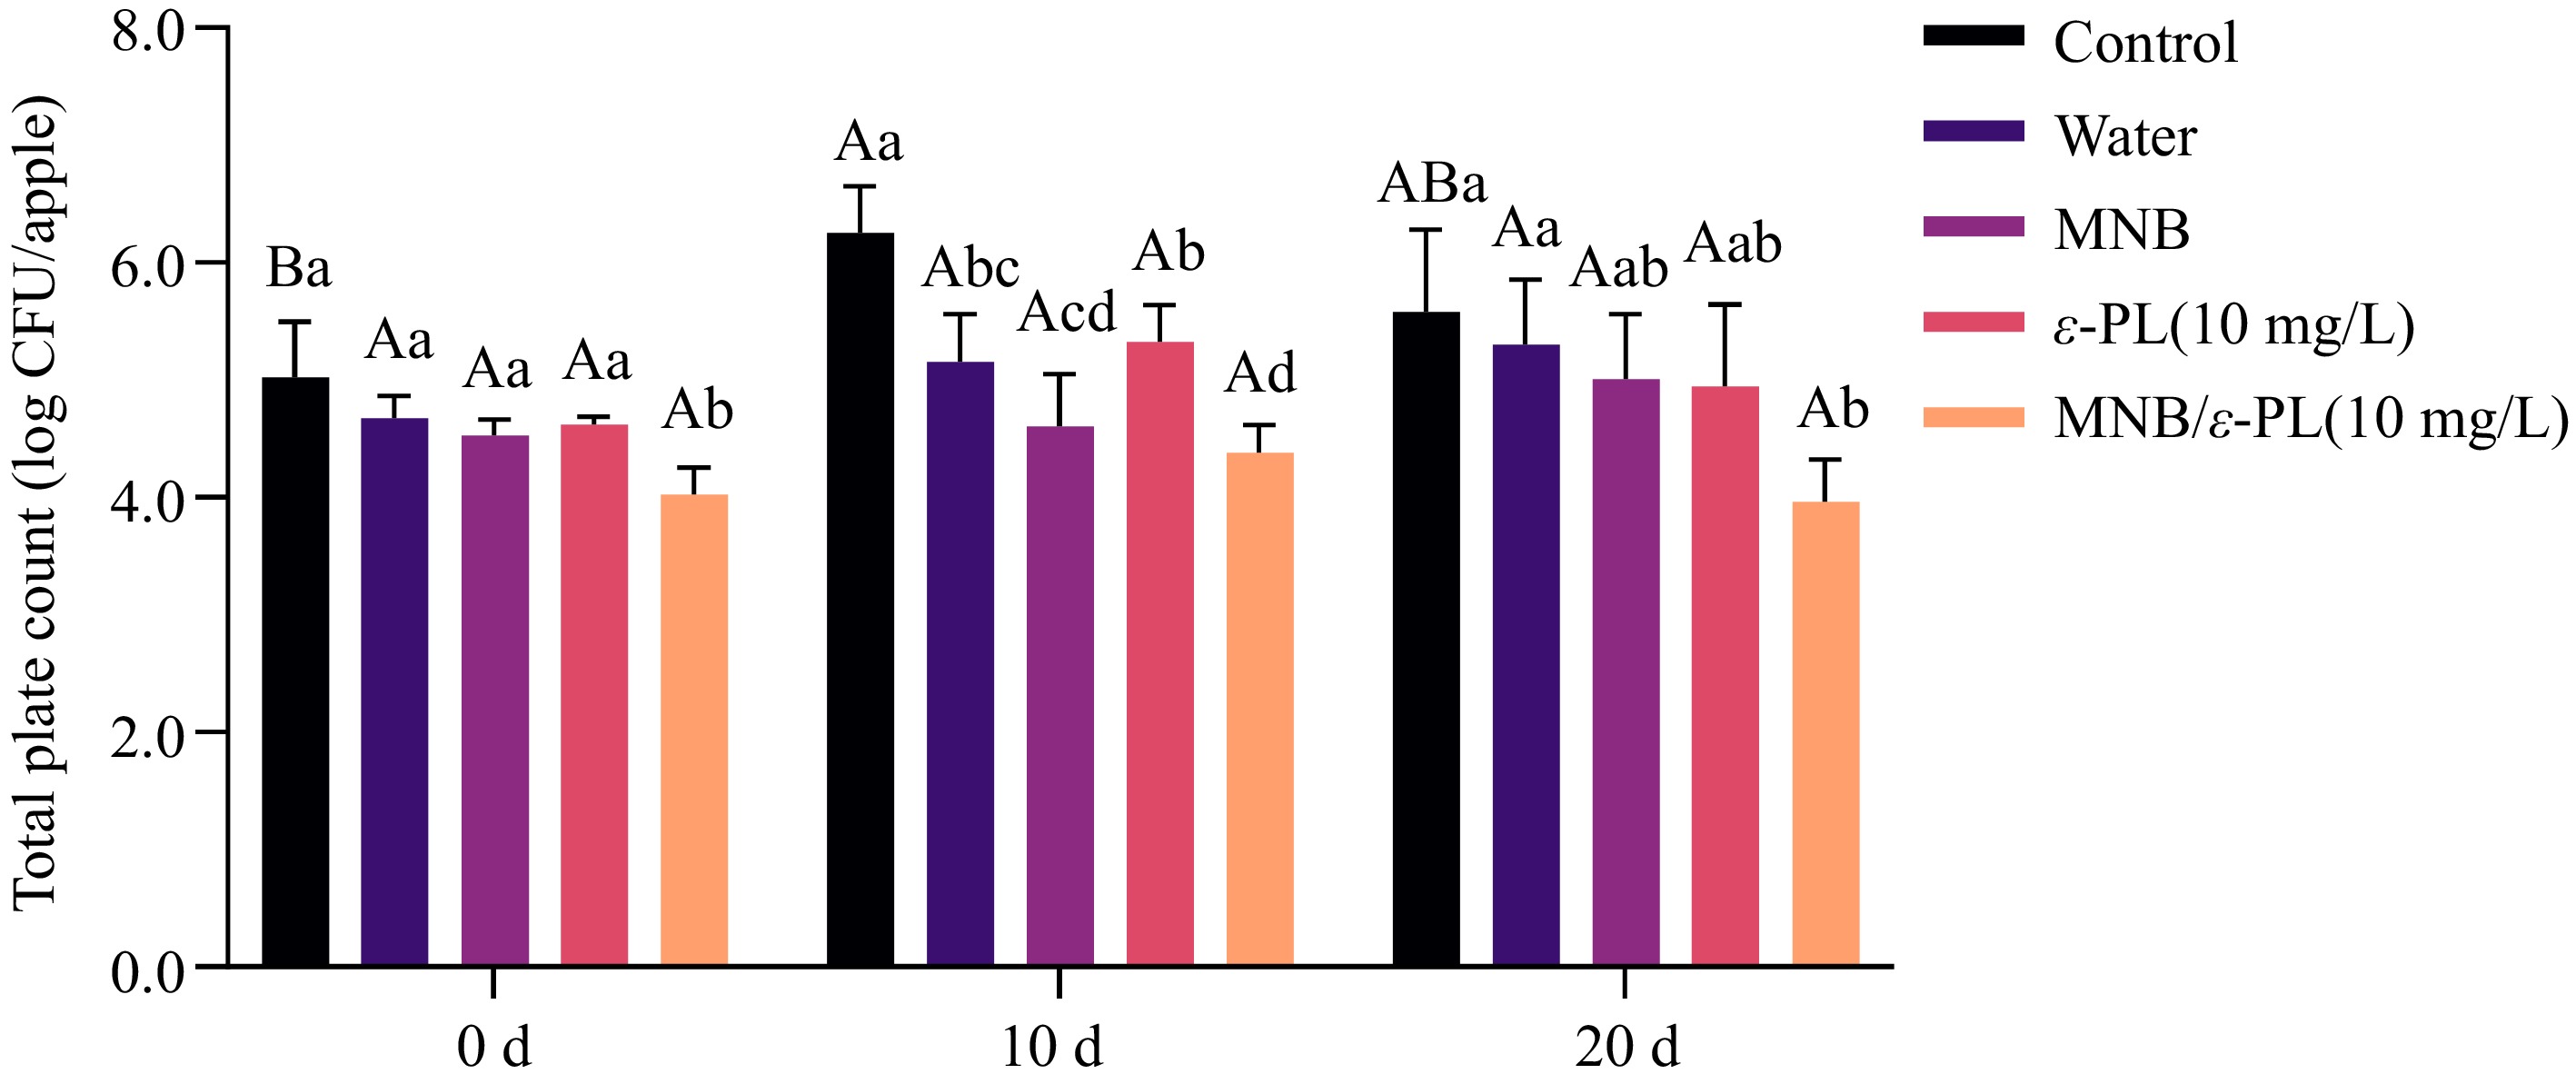
Figure 5.
Total plate count of whole apples during storage. Different uppercase letters indicate significant differences between storage periods within the same treatment group, and different lowercase letters indicate significant differences between treatment groups within the same storage period (p < 0.05).
-
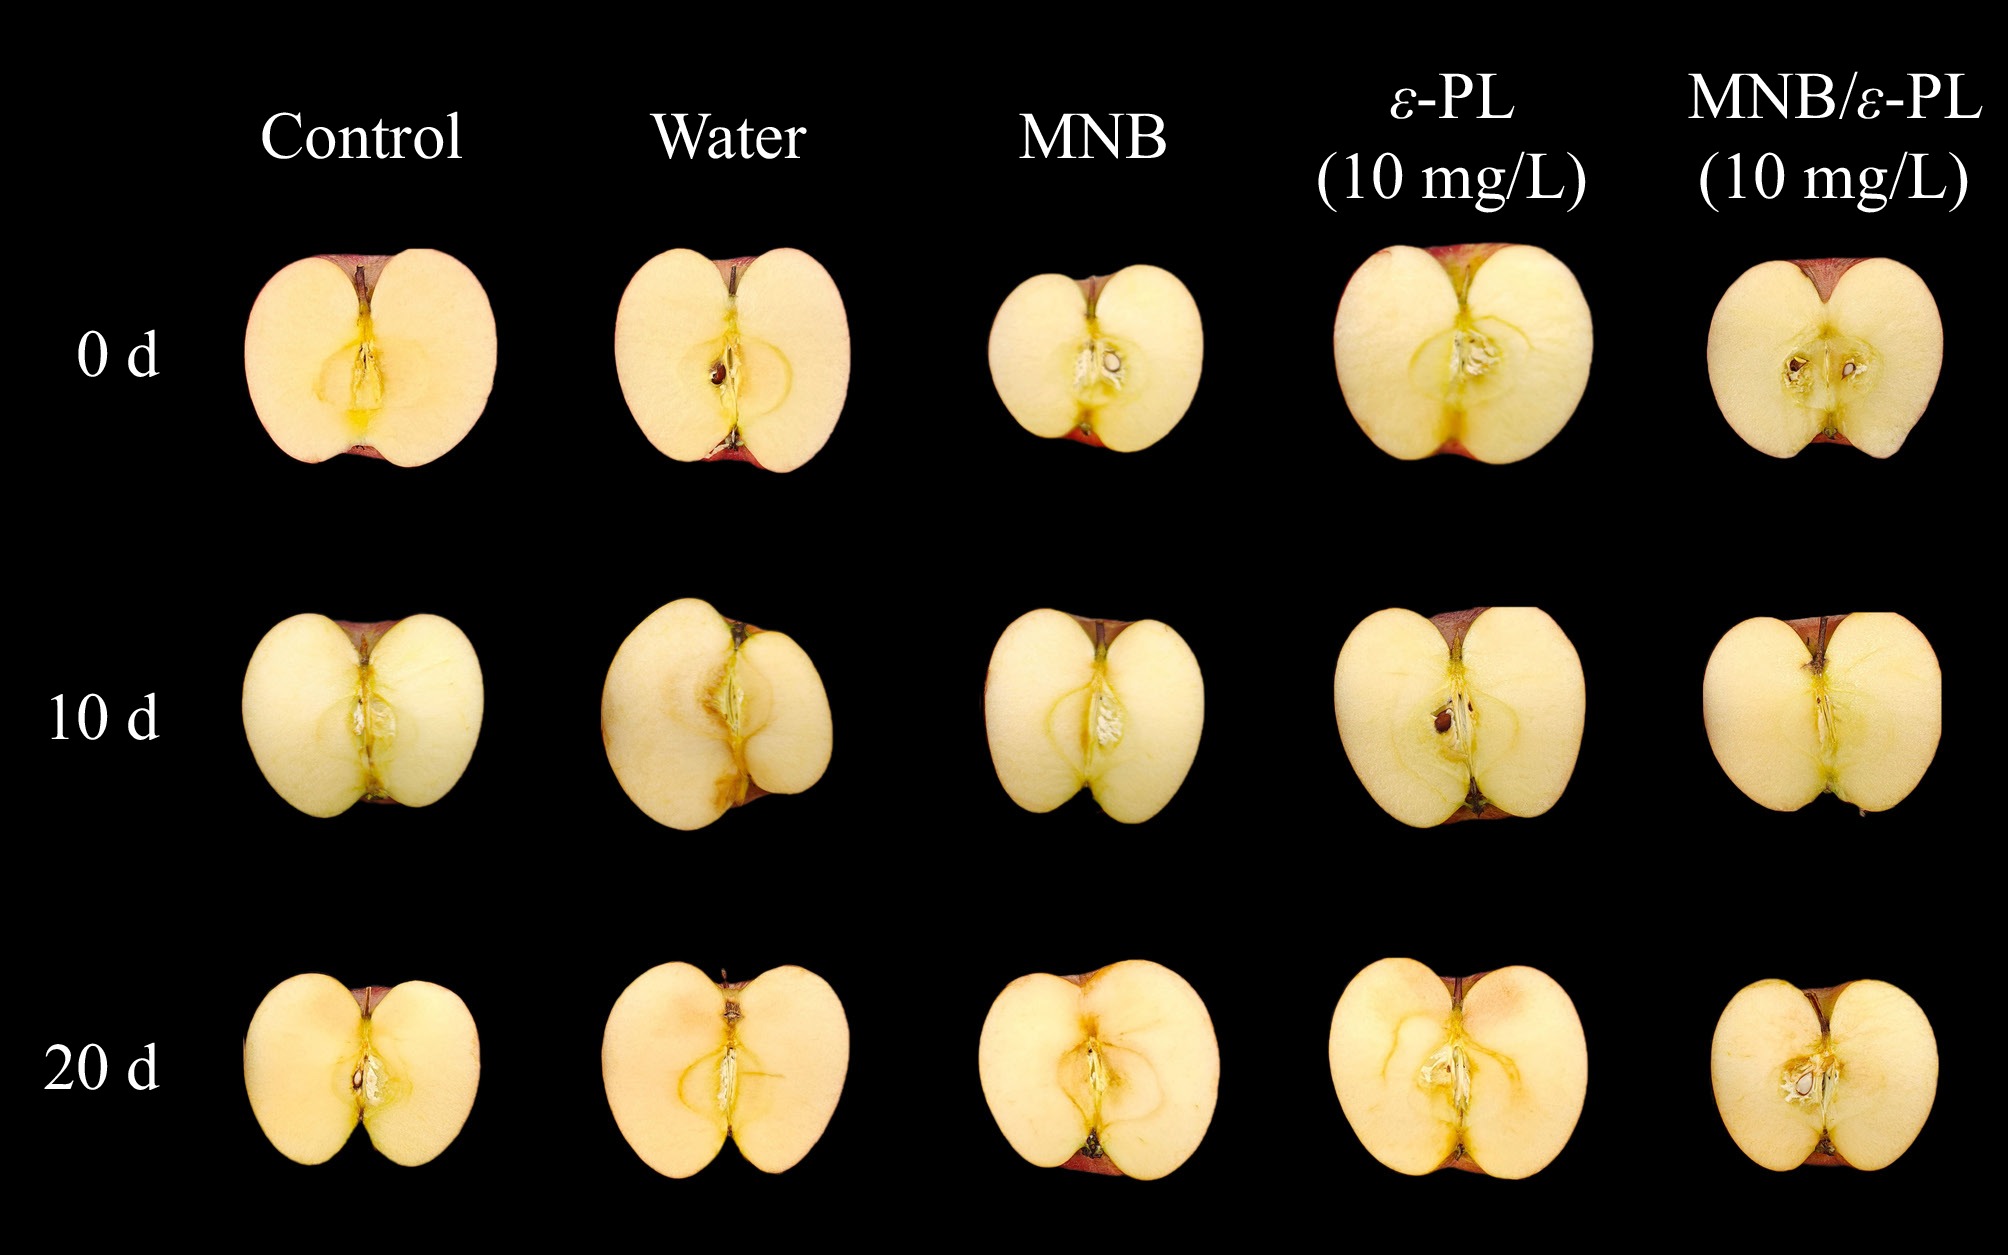
Figure 6.
Pictures of apples during 0–20 d of storage.
-
Treatment MNB ε-PL (10 mg/L) MNB/ε-PL (10 mg/L) ε-PL (250 mg/L) MNB/ε-PL (250 mg/L) Zeta potential (mV) −17.53 ±1.68 13.38 ± 3.80 22.50 ± 5.50 26.27 ± 3.29 20.27 ± 1.62 pH 7.29 ± 0.13 6.13 ± 0.16 4.93 ± 0.03 6.57 ± 0.14 5.09 ± 0.04 Table 1.
The ZP and pH of different treatment groups.
-
Quality indicators Storage time (d) Control Water MNB ε-PL (10 mg/L) MNB/ε-PL (10 mg/L) L* 0 39.6 ± 4.3Aa 38.9 ± 5.2Aa 38.0 ± 4.3Aa 38.3 ± 6.7Aa 40.6 ± 8.8Aa 10 40.0 ± 4.3Aa 42.4 ± 5.3Aa 42.4 ± 4.3Aa 40.9 ± 6.7Aa 42.7 ± 8.8Aa 20 35.7 ± 2.2Aa 39.6 ± 5.5Aa 38.0 ± 2.8Aa 42.3 ± 4.0Aa 40.1 ± 2.5Aa a* 0 19.7 ± 2.2Aa 17.6 ± 2.8Aa 19.5 ± 1.2Aa 17.6 ± 0.8Aa 15.4 ± 4.6Aa 10 16.4 ± 2.2Ba 15.1 ± 2.8Aa 14.3 ± 1.2Aa 12.8 ± 0.1Ba 11.6 ± 4.6Aa 20 15.1 ± 0.4Ba 13.2 ± 2.2Aa 14.8 ± 1.6Aa 12.3 ± 0.9Ba 12.9 ± 2.6Aa b* 0 13.5 ± 2.2Aa 13.5 ± 4.0Aa 12.4 ± 1.7Aa 14.7 ± 1.9Aa 13.1 ± 4.2Aa 10 17.3 ± 2.2Aa 18.0 ± 4.0Aa 18.0 ± 1.7Aa 19.7 ± 1.9Aa 19.9 ± 4.2Aa 20 16.2 ± 2.1Aa 14.5 ± 4.1Aa 16.6 ± 3.2Aa 16.8 ± 5.3Aa 16.0 ± 5.4Aa BI 0 75.1 ± 3.4Ba 73.7 ± 7.4Aa 74.1 ± 7.2Ba 69.3 ± 6.8Ba 65.5 ± 8.8Ba 10 83.8 ± 4.1Aa 79.3 ± 6.5Aa 78.2 ± 8.4Aba 87.8 ± 6.5Aa 80.0 ± 11.5ABa 20 88.3 ± 4.1Aa 85.4 ± 6.9Aa 91.7 ± 8.4Aa 88.6 ± 6.5Aa 96.5 ± 11.5Aa Hardness (N) 0 73.4 ± 8.0ABab 78.3 ± 7.4Aa 69.6 ± 6.6Aab 63.7 ± 10.7Bb 79.7 ± 13.4Aa 10 80.1 ± 9.6Aa 75 ± 11.5Aba 74.4 ± 13.6Aa 83.3 ± 5.0Aa 75.3 ± 12.3Aa 20 64.9 ± 10.7Ba 65.6 ± 8.5Ba 77.8 ± 6.6Aa 72.6 ± 12.7Ba 68.1 ± 7.8Aa Different uppercase letters indicate significant differences between storage periods within the same treatment group, and different lowercase letters indicate significant differences between treatment groups within the same storage period (p < 0.05). Table 2.
Effect of micro-nanobubbles and ε-PL on apple quality and colony size.
Figures
(6)
Tables
(2)