-
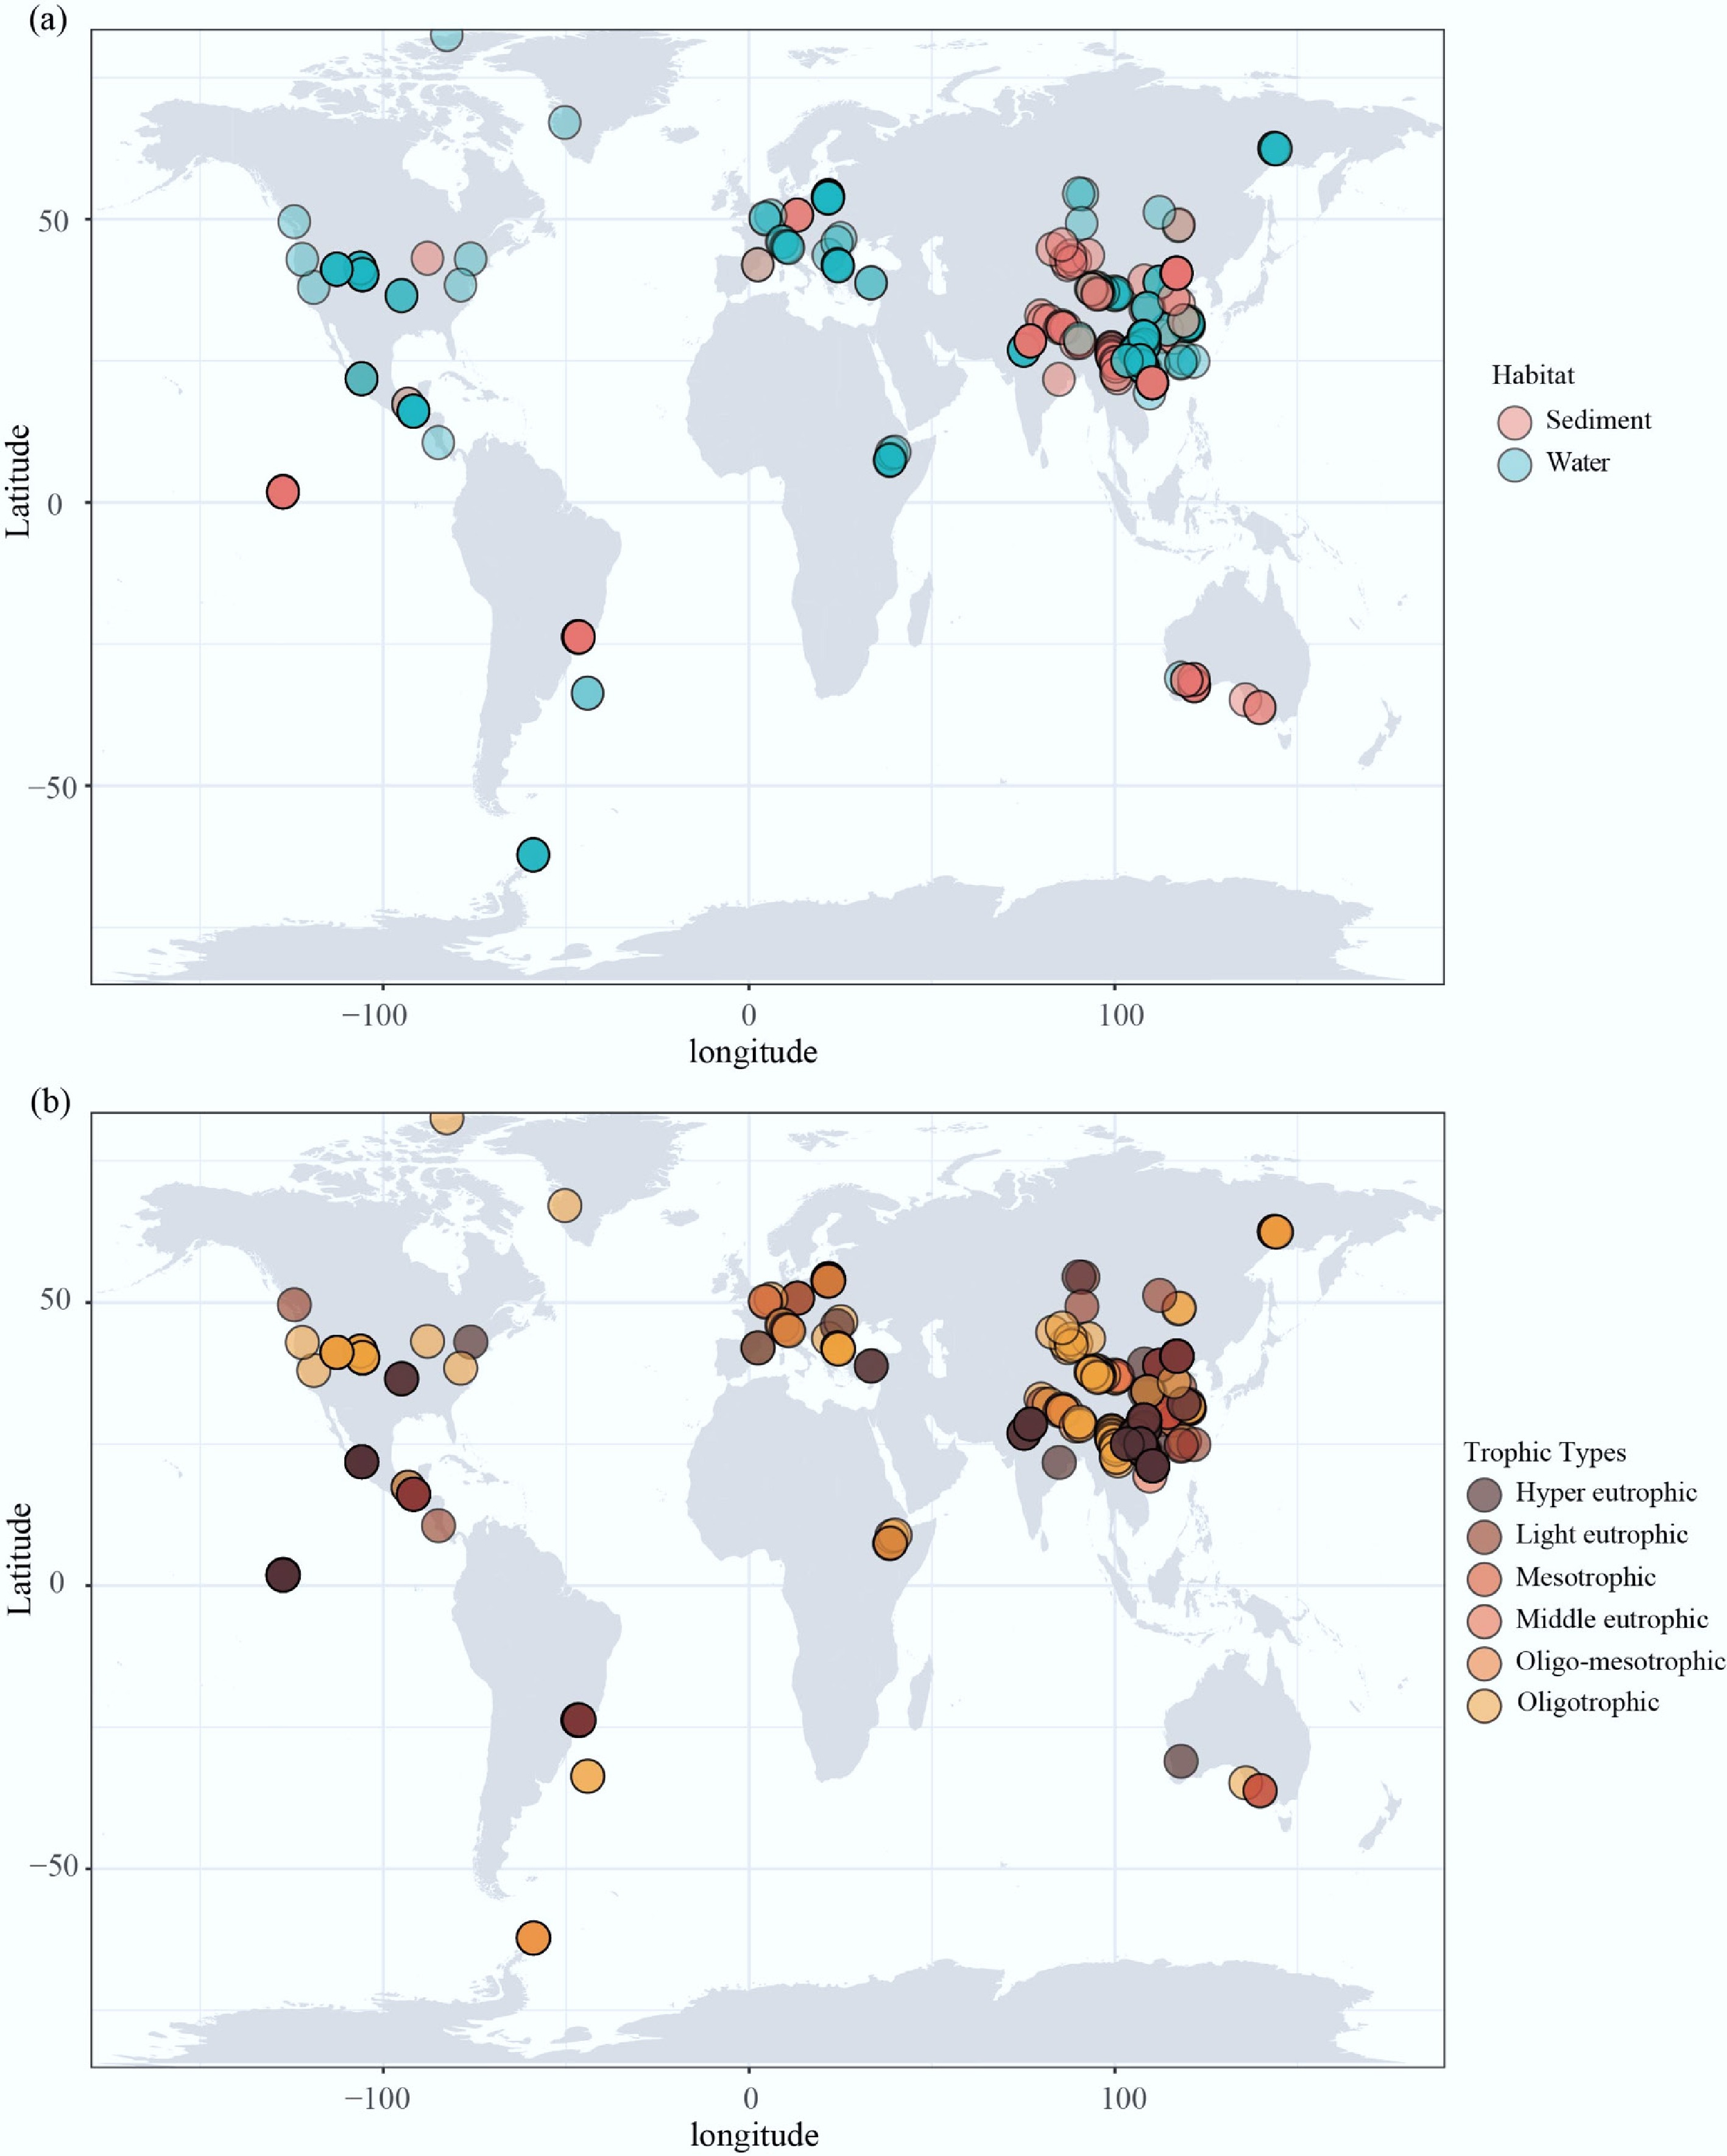
Figure 1.
Global distribution map of 379 selected lakes reservoirs. Global map showing locations, (a) sample types, and (b) trophic types of 379 lakes and reservoirs studied here.
-
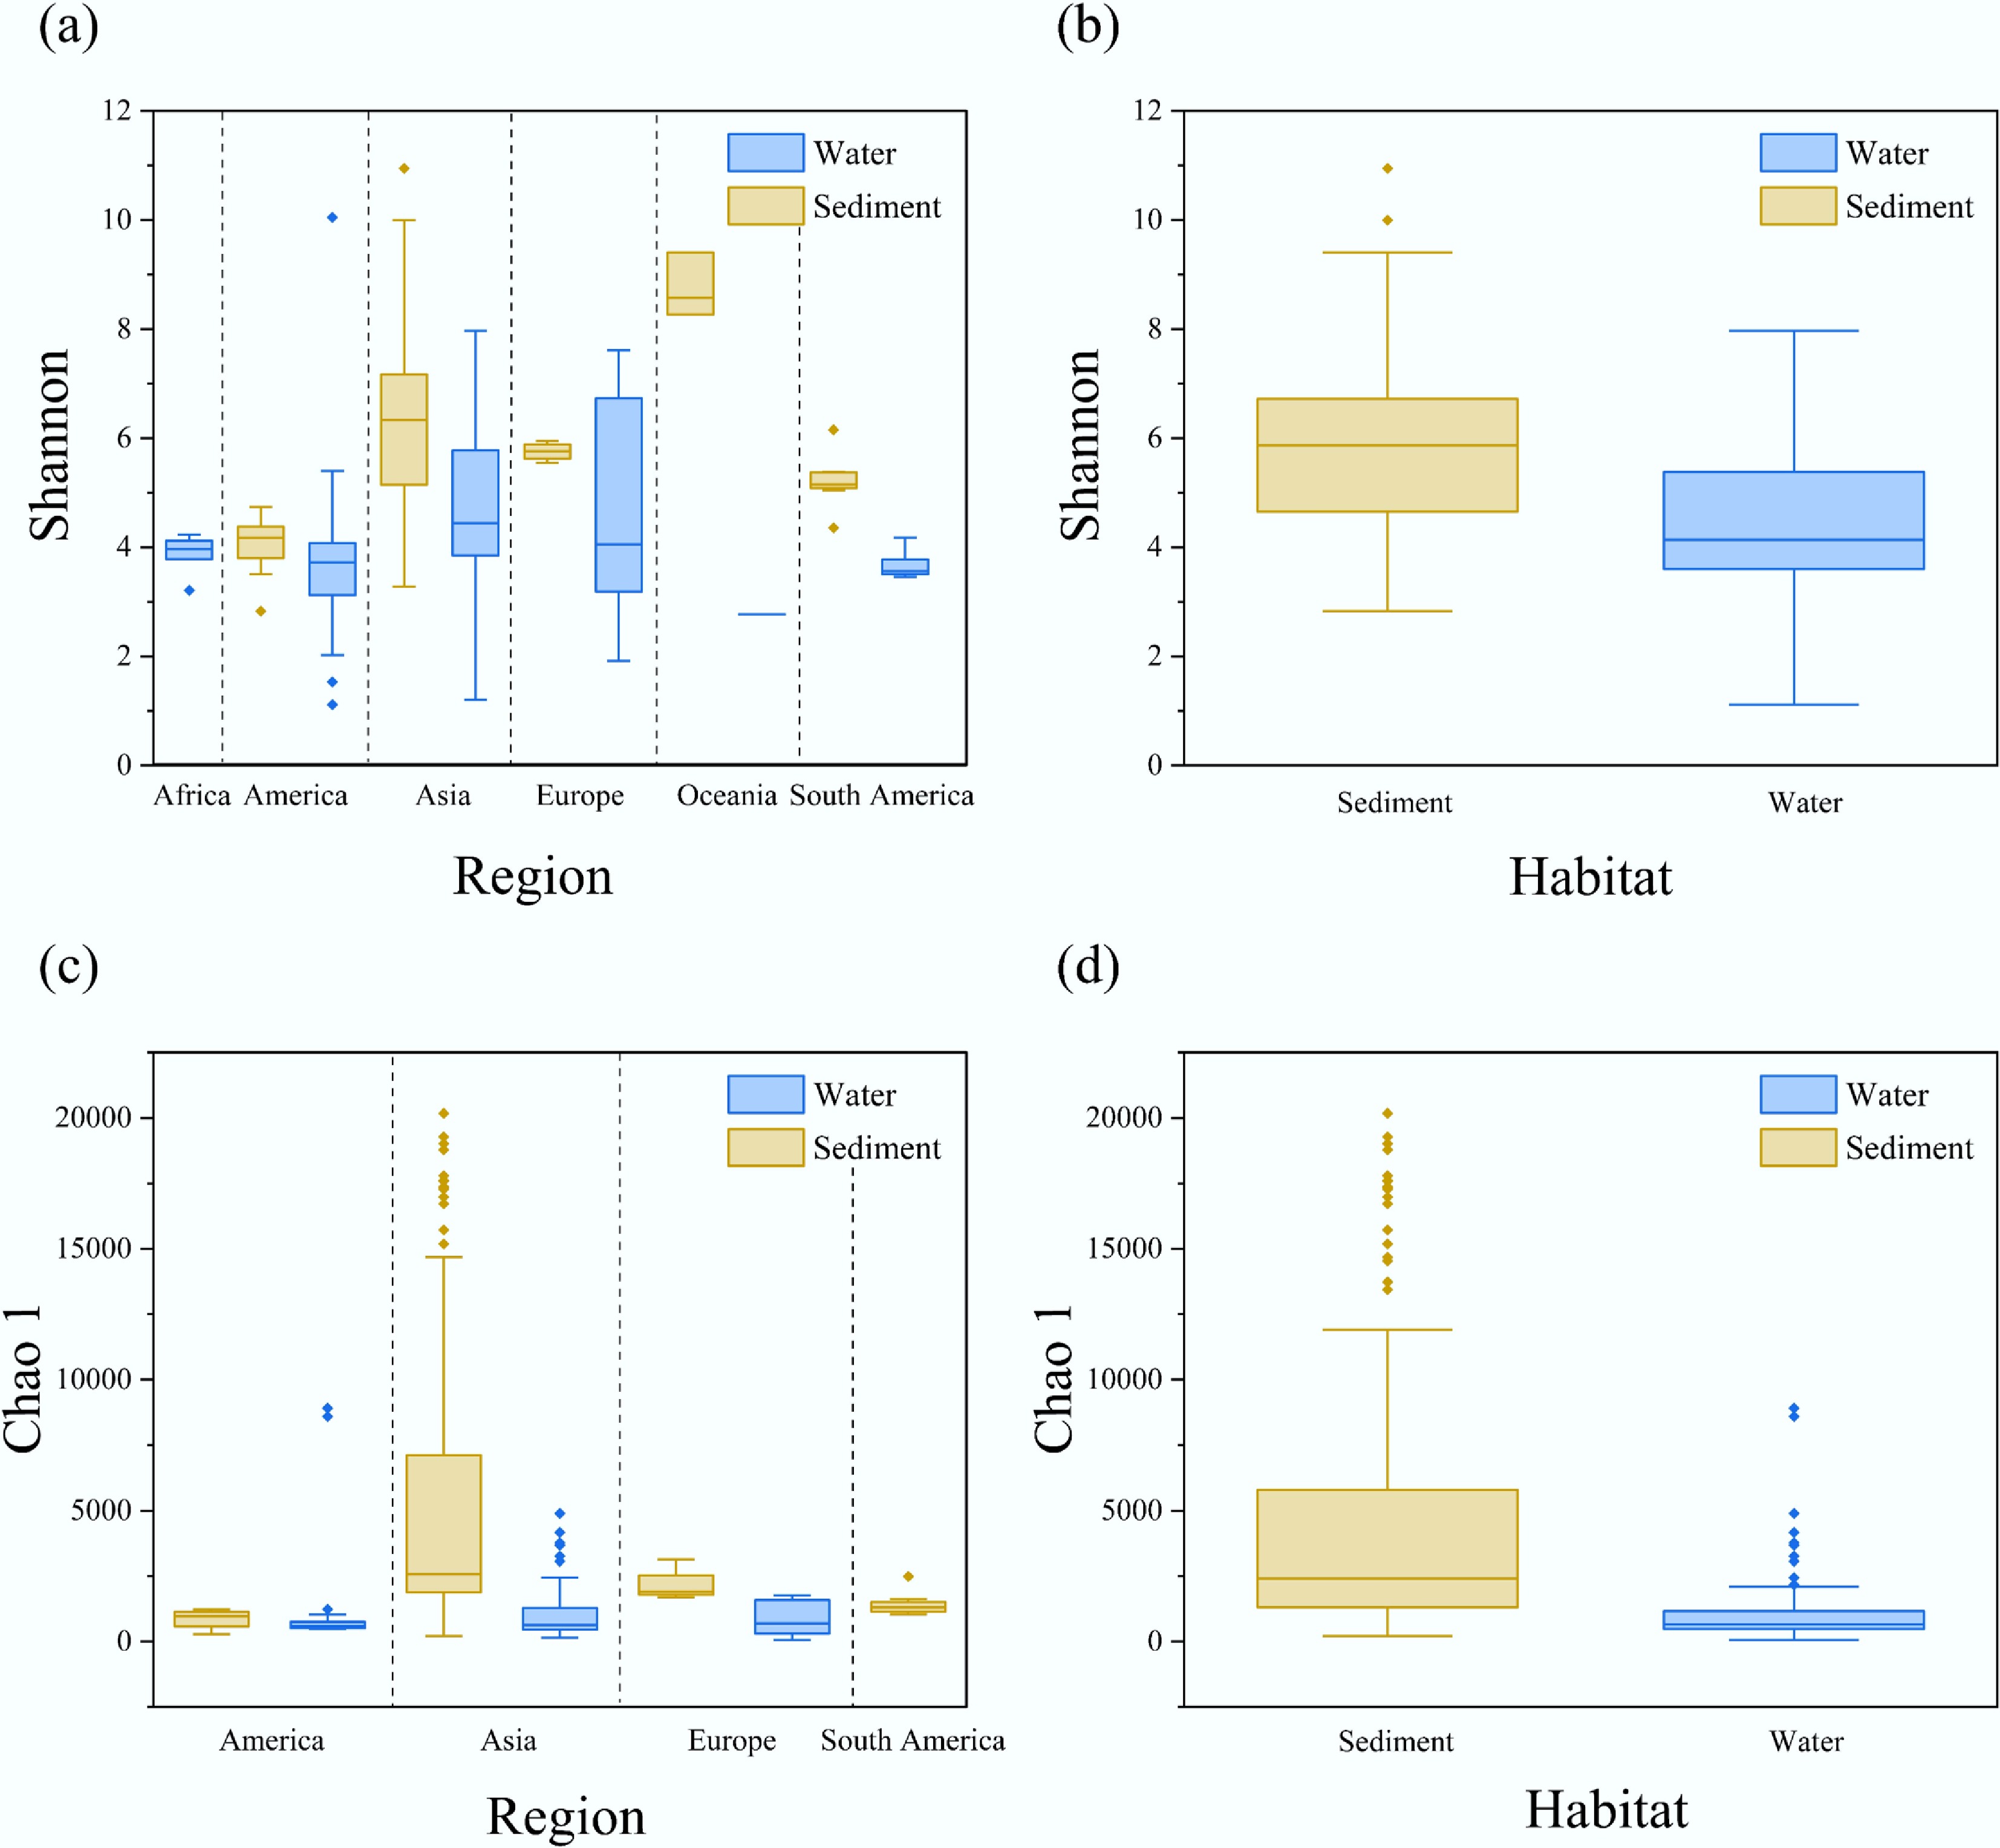
Figure 2.
Changes in α-diversity across habitats and regions. (a) Shannon index, and (c) Chao 1 index of bacterial communities in sediment and water habitats across different regions. An overall comparison of (b) Shannon index, and (d) Chao 1 index between sediment and water habitats, with sediment shown in brown, and water shown in blue.
-
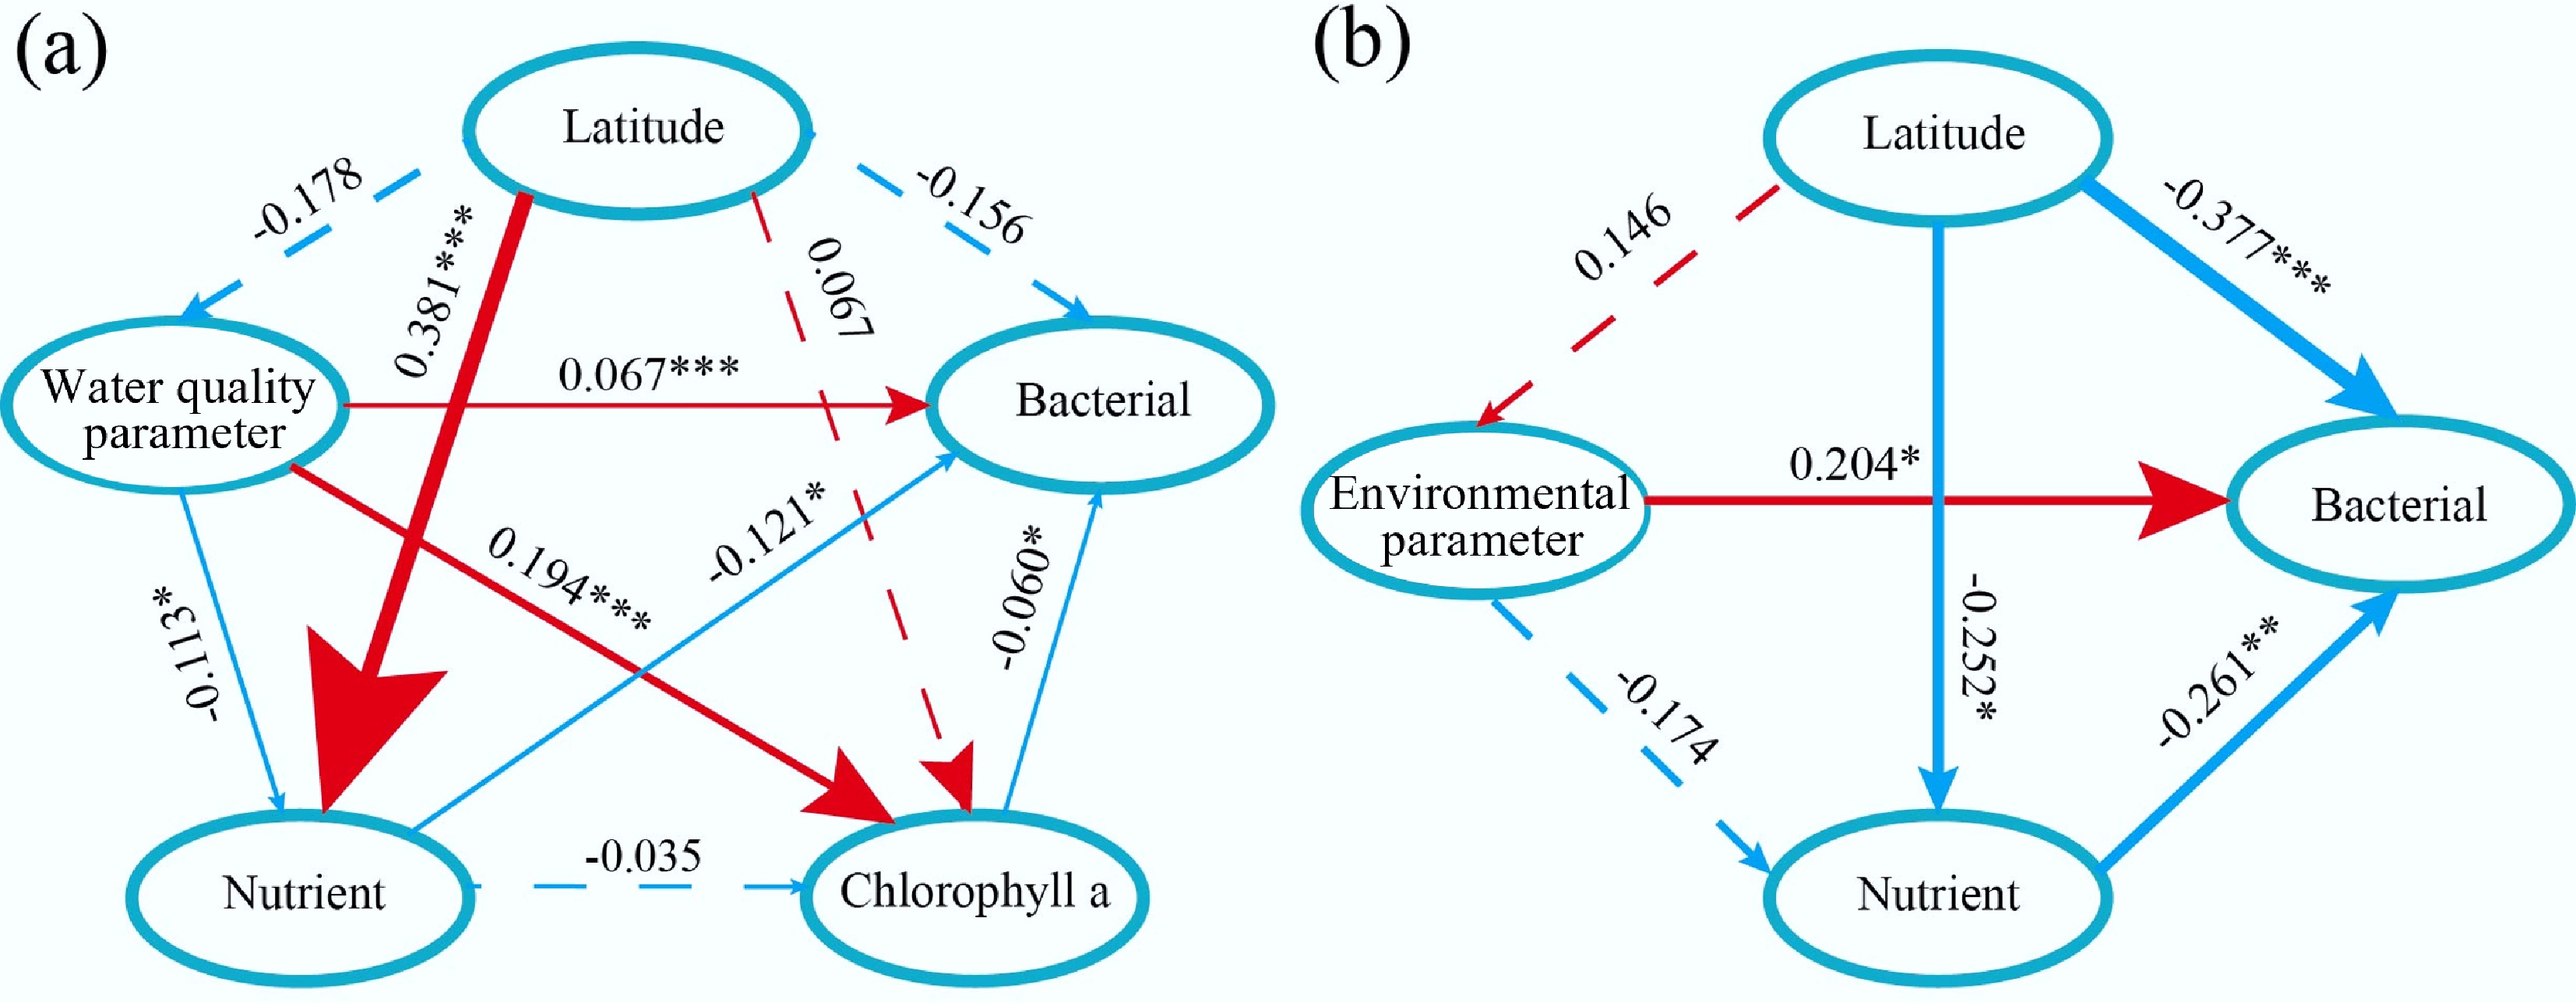
Figure 3.
Controlling factors of different bacterial communities. Partial least squares-path models illustrate the effects of different factors on bacterial diversity variation in (a) water, and (b) sediment. Red lines indicate positive effects, and blue lines indicate negative effects. Significance level, * p < 0.05, ** p < 0.01, *** p < 0.001.
-
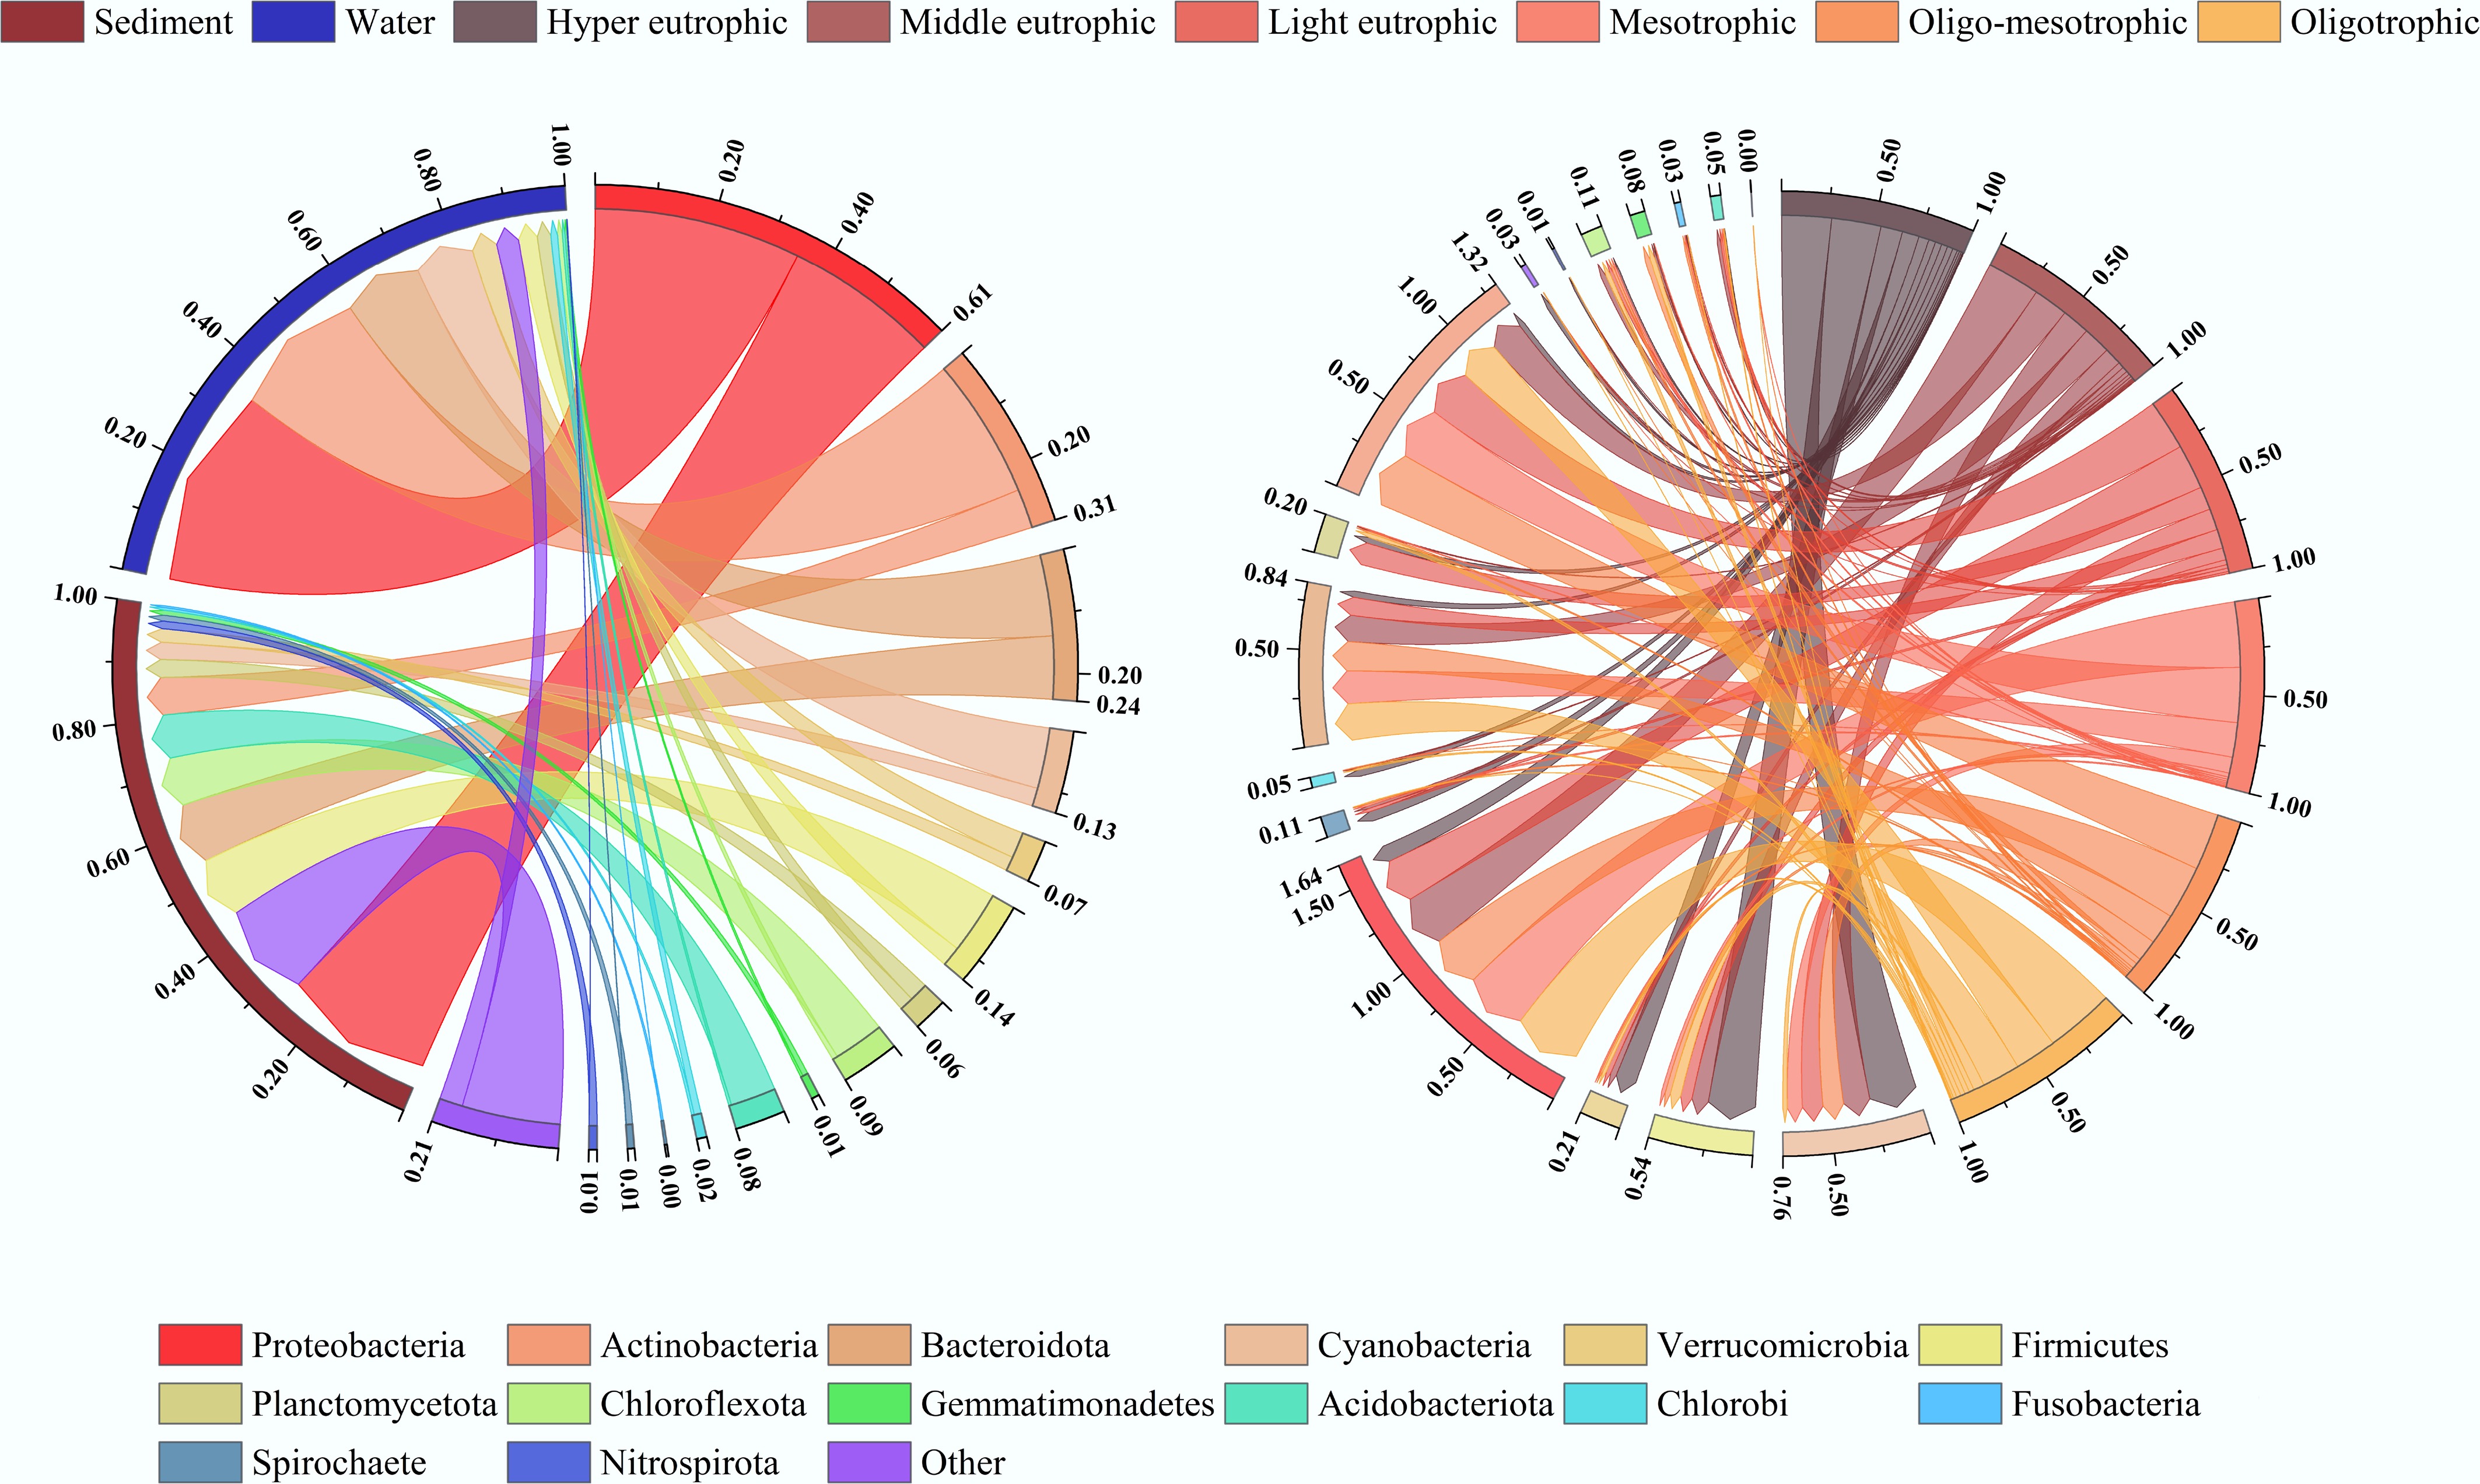
Figure 4.
Bacterial community compositional variation. (a) Distribution of bacterial phyla in water and sediment samples from lakes and reservoirs. (b) Distribution of bacterial phyla across different trophic types of lakes and reservoirs. The width of the lines in the figure reflects the relative abundances of bacterial phyla (summed to 100%).
-
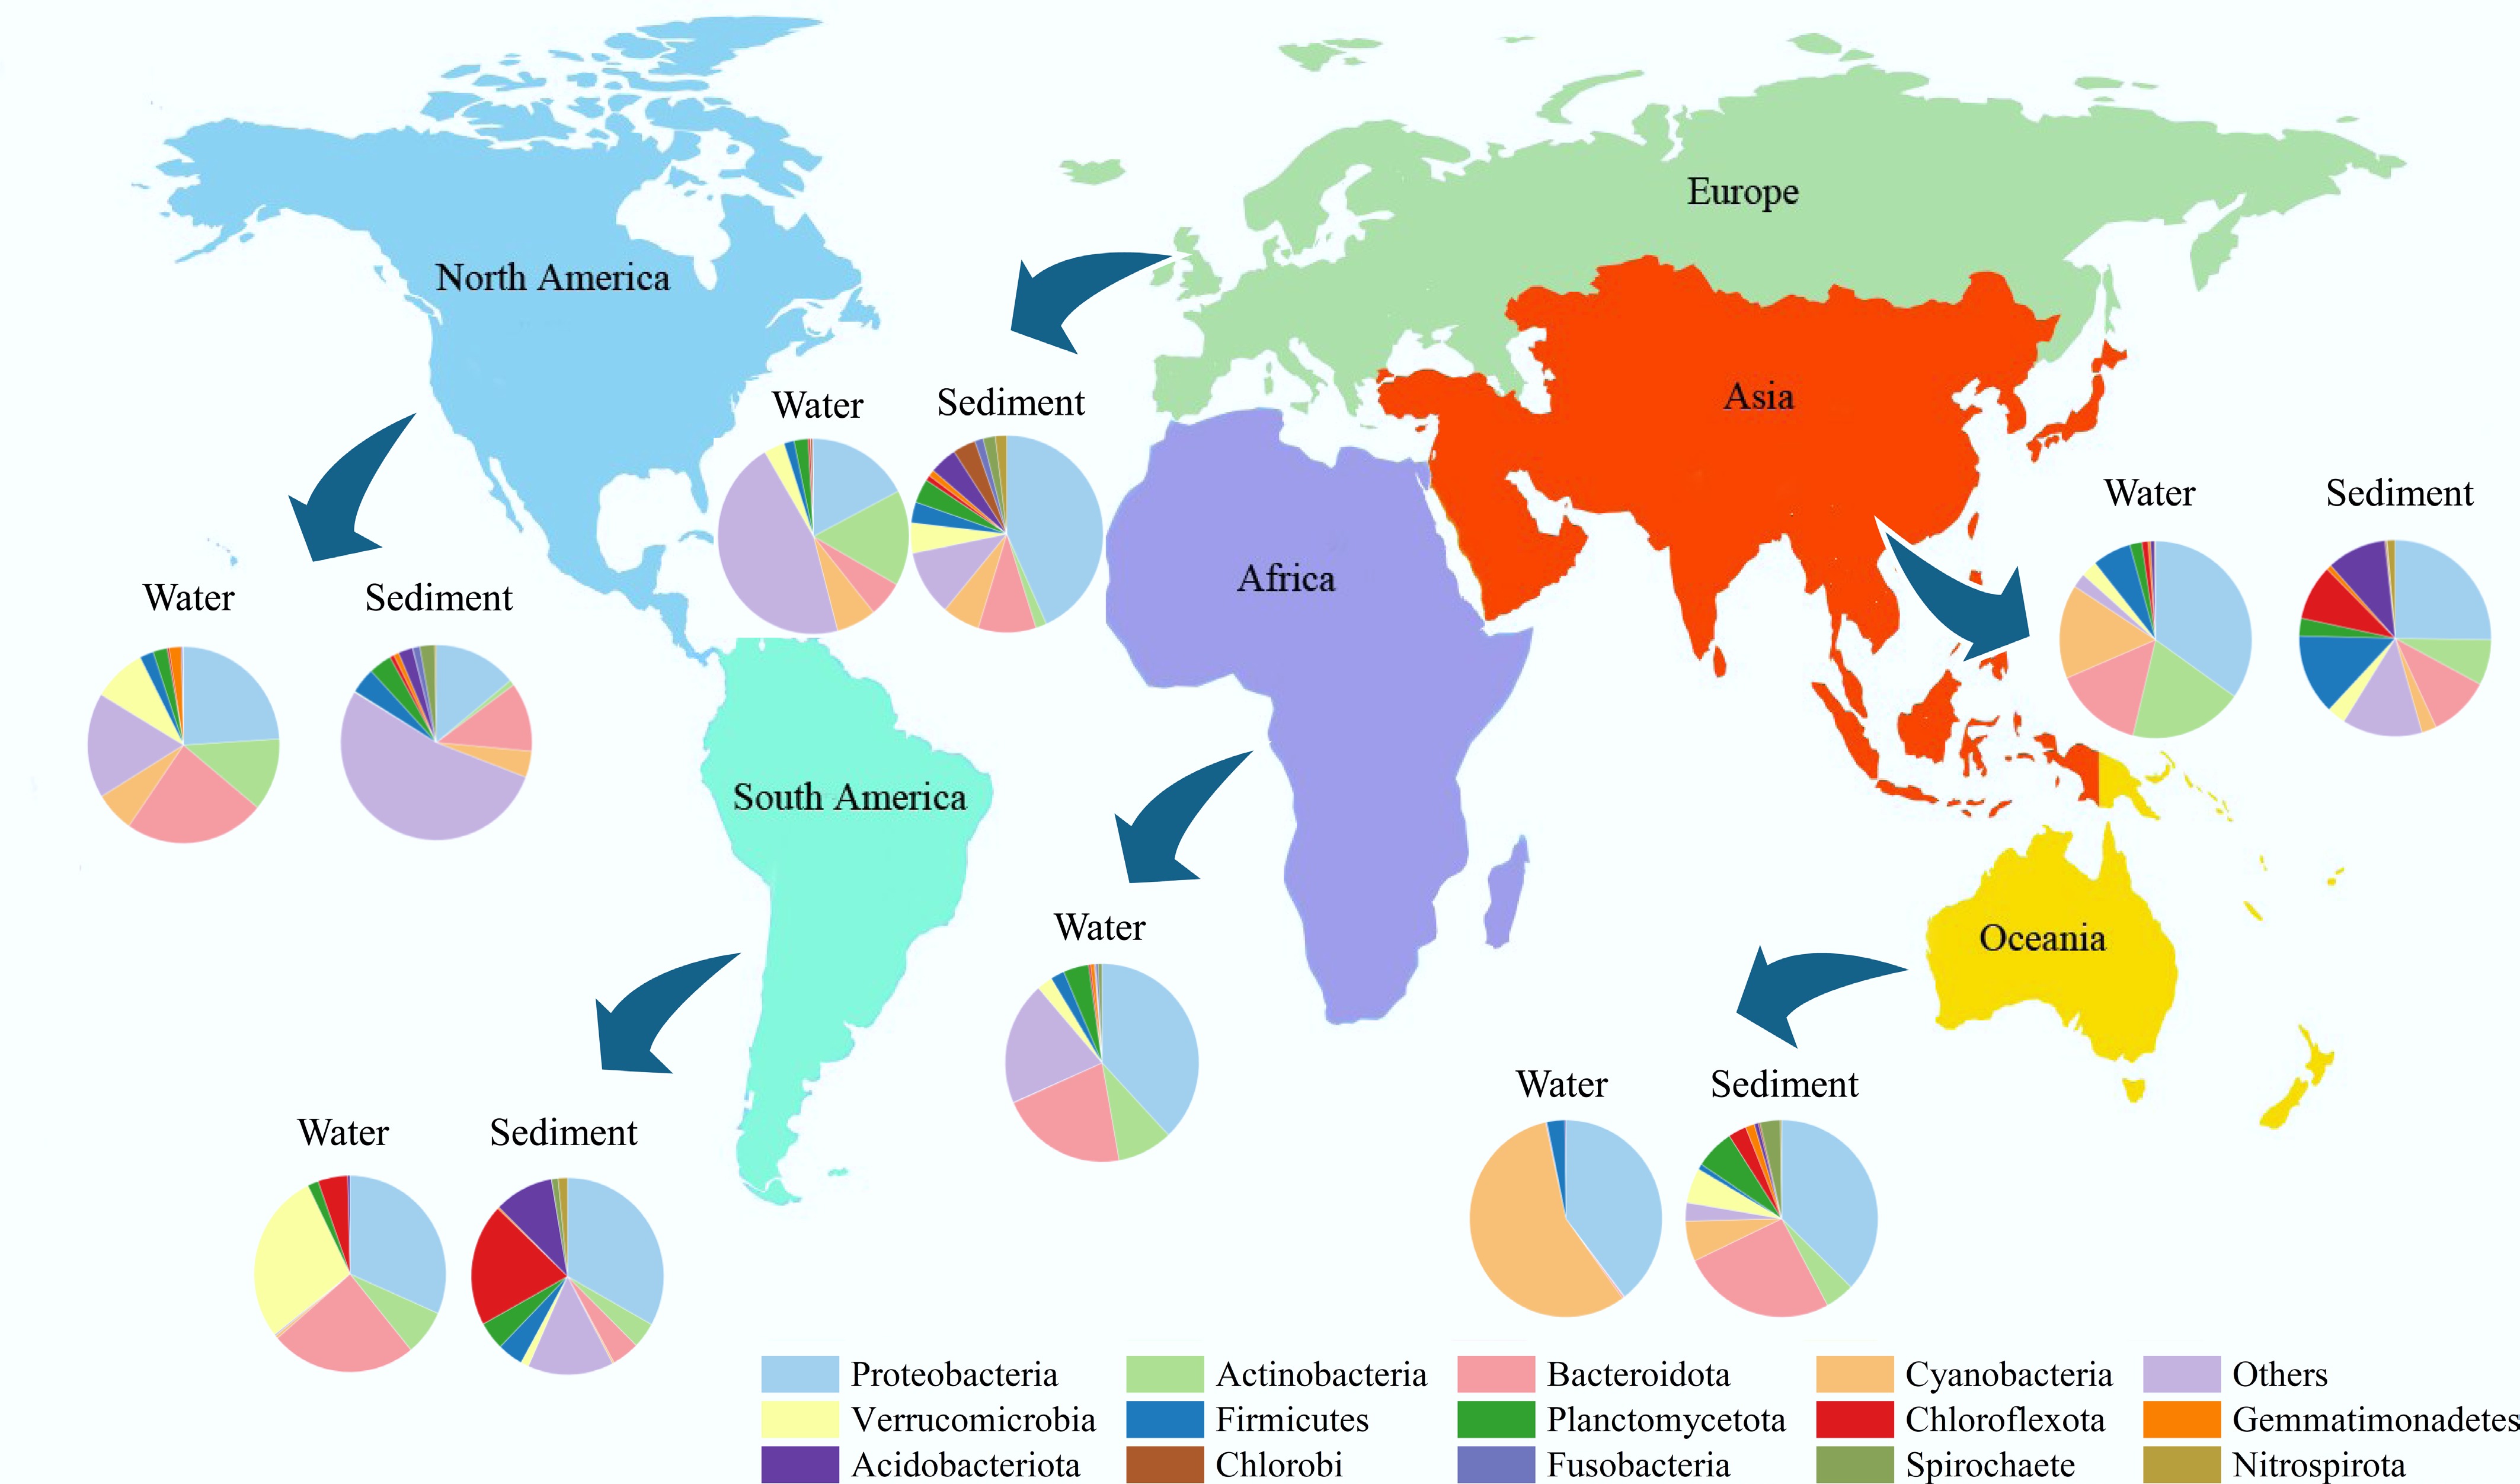
Figure 5.
Composition of bacterial communities in waters and sediments at the phylum level among regions.
-
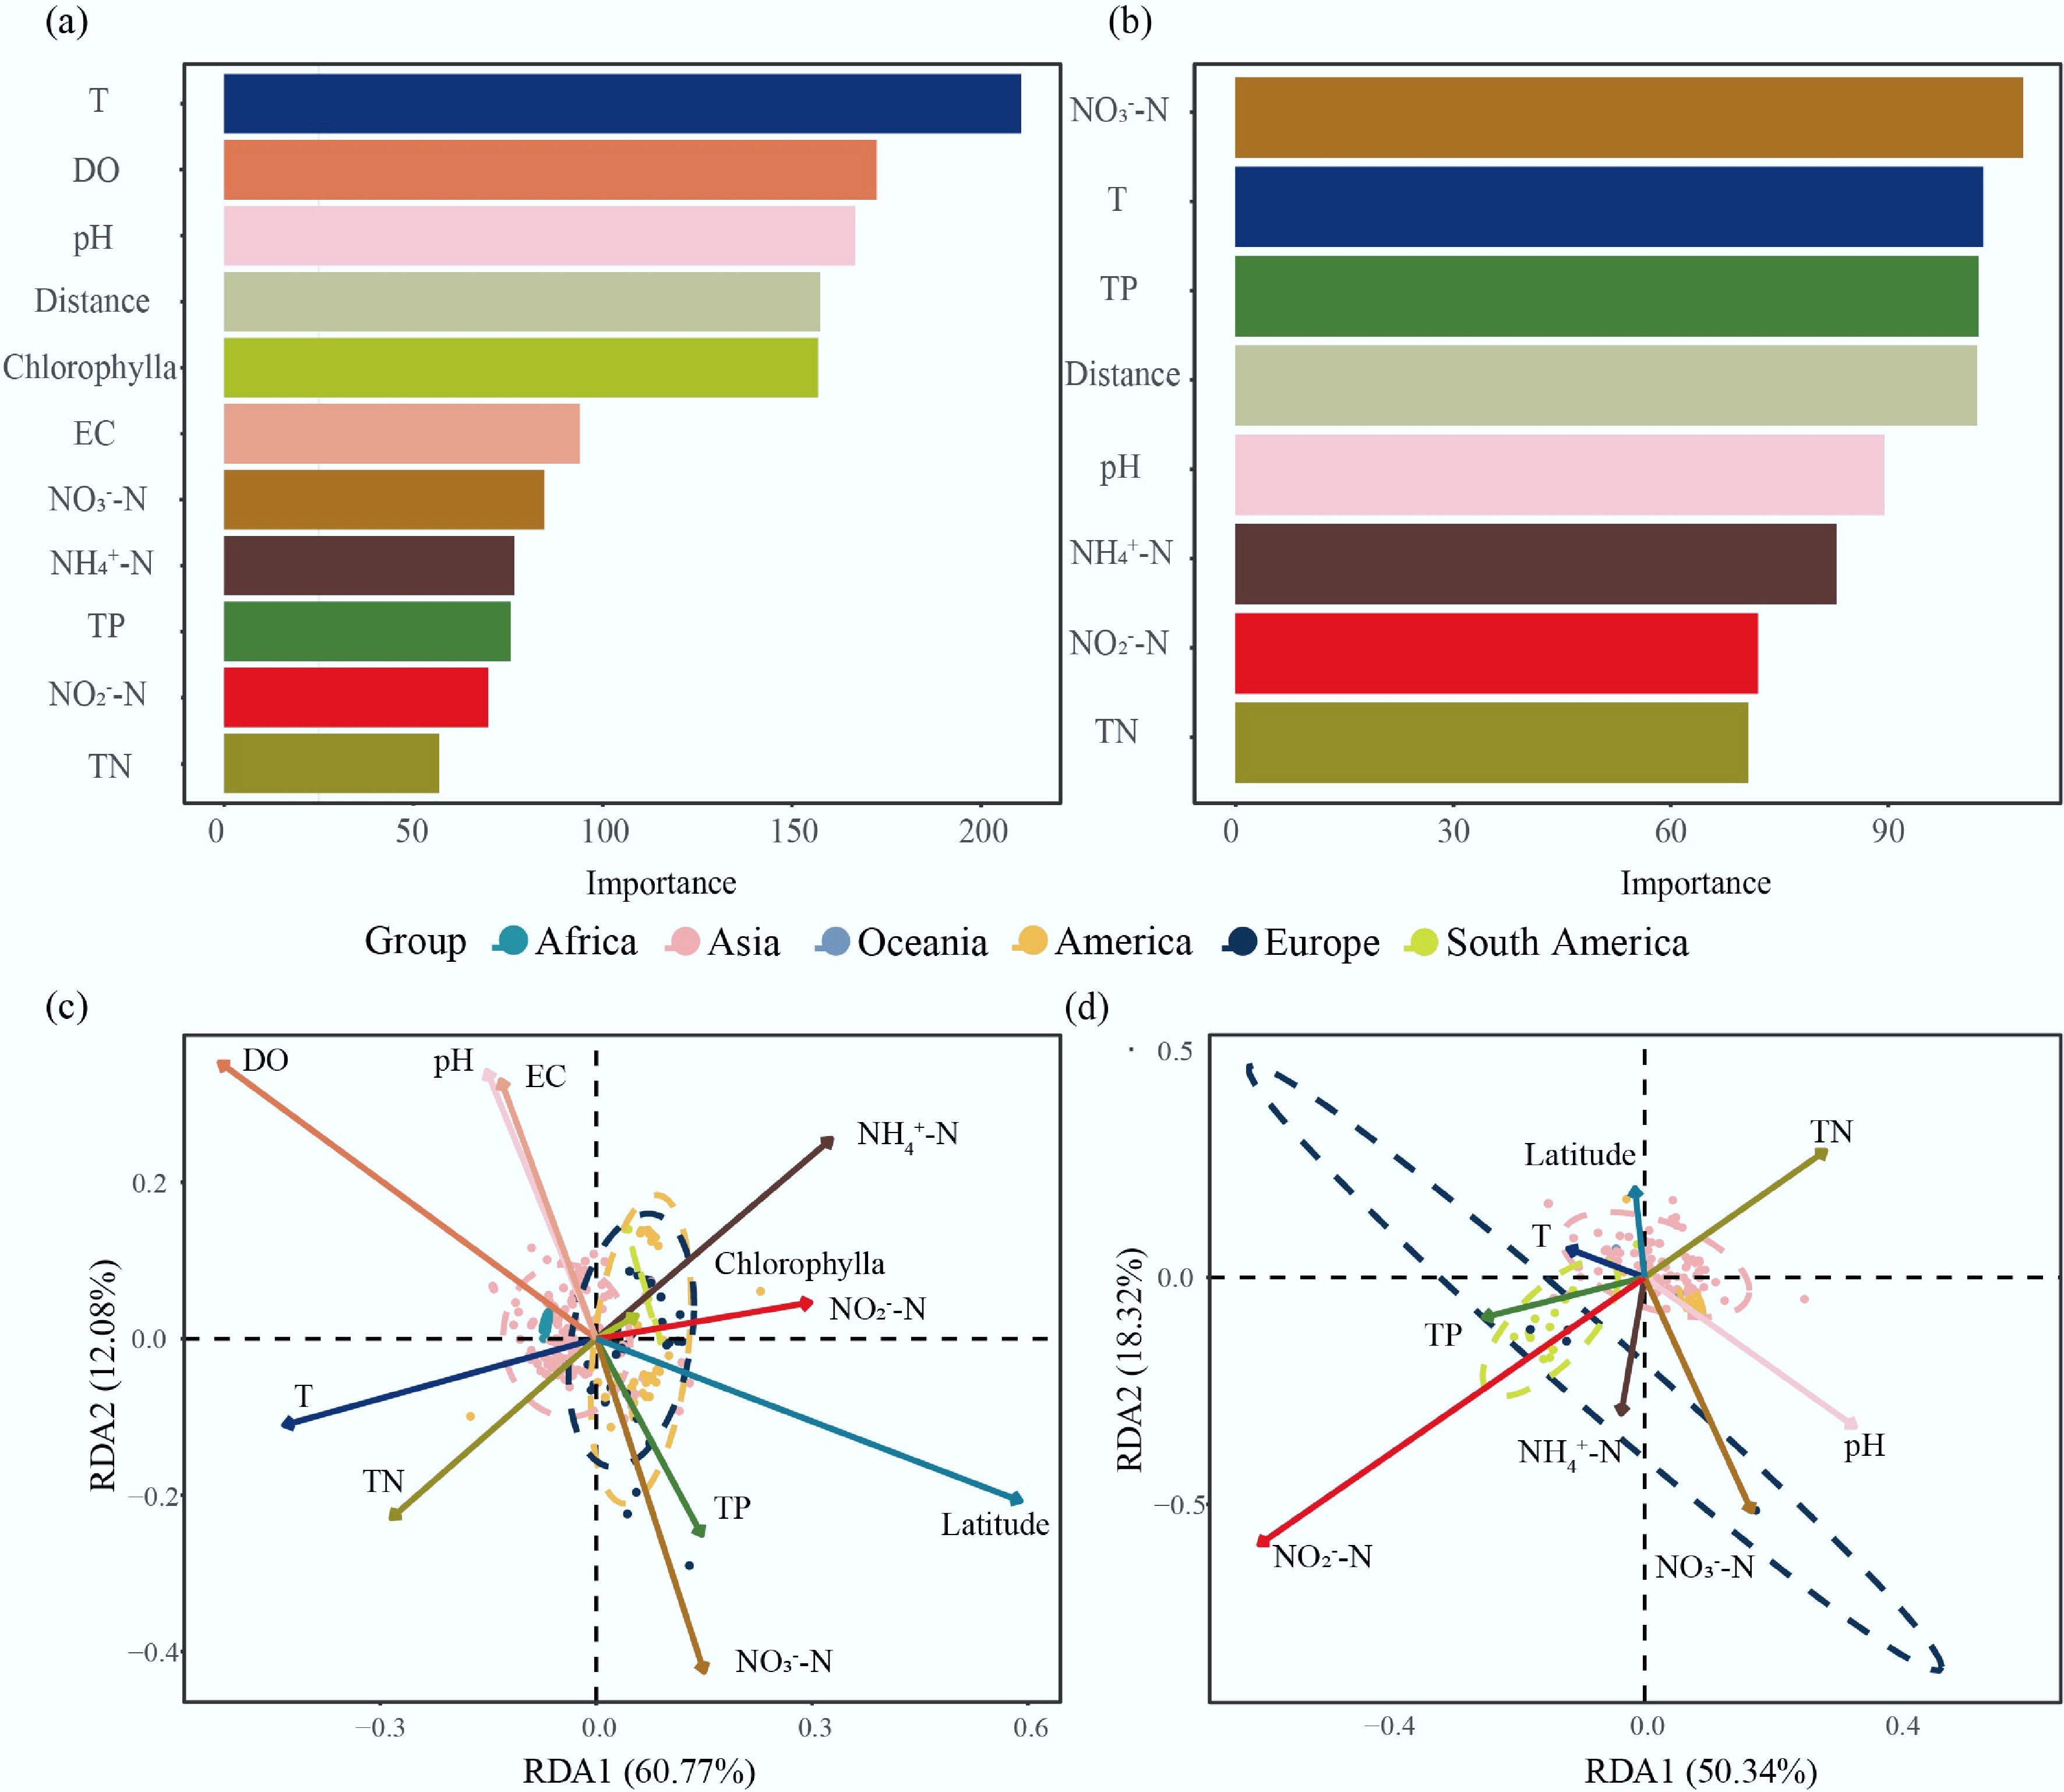
Figure 6.
The impact of environmental factors on bacterial community structure. Random forest models illustrate the ranking of variable importance for: (a) water, and (b) sediment samples. Redundancy analysis (RDA) plot showing the relationship between biogeochemical parameters and bacterial community composition in: (c) water, and (d) sediment. The vectors represent the biogeochemical variables, and their lengths and directions indicate the strength and direction of the correlations with the bacterial community. Abbreviations: T (temperature), DO (dissolved oxygen), EC (electric conductivity), NO3–-N (nitrate nitrogen), NH4+-N (ammonia nitrogen), TP (total phosphorus), NO2–-N (nitrite nitrogen), TN (total nitrogen).
-
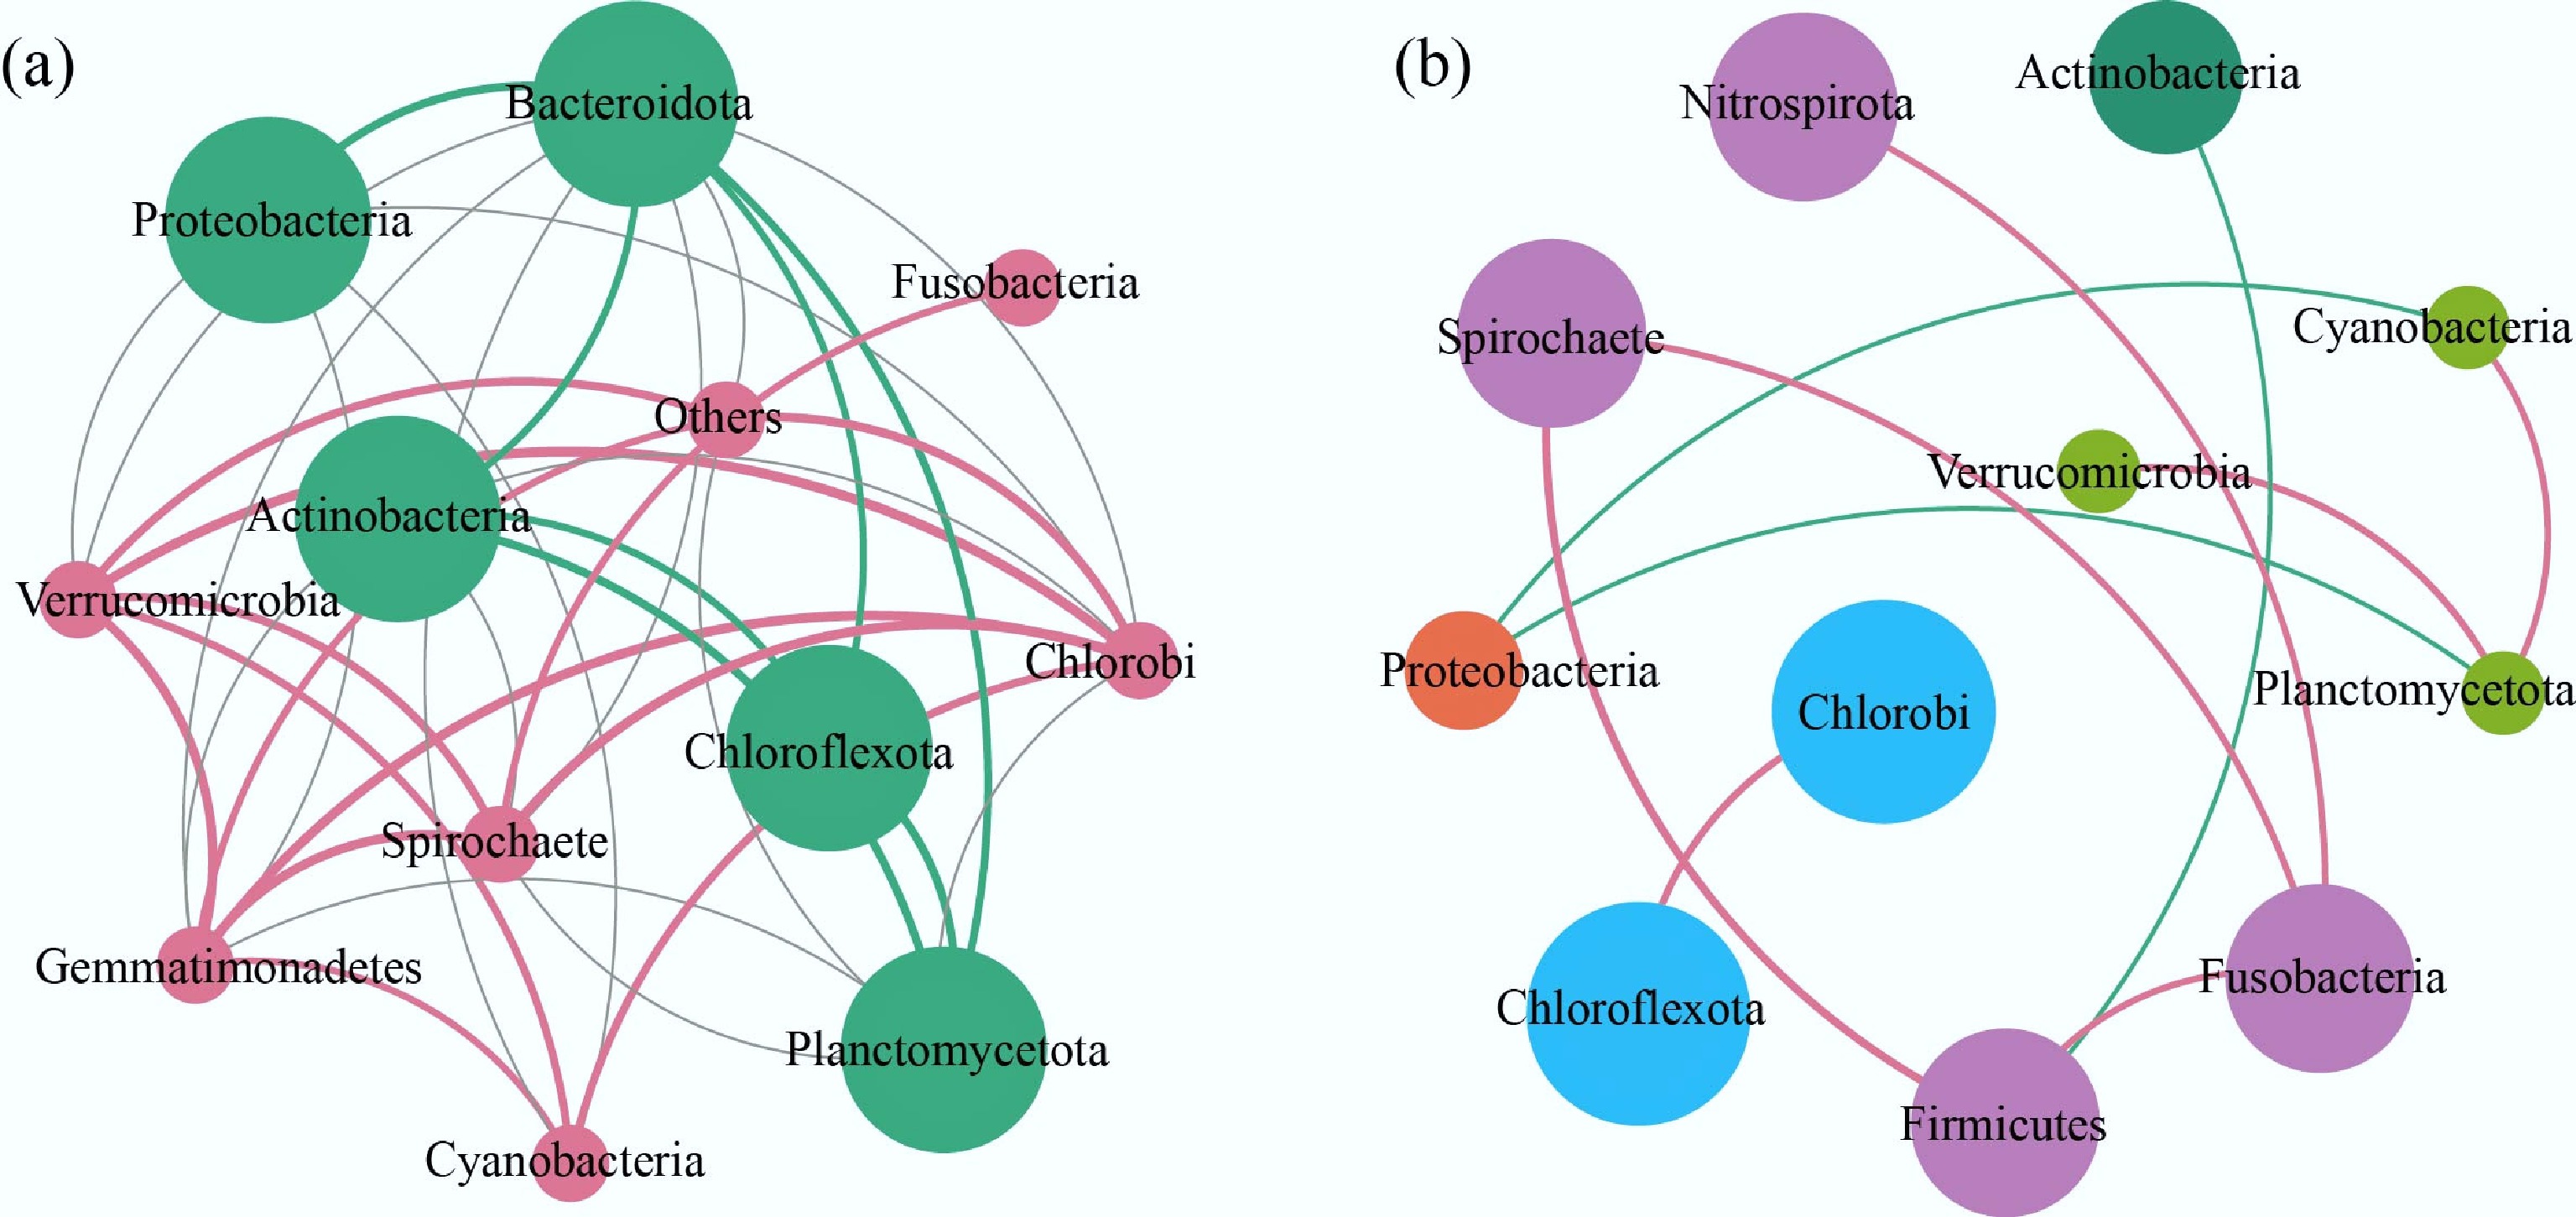
Figure 7.
Bacterial co-occurrence network. (a) Water and (b) sediment bacterial networks across lakes and reservoirs. The thickness of the line is directly proportional to the correlation coefficient.
-
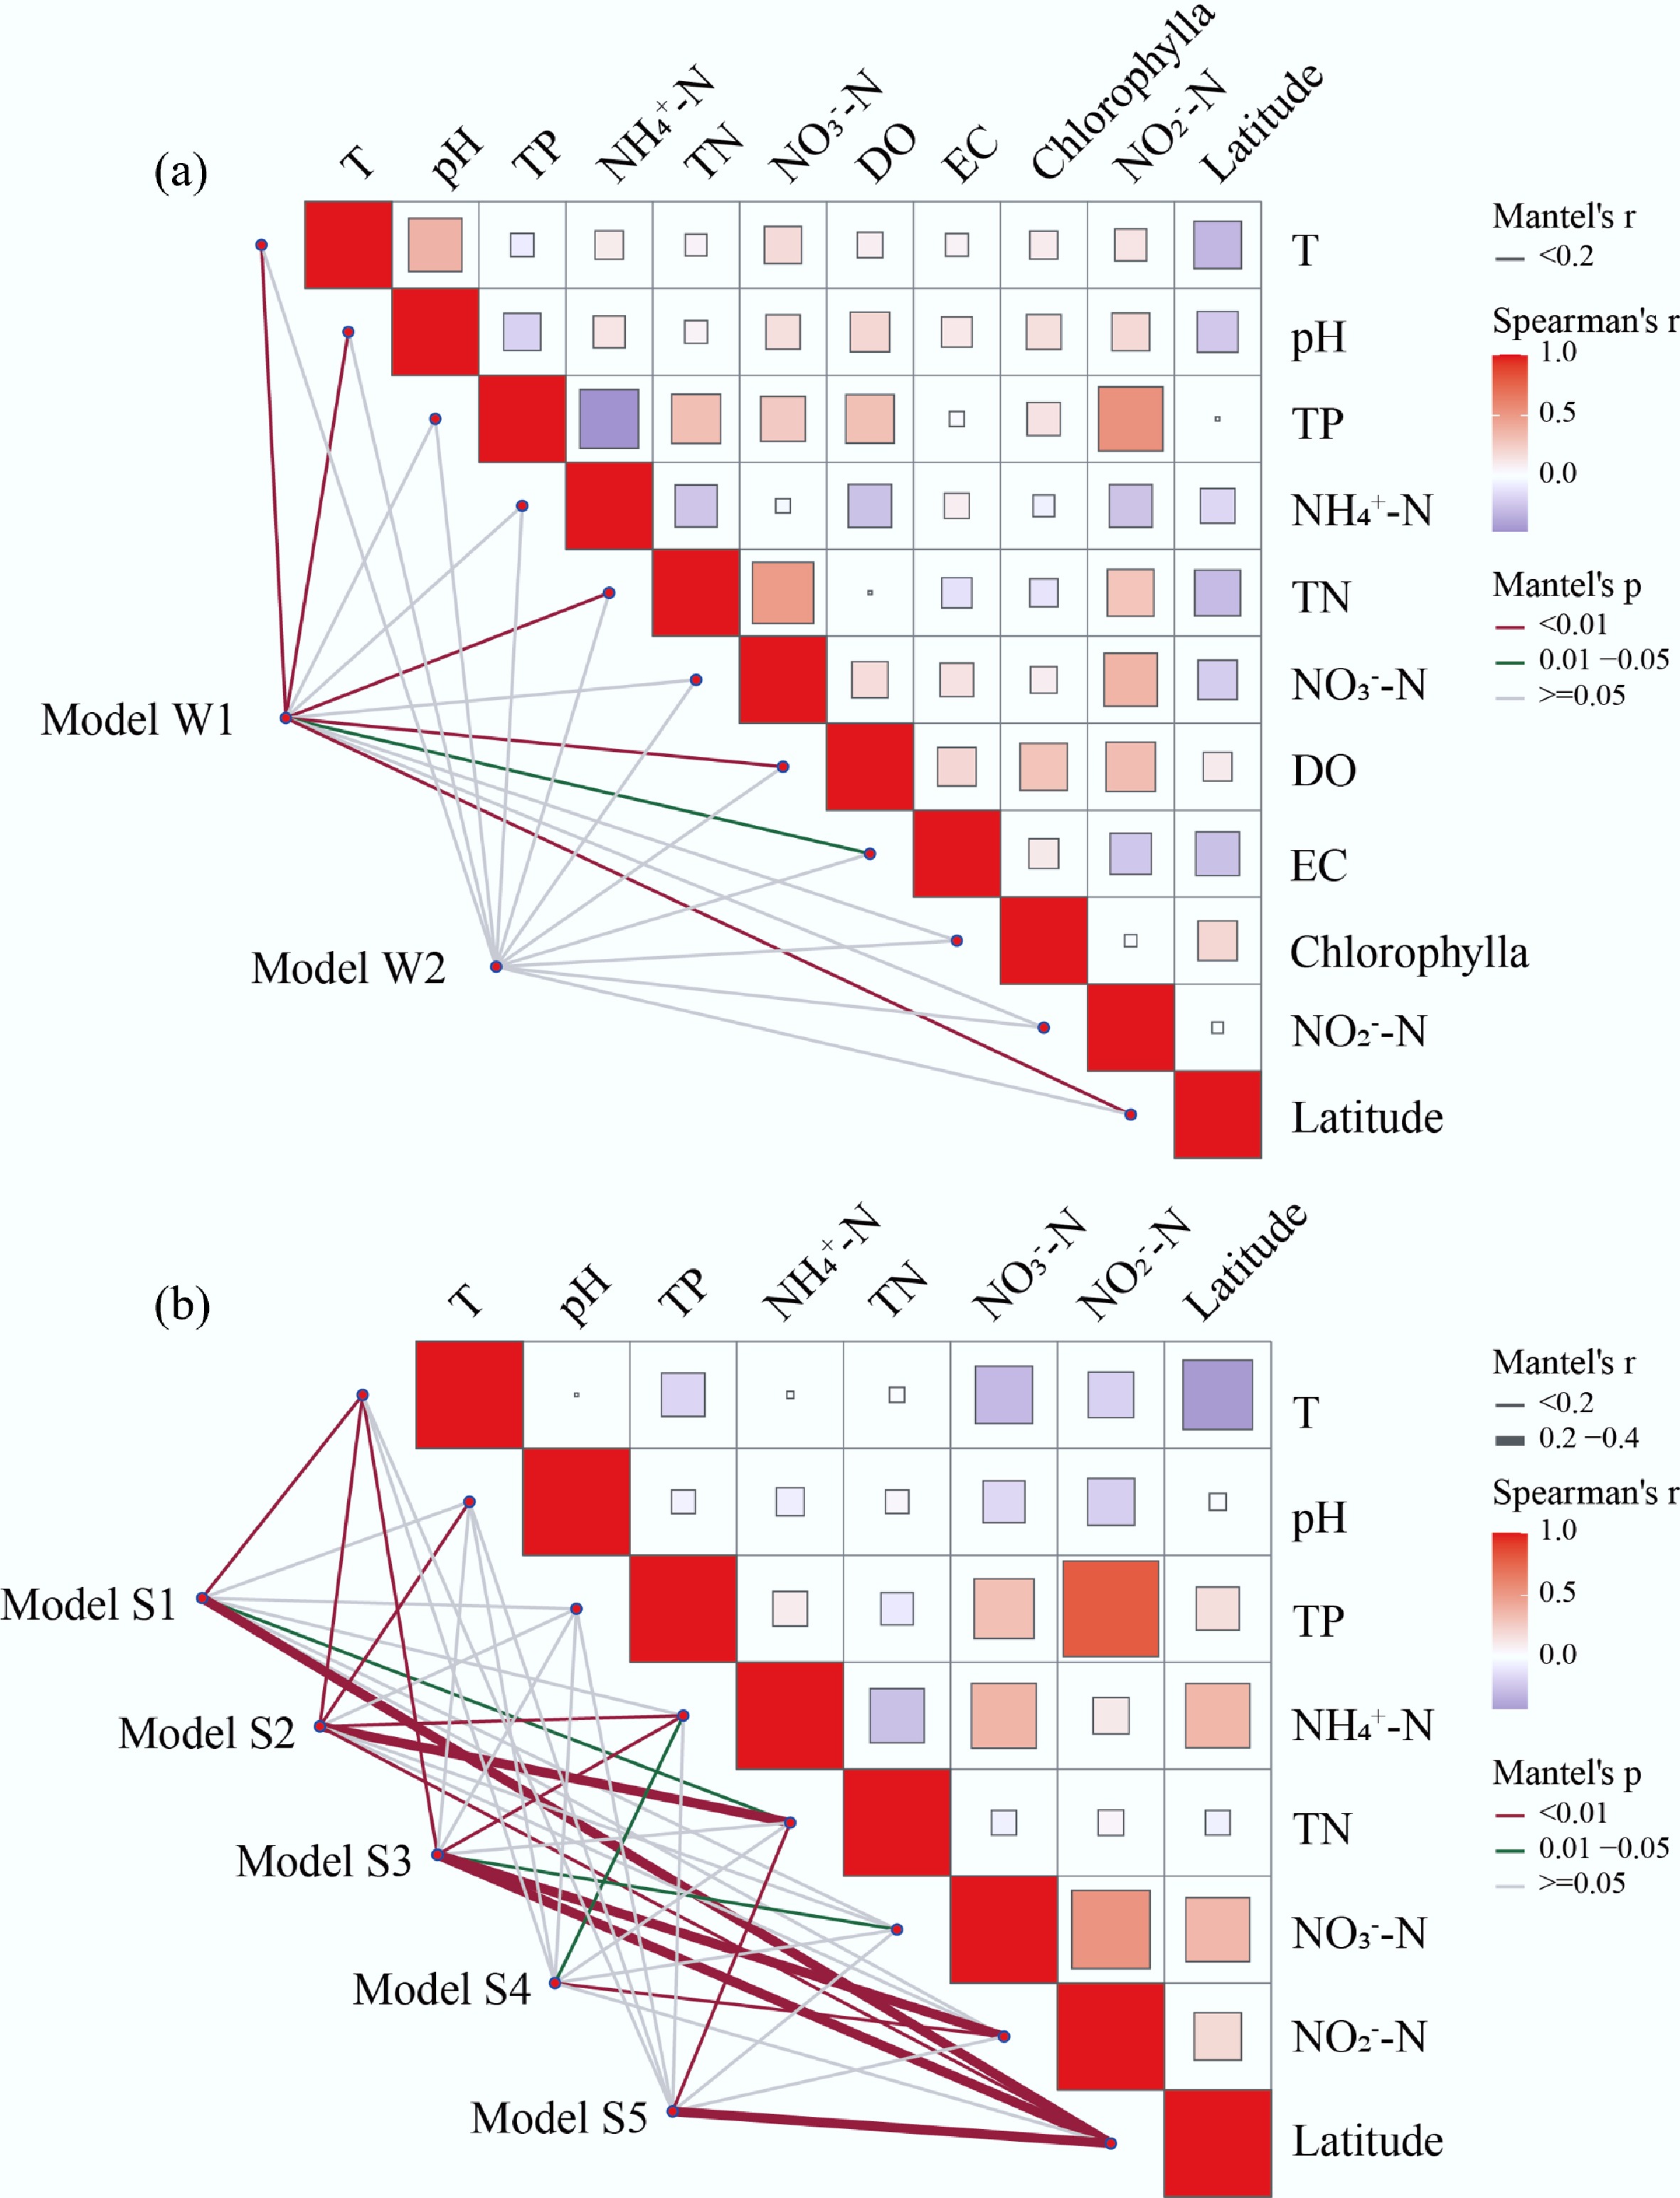
Figure 8.
Relationships between environmental variables and ecological networks within lakes reservoirs worldwide. Pairwise correlations of the variables are shown with a color gradient denoting Spearman's correlation coefficient. Spatial variables include latitude. Environmental variables include T, pH, DO, EC. Nutrient variables include TP, NH4+-N, TN, NO3–-N, NO2–-N. Biological variables include chlorophylla. The red lines represent significant correlations (p < 0.01) between bacterial community structures and environmental, spatial, biological, or nutrient variables, while the green lines indicate moderate correlations (0.01 ≤ p < 0.05), and the gray lines denote non-significant correlations (p ≥ 0.05) based on the Mantel test.
Figures
(8)
Tables
(0)