-
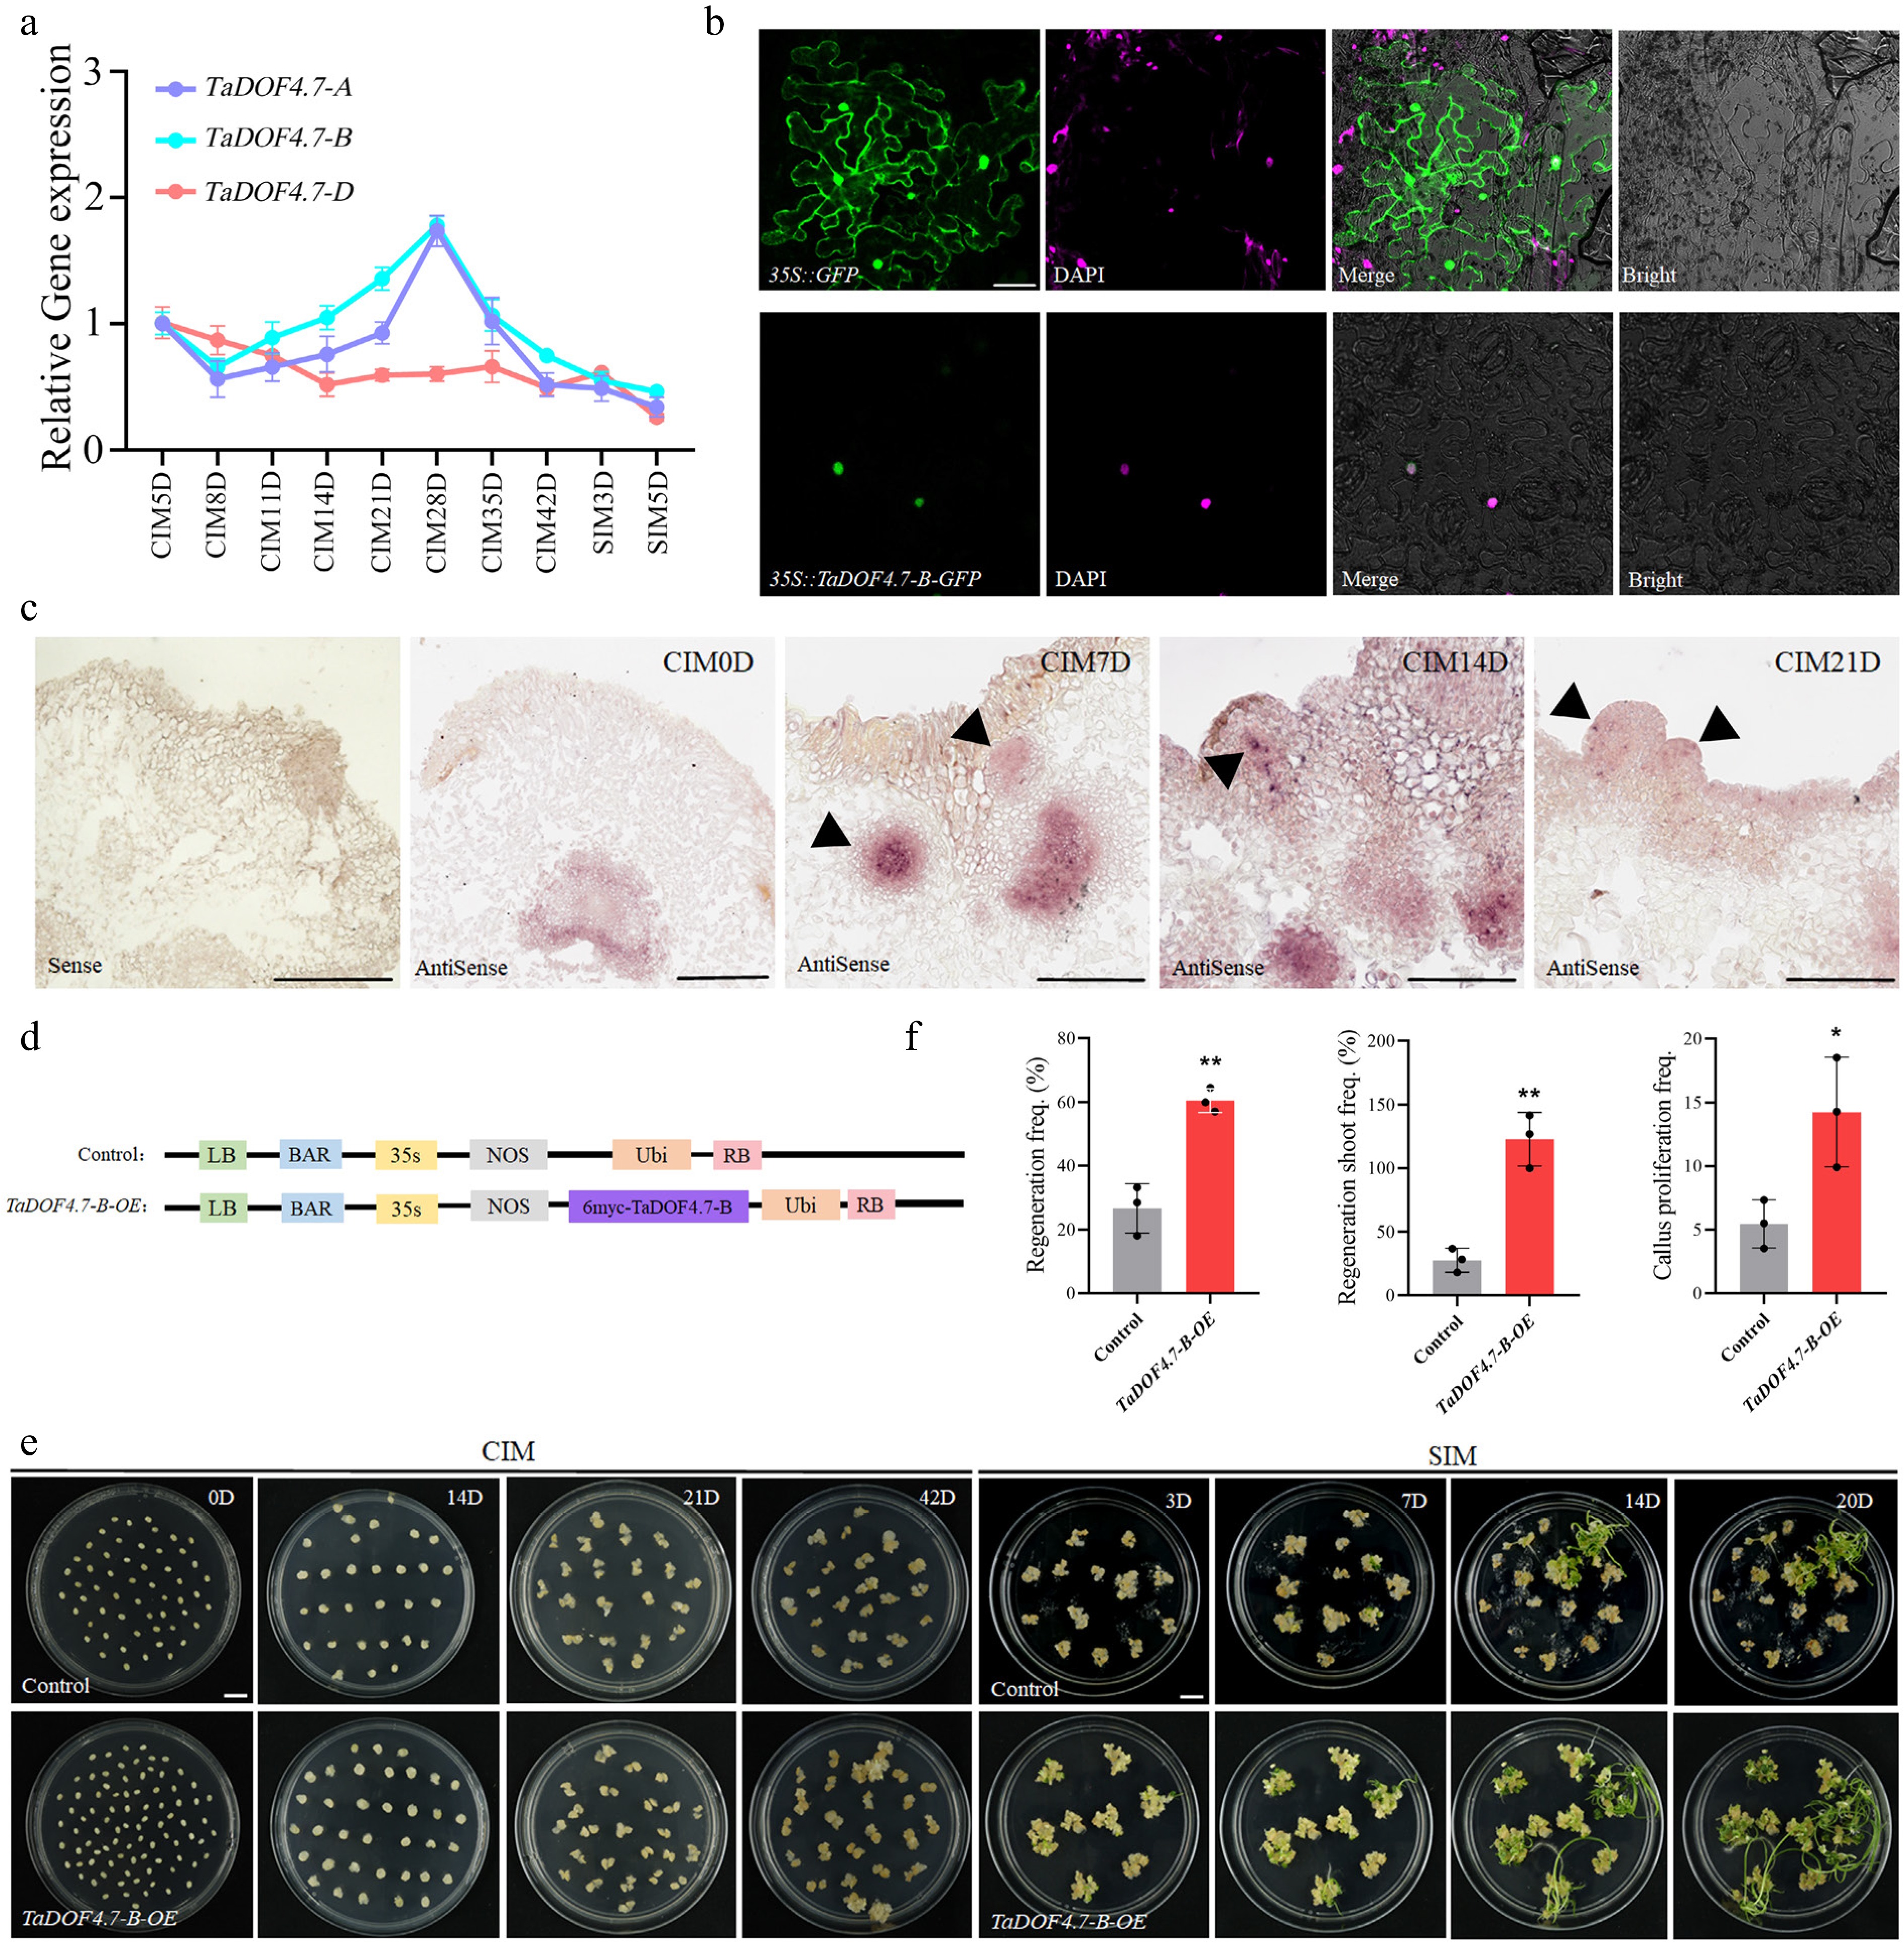
Figure 1.
TaDOF4.7-B enhances shoot regeneration in wheat. (a) The expression level of TaDOF4.7-A/B/D throughout the wheat regeneration process. The error bars indicate the means ± SEs of three independent biological replicates (n = 3). (b) Transient expression of the 35S::TaDOF4.7-B-GFP constructs in N. benthamiana leaves using Agrobacterium infiltration. Green fluorescence was observed using a confocal microscope, and the nucleus were visualized by DAPI staining. 35S::GFP was used as a control. (c) RNA in situ hybridization experiments. Immature embryos of Fielder wheat and calli at different stages of the regeneration process were as materials. (d) Schematic representation of the Ubi::TaDOF4.7-B-6MYC vector. The PC186 empty vector was used as a control. (e) Shoot regeneration phenotypes of immature embryos transformed with the empty vector (control) or Ubi::TaDOF4.7-B-6MYC vector (TaDOF4.7-B-OE). CIM, callus induction medium; SIM, shoot induction medium. Scale bar, 1 cm. (f) Regeneration frequencies, regenerating shoot frequency, and callus proliferation frequencies of immature embryos transformed with control or Ubi::TaDOF4.7-B-6MYC vector. Regeneration frequency = number of calli showing at least one regenerating shoot/number of inoculated embryos × 100%. Regenerating shoot frequency = number of regenerating shoots/numbers of inoculated embryos × 100%. Callus proliferation frequency = increased weight of callus after induction on CIM for 42 d/weight of immature embryos before induction. Values in (f) are means ± SE from three independent experiments (n = 3). Asterisks indicate significant differences (* p < 0.05, ** p < 0.01) based on 2-tailed Student's t-tests.
-
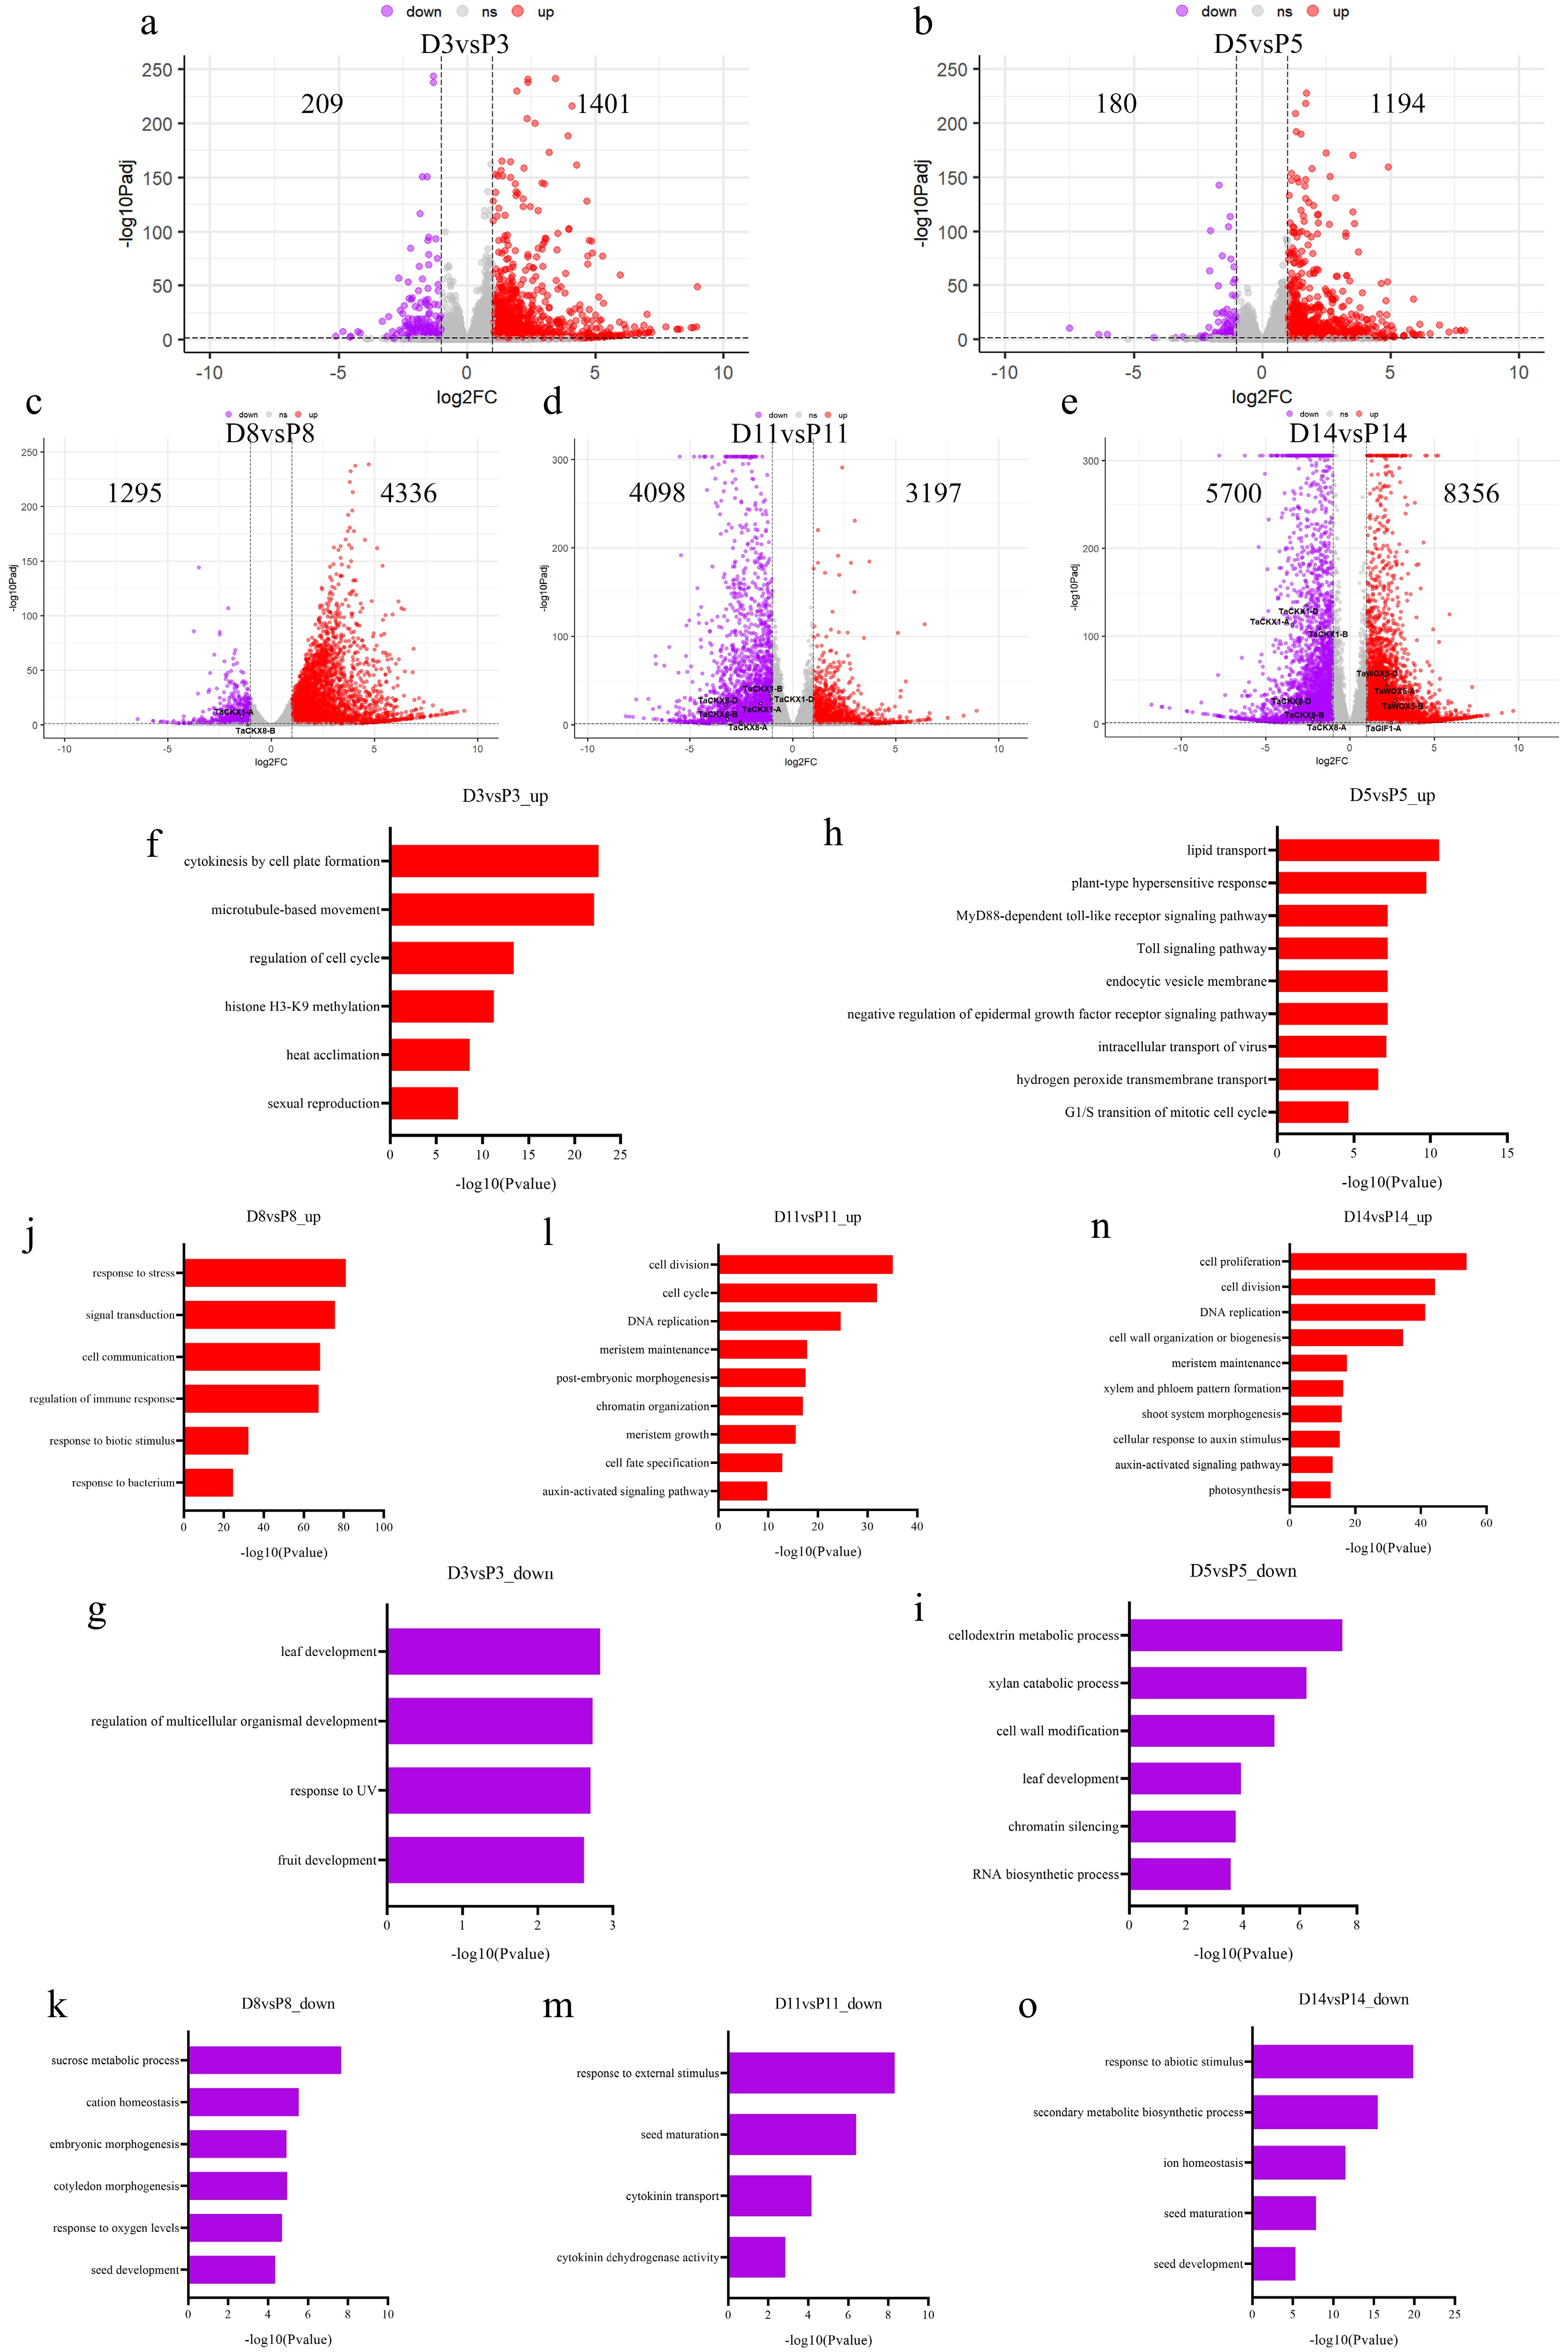
Figure 2.
RNA-seq analysis of immature embryos of Fielder wheat after transforming with the Ubi::TaDOF4.7-B-6MYC vector or PC186 empty vector. (a) Volcano plot of up- and downregulated genes in TaDOF4.7-B-OE vs PC186 empty vector at CIM 3 d (D3 vs P3). (b) Volcano plot of up- and down-regulated genes in TaDOF4.7-B-OE vs PC186 empty vector at CIM 5 d (D5 vs P5). (c) Volcano plot of up- and down-regulated genes in TaDOF4.7-B-OE vs PC186 empty vector at CIM 8 d (D8 vs P8). (d) Volcano plot of up- and down-regulated genes in TaDOF4.7-B-OE vs PC186 empty vector at CIM 11 d (D11 vs P11). (e) Volcano plot of up- and down-regulated genes in TaDOF4.7-B-OE vs PC186 empty vector at CIM 14 d (D14 vs P14). (f), (g) GO enrichment analysis of up- (F, D3 vs P3_up) and down-regulated (G, D3 vs P3_down) genes in TaDOF4.7-B-OE vs PC186 empty vector at CIM 3 d. (h), (i) GO enrichment analysis of up- (H, D5 vs P5_up) and down-regulated (I, D5 vs P5_down) genes in TaDOF4.7-B-OE vs PC186 empty vector at CIM 5 d. (j), (k) GO enrichment analysis of up- (J, D8 vs P8_up) and down-regulated (K, D8 vs P8_down) genes in TaDOF4.7-B-OE vs PC186 empty vector at CIM 8 d. (l), (m) GO enrichment analysis of up- (L, D11 vs P11_up) and down-regulated (M, D11 vs P11_down) genes in TaDOF4.7-B-OE vs PC186 empty vector at CIM 11 d. (n), (o) GO enrichment analysis of up- (N, D14 vs P14_up) and down-regulated (O, D14 vs P14_down) genes in TaDOF4.7-B-OE vs PC186 empty vector at CIM 14 d.
-
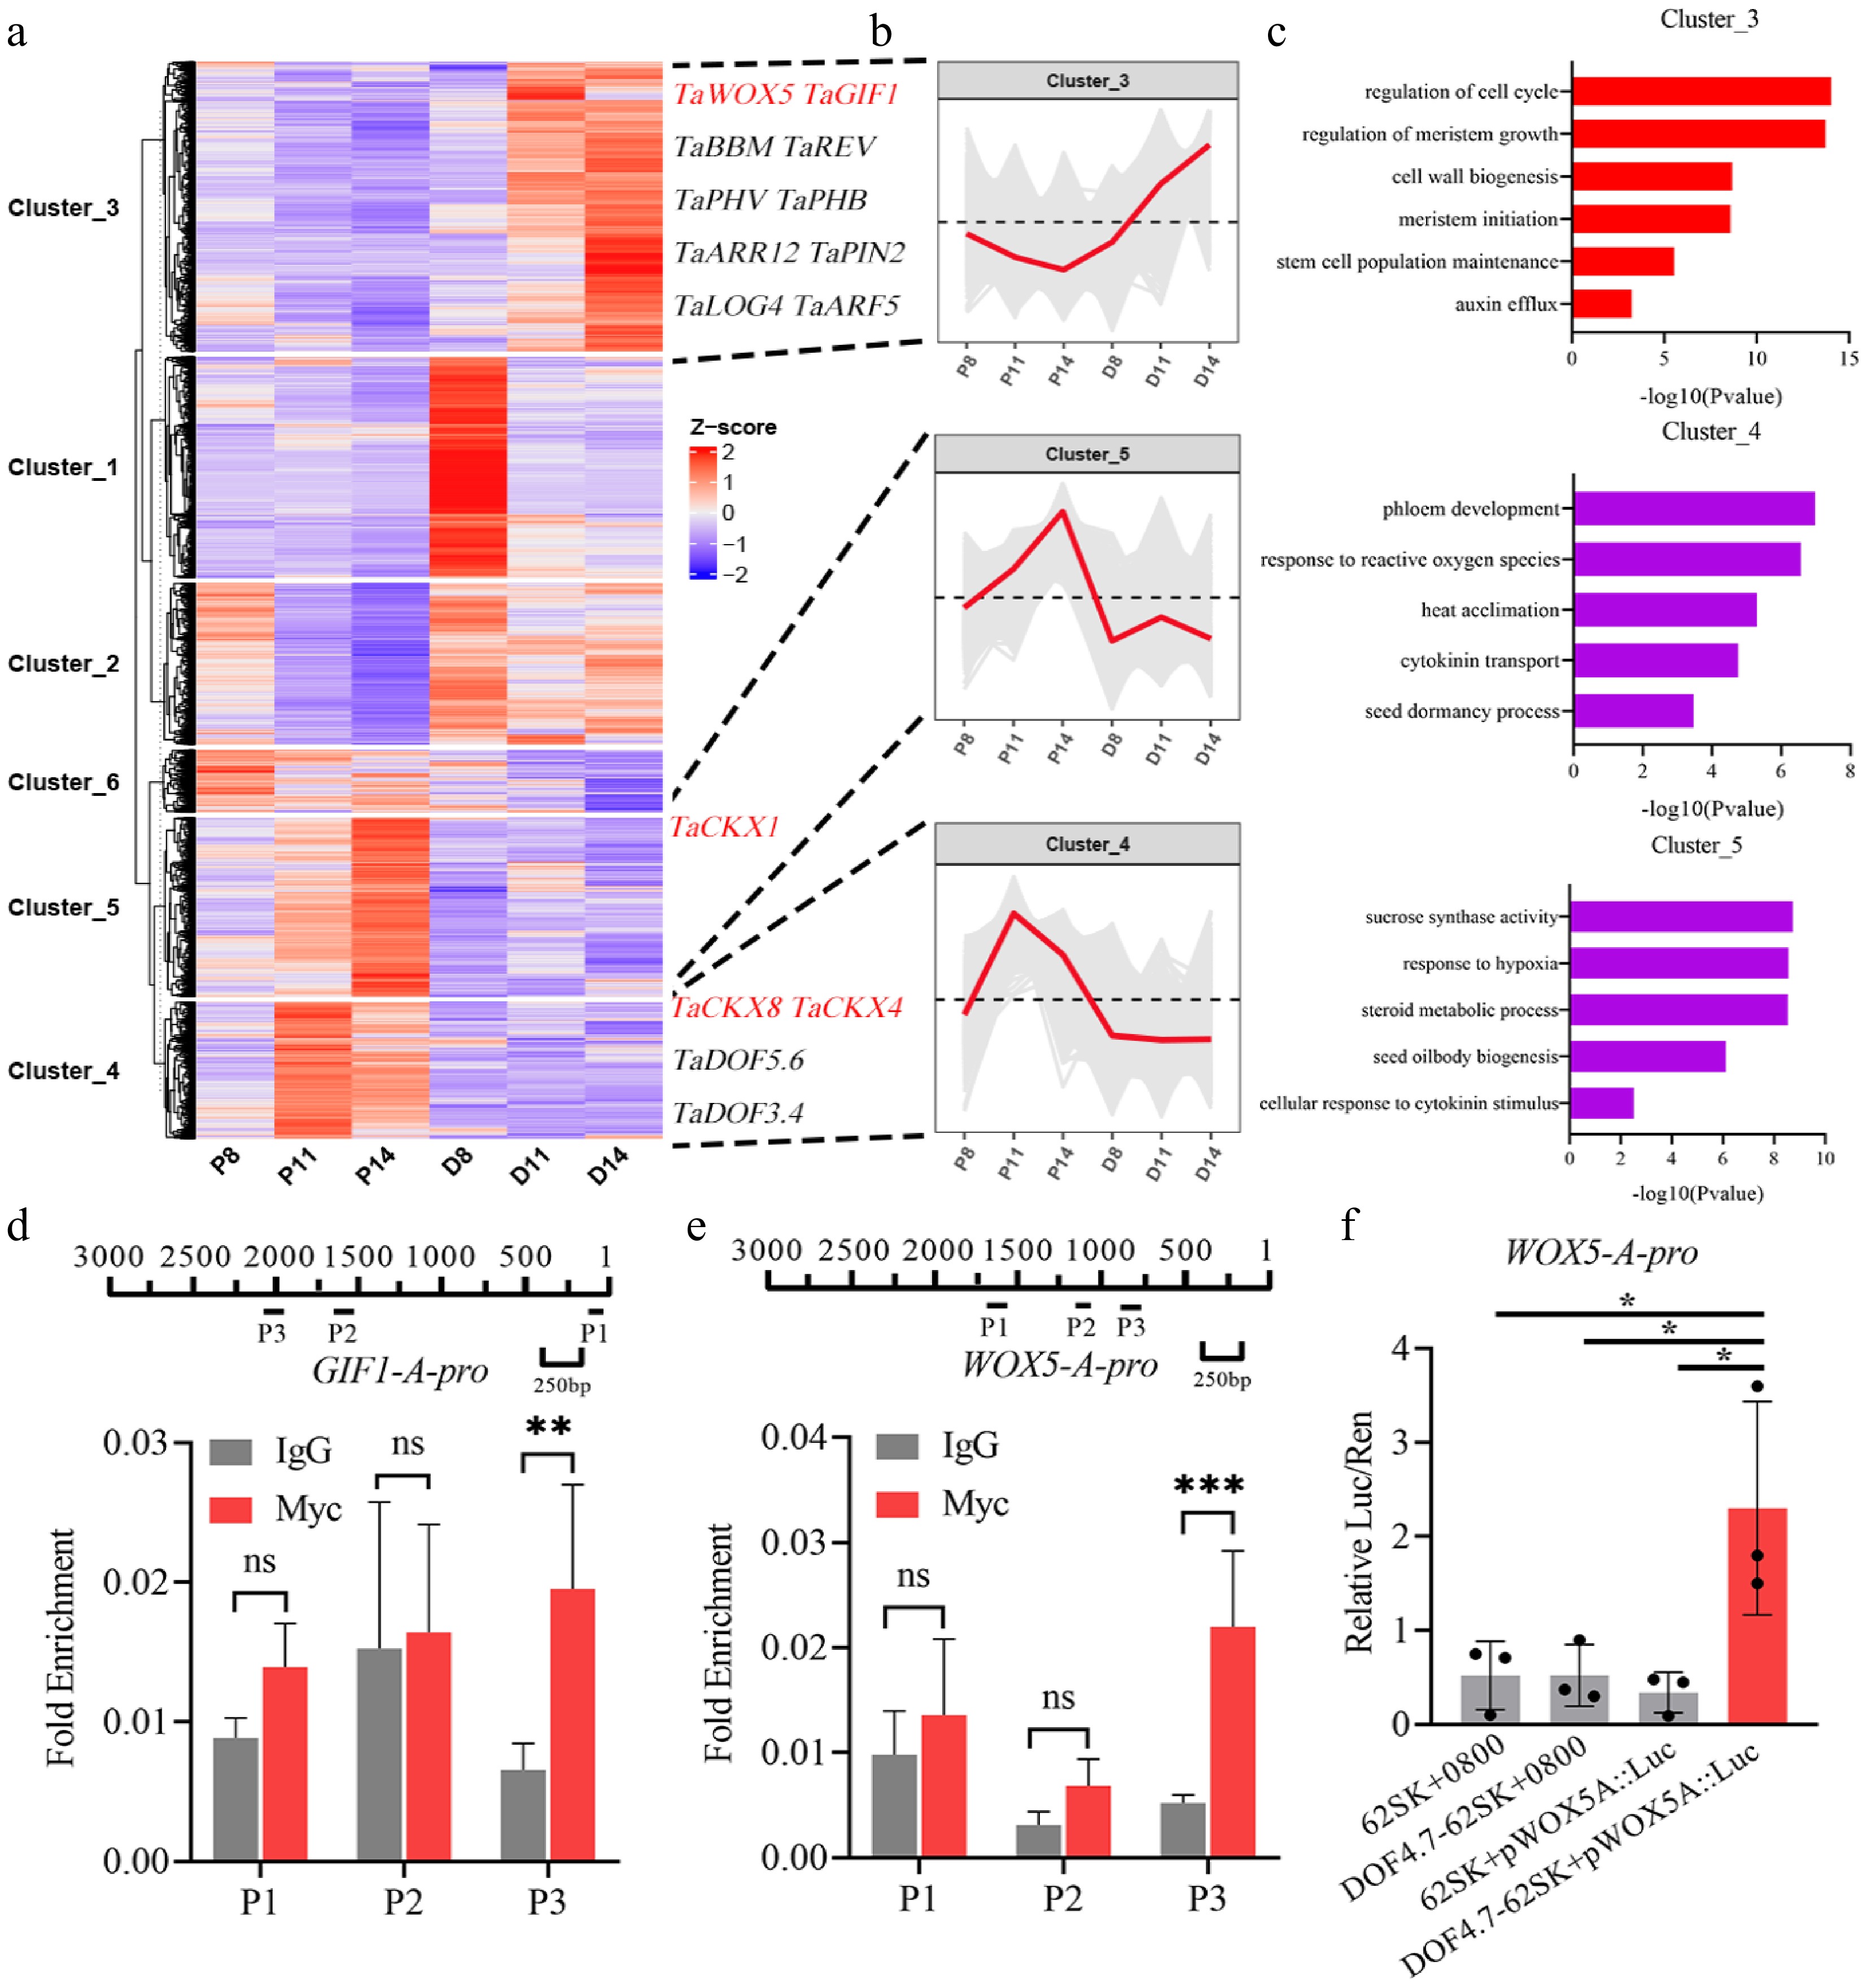
Figure 3.
TaDOF4.7-B promoted shoot regeneration by upregulating the expression levels of multiple regeneration related factors. (a), (b) K-means analysis based on the expression levels of the genes identified by the transcriptome data. (c) GO enrichment analysis of genes in cluster 3, cluster 4 and cluster 5. (d) The interaction between TaDOF4.7-B and the promoter of TaGIF1-A was confirmed by ChIP-qPCR. TaDOF4.7-B-OE samples with IgG antibody were used as negative controls. (e) The interaction between TaDOF4.7-B and the promoter of TaWOX5-A was confirmed by ChIP-qPCR. (f) The luciferase activity after transient expression TaDOF4.7-B and TaWOX5-Apro:LUC reporter in tobacco leaves. Values in (d)–(f) are means ± SE from three independent experiments (n = 3). Asterisks indicate significant differences (* p < 0.05, ** p < 0.01, *** p < 0.001) based on 2-tailed Student's t-tests.
-
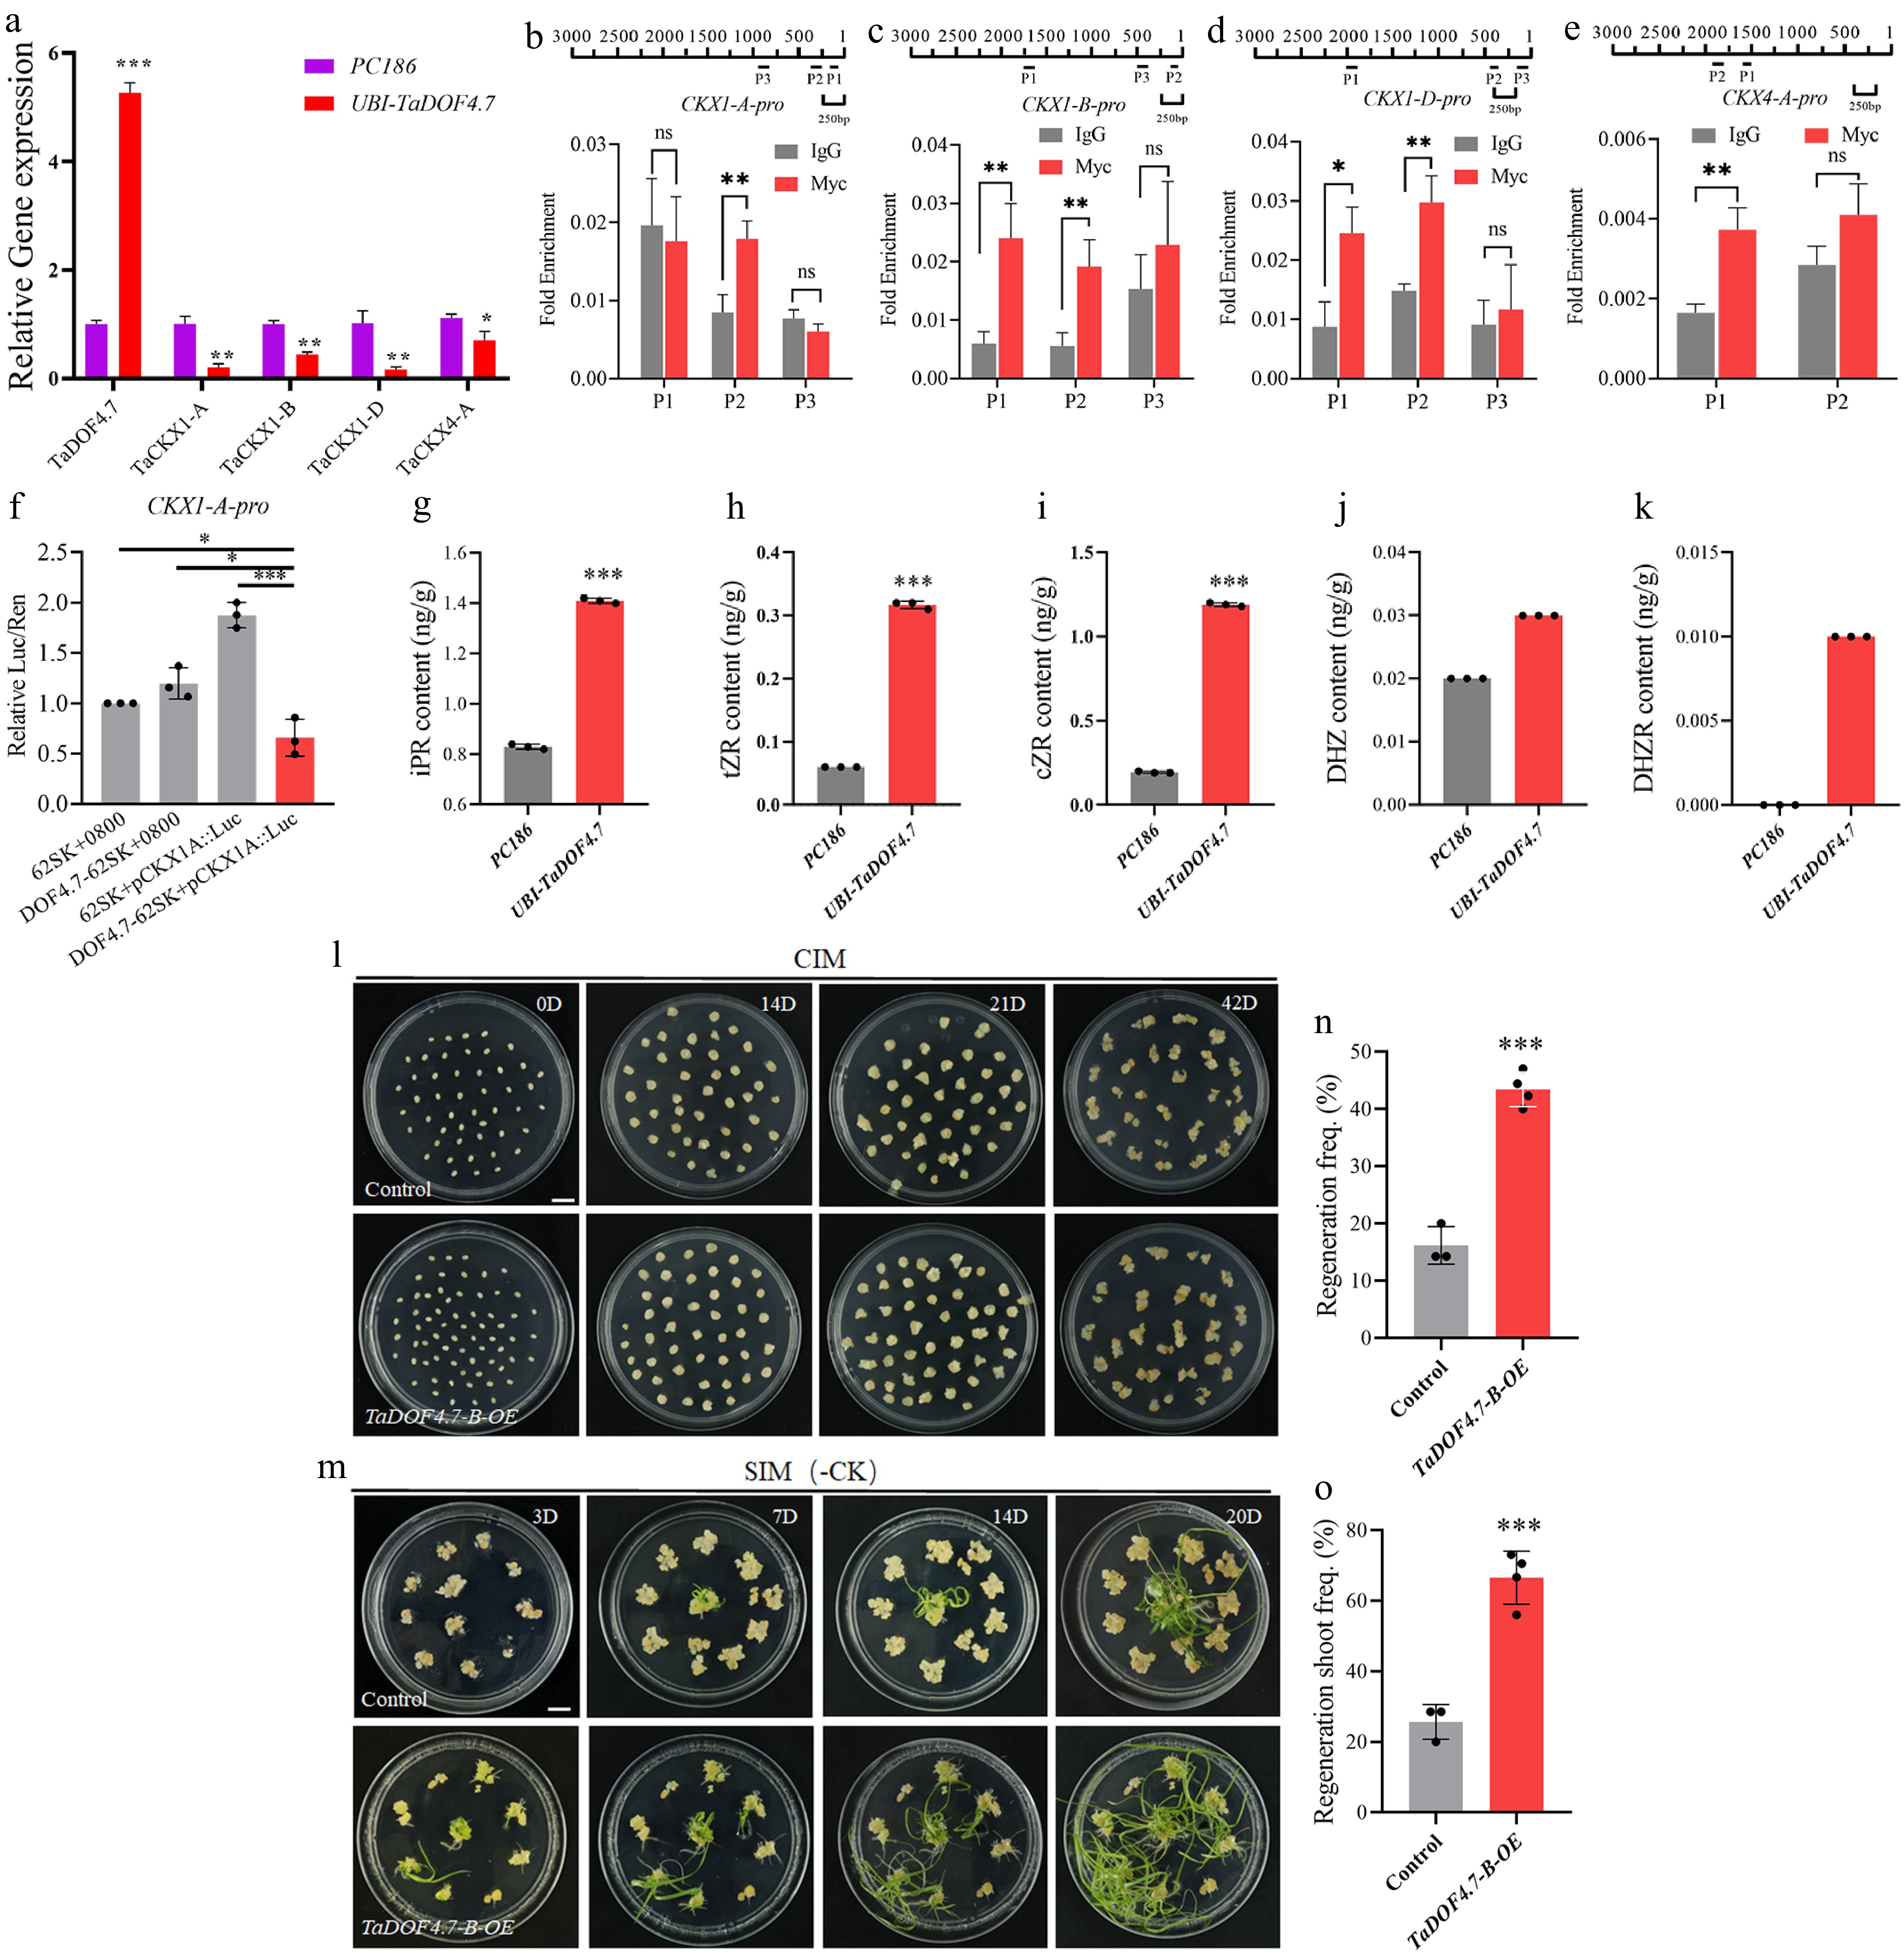
Figure 4.
Overexpression of TaDOF4.7-B promotes wheat shoot regeneration by regulating cytokinin homeostasis. (a) The expression levels of selected CKXs in TaDOF4.7-B-OE transgenic calli and empty vector transgenic calli. Values in (a) are means ± SE from three independent experiments (n = 3). (b)–(e) The interaction between TaDOF4.7-B and the promoters of the selected CKXs was confirmed by ChIP-qPCR. TaDOF4.7-B-OE samples with IgG antibody were used as negative controls. Values in (b)–(e) were means ± SE from three independent experiments (n = 3). (f) The luciferase activity after transient expression TaDOF4.7-B and TaCKX1-Apro:LUC reporter in tobacco leaves. Values in (f) were means ± SE from three independent experiments (n = 3). (g)–(k) The content of cytokinins measured in UBI-TaDOF4.7 calli and PC186 calli. (l), (m) Shoot regeneration phenotypes of immature embryos transformed with the empty vector (control) or Ubi::TaDOF4.7-B-6MYC vector (TaDOF4.7-B-OE) on a SIM without cytokinin. CIM, callus induction medium; SIM, shoot induction medium. Scale bar, 1 cm. (n), (o) Regeneration frequencies and regenerating shoot frequency of immature embryos transformed with control or Ubi::TaDOF4.7-B-6MYC vector. Values in (n), (o) are means ± SE from three independent experiments (n ≥ 3). Asterisks indicate significant differences (* p < 0.05, **p < 0.01, *** p < 0.001) based on 2-tailed Student's t-tests.
-
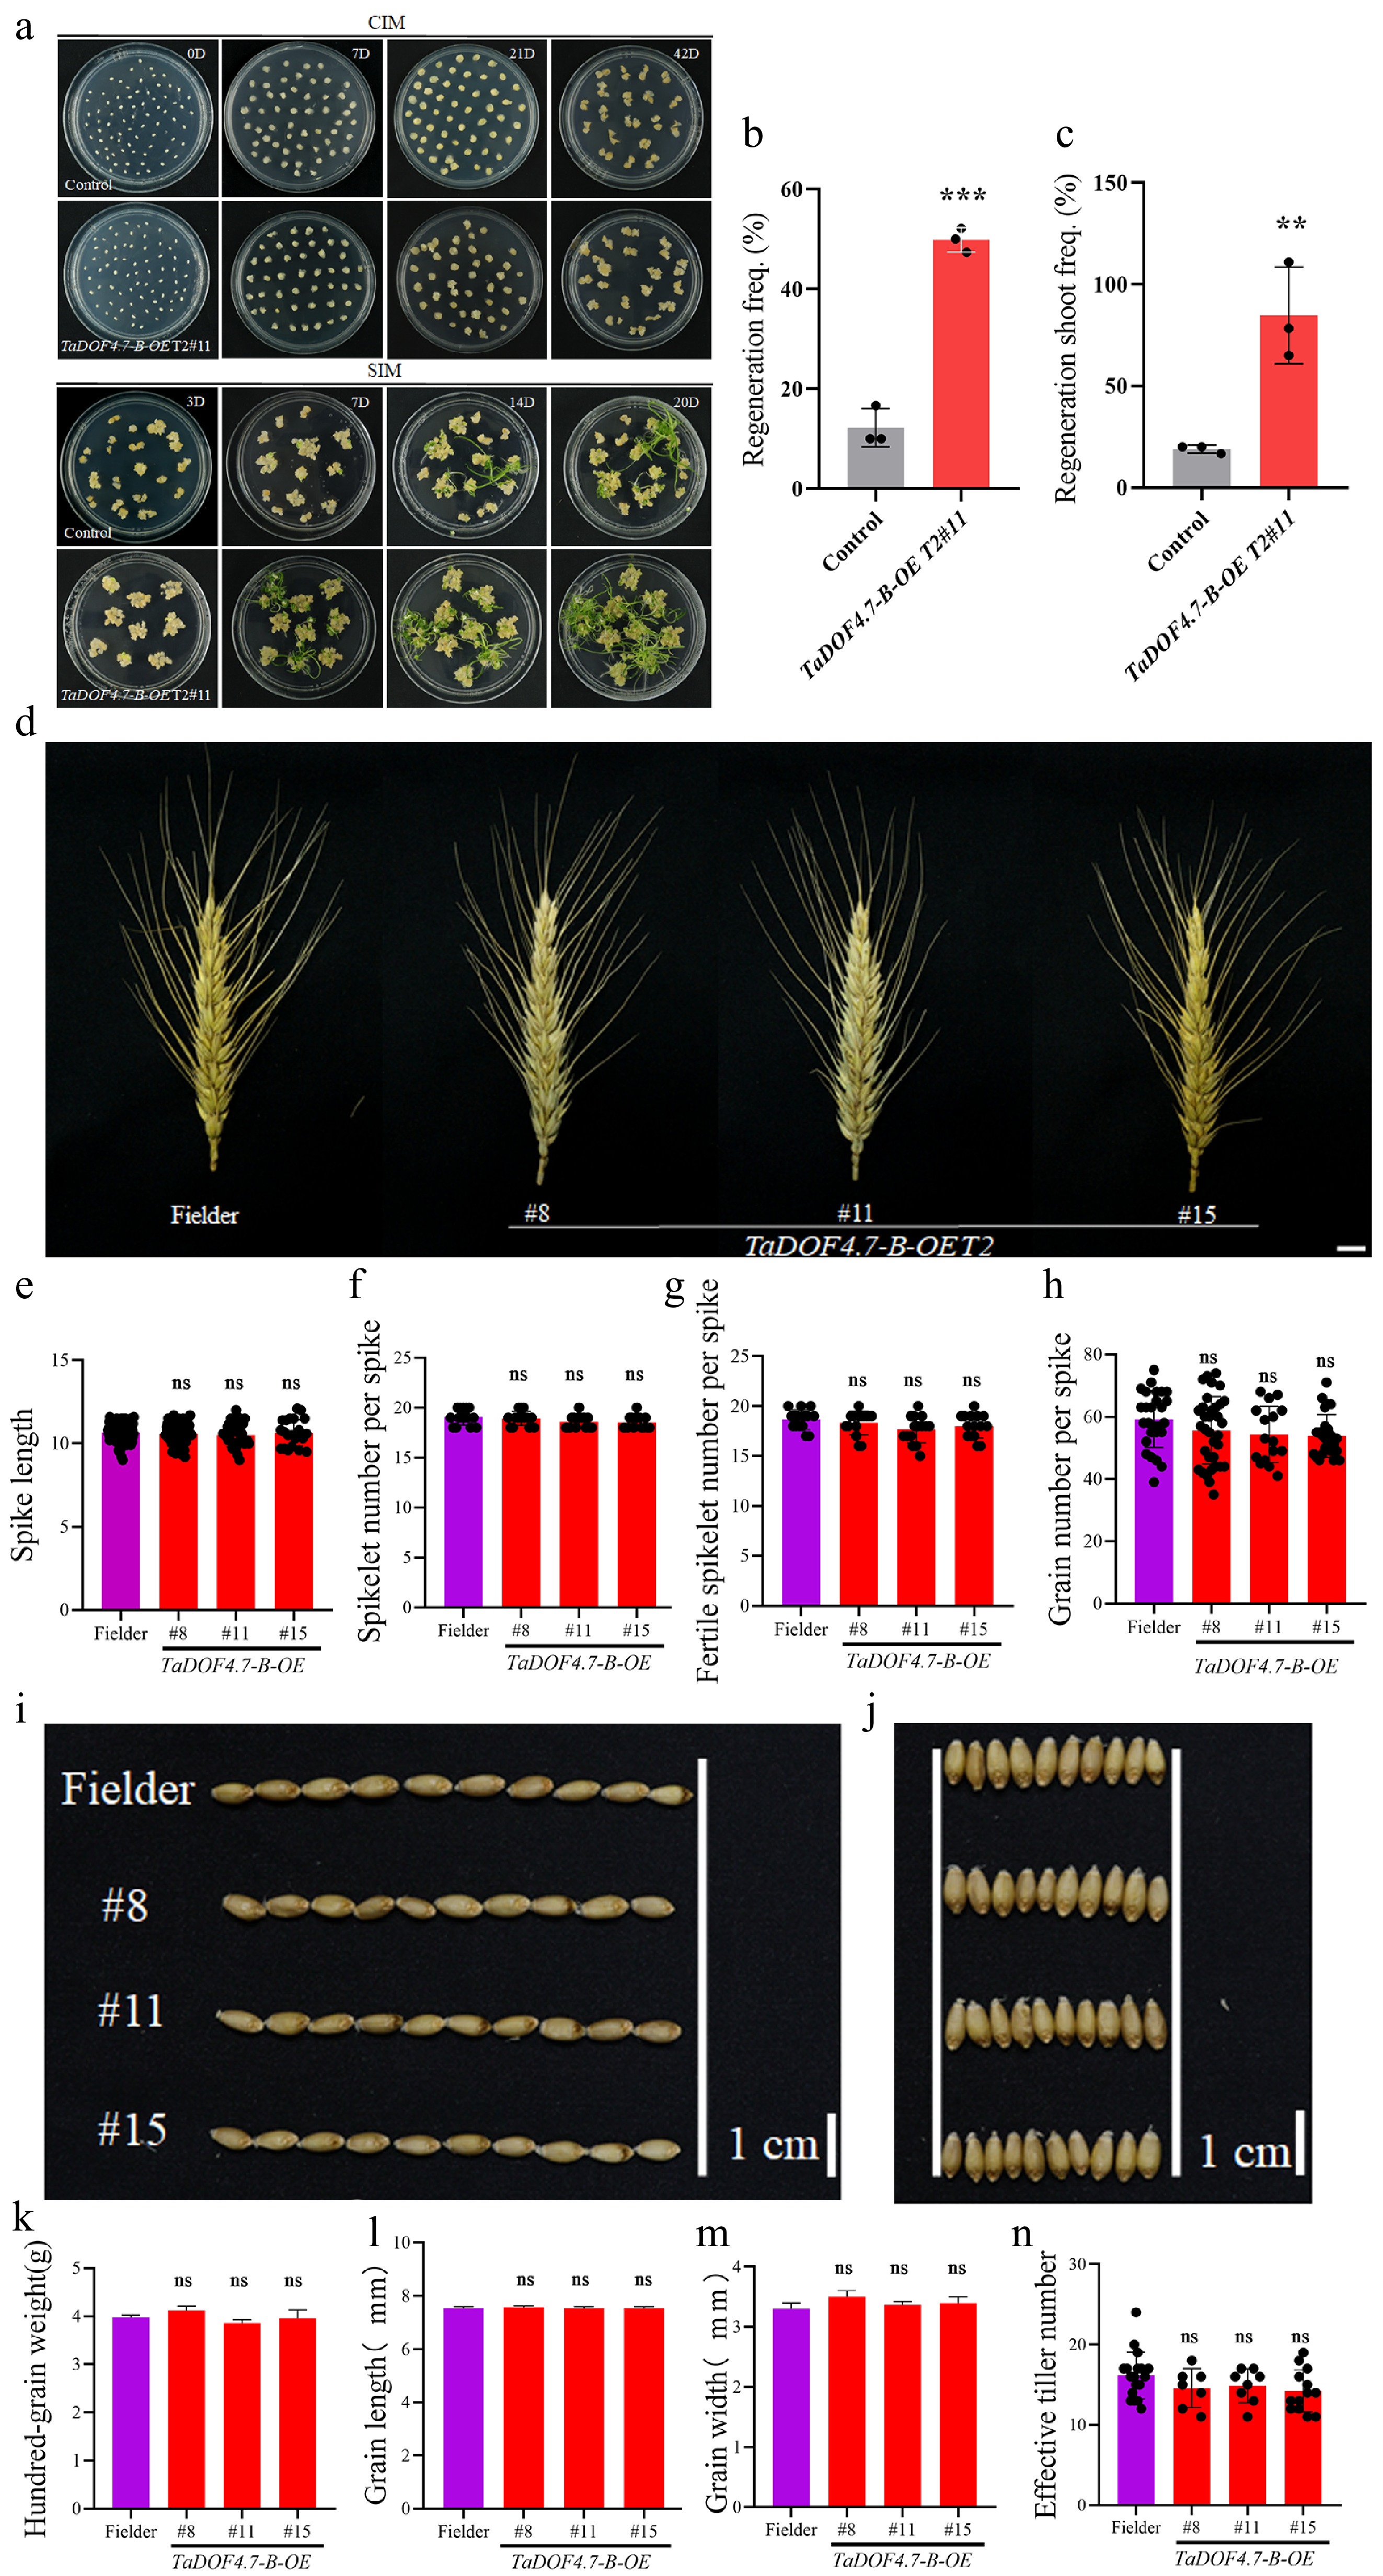
Figure 5.
T2-generation overexpression TaDOF4.7-B transgenic wheat still had a highly regenerative capacity. (a) Shoot regeneration phenotypes of overexpression TaDOF4.7-B transgenic wheat and control wheat. CIM, callus induction medium; SIM, shoot induction medium. Scale bar, 1 cm. TaDOF4.7-B T2#11, T2-generation overexpression TaDOF4.7-B transgenic wheat. (b), (c) Regeneration frequencies and regenerating shoot frequency of overexpression TaDOF4.7-B transgenic wheat and control wheat. Values in (b), (c) are means ± SE from three independent experiments (n = 3). Asterisks indicate significant differences (* p < 0.05, ** p < 0.01, *** p < 0.001) based on 2-tailed Student's t-tests. The yield traits, such as (d), (e) spike length, (f) spikelet number per spike, (g) fertile spikelet number per spike, (h) grain number per spike, (i), (l) grain length, (j), (m) grain width, (k) hundred-grain weight, and (n) effective tiller number, between overexpression TaDOF4.7-B transgenic wheat and control wheat. TaDOF4.7-B T2 #8, #11, and #15, T2-generation overexpression TaDOF4.7-B transgenic wheat. Values in (e)−(h), (n) are means ± SE from three independent experiments (n ≥ 10). Values in (k)–(m) are means ± SE from three independent experiments (n = 3). Asterisks indicate significant differences (* p < 0.05, ** p < 0.01, *** p < 0.001) based on 2-tailed Student's t-tests.
Figures
(5)
Tables
(0)