-
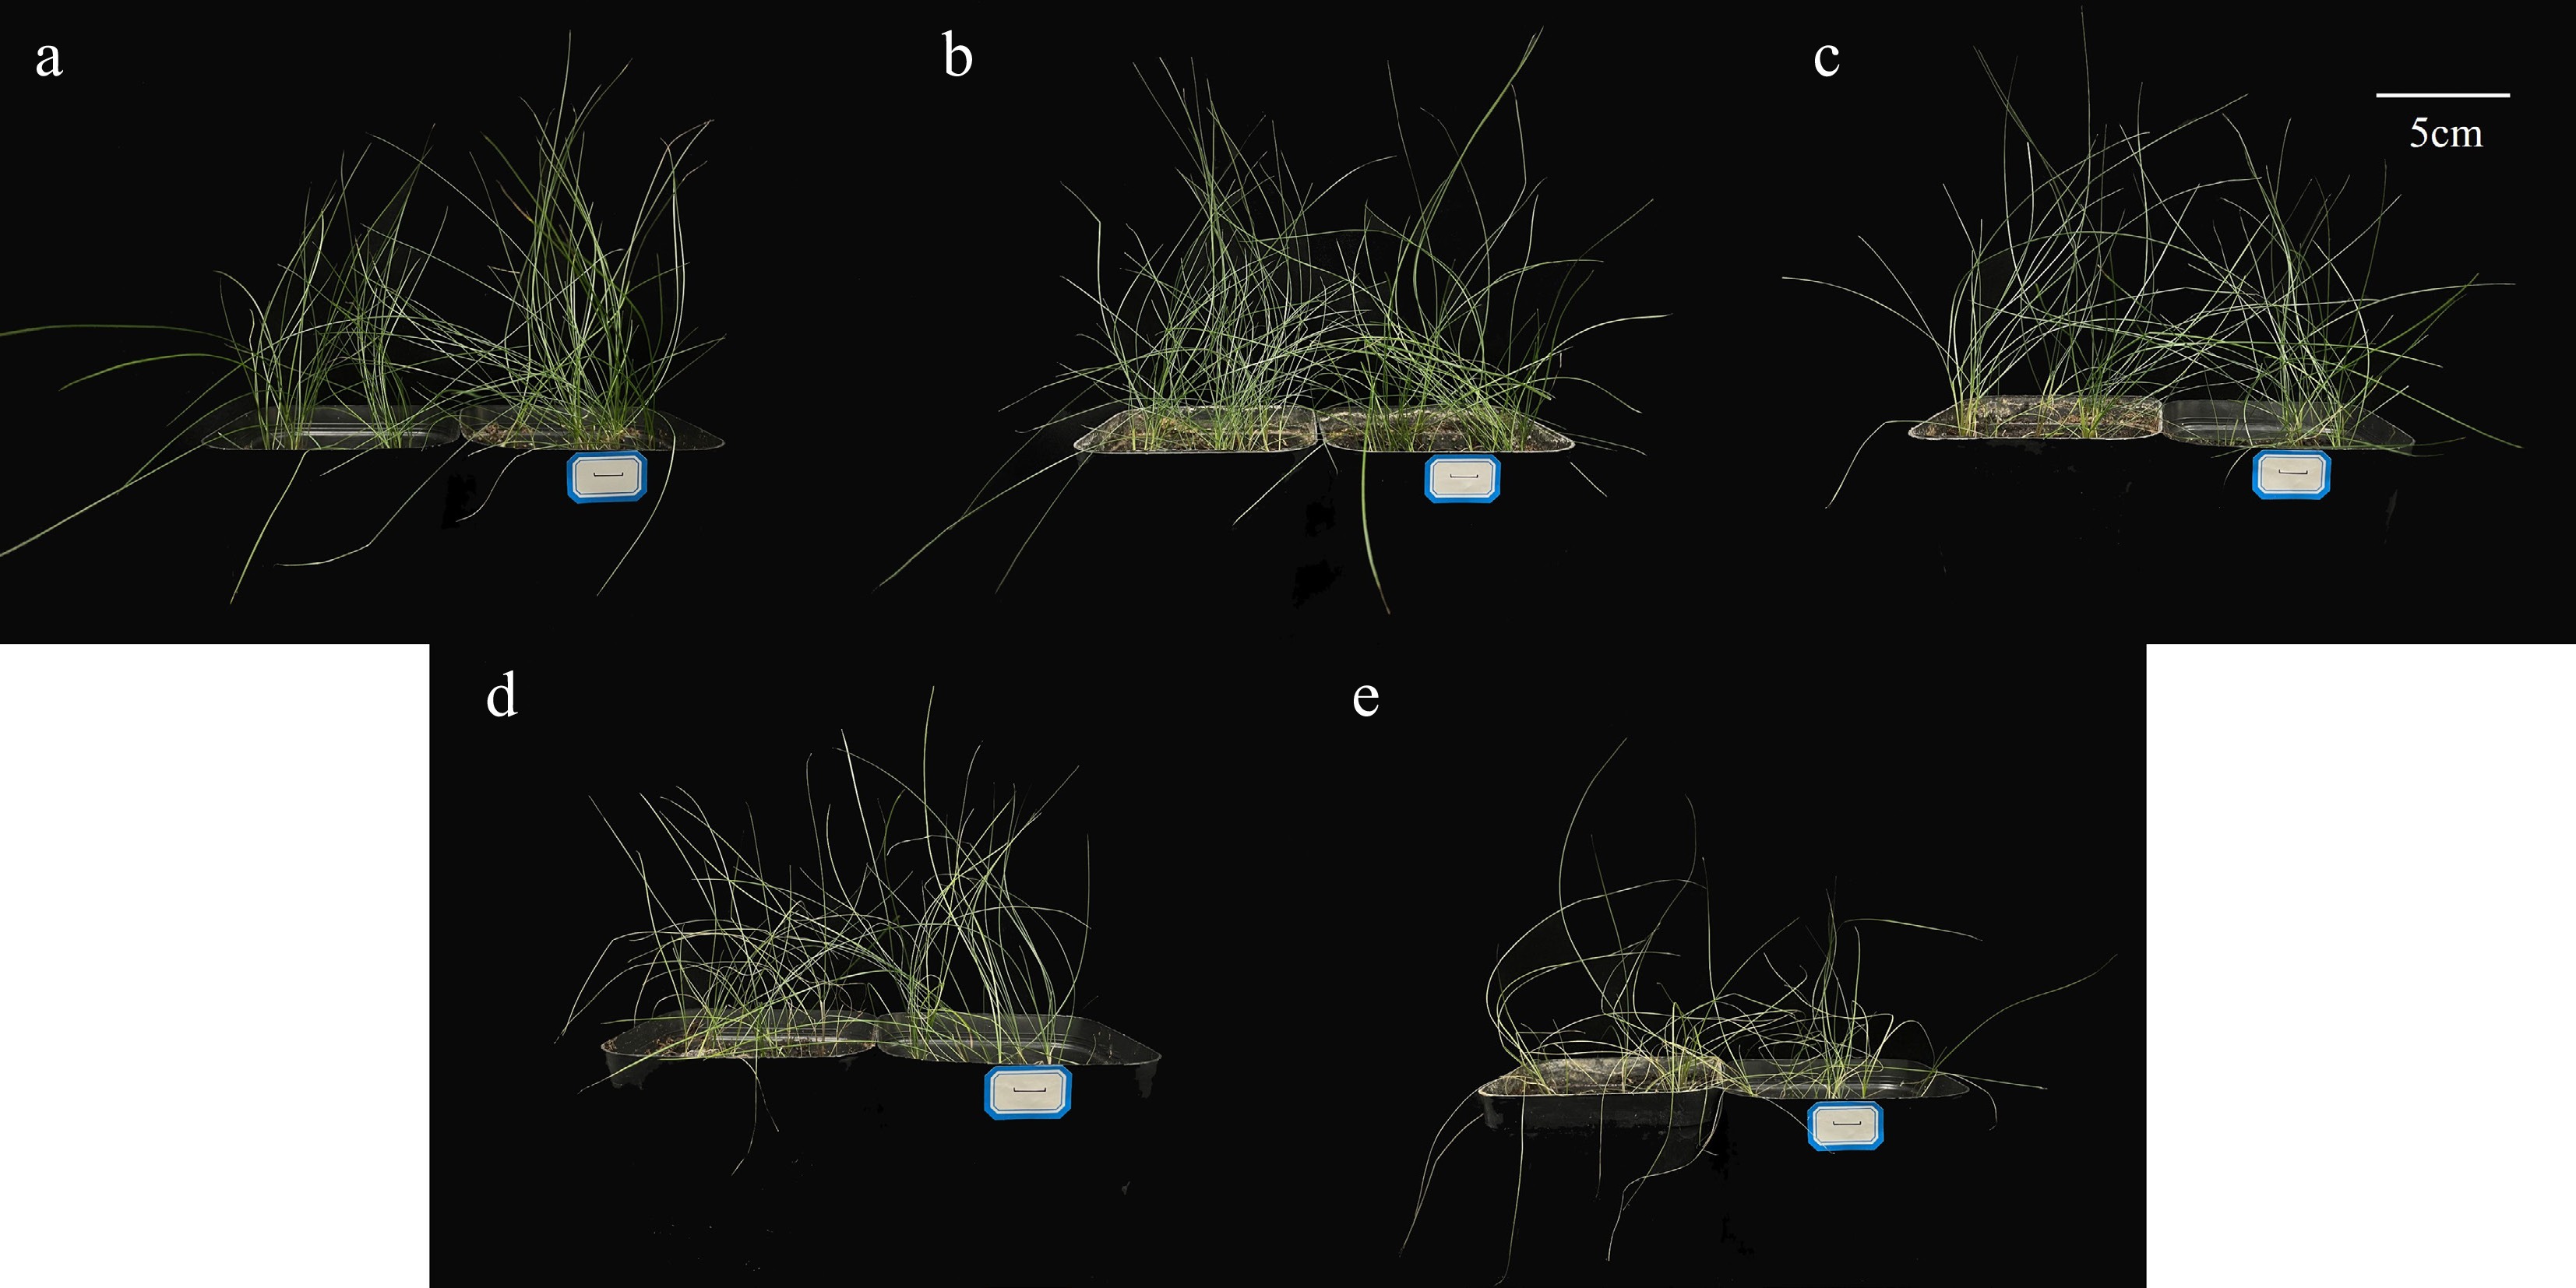
Figure 1.
Effects of different concentrations of salt stress on the phenotype of F. rubra. (a) Control. (b) Salt concentration 0.5%. (c) Salt concentration 1%. (d) Salt concentration 2%. (e) Salt concentration 3%. The scale bar (5 cm) is shown on the figure.
-
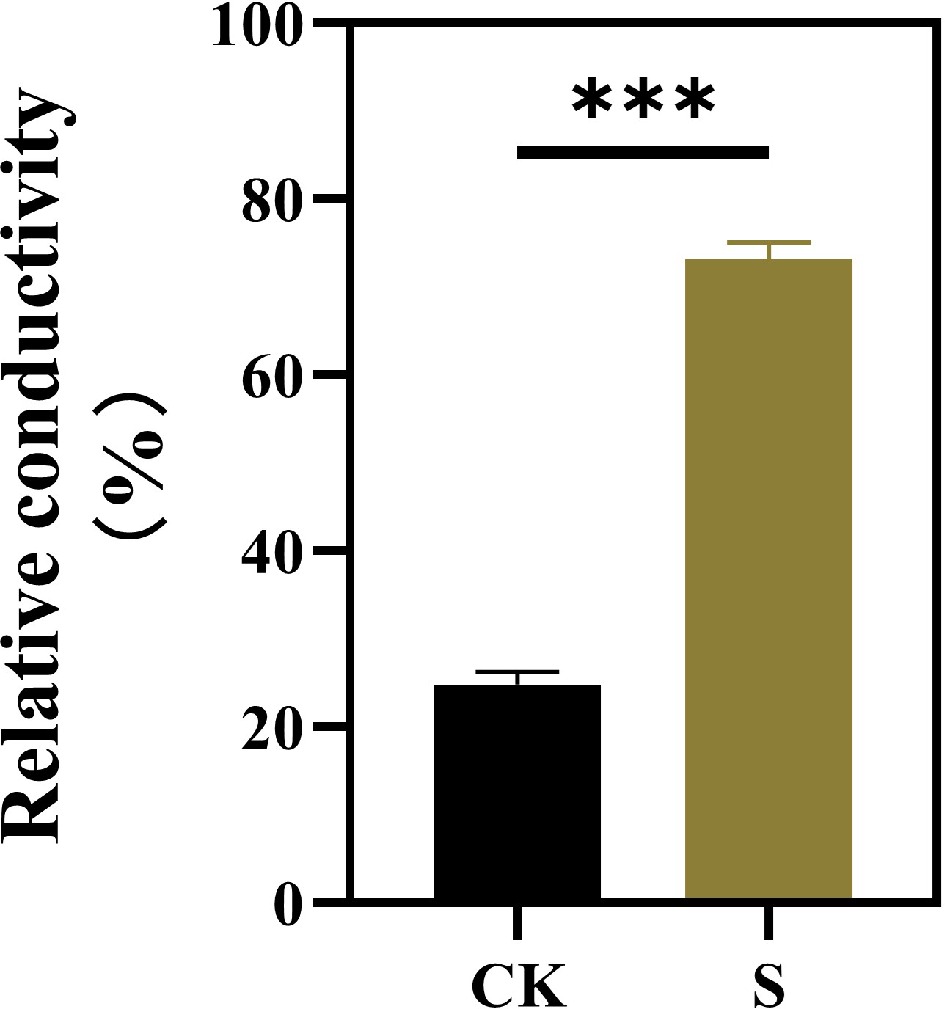
Figure 2.
Effects of salt stress treatments on the leaf conductivity of F. rubra. Values are means ± SE (n = 3 biological replicates). Values are means ± SE (n = 3 biological replicates). After t-test, the value bars with ns are not significant, asterisk denotes statistically significant differences * p < 0.05; ** p < 0.01; *** p < 0.001.
-

Figure 3.
Effects of salt stress treatments on photosynthetic parameters of F. rubra. (a) Net photosynthetic rate. (b) Stomatal conductance. (c) Intercellular CO2 concentration. (d) Transpiration rate. Values are means ± SE (n = 3 biological replicates). After t-test, the value bars with ns are not significant, asterisk denotes statistically significant differences * p < 0.05; ** p < 0.01; *** p < 0.001.
-
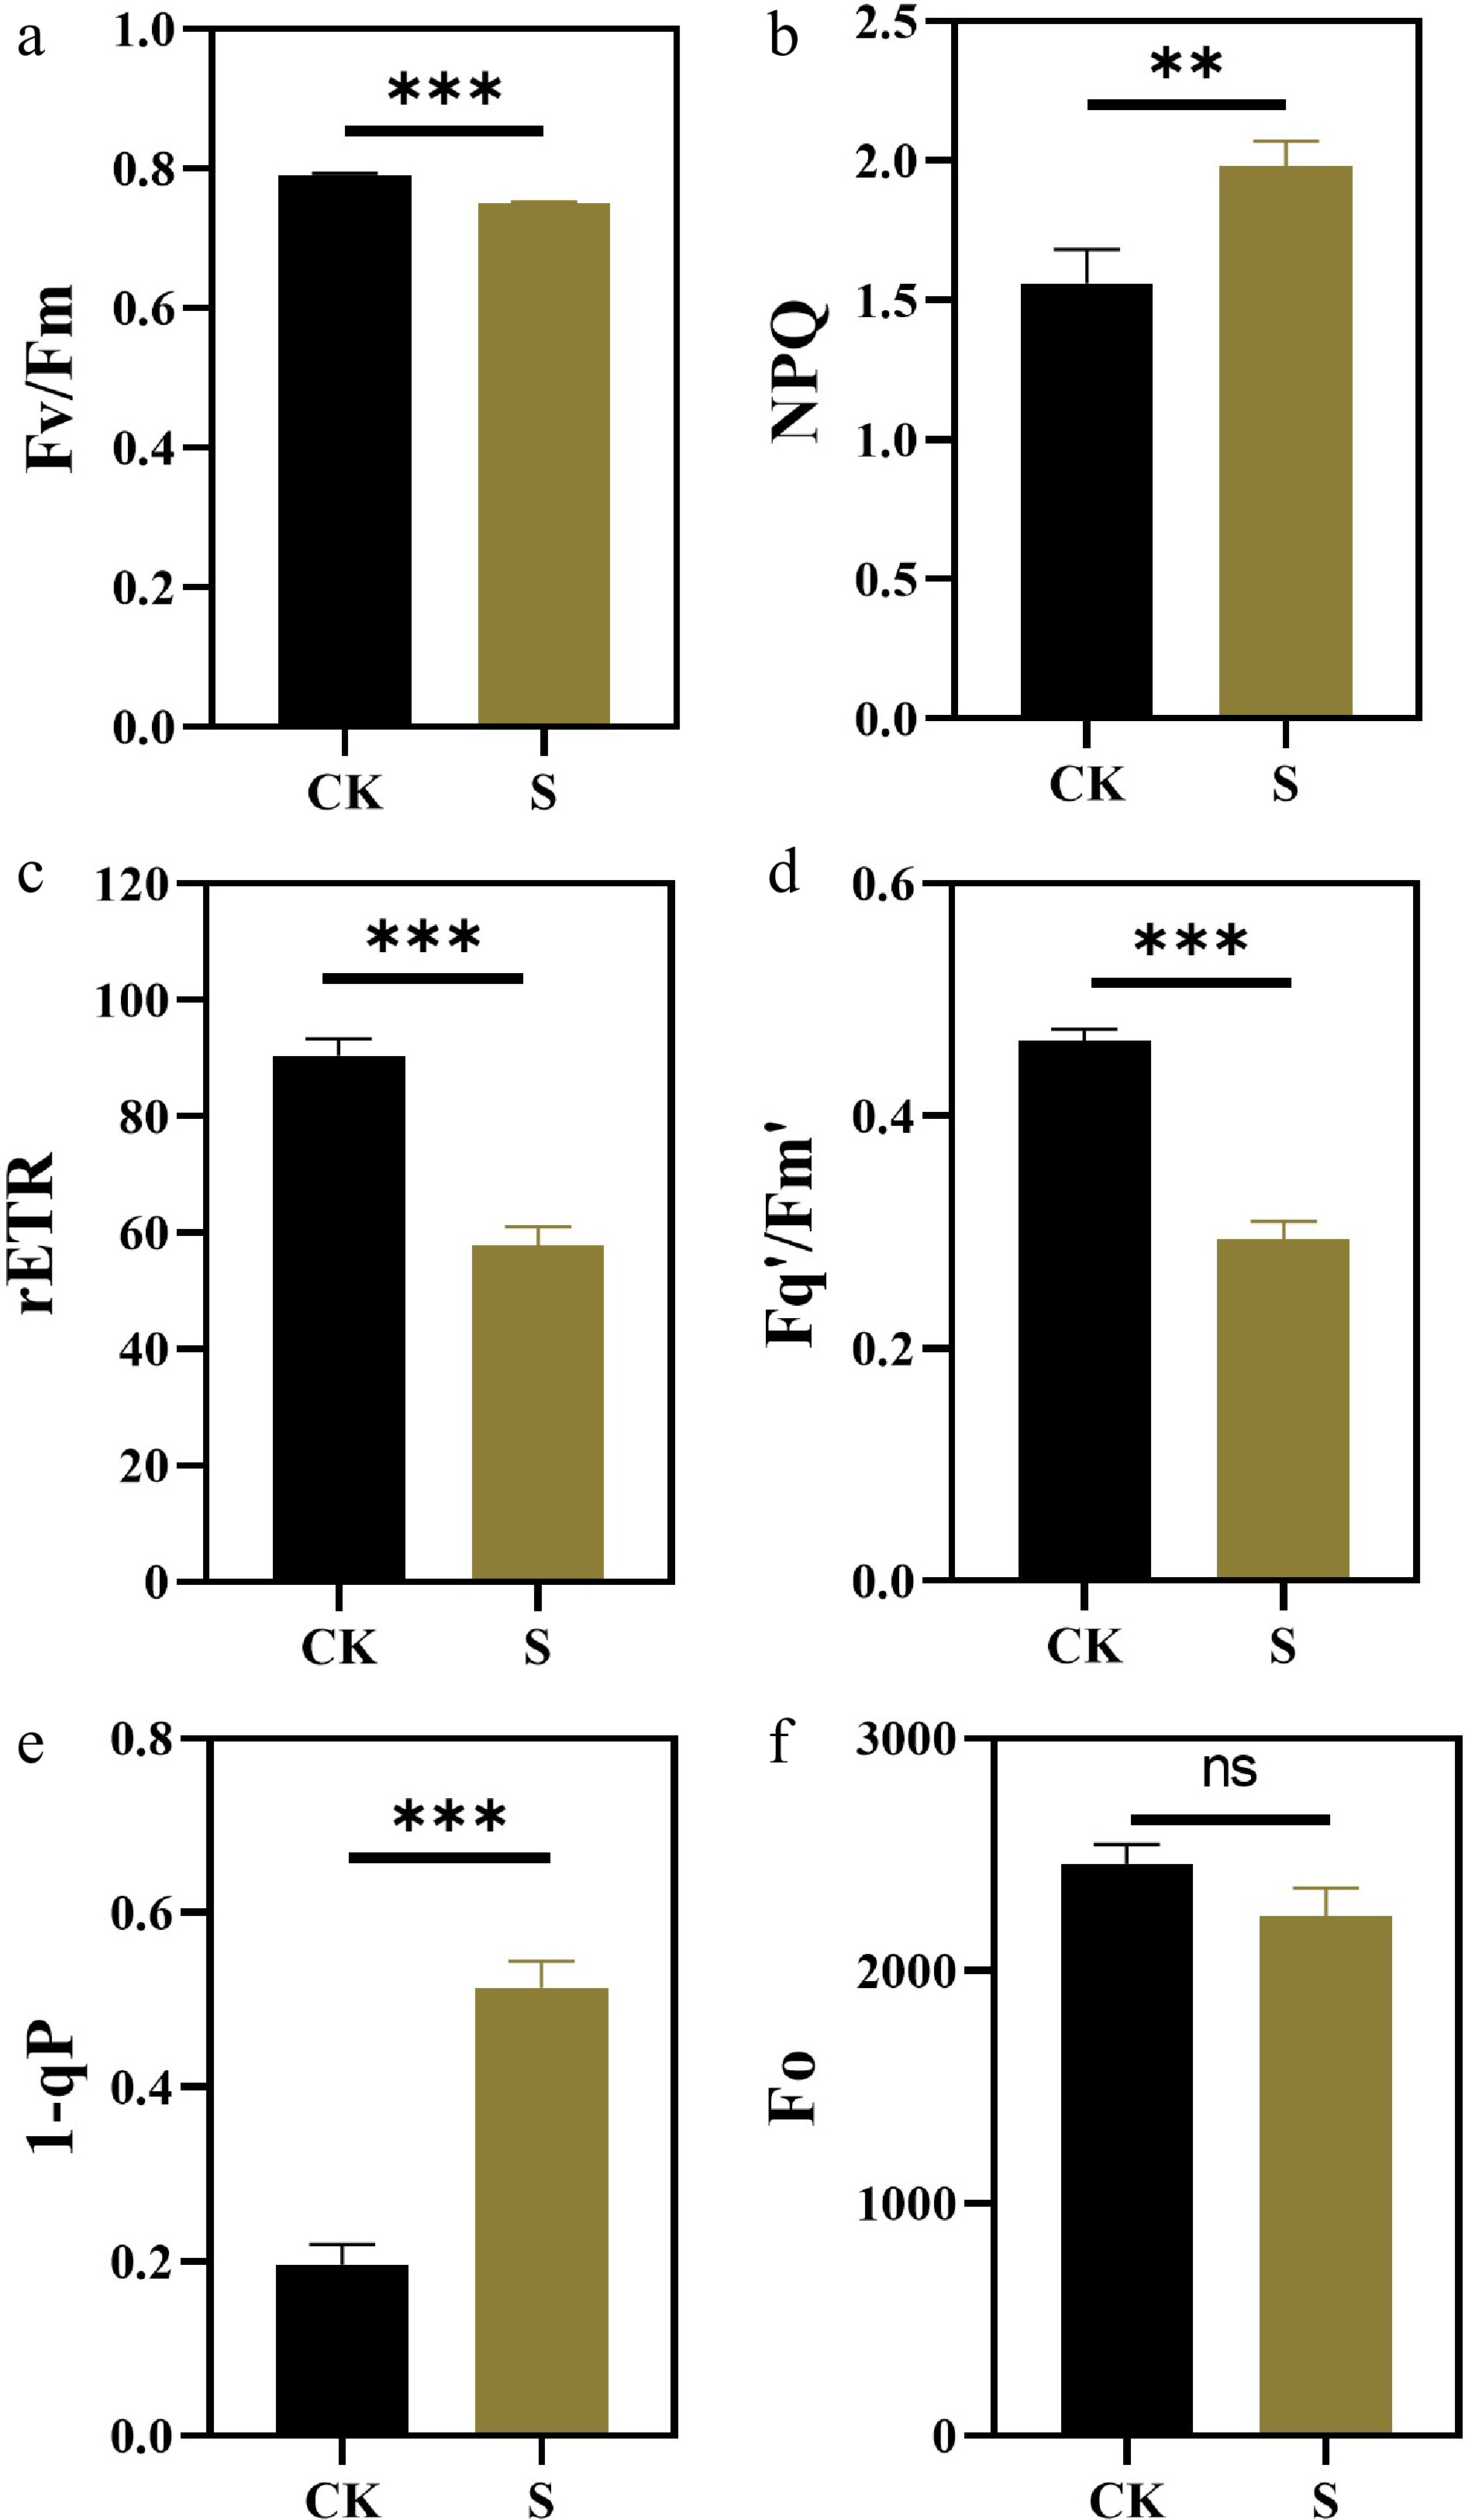
Figure 4.
Effects of salt stress treatments on chlorophyll fluorescence parameters of F. rubra (a) PSII maximum photochemical efficiency (Fv/Fm). (b) Non-photochemical quenching NPQ. (c) Photosynthetic linear electron transport rate (rETR). (d) PSII operating efficiency Fq'/Fm'. (e) Reaction center closure degree 1-qP. (f) Initial fluorescence Fo. Values are means ± SE (n = 3 biological replicates). After t-test, the value bars with ns are not significant, asterisk denotes statistically significant differences * p < 0.05; ** p < 0.01; *** p < 0.001.
-
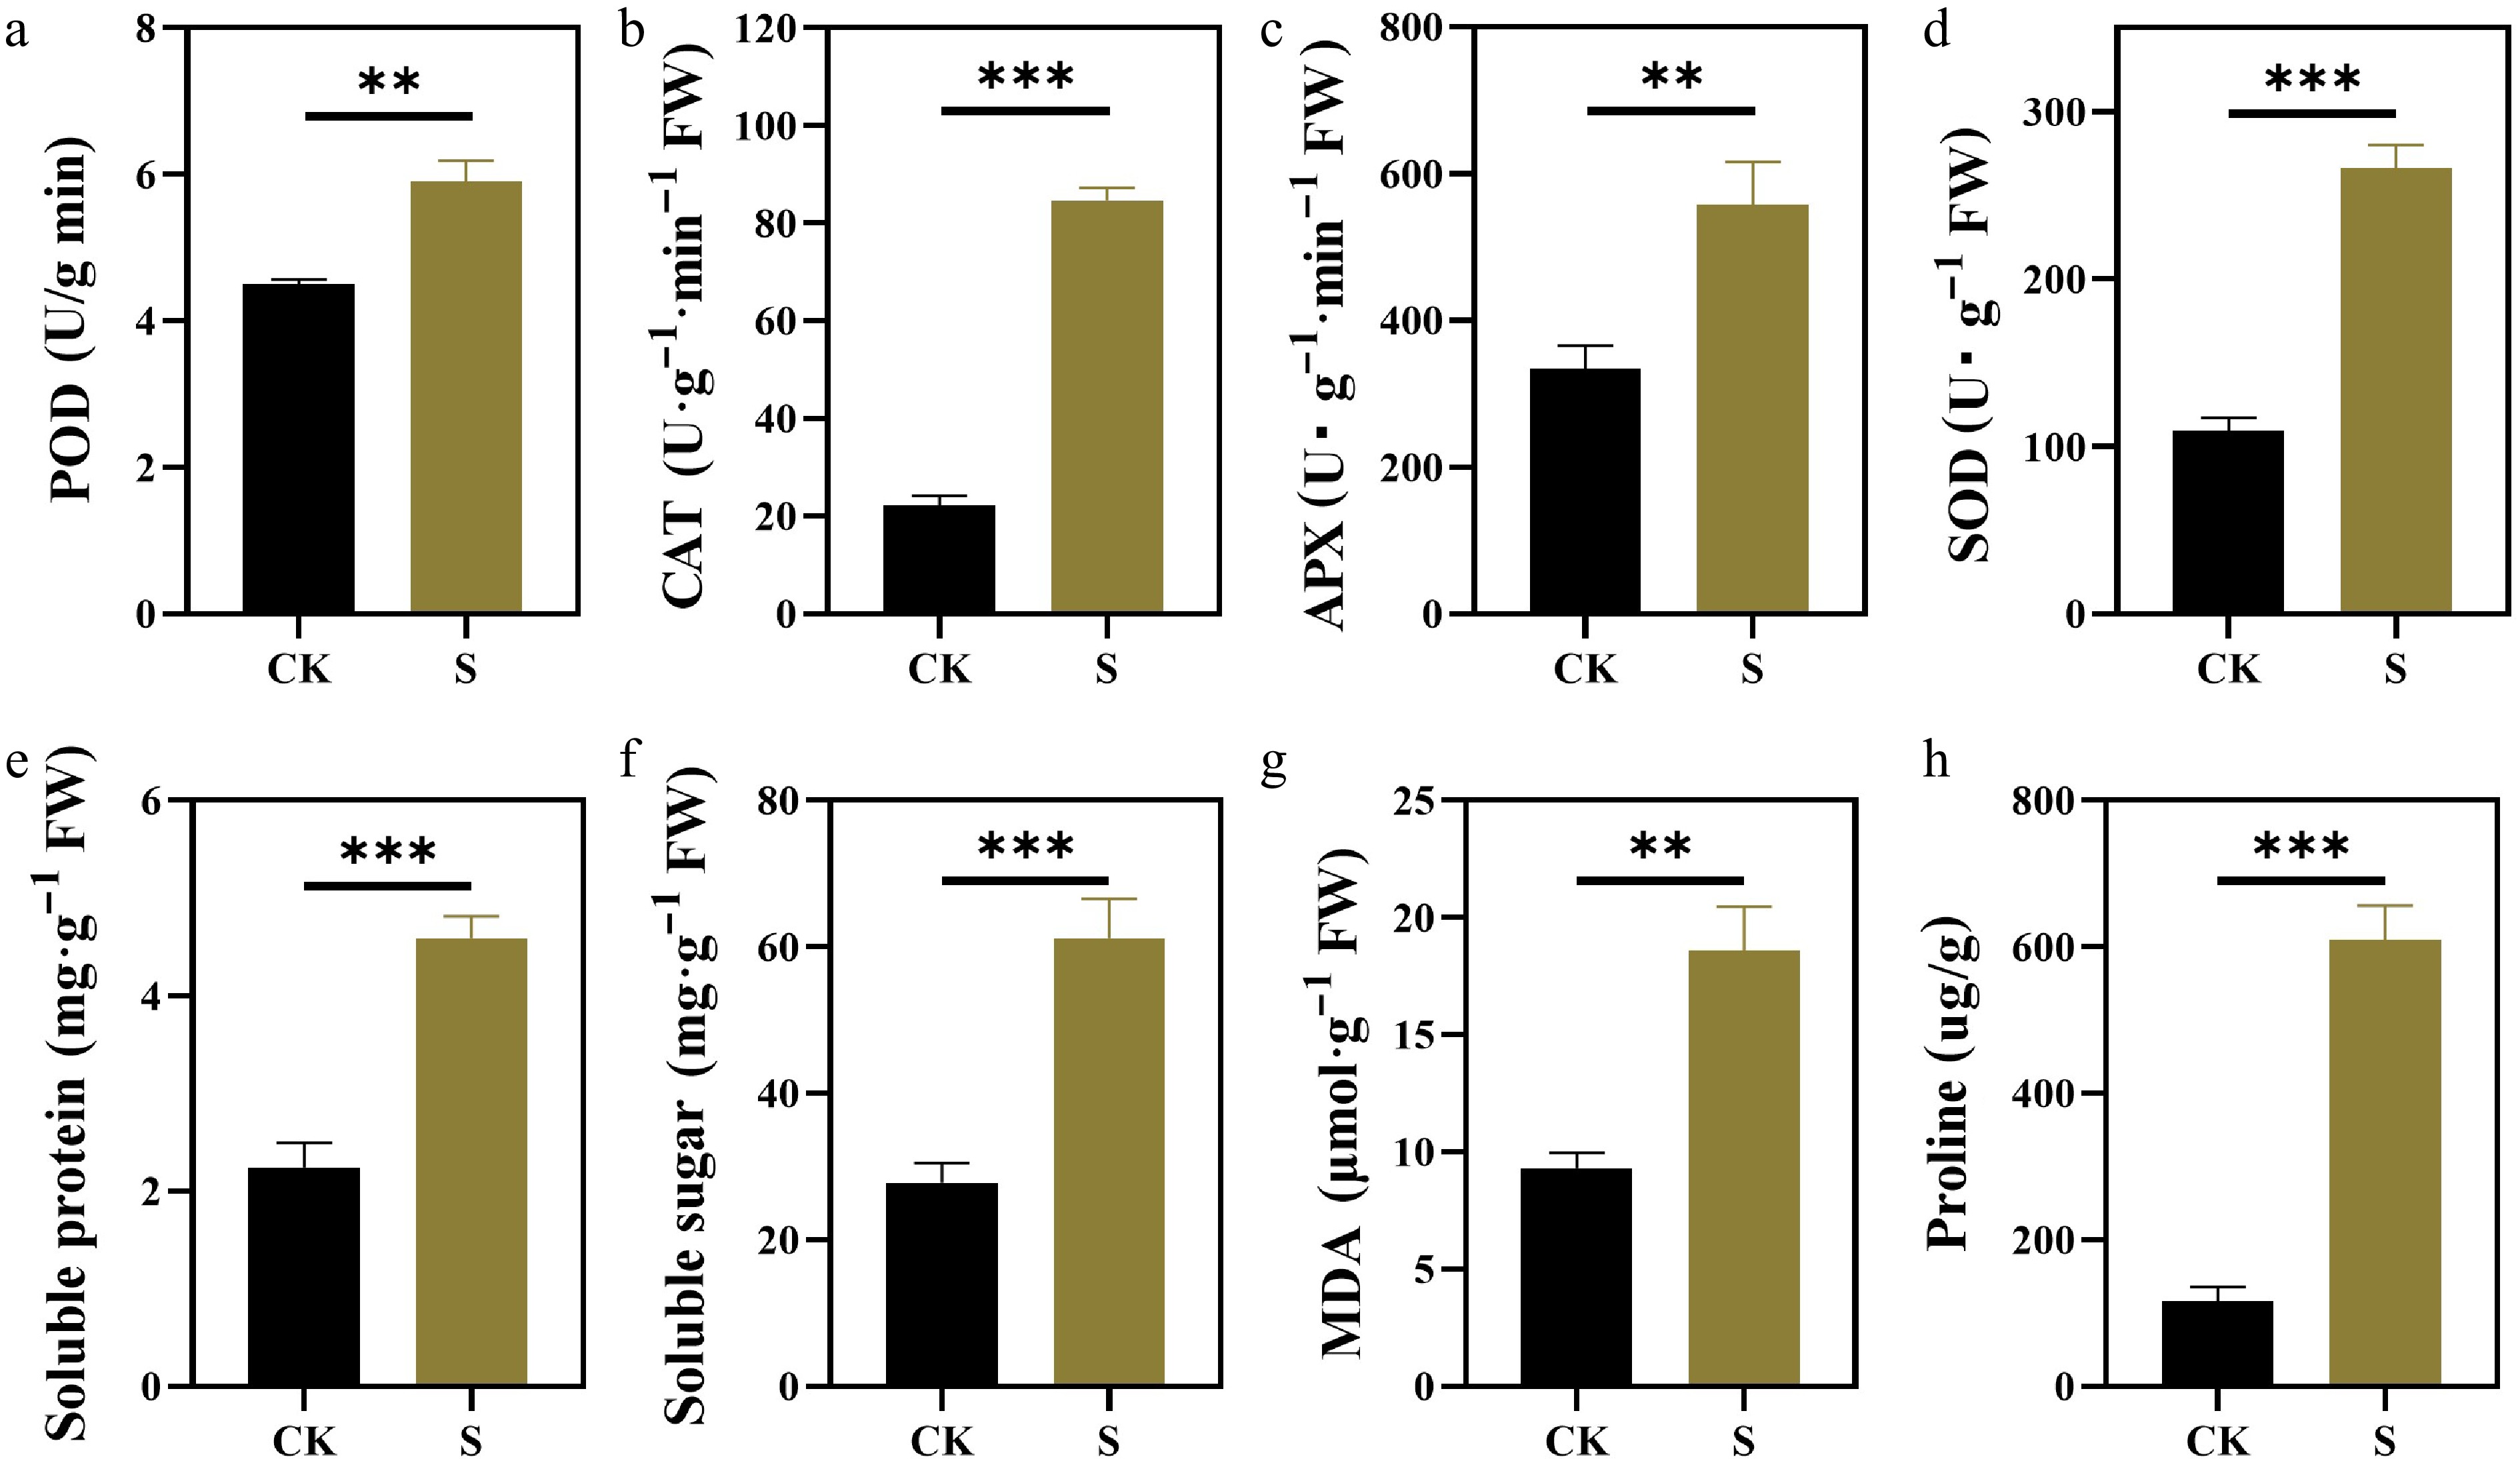
Figure 5.
Effects of salt stress on antioxidant enzyme activities and osmotic adjustment substances of F. rubra. (a) Activity of peroxidase (POD). (b) Activity of catalase (CAT). (c) Activity of ascorbate peroxidase (APX). (d) Activity of superoxide dismutase (SOD). (e) Content of soluble protein. (f) Content of soluble sugar. (g) Content of malondialdehyde (MDA). (h) Content of proline. Values are means ± SE (n = 3 biological replicates). After t-test, the value bars with ns are not significant, asterisk denotes statistically significant differences * p < 0.05; ** p < 0.01; *** p < 0.001.
-

Figure 6.
PCA plot and differently expressed genes number of F. rubra transcriptome samples under salt stress. (a) PCA plot. (b) Differently expressed genes number.
-
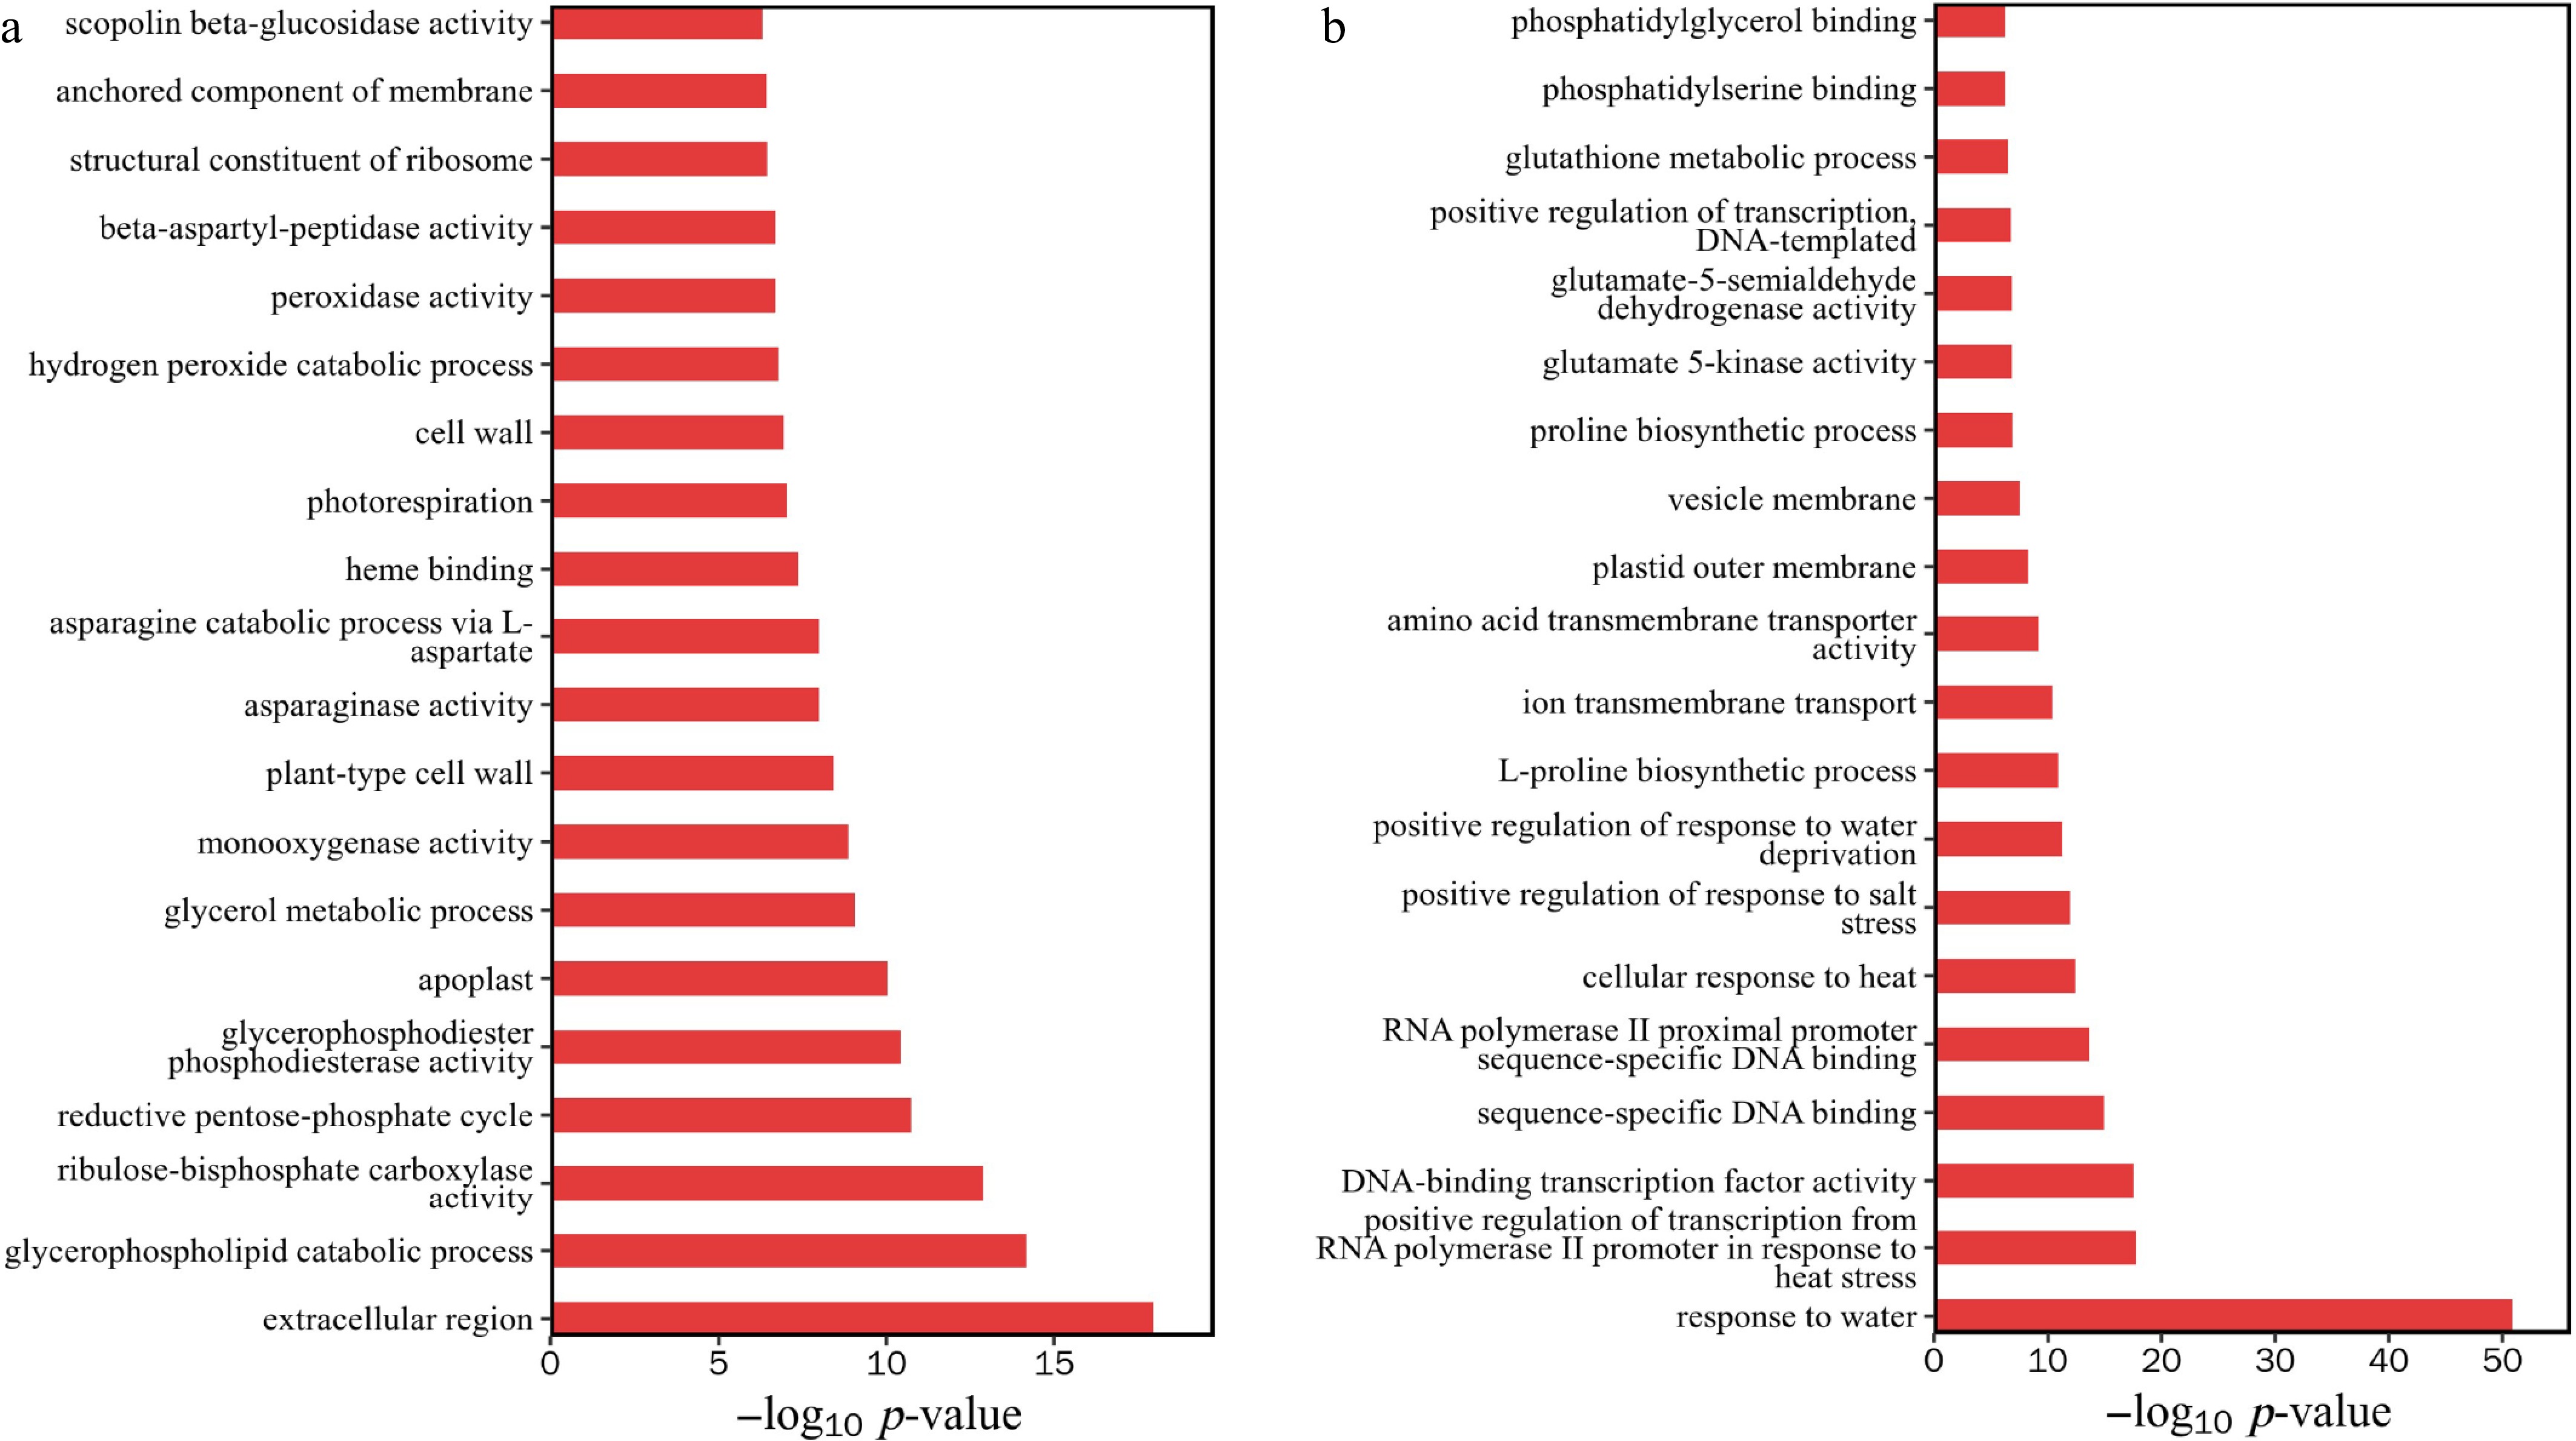
Figure 7.
GO enrichment analysis of differentially expressed genes. (a) Downregulation of gene enrichment function p-value top 20. (b) Upregulation of gene enrichment function p-value top 20.
-
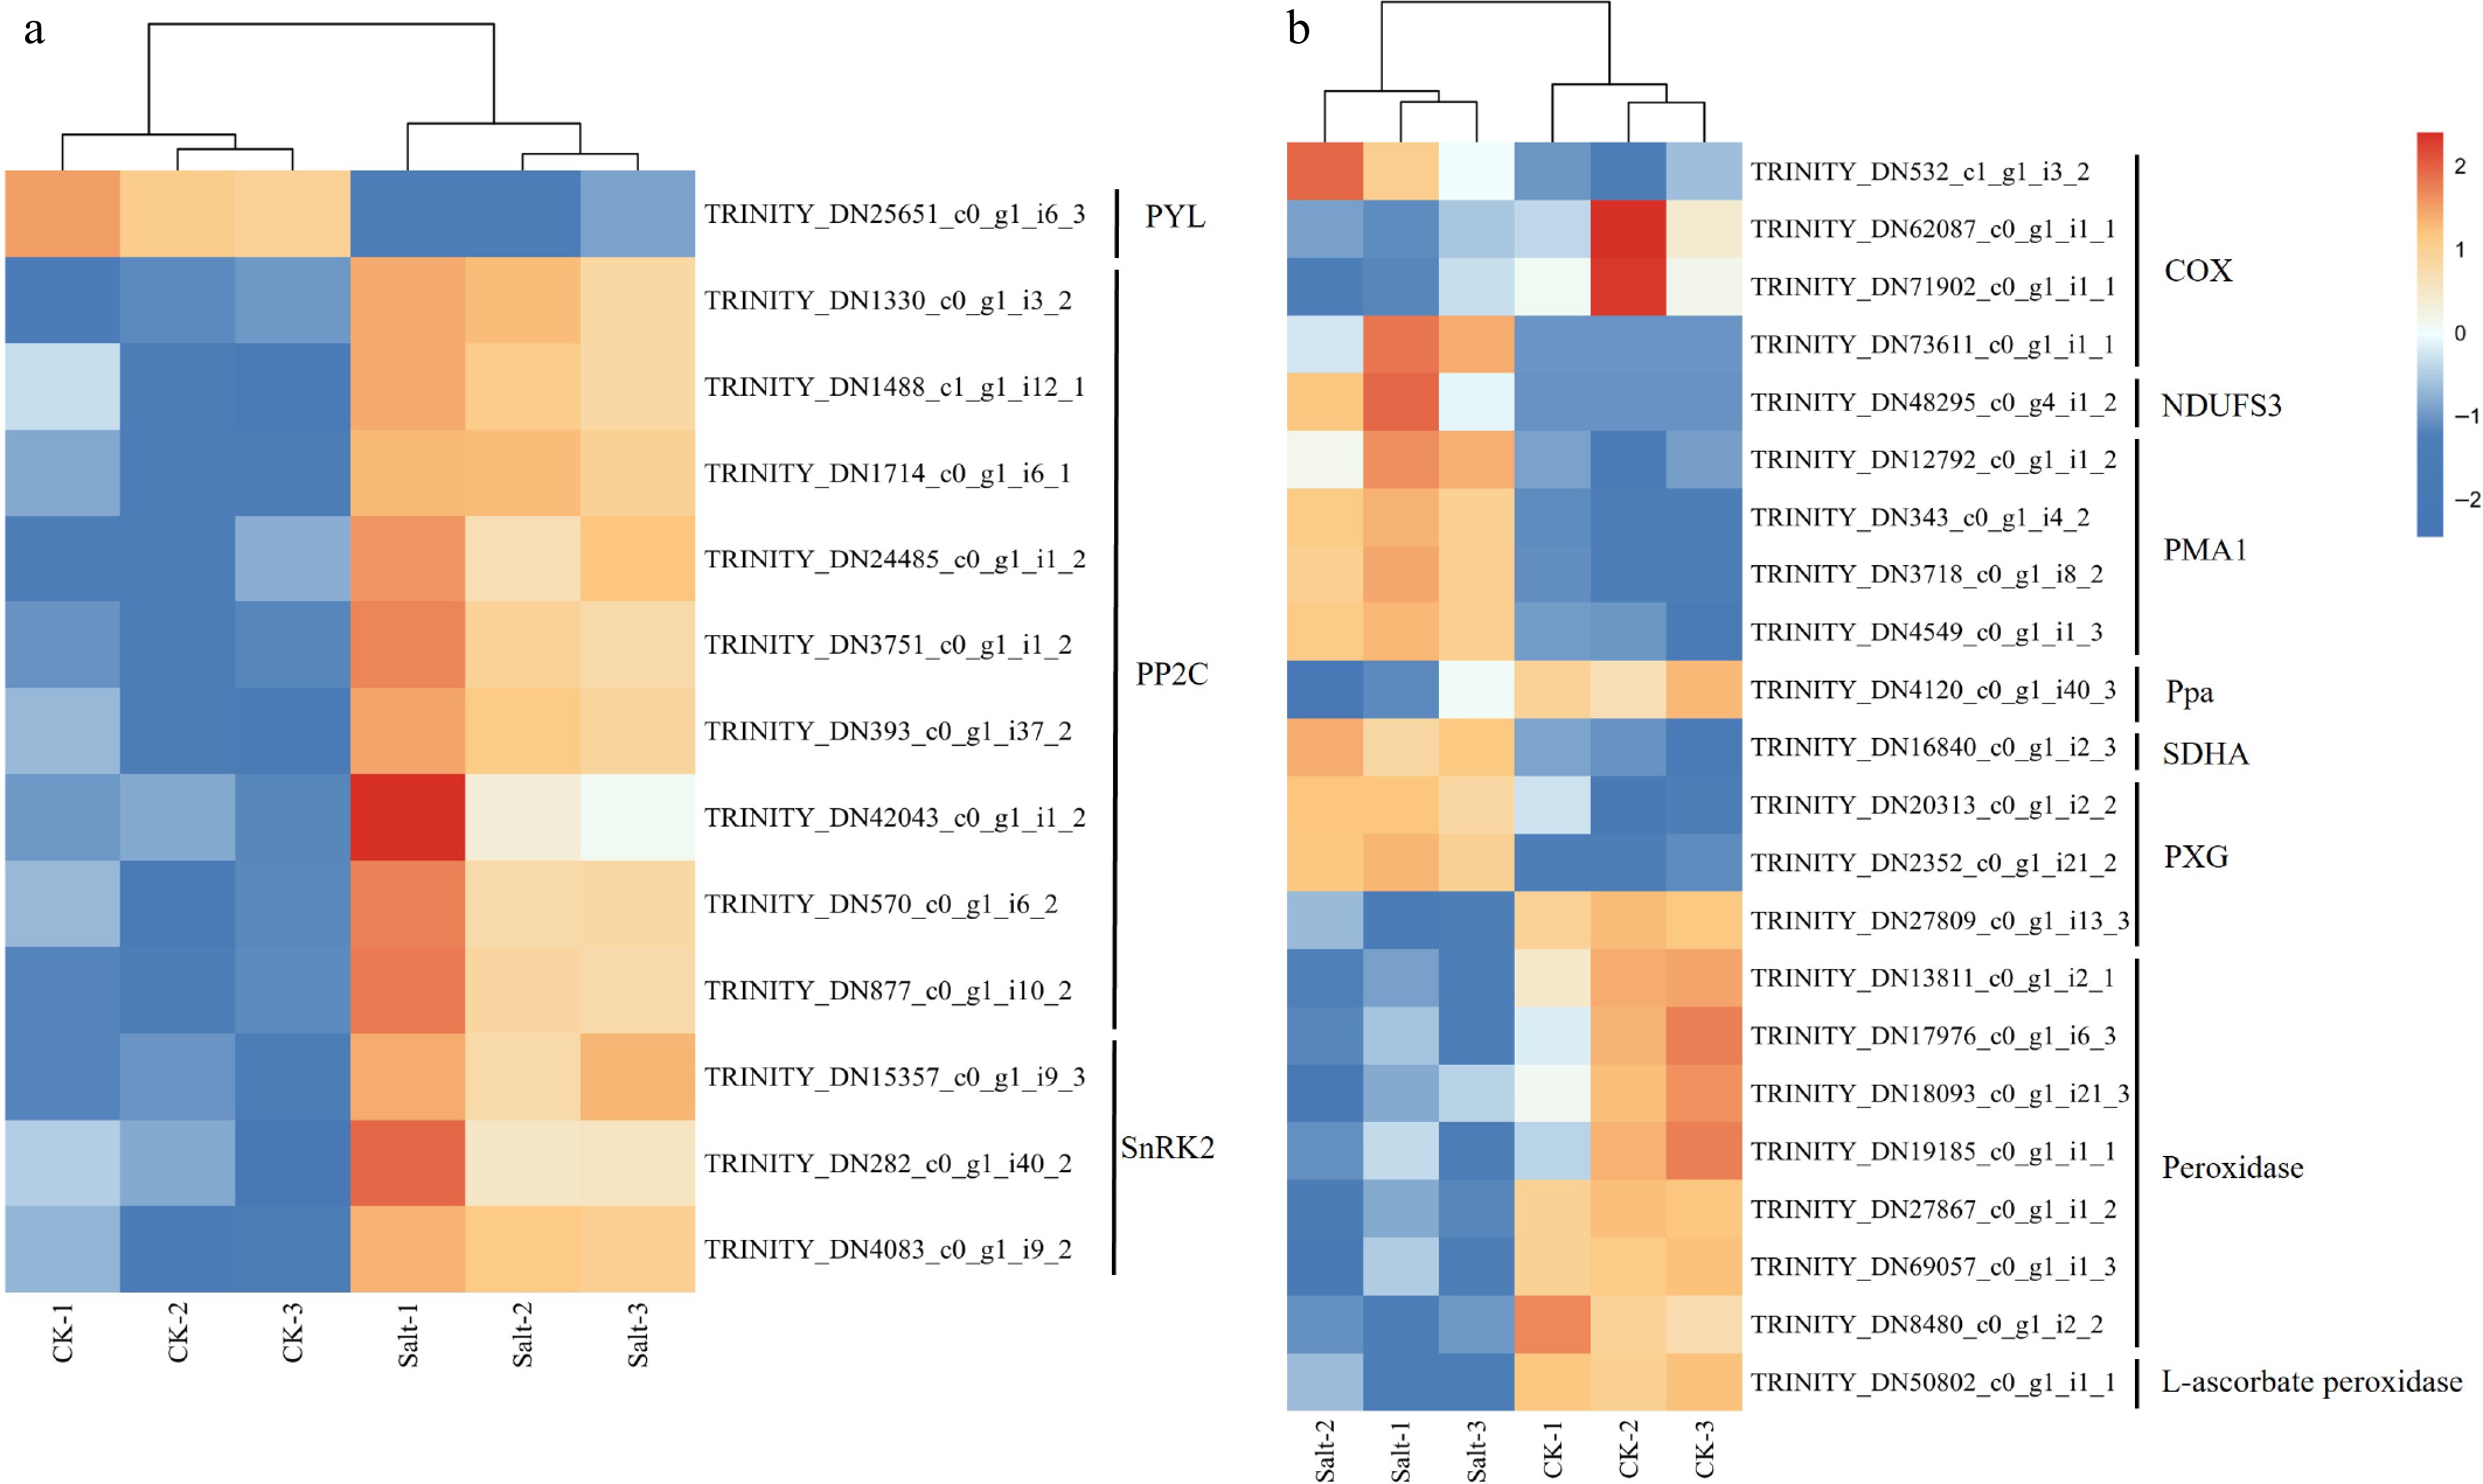
Figure 8.
Gene expression heat map of F. rubra. (a) Expression profiles of transcripts involved in abscisic acid. (b) Expression profiles of transcripts involved in peroxidase activity and oxidative phosphorylation. Expression levels are displayed as log2-transformed FPKM values (Fragments Per Kilobase per Million mapped reads). Color scale indicates relative expression levels: red (upregulation), and blue (downregulation).
-
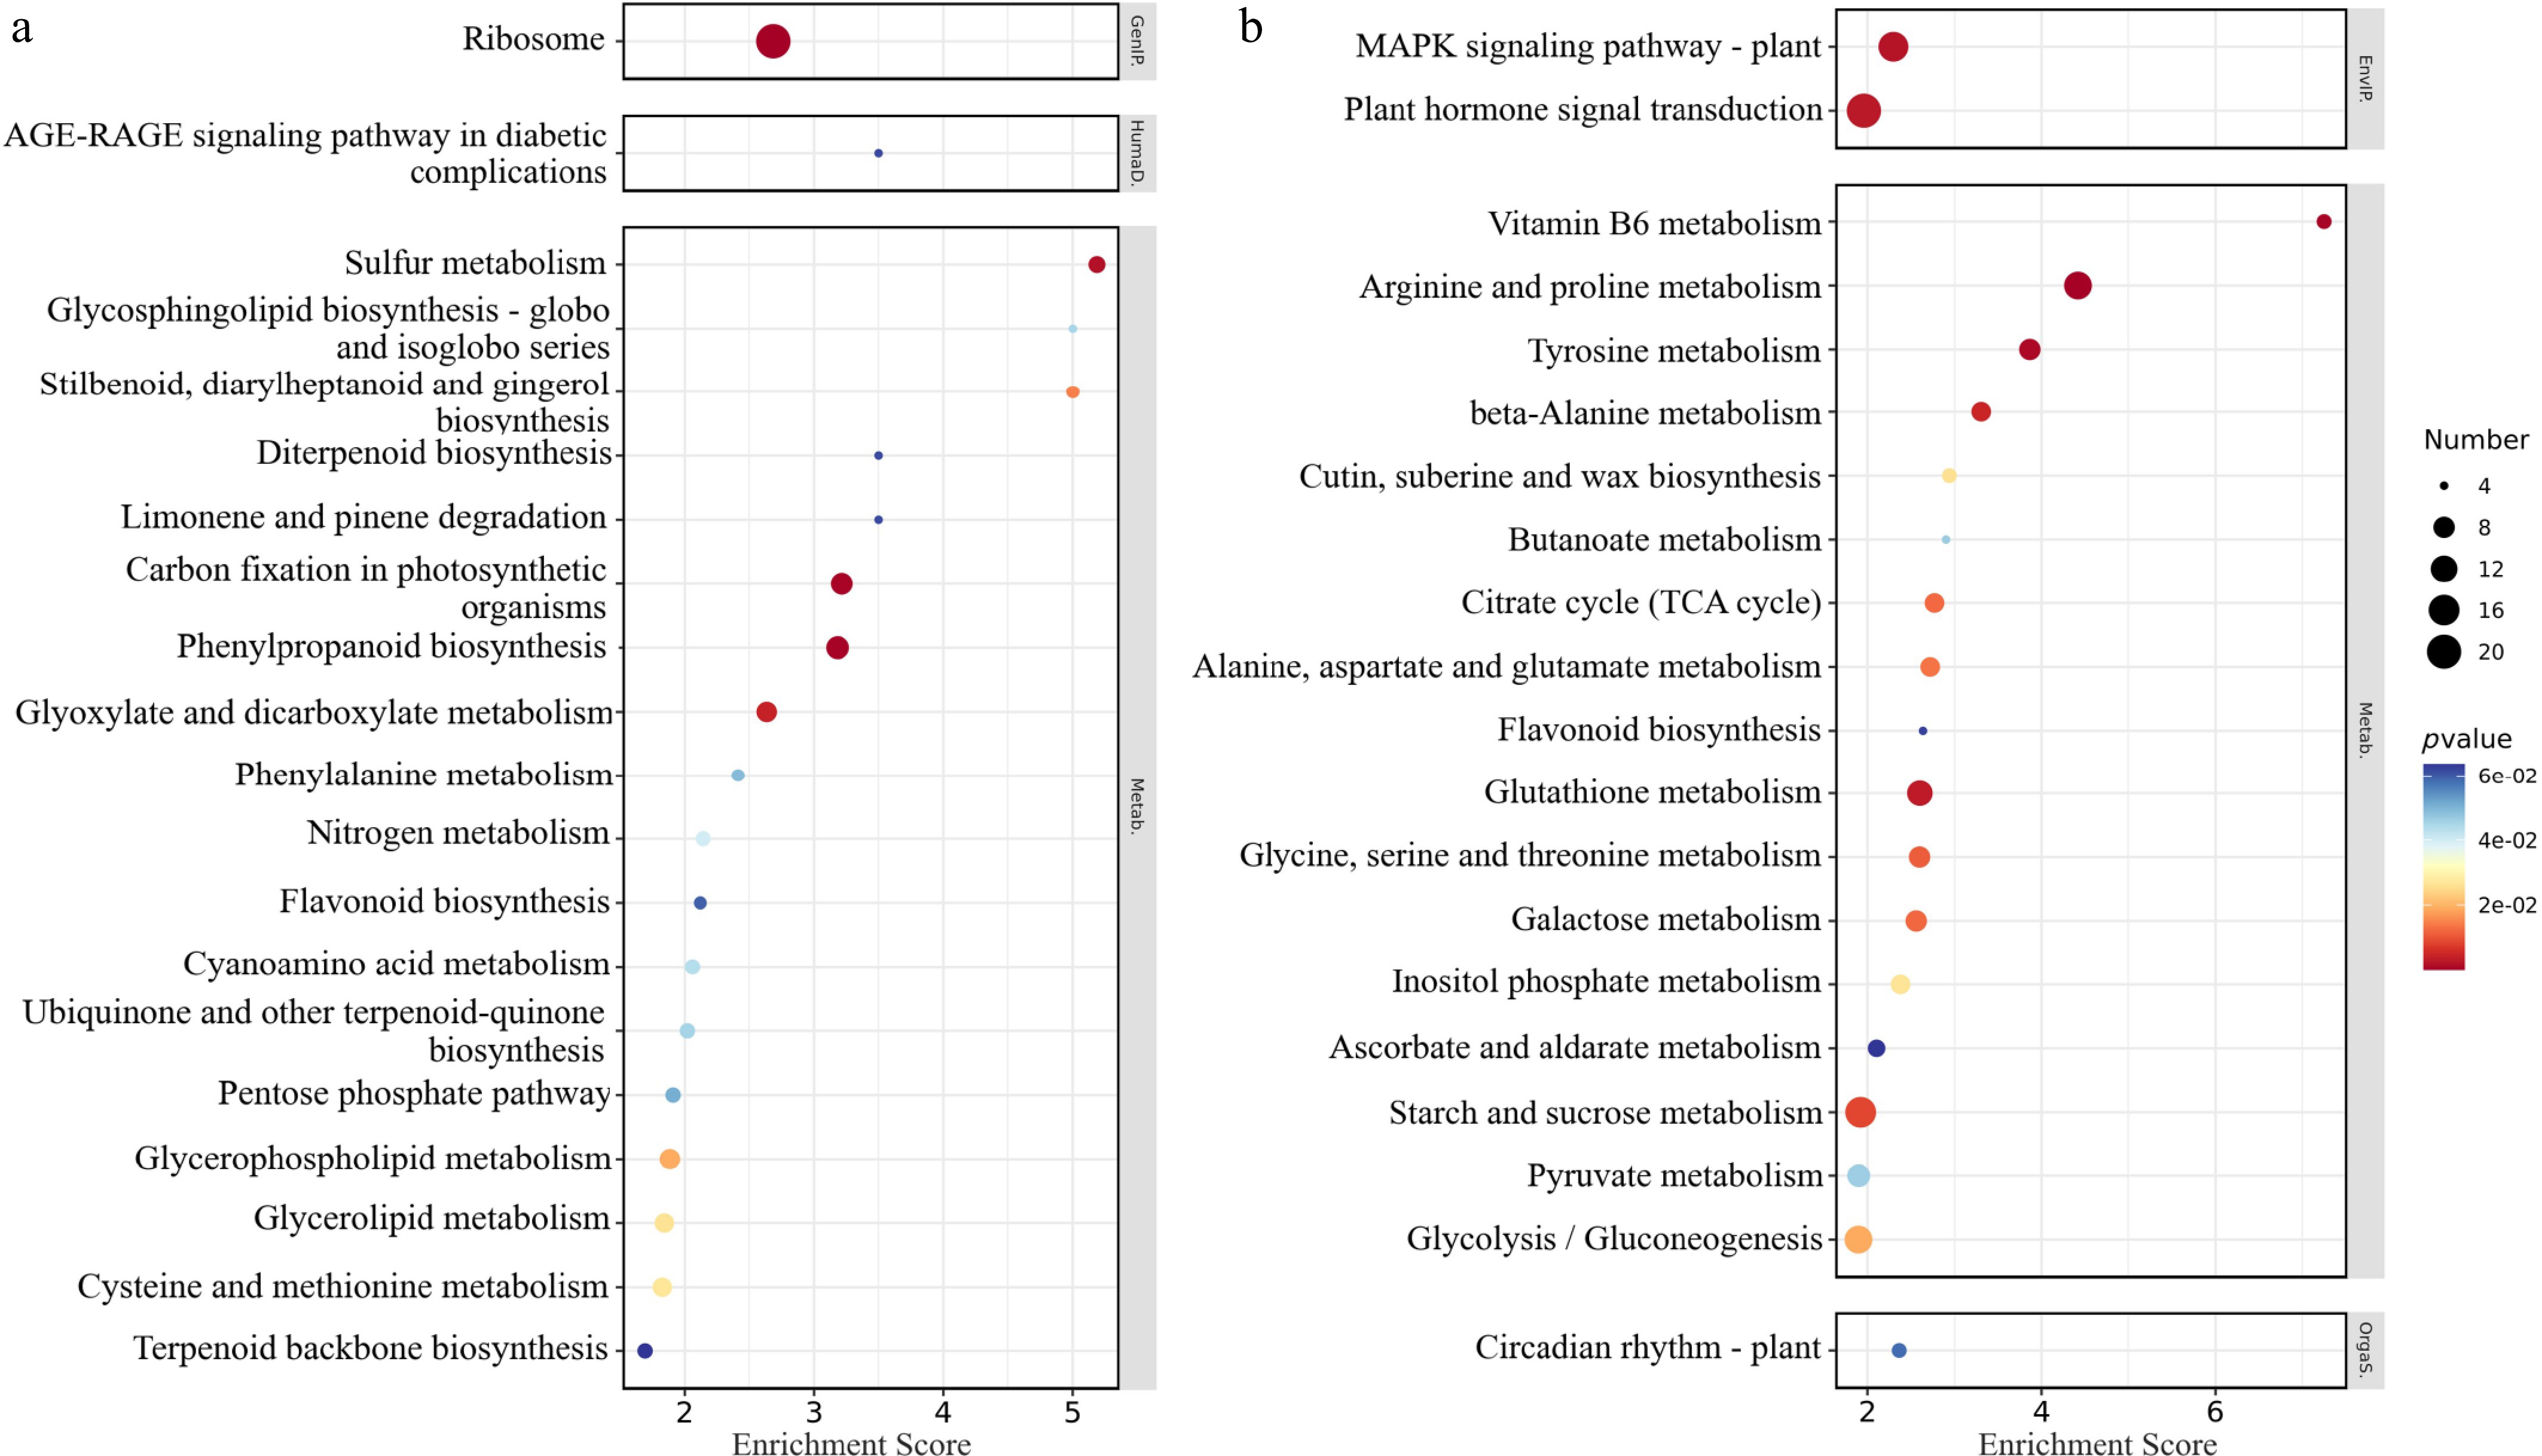
Figure 9.
KEGG enrichment analysis bubble chart of differentially expressed genes. (a) Downregulated gene enrichment pathway enrichment score top 20. (b) Upregulated gene enrichment pathway enrichment score top 20. The abscissa concentrates the enrichment score; the ordinate represents the KEGG pathway; and the size of the bubble represents the number of DEGs annotated to the KEGG pathway. The color of the bubble changes from blue-white-yellow-red, and the smaller the p-value, the greater the significance.
-
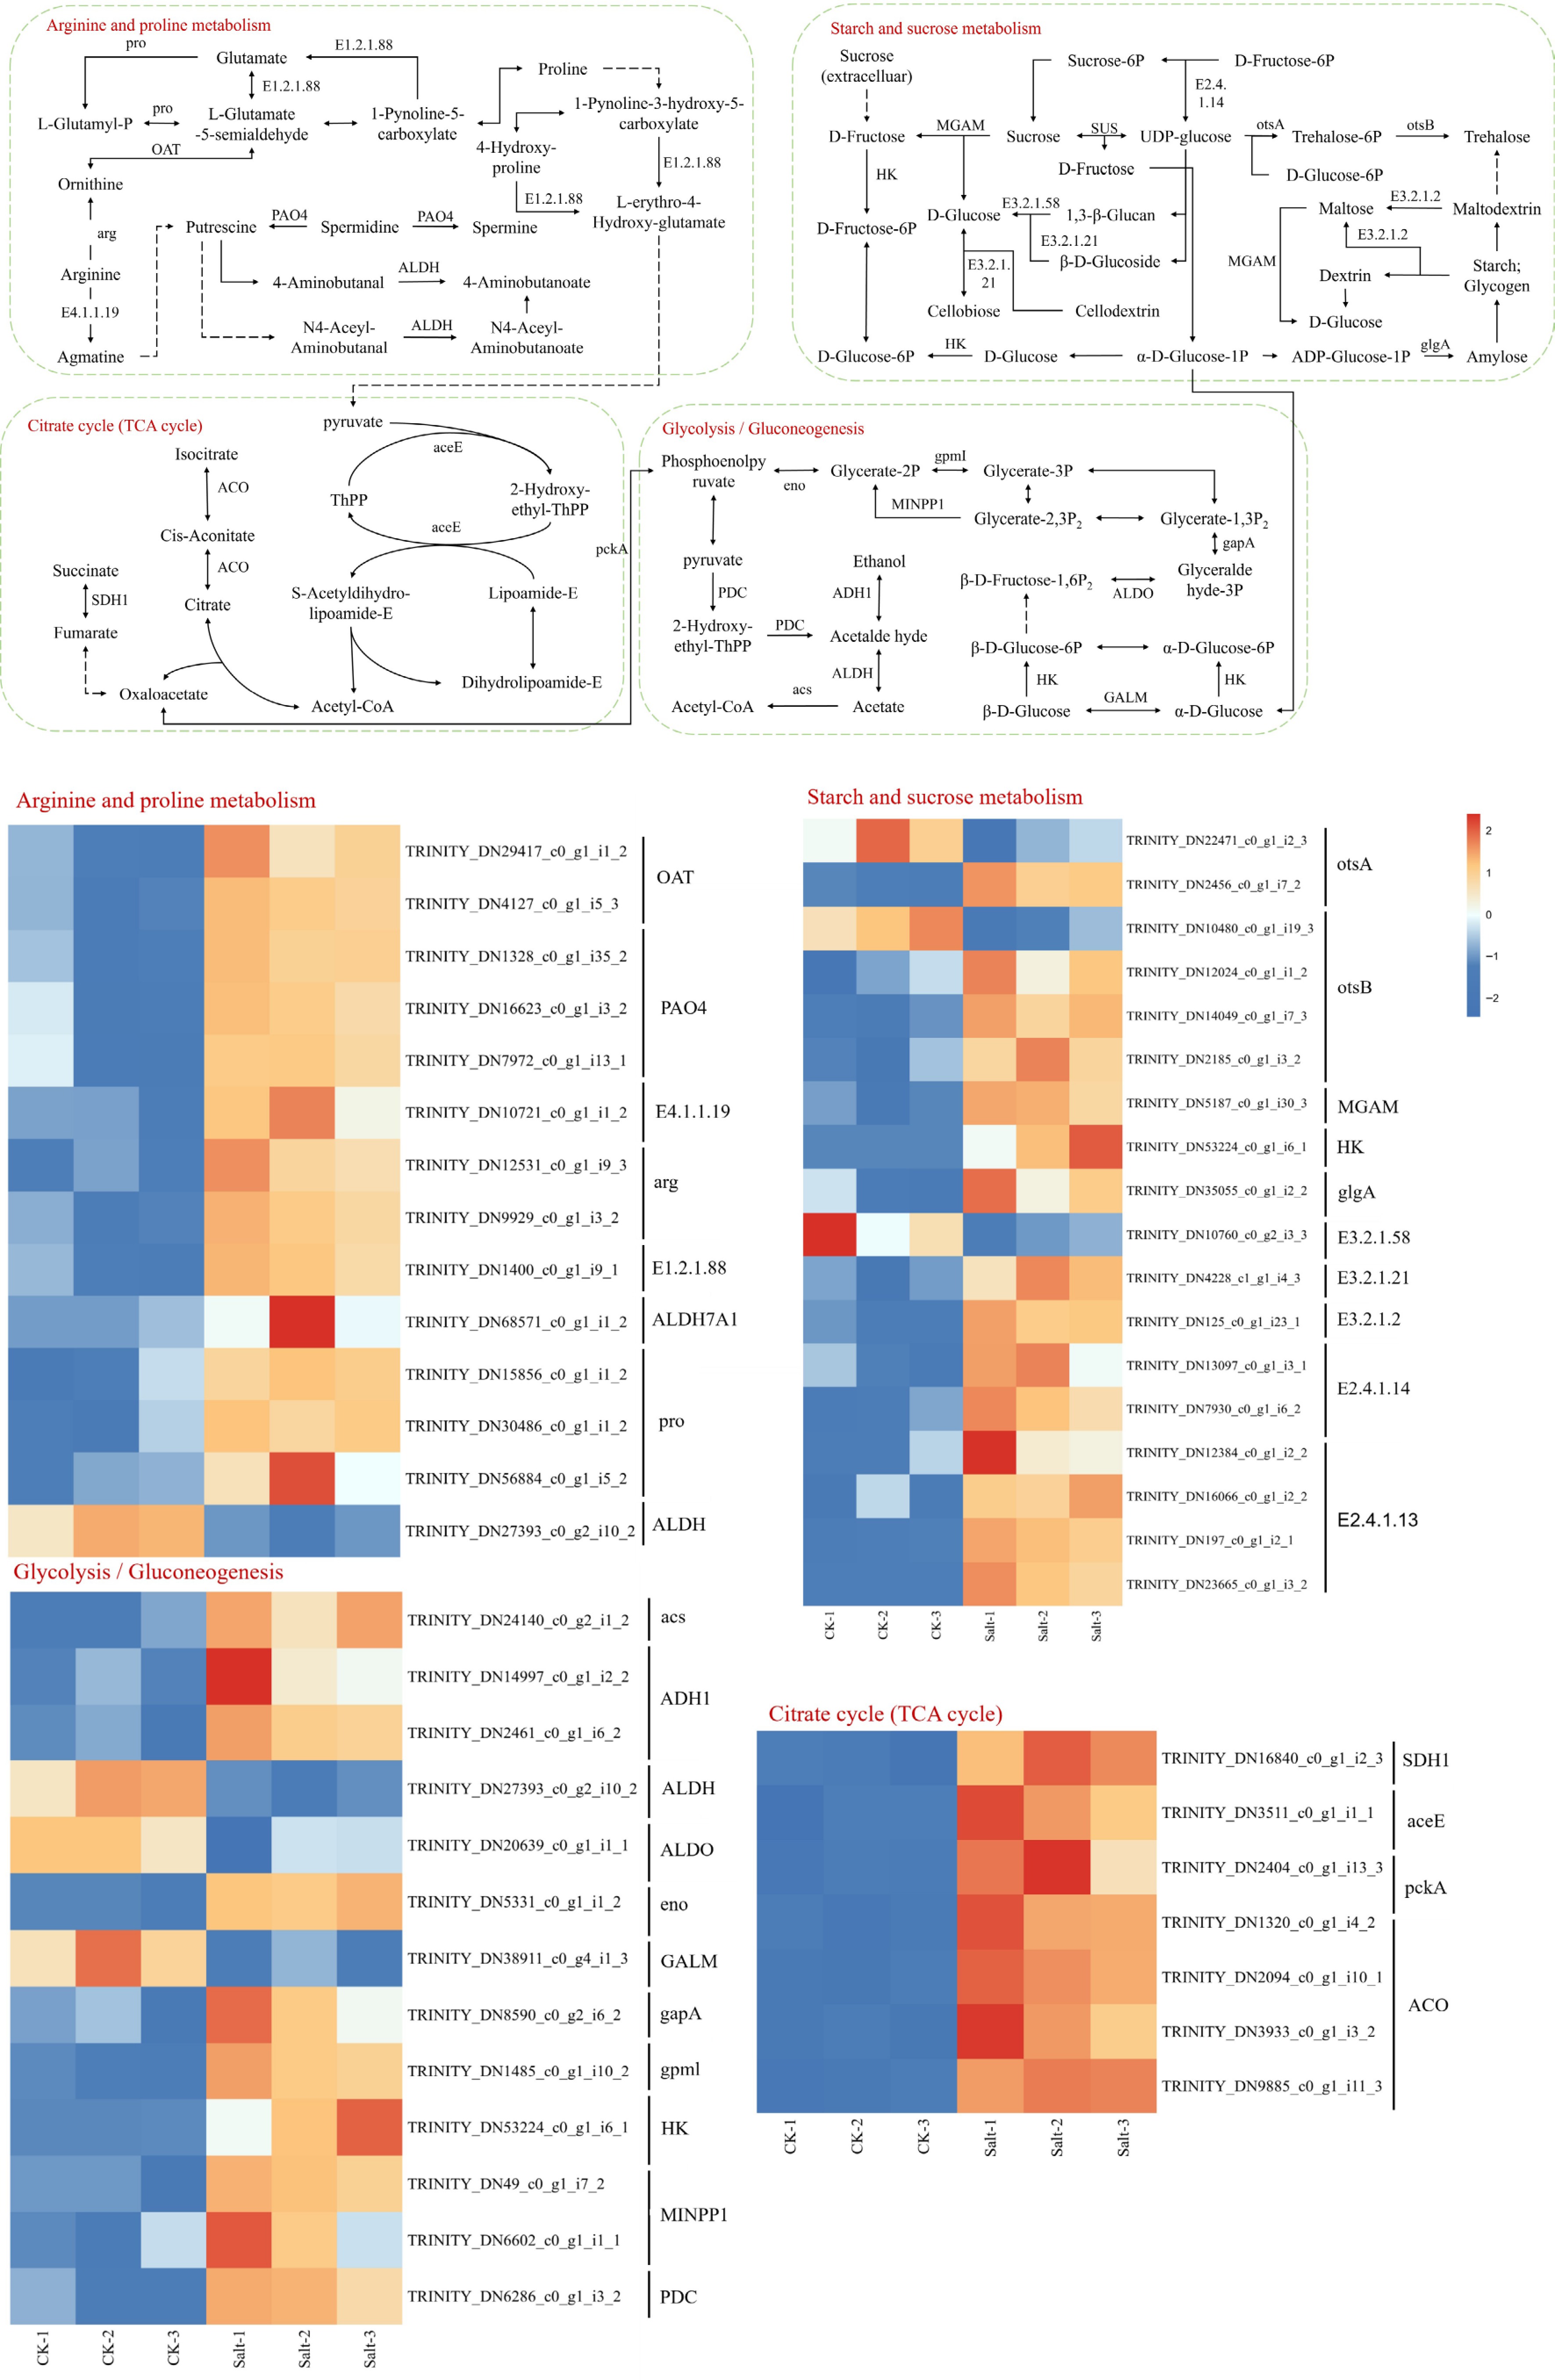
Figure 10.
KEGG significantly enriched DEGs in arginine and proline metabolism, starch and sucrose metabolism, citrate cycle and glycolysis/gluconeogenesis. Expression levels are displayed as log2-transformed FPKM values (Fragments Per Kilobase per Million mapped reads), color scale indicates relative expression levels: red (upregulation), and blue (downregulation).
-

Figure 11.
Distribution of differentially expressed transcription factor families. The dark blue represents the number of transcription factors among all the genes measured, yellow represents the number of transcription factors among differentially expressed genes, light blue represents the number of transcription factors among downregulated differentially expressed genes, and pink represents the number of transcription factors among upregulated differentially expressed genes.
Figures
(11)
Tables
(0)