












-
Salt stress represents a key abiotic constraint on global agriculture and ecological restoration. Particularly in arid and semi-arid regions, plant growth is severely inhibited by soil salinization through mechanisms including ion toxicity, osmotic imbalance, and oxidative damage[1]. Globally, over 900 million hectares of land are affected by salinization, with irrigated agricultural areas accounting for approximately one-third of this total. Climate change and anthropogenic activities exacerbate the extent and severity of this degradation[2]. Festuca rubra L. (F. rubra), a cold-season turfgrass valued for both ornamental and ecological attributes, demonstrates moderate salt tolerance along with resistance to cold and barren soils. These characteristics support its widespread use in greening and restoring salinized marginal lands[3]. However, understanding F. rubra's salt tolerance threshold and adaptive regulatory mechanisms is needed to address challenges posed by global cropland salinization.
Following salt stress, excessive ions are absorbed by roots from the soil, translocated via xylem to shoots, and ultimately accumulated in leaves. This accumulation directly inhibits the uptake of essential mineral nutrients, including potassium (K+) and calcium (Ca2+)[4]. The resulting ionic imbalance causes significant physiological damage: Na+ occupies K+ binding sites, causing nutrient competition; reduced osmotic potential induces cellular dehydration; photosynthetic activity is suppressed; and reactive oxygen species (ROS) generation promotes membrane damage, as indicated by elevated malondialdehyde (MDA) levels[2,5−7]. Ultimately, this cascade leads to growth retardation or plant death.
Plants counteract these effects through integrated physiological and molecular adaptations. Compatible osmolytes such as proline are accumulated to enhance cell turgor and stabilize macromolecules, as evidenced in Pancratium maritimum, where oxidative damage protection is conferred by proline[8,9]. Phytohormone signaling networks are modulated critically, with stomatal closure being mediated by abscisic acid (ABA) to alleviate water deficit[10], ABA accumulation being regulated by nitric oxide in maize[11], and ethylene receptors such as tobacco NTHK1 are salt-induced[12]. Concurrently, enzymatic antioxidant defenses are activated through the mobilization of superoxide dismutase, ascorbate peroxidase, catalase, and associated redox enzymes to neutralize ROS toxicity[13], while ROS are utilized as secondary messengers in stress signaling cascades[14]. Ion homeostasis is maintained through two principal strategies: plasma membrane Na+ extrusion via the SOS pathway involving SOS1 Na+/H+ antiporters[15,16], where H2O2 signaling is integrated through SOS2-catalase interactions[17]; and vacuolar compartmentalization mediated by NHX exchangers that sequester sodium into organelles[18]. At the transcriptional level, extensive reprogramming is orchestrated by MAP kinase signaling modules coordinating ROS homeostasis and SOS pathway activity[17,19]. Crucially, transcription factor networks are mobilized, with families including WRKY, NAC, MYB, and bZIP serving as master regulators that orchestrate antioxidant production, osmolyte biosynthesis, hormone signaling, and ion transporter expression[20]. Species-specific configurations of these networks, exemplified by NAC-mediated ABA signaling in rice and WRKY-dependent stress memory in maize, fine-tune the salt adaptation response[21,22].
While existing studies have characterized general salt tolerance strategies in F. rubra—such as osmotic/ion homeostasis and stress gene activation[23]—the specific regulatory networks governing these responses remain systematically unexplored at the transcriptome level. This study addresses critical gaps in understanding the integrated physiological-transcriptomic dynamics of F. rubra under progressive salt stress, particularly the absence of comparative data on early versus sustained response mechanisms and unidentified master regulators unique to this species. It is hypothesized that F. rubra employs novel transcription factors coordinating ROS scavenging with ion compartmentalization. Through correlating real-time physiological measurements (ion flux, photosynthetic efficiency) with time-series RNA-seq data, identification of stage-specific tolerance genes, reconstruction of salt-responsive regulatory pathways, and pinpointing of candidate targets for varietal improvement is expected. These outcomes will establish the first comprehensive model of F. rubra salt adaptation, advancing foundational knowledge for molecular breeding.
-
F. rubra L. (Mengshen, Beijing Zhengdao Seed Industry Company) was cultivated in black pots (the length, width, and height were 10 cm) containing 20 seeds per pot. Pots were maintained in an artificial climate incubator under controlled conditions. Following an eight-week acclimatization period, salt stress treatments commenced through irrigation with 0.5%, 1%, 2%, and 3% (w/v) NaCl solutions, replacing standard watering. Phenotypes were documented after 7 d of salt exposure.
Plant material and treatments
-
F. rubra was cultivated in black opaque plastic pots containing nutrient soil, with 20 seeds per pot, about 1–2 cm from the soil surface. The artificial temperature-controlled climatic chamber conditions for cultivation were maintained at 25 °C (daytime)/20 °C (nighttime), alternating day and night at 6 am and 10 pm, with a photoperiod of 16 h and a light intensity of 500 μmol·m−2·s−1. Substrate moisture was maintained at 70% field capacity through irrigation every 2 d.
After an eight-week acclimatization period, salt stress was induced by irrigating the plants with a 1% NaCl saline solution (w/v) instead of clear water. After two weeks of salt stress treatment, the aboveground tissues of the control group (CK) and the salt stress group (S) were harvested. Tissues were immediately flash-frozen in liquid nitrogen and stored at –80 °C for subsequent analyses. Each biological replicate comprised pooled material from five individual plants per treatment, with triplicate replicates processed for all experimental conditions.
Conductivity measurement
-
The healthy leaves of the same size were selected, cleaned, and cut into small pieces, placed in a centrifuge tube containing deionized water, and placed in a shaker at room temperature for 24 h. After the oscillation, the conductivity (R1) of the extract was measured by a conductivity meter (DDSJ-318). Subsequently, the test tube was heated in a boiling water bath for 30 min, and the conductivity (R2) was measured again after cooling to room temperature. The relative conductivity of the blade is calculated by the formula = (R1/R2) × 100%.
Gas exchange and chlorophyll fluorescence measurement
-
Gas exchange measurements were performed using the LI-COR 6400XT portable photosynthesis system (Li-Cor, Inc., Lincoln, NE, USA). In the leaf chamber, block temperature was maintained at 25 ± 0.5 °C, CO2 concentration was 400 ± 5 μmol·mol−1, PAR was 1,000 μmol·m−2·s−1, and flow rate was 500 μmol·s−1.
After dark adaptation for at least 30 min, the fluorescence origin (Fo), maximum photochemical efficiency of photosystem II (PSII; Fv/Fm), operational efficiency of PSII (Fq'/Fm'), non-photochemical quenching coefficient (NPQ), photochemical quenching coefficient (qP), degree of reaction centre closure (1-qP), and photosynthetic linear electron transfer rate (rETR) were measured by the Plant Explorer (Pheno Vation B.V.). At least five independent plants were selected for each treatment for the above measurements.
Antioxidant enzyme activity and soluble protein assays
-
Antioxidant enzymes and soluble proteins were extracted from plant powder samples using 50 mM Na-phosphate buffer (pH = 7.0) containing 1% polyvinylpyrrolidone (PVP) and 0.2 mM EDTA-Na2[24]. The supernatant after centrifugation was used for subsequent determination of superoxide dismutase (SOD), peroxidase (POD), catalase (CAT), ascorbate peroxidase (APX), and soluble proteins.
SOD activity was determined by monitoring the inhibition of nitro blue tetrazolium (NBT) photochemical reduction according to the method of Rasheed et al.[25]. The reaction mixture containing 50 mM Na-phosphate buffer (pH = 7.8), 39 mM methionine, 1 mM EDTA-Na2, 7.5 mM NBT, 0.1 mM riboflavin, and enzyme extracts was photo-reacted for 20 min, and the absorbance of the reaction solution at 560 nm was determined. One unit of enzyme activity was taken as 50% inhibition of NBT photoreduction.
CAT activity was referred to the method of Jameel et al.26]. The change in absorbance value at 240 nm within 1 min of the reaction system was determined. The reaction system contained 50 mM Na-phosphate buffer (pH = 7.0), 150 mM H2O2, and enzyme extract. One unit of enzyme activity was defined as a decrease in absorbance value of 0.1.
POD activity was determined by the guaiacol method[27]. The change in absorbance value of the reaction system containing 50 mM Na-phosphate buffer (pH = 7.0), 0.3% H2O2, 0.2% guaiacol, and enzyme extract at 240 nm was determined within 1 min. One unit of enzyme activity was defined as an increase in absorbance value of 0.01.
APX activity was determined by the method of Haida & Hakiman[28] by recording the decrease in absorbance of ascorbic acid at 290 nm. The assay mixture consisted of 50 mM Na-phosphate buffer (pH = 7.0), 50 mM ascorbic acid, 10 mM EDTA-Na2, 10 mM H2O2, and enzyme extract. One unit of enzyme activity was defined as a decrease in absorbance value by 0.01.
The soluble protein content was determined by staining with Coomassie brilliant blue G-250[29]. The absorbance was measured at 595 nm after incubation of Coomassie brilliant blue G-250 solution and enzyme extract for 5 min at ambient temperature. The standard curve was constructed using bovine serum albumin (BSA).
Determination of soluble sugar, malondialdehyde, and proline content
-
The soluble sugar content was determined by the anthrone colourimetric method[30]. The soluble sugars were extracted by boiling in a water bath for 1 h. The standard solution of sucrose was used as the standard curve, and the absorbance value at 630 nm of the reaction products with concentrated sulfuric acid and ethyl anthrone acetate was used to calculate the soluble sugar content in comparison with the standard curve.
The degree of membrane lipid peroxidation is measured by MDA content. MDA content was measured using thiobarbituric acid (TBA)[31]. Acidic conditions were created using trichloroacetic acid (TCA), and an equal amount of TBA was added to allow the reaction of MDA to produce coloured trimethyl complexes with maximum light absorption at 450 nm, 532 nm, and 600 nm. The absorbance values were determined using a UV spectrophotometer to obtain the MDA content.
The content of proline was determined by the sulfonylsalicylic acid method of Shen[32]. Proline and ninhydrin reacted under acidic conditions to form colored substances. The absorbance at 520 nm was measured by an ultraviolet spectrophotometer, and the content of proline in the sample was calculated by comparison with the standard curve.
Transcriptome sequencing and data analysis
-
RNA sequencing was performed on three biological replicates per group (control and salt-stressed). Total RNA was extracted from frozen leaf tissues using TRIzol reagent. RNA integrity was verified (RIN > 8.0) using an Agilent 2100 Bioanalyzer. Then libraries were constructed using the VAHTS Universal V6 RNA-seq Library Prep Kit and sequenced on the Illumina NovaSeq 6000 platform (150 bp paired-end) by OE Biotech (Shanghai, China). Raw reads were quality-controlled using fastp (v0.20.1). CD-HIT (4.6) was used to remove adaptors, filter low-quality bases and N bases, and finally obtain high-quality clean reads. Due to the absence of a publicly available F. rubra reference genome, de novo transcriptome assembly was performed using Trinity v2.15.1. The assembly quality was validated through: contig continuity (N50 = 1,370 bp), base-calling accuracy (> 90%), and gene space completeness (Supplementary Fig. S1). According to the sequence similarity and length, the longest one was selected as Unigene for subsequent analysis. The expression of Unigene (FPKM value) was analyzed by bowtie2 (2.3.3.1) and eXpress (1.5.1), and the difference multiple was calculated by DESeq2 (1.20.0) and DESeq (1.18.0), and the difference significance test was carried out by NB (negative binomial distribution test). The default conditions for screening differences are q-value < 0.05, p value < 0.05, |log2FoldChange| > 1. Finally, GO enrichment and KEGG pathway enrichment analysis of DEGs were performed based on the hypergeometric distribution.
Statistical analysis
-
SPSS 26.0 was used to analyse the data. Ordinary one-way (ANOVA) with least significant difference (LSD) method was used to compare the means when the data were normally distributed with homogeneous variance. Values were considered significantly different at a significance level of p < 0.05. GraphPad Prism 8.0.2 (GraphPad, USA) was used to graph the data. Biological triplicates (n = 3) with technical duplicates ensured reproducibility. The heatmap was drawn based on R (
www.r-project.org ) on the OECloud platform (https://cloud.oebiotech.com/task ). -
Phenotypic analysis of F. rubra following seven-day gradient salt exposure revealed concentration-dependent deterioration in plant vigor (Fig. 1). Control plants maintained dense turf architecture with vibrant green, turgid leaves, whereas 0.5% NaCl induced only marginal chlorosis without significant canopy alteration. A critical transition occurred at 1% NaCl, triggering pronounced physiological disruption manifested through substantial canopy thinning, progressive leaf yellowing, and conspicuous necrotic leaf tips, which collectively indicate the threshold for acute salt injury. While 2% NaCl exacerbated these symptoms through intensified chlorosis and expanded necrosis, the 3% treatment approached lethality, exhibiting nearly complete desiccation, extreme sparsification, and survival limited to residual green crown tissues. These phenotypic and physiological progression (Supplementary Figs S2, S3) established 1% NaCl as the optimal concentration for subsequent experiments, eliciting statistically robust and mechanistically informative responses without inducing terminal damage.
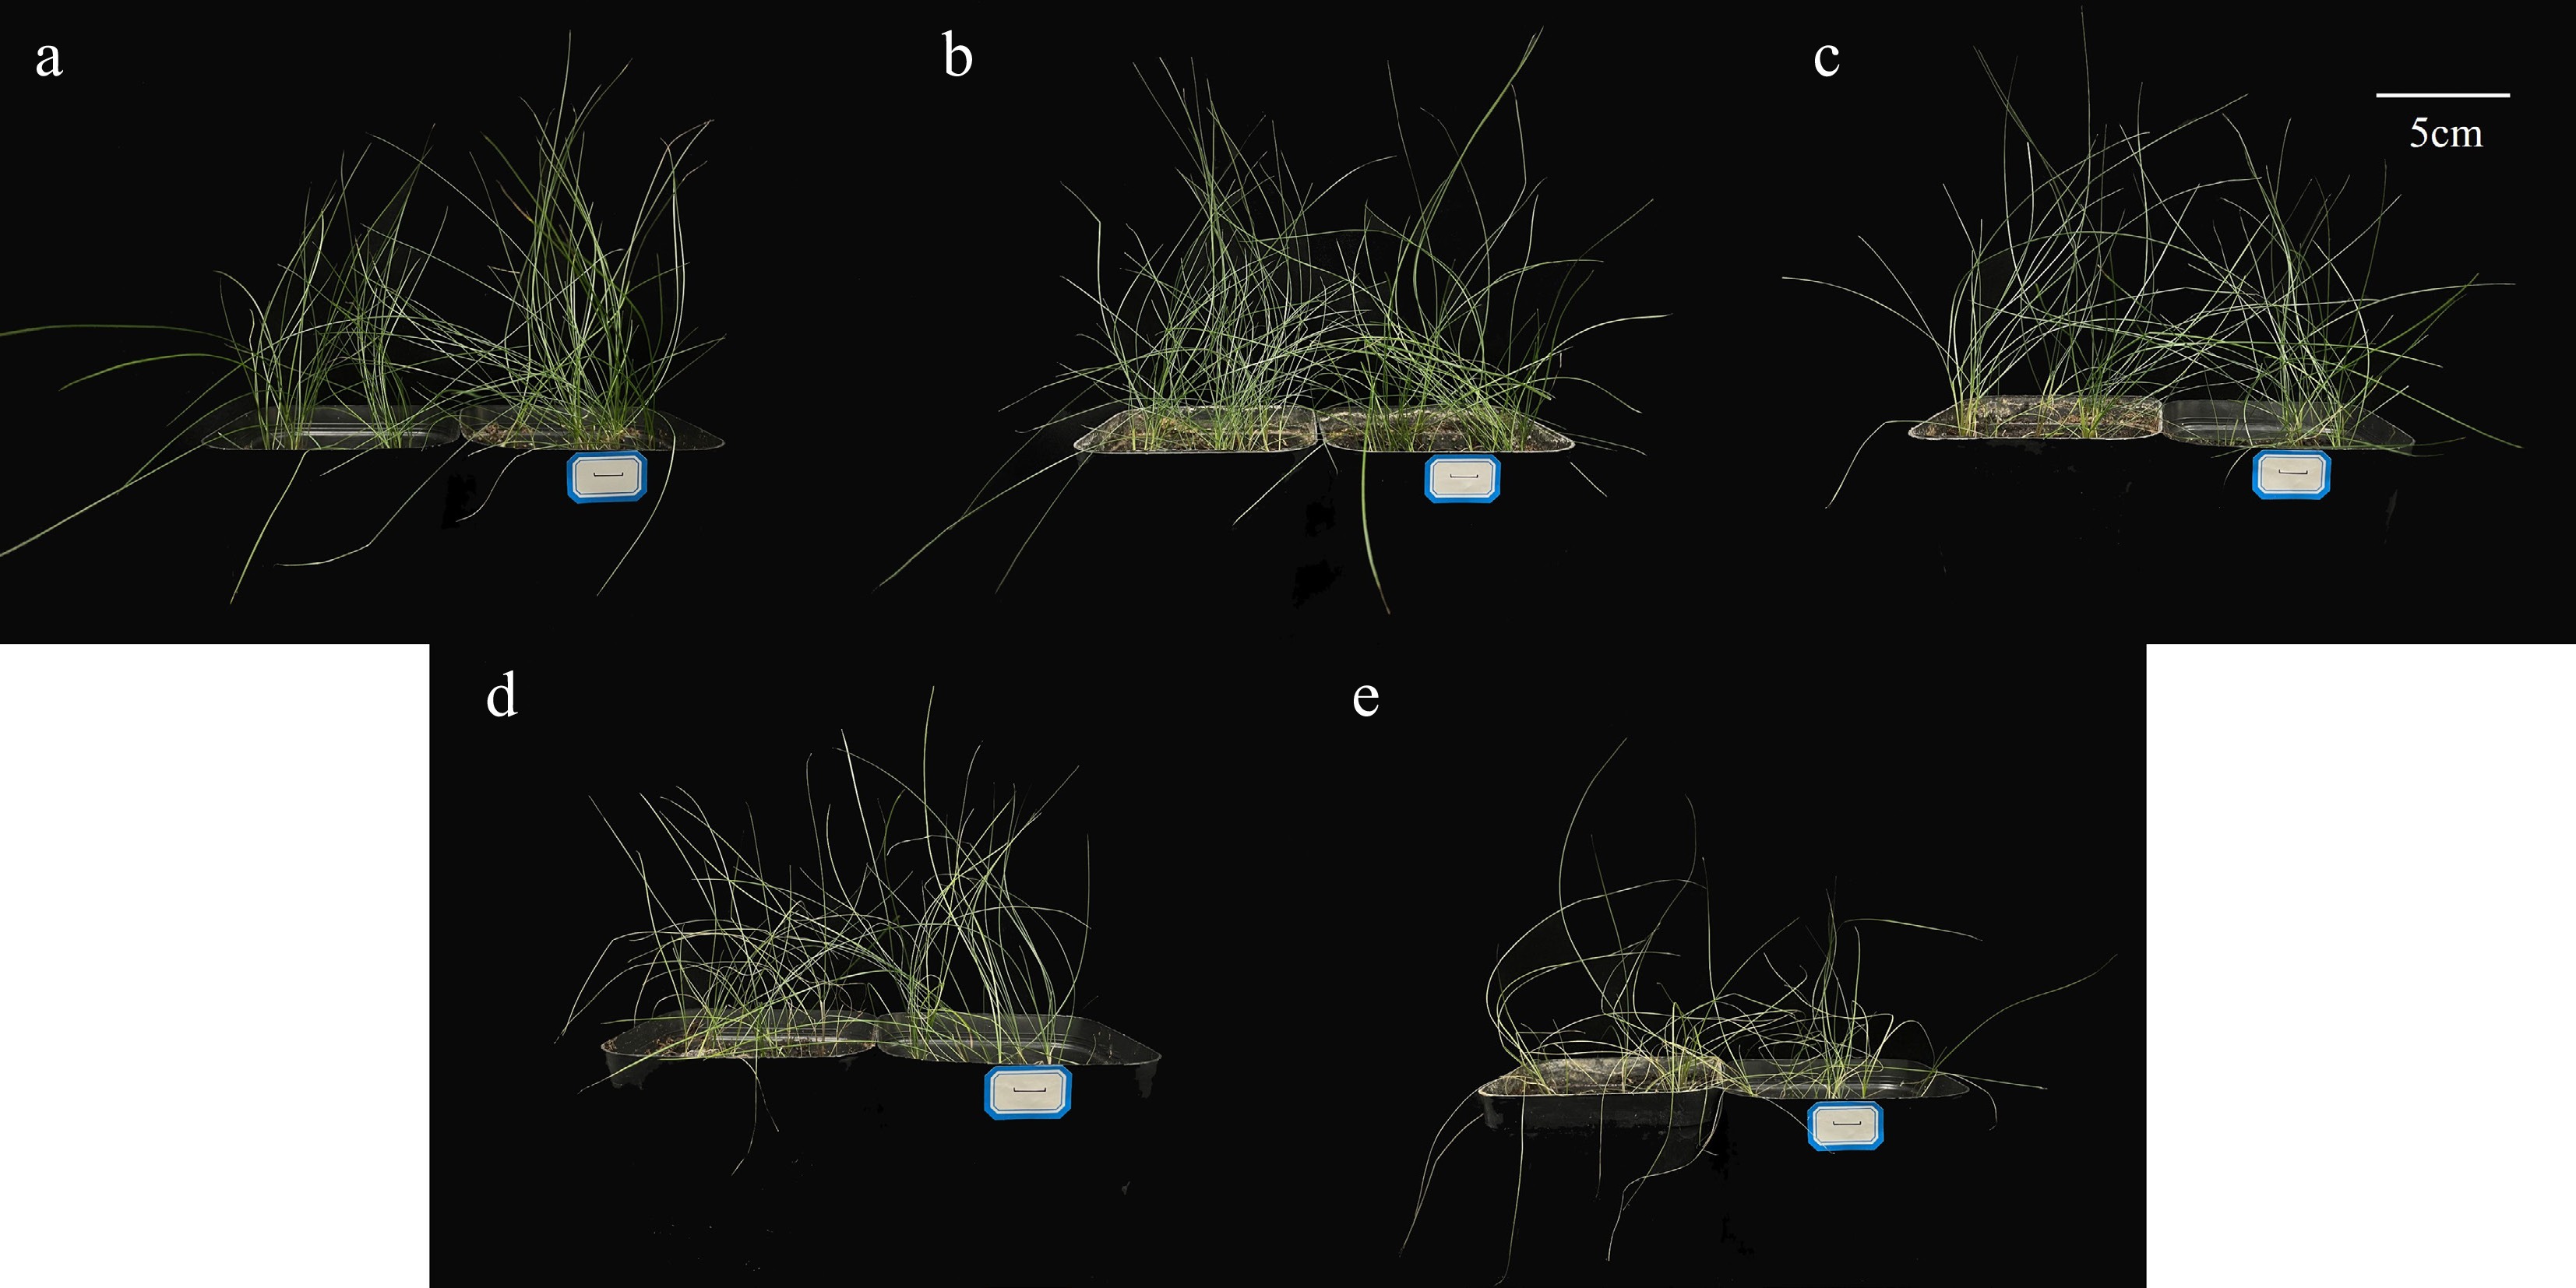
Figure 1.
Effects of different concentrations of salt stress on the phenotype of F. rubra. (a) Control. (b) Salt concentration 0.5%. (c) Salt concentration 1%. (d) Salt concentration 2%. (e) Salt concentration 3%. The scale bar (5 cm) is shown on the figure.
Effects of salt stress on leaf relative conductivity
-
Salt stress significantly increased the leaf relative conductivity (Fig. 2). Compared with the control, the relative conductivity of leaves under salt stress increased by 194.84%.
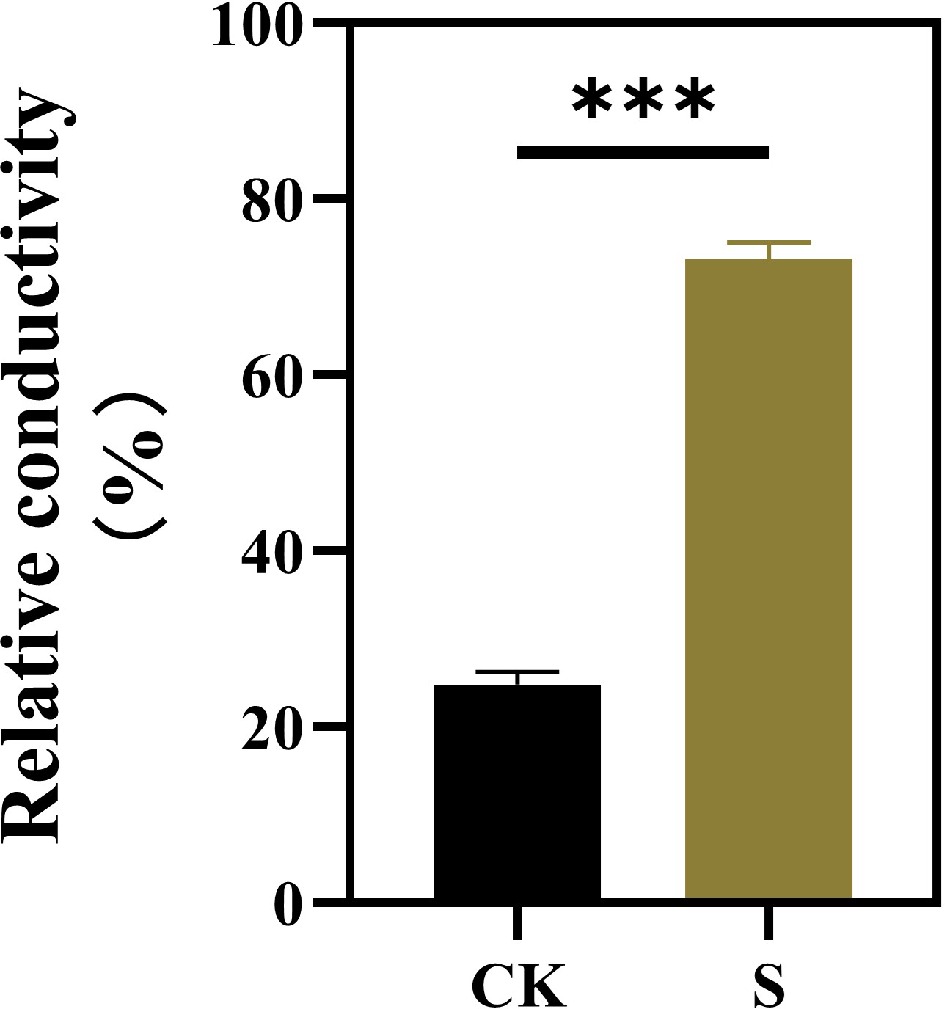
Figure 2.
Effects of salt stress treatments on the leaf conductivity of F. rubra. Values are means ± SE (n = 3 biological replicates). Values are means ± SE (n = 3 biological replicates). After t-test, the value bars with ns are not significant, asterisk denotes statistically significant differences * p < 0.05; ** p < 0.01; *** p < 0.001.
Effects of salt stress on the photosynthetic system
-
To investigate the photosynthetic responses to salt stress, comprehensive measurements of gas exchange parameters and chlorophyll fluorescence were performed. Compared with the control, the net photosynthetic rate, stomatal conductance, the intercellular carbon dioxide concentration, and transpiration rate of plants under salt stress were significantly reduced (Fig. 3a−d). These results indicate that plants reduce water loss by closing stomata and also limit the supply of CO2, thereby inhibiting photosynthesis. The change of chlorophyll fluorescence is more complicated. Similar to the decrease in net photosynthetic assimilation, chlorophyll fluorescence measurements showed that the salt stress led to a decrease in plant PSII efficiency. Under salt treatment, Fv/Fm, rETR, and Fq'/Fm' of treated plants were significantly lower than those of the control plants (Fig. 4a, c, d), while NPQ and 1-qP were significantly increased (Fig. 4b, e). The trend of Fo of plants under salt conditions was similar to Fv/Fm (Fig. 4f).
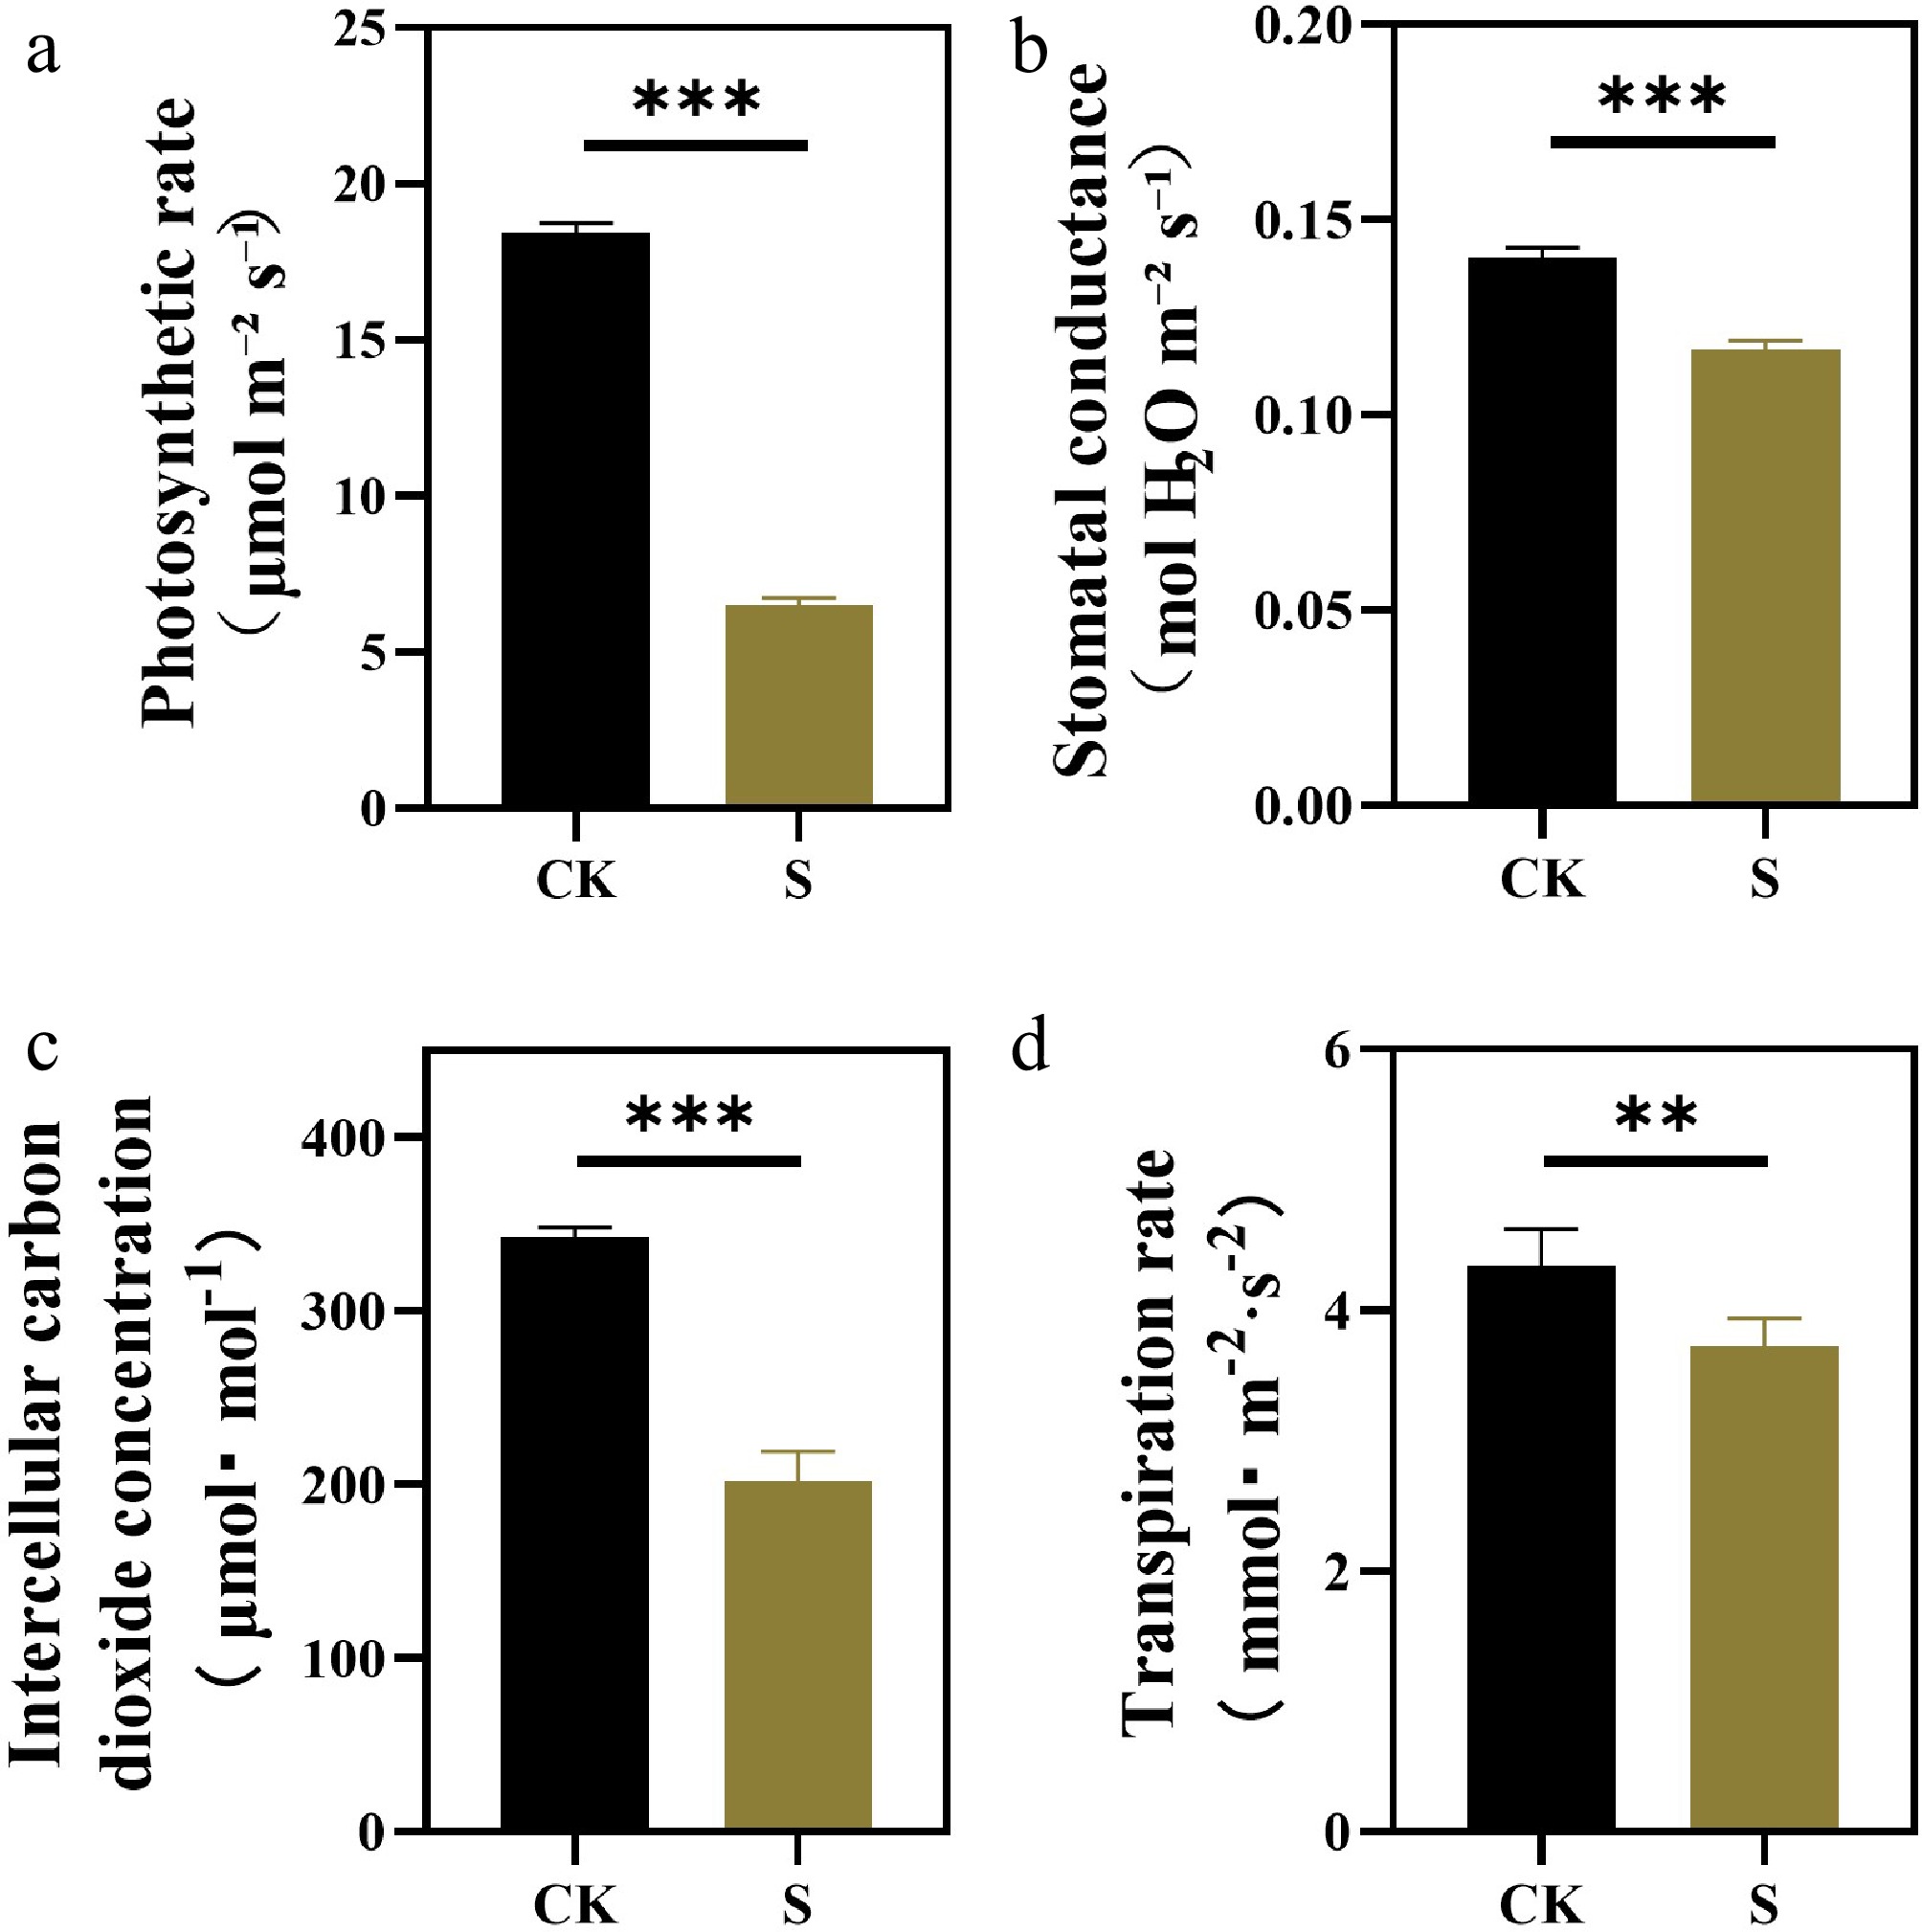
Figure 3.
Effects of salt stress treatments on photosynthetic parameters of F. rubra. (a) Net photosynthetic rate. (b) Stomatal conductance. (c) Intercellular CO2 concentration. (d) Transpiration rate. Values are means ± SE (n = 3 biological replicates). After t-test, the value bars with ns are not significant, asterisk denotes statistically significant differences * p < 0.05; ** p < 0.01; *** p < 0.001.
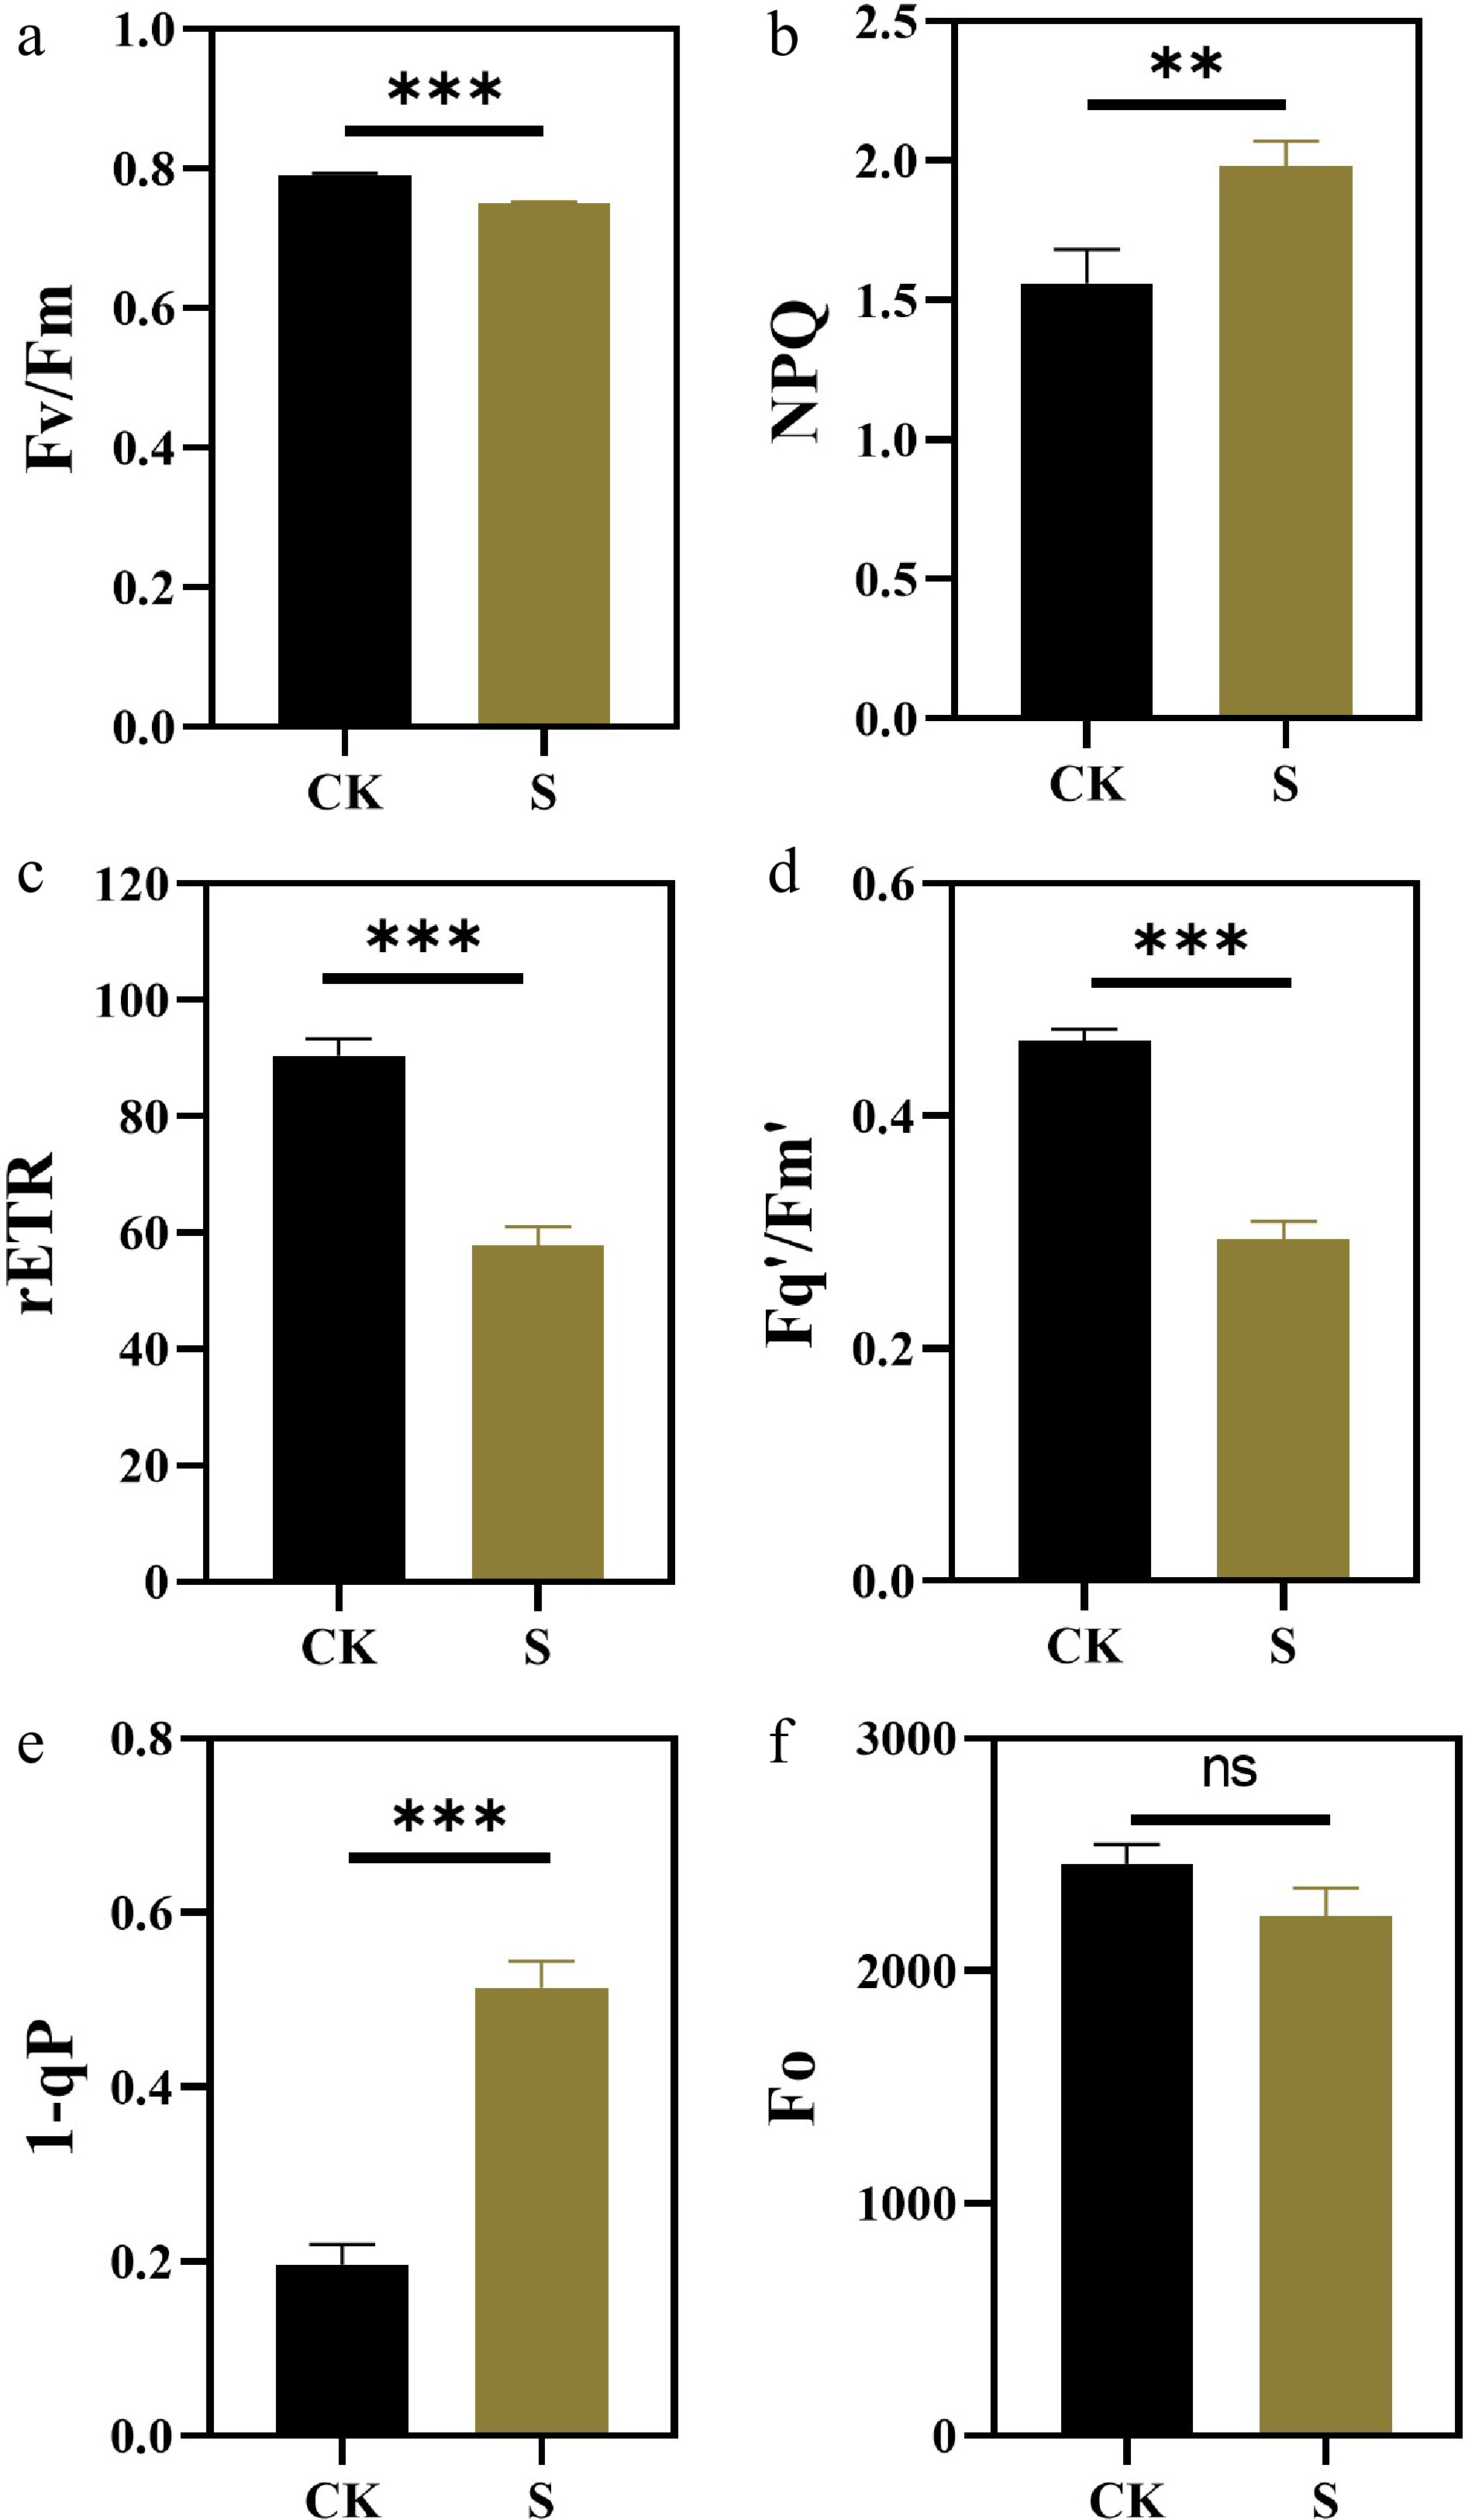
Figure 4.
Effects of salt stress treatments on chlorophyll fluorescence parameters of F. rubra (a) PSII maximum photochemical efficiency (Fv/Fm). (b) Non-photochemical quenching NPQ. (c) Photosynthetic linear electron transport rate (rETR). (d) PSII operating efficiency Fq'/Fm'. (e) Reaction center closure degree 1-qP. (f) Initial fluorescence Fo. Values are means ± SE (n = 3 biological replicates). After t-test, the value bars with ns are not significant, asterisk denotes statistically significant differences * p < 0.05; ** p < 0.01; *** p < 0.001.
Effects of salt stress on ROS level
-
The stress response of plants is usually related to the production of ROS. To determine the level of ROS in plants under salt stress, the activity of various antioxidant enzymes and the content of MDA in the leaves were measured. MDA indicates the degree of lipid damage caused by ROS. Compared with the control, the MDA content increased significantly under salt conditions (Fig. 5g). All antioxidant enzyme activities were significantly increased under salt stress. Compared with POD (Fig. 5a), APX, SOD, and CAT were more sensitive to salt stress (Fig. 5b−d).
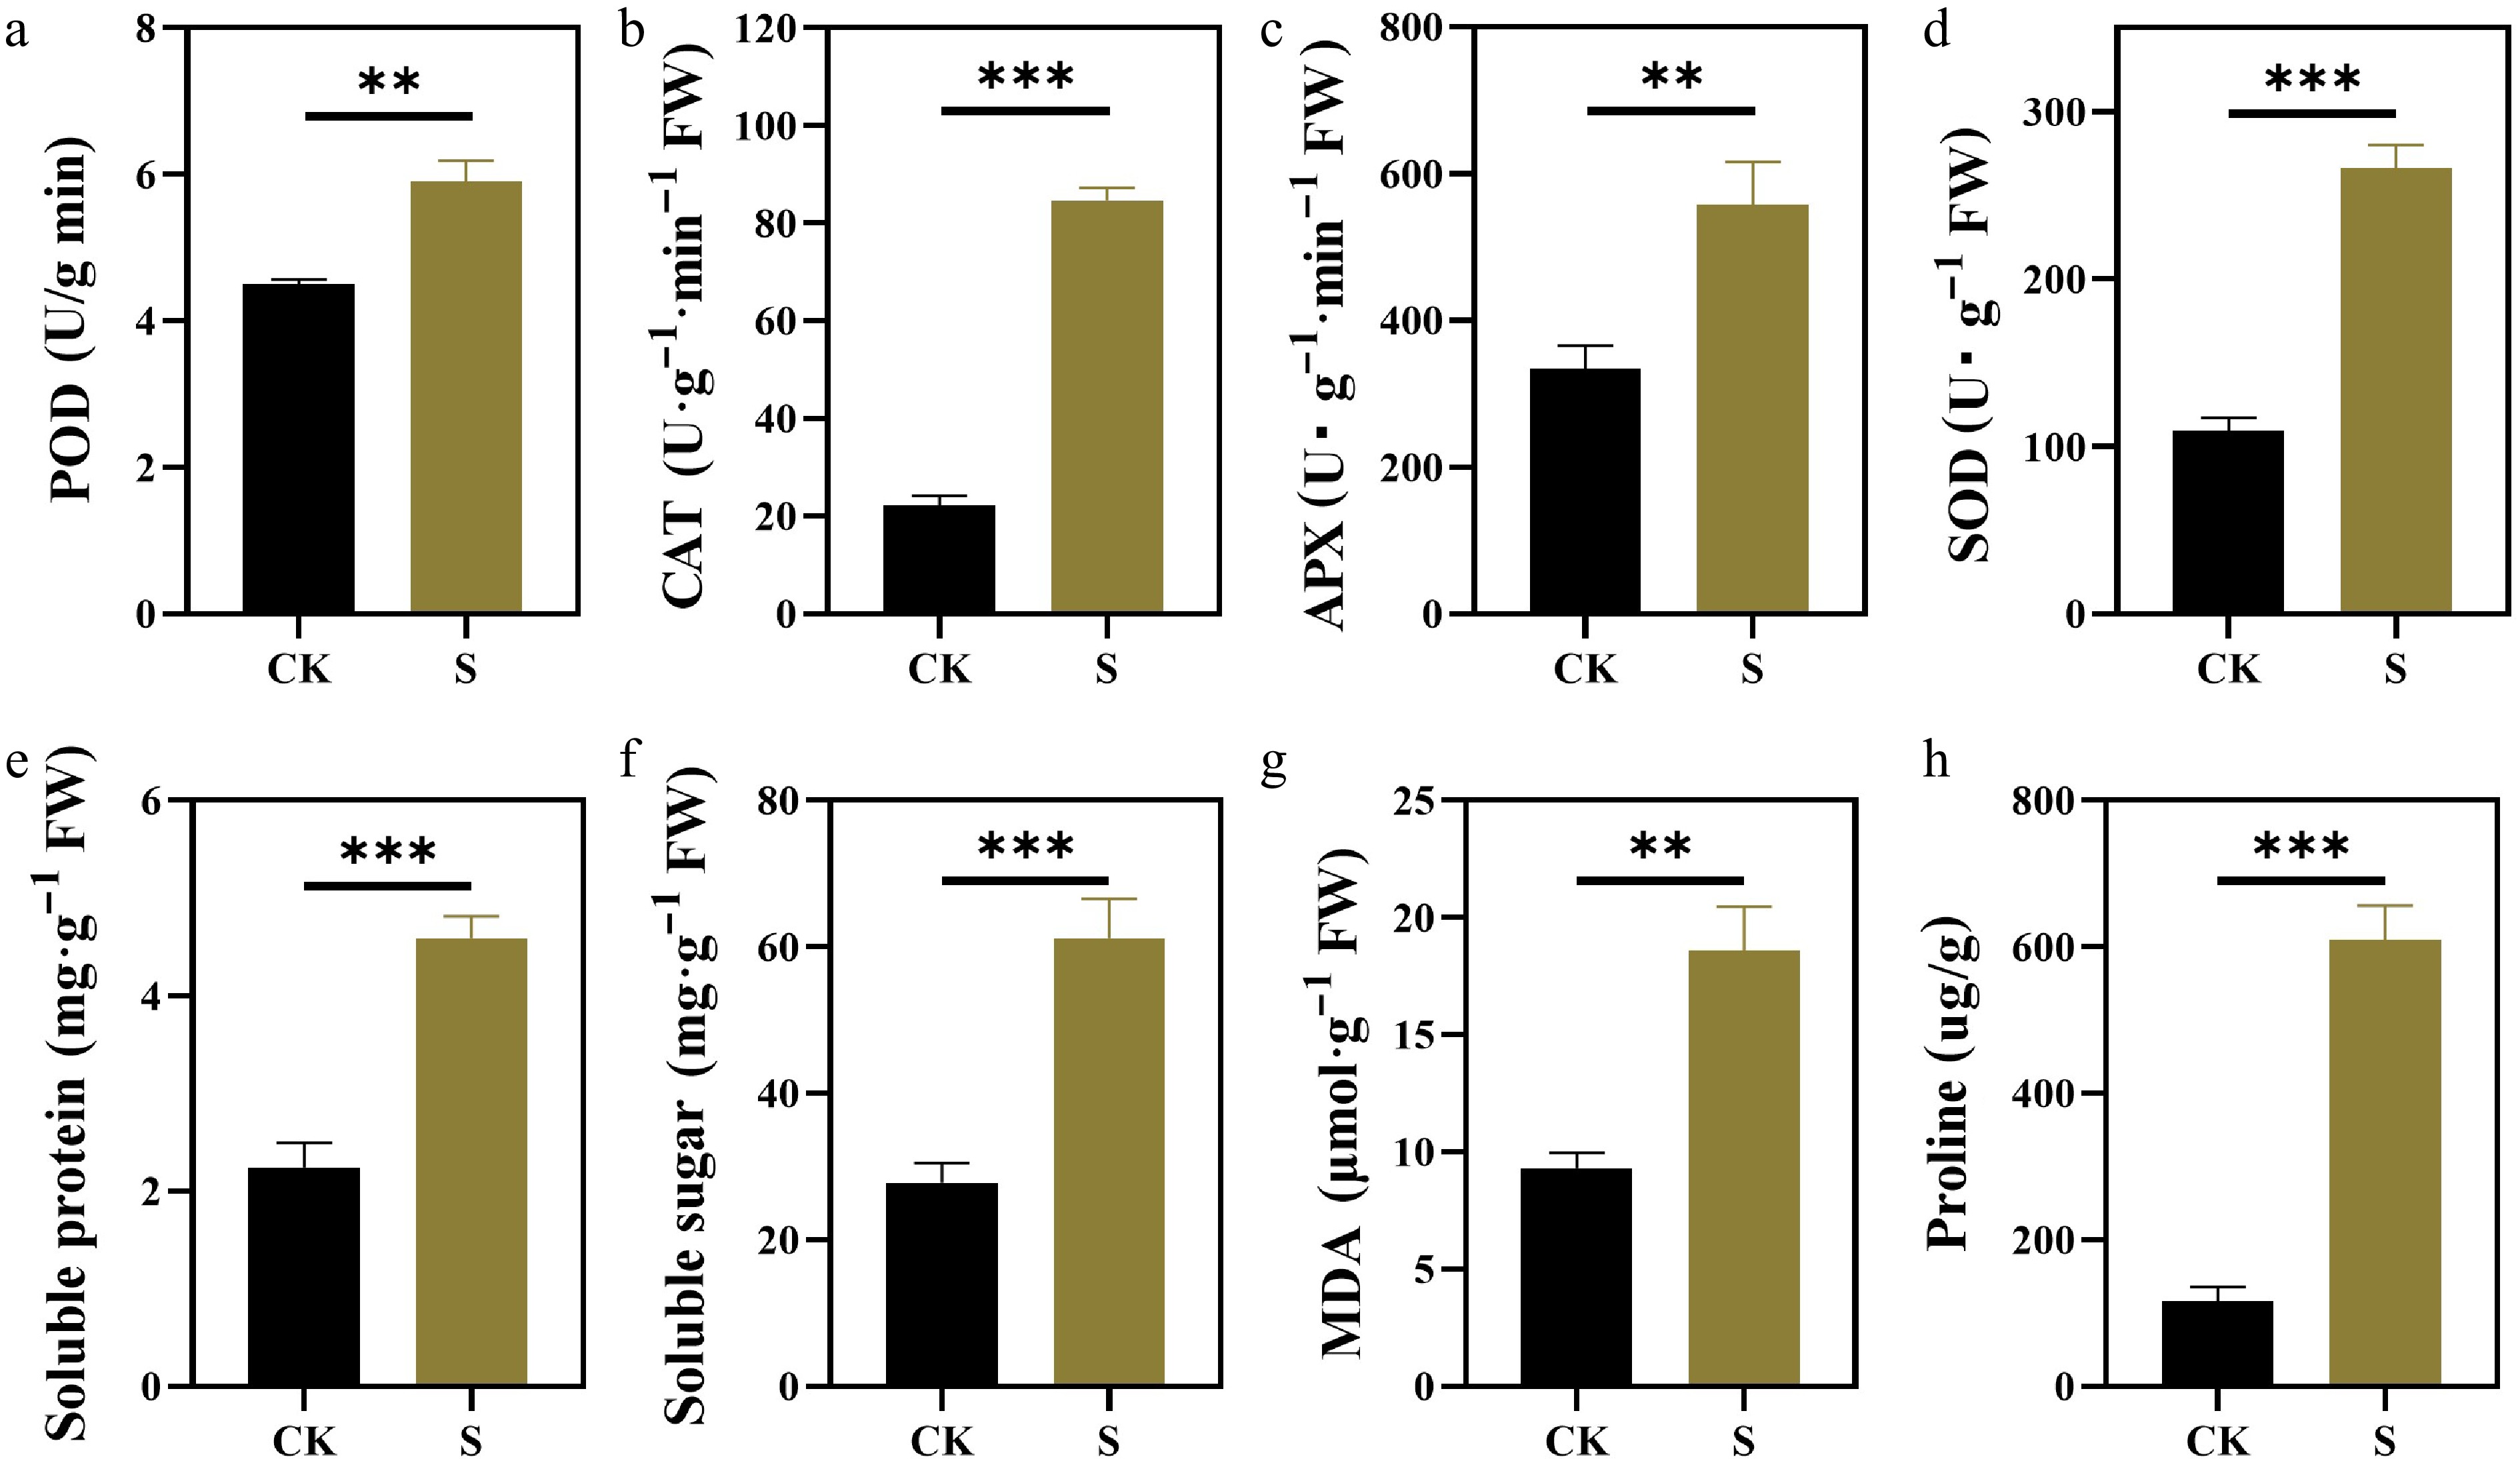
Figure 5.
Effects of salt stress on antioxidant enzyme activities and osmotic adjustment substances of F. rubra. (a) Activity of peroxidase (POD). (b) Activity of catalase (CAT). (c) Activity of ascorbate peroxidase (APX). (d) Activity of superoxide dismutase (SOD). (e) Content of soluble protein. (f) Content of soluble sugar. (g) Content of malondialdehyde (MDA). (h) Content of proline. Values are means ± SE (n = 3 biological replicates). After t-test, the value bars with ns are not significant, asterisk denotes statistically significant differences * p < 0.05; ** p < 0.01; *** p < 0.001.
Effects of salt stress on osmotic adjustment substances
-
To better understand how salt stress affects primary metabolism, osmotic adjustment substances of plants under salt stress were measured (Fig. 5e, f, h). Compared with the control, the contents of soluble protein, soluble sugar, and proline in F. rubra were significantly increased under salt stress.
Analysis of the differentially expressed genes (DEGs)
-
Transcriptome analysis of the above-ground part of F. rubra under salt stress showed that there were 5,885 differentially expressed genes (DEGs) under salt stress, including 3,980 upregulated genes and 1,905 downregulated genes (Fig. 6b). A principal component analysis (PCA) of the transcriptomic data revealed a high similarity among the three biological replicates within two treatments (Fig. 6a), a clear separation of the salt stress treatments from the control plants.

Figure 6.
PCA plot and differently expressed genes number of F. rubra transcriptome samples under salt stress. (a) PCA plot. (b) Differently expressed genes number.
Gene ontology (GO) enrichment analysis of the DEGs
-
To gain insight into biological processes in response to the salt stress, the gene ontology (GO) term enrichment of the 5,885 common DEGs was analyzed (Fig. 7 and Supplementary Table S1). The set of common DEGs was involved in different biological processes. Among them, the downregulated functions of differential gene enrichment include cell structure, lipid metabolism and decomposition, carbon metabolism, amino acid metabolism and oxidative stress (Fig. 7a). The upregulated functions are mainly enriched in stress response and regulation of other abiotic stresses, transcriptional regulation and DNA binding activity, amino acid metabolism, membrane structure and function, antioxidant and detoxification metabolism (Fig. 7b).
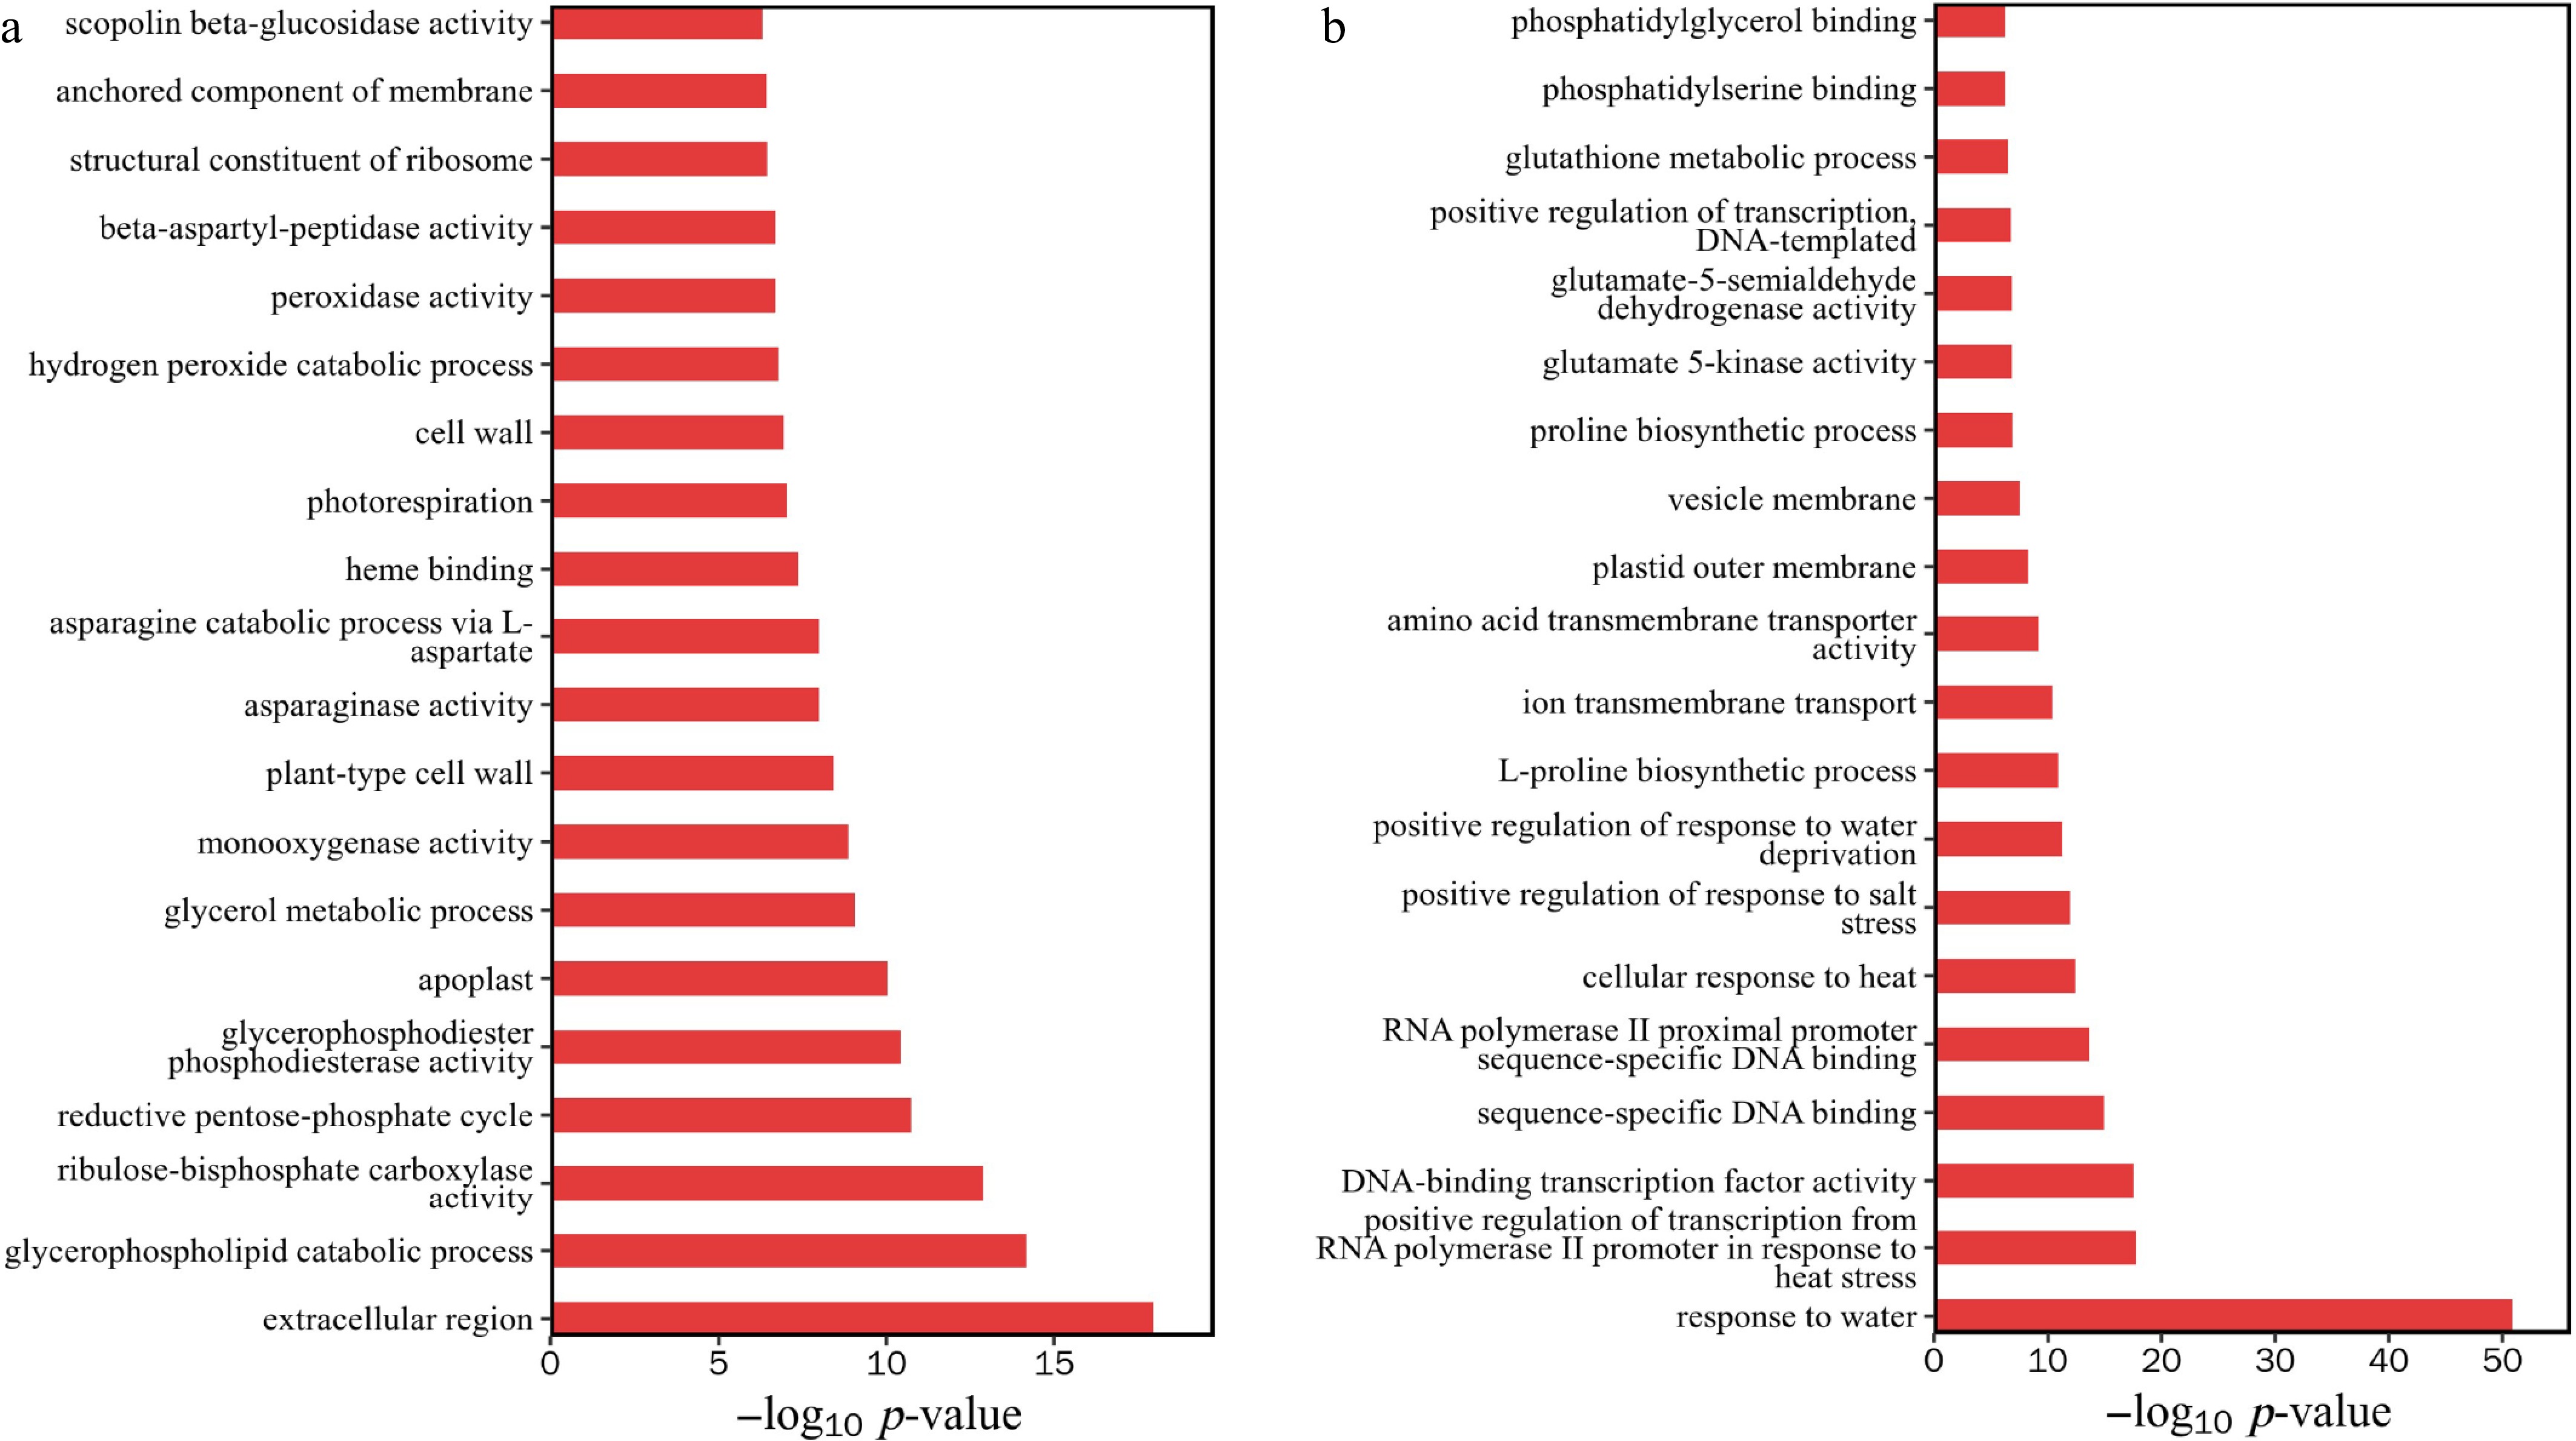
Figure 7.
GO enrichment analysis of differentially expressed genes. (a) Downregulation of gene enrichment function p-value top 20. (b) Upregulation of gene enrichment function p-value top 20.
As significant enrichment for upregulated DEGs was observed in GO terms related to the plant hormone signal transduction pathway (Fig. 8b), hydrogen peroxide metabolism process peroxidase activity (Fig. 7a), transcript abundance of genes involved ABA, peroxidase activity and oxidative phosphorylation were analyzed (Fig. 8). Heat map revealed that salt stress significantly upregulated genes associated with the ABA biosynthetic pathway (Fig. 8a). Notably, the expression of PYL (a key ABA receptor) was downregulated, while PP2C (a negative regulator of ABA signaling) and SnRK2 (a positive regulator of ABA-dependent stress responses) exhibited marked upregulation. Heatmap analysis of peroxidase activity and oxidative phosphorylation-related genes revealed that salt stress significantly modulated their expression profiles (Fig. 8b). Notably, key oxidative phosphorylation components, including NDUFS3 (Complex I), PMA1 (plasma membrane ATPase), and SDHA (Complex II), were downregulated. In contrast, genes associated with ROS scavenging, such as Ppa (peroxisomal peroxidase), peroxidase, and L-ascorbate peroxidase, exhibited marked upregulation. Intriguingly, PXG (phagocyte oxidase homolog) and COX (cytochrome c oxidase, Complex IV) displayed heterogeneous expression patterns, with both upregulated and downregulated genes.
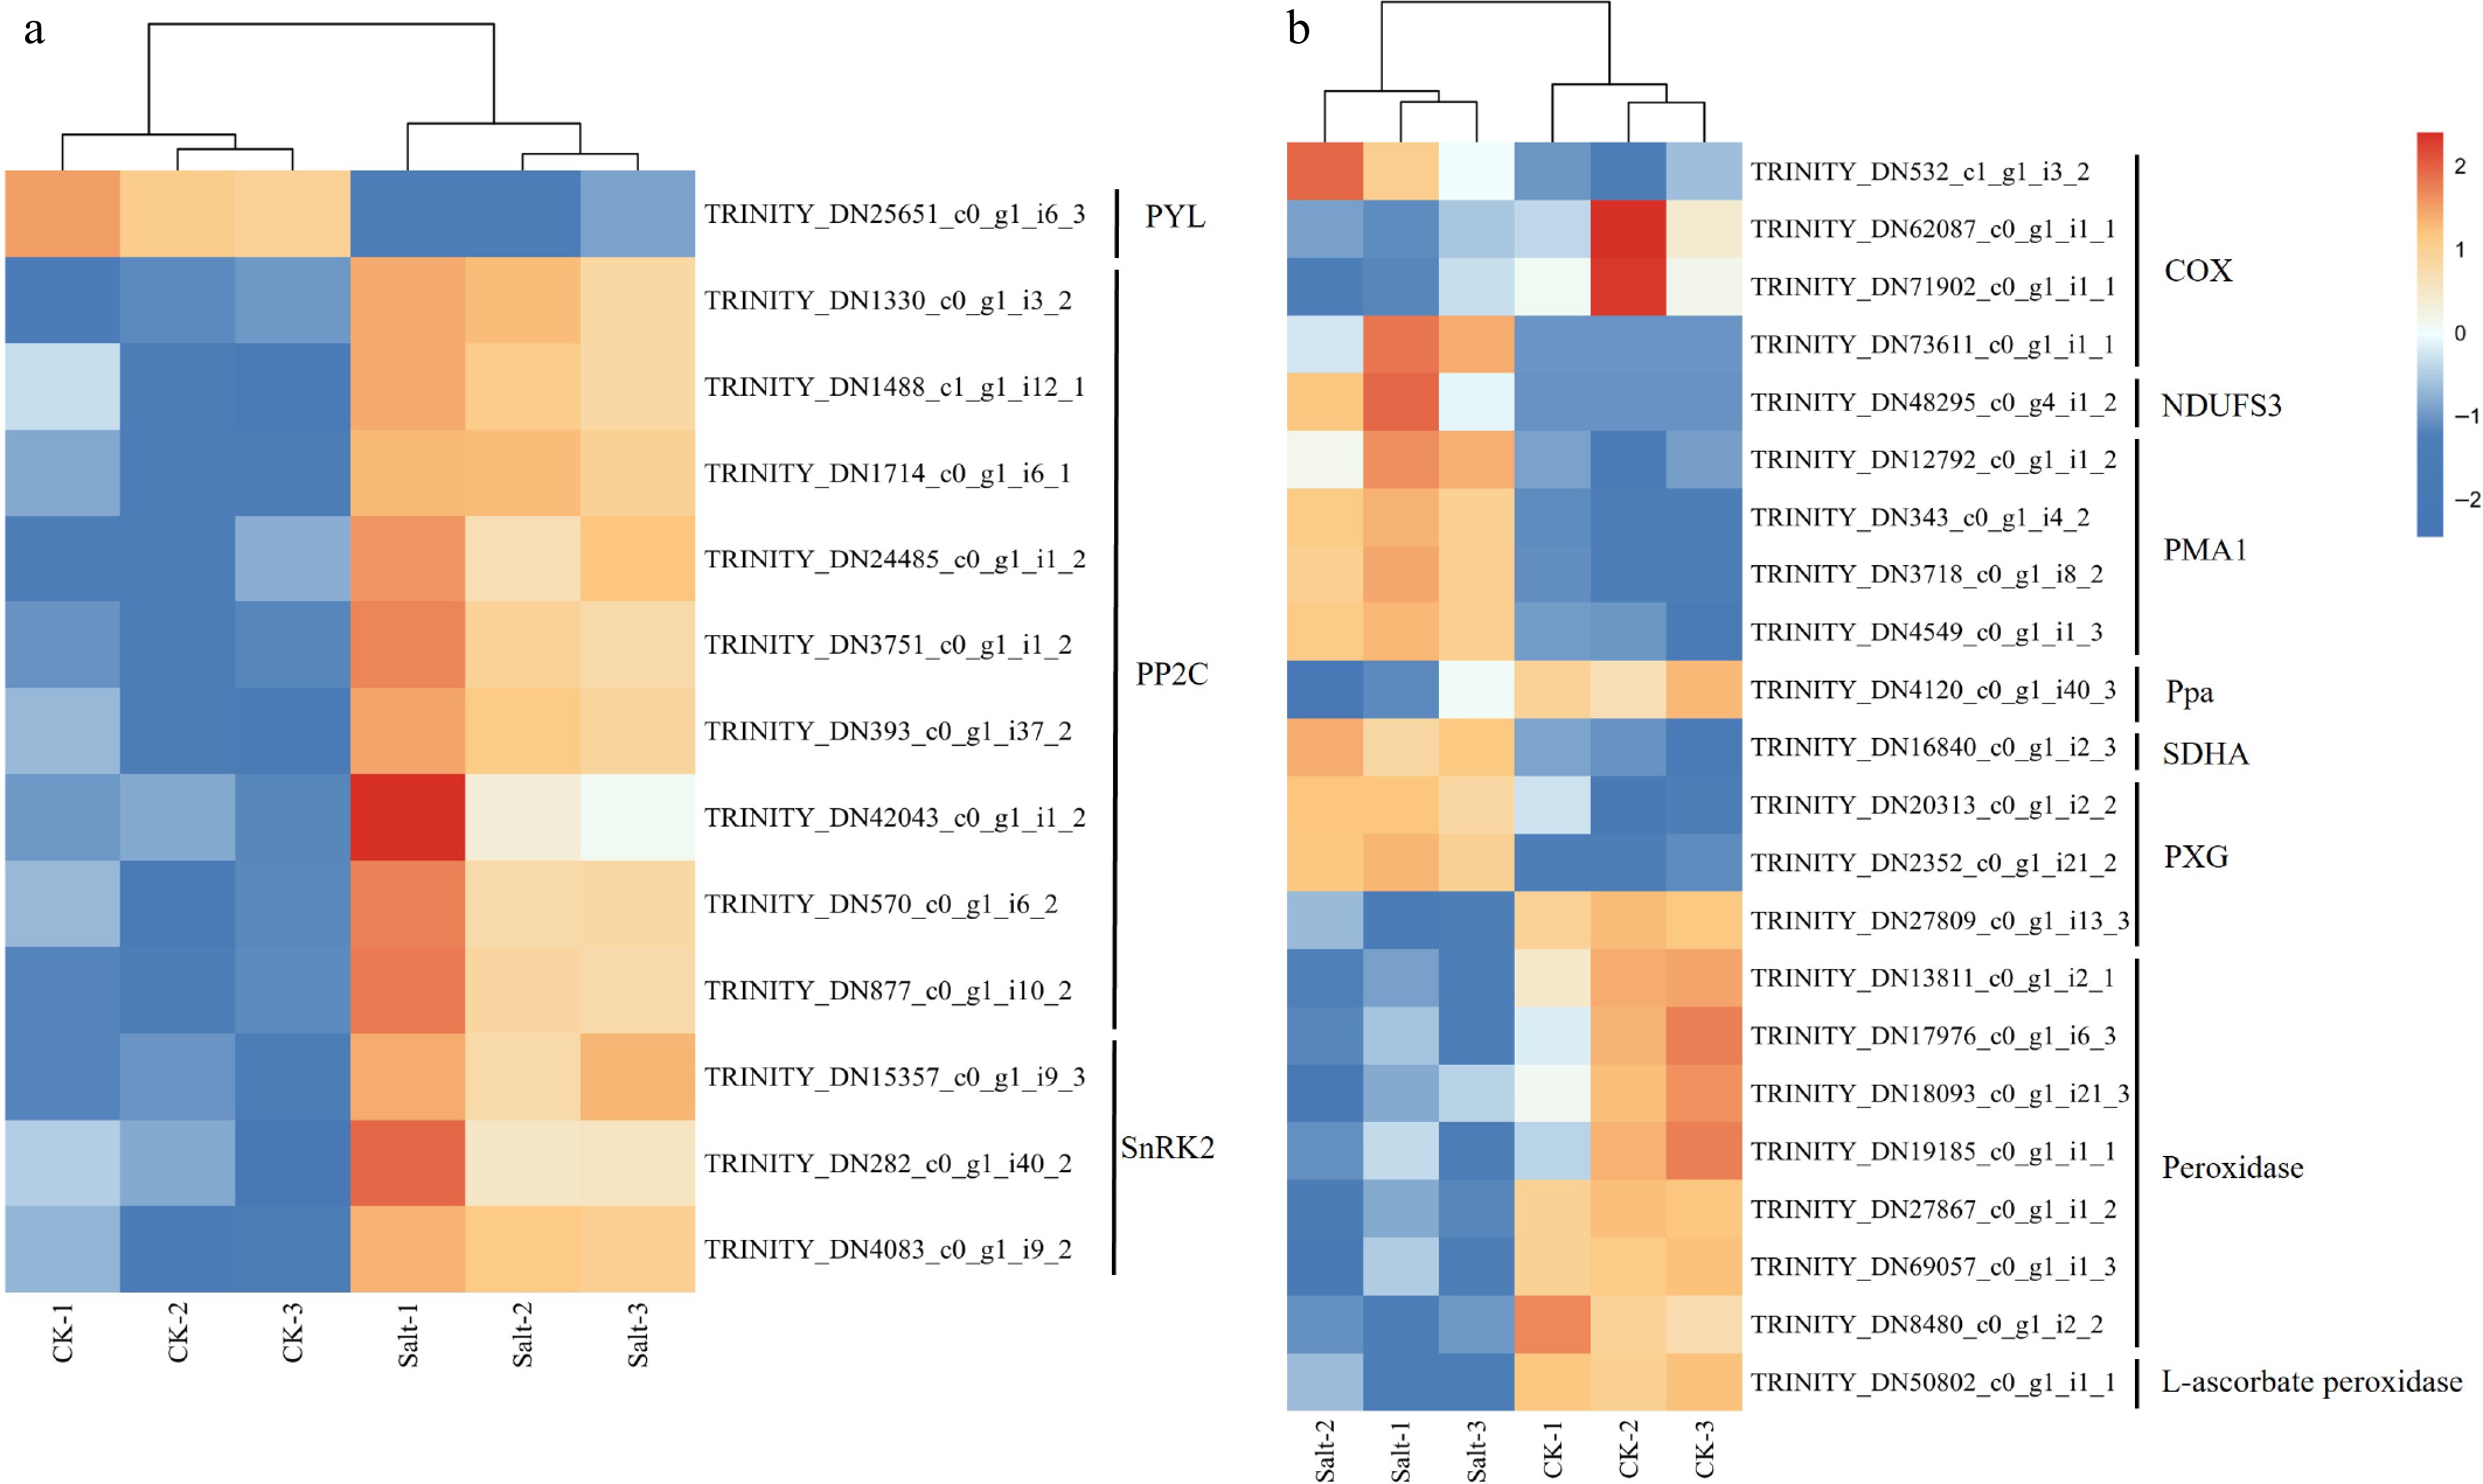
Figure 8.
Gene expression heat map of F. rubra. (a) Expression profiles of transcripts involved in abscisic acid. (b) Expression profiles of transcripts involved in peroxidase activity and oxidative phosphorylation. Expression levels are displayed as log2-transformed FPKM values (Fragments Per Kilobase per Million mapped reads). Color scale indicates relative expression levels: red (upregulation), and blue (downregulation).
KEGG enrichment analysis of DEGs
-
KEGG enrichment analysis revealed distinct pathway modulation under experimental conditions: the ribosome pathway was the most significantly downregulated (Fig. 9a), whereas plant hormone signal transduction dominated upregulated pathways (Fig. 9b). Collectively, the pathways with more significant KEGG enrichment were mainly concentrated in signal transduction and stress response, carbohydrate metabolism, amino acid metabolism, nitrogen metabolism, redox homeostasis, lipid metabolism, and nitrogen metabolism.
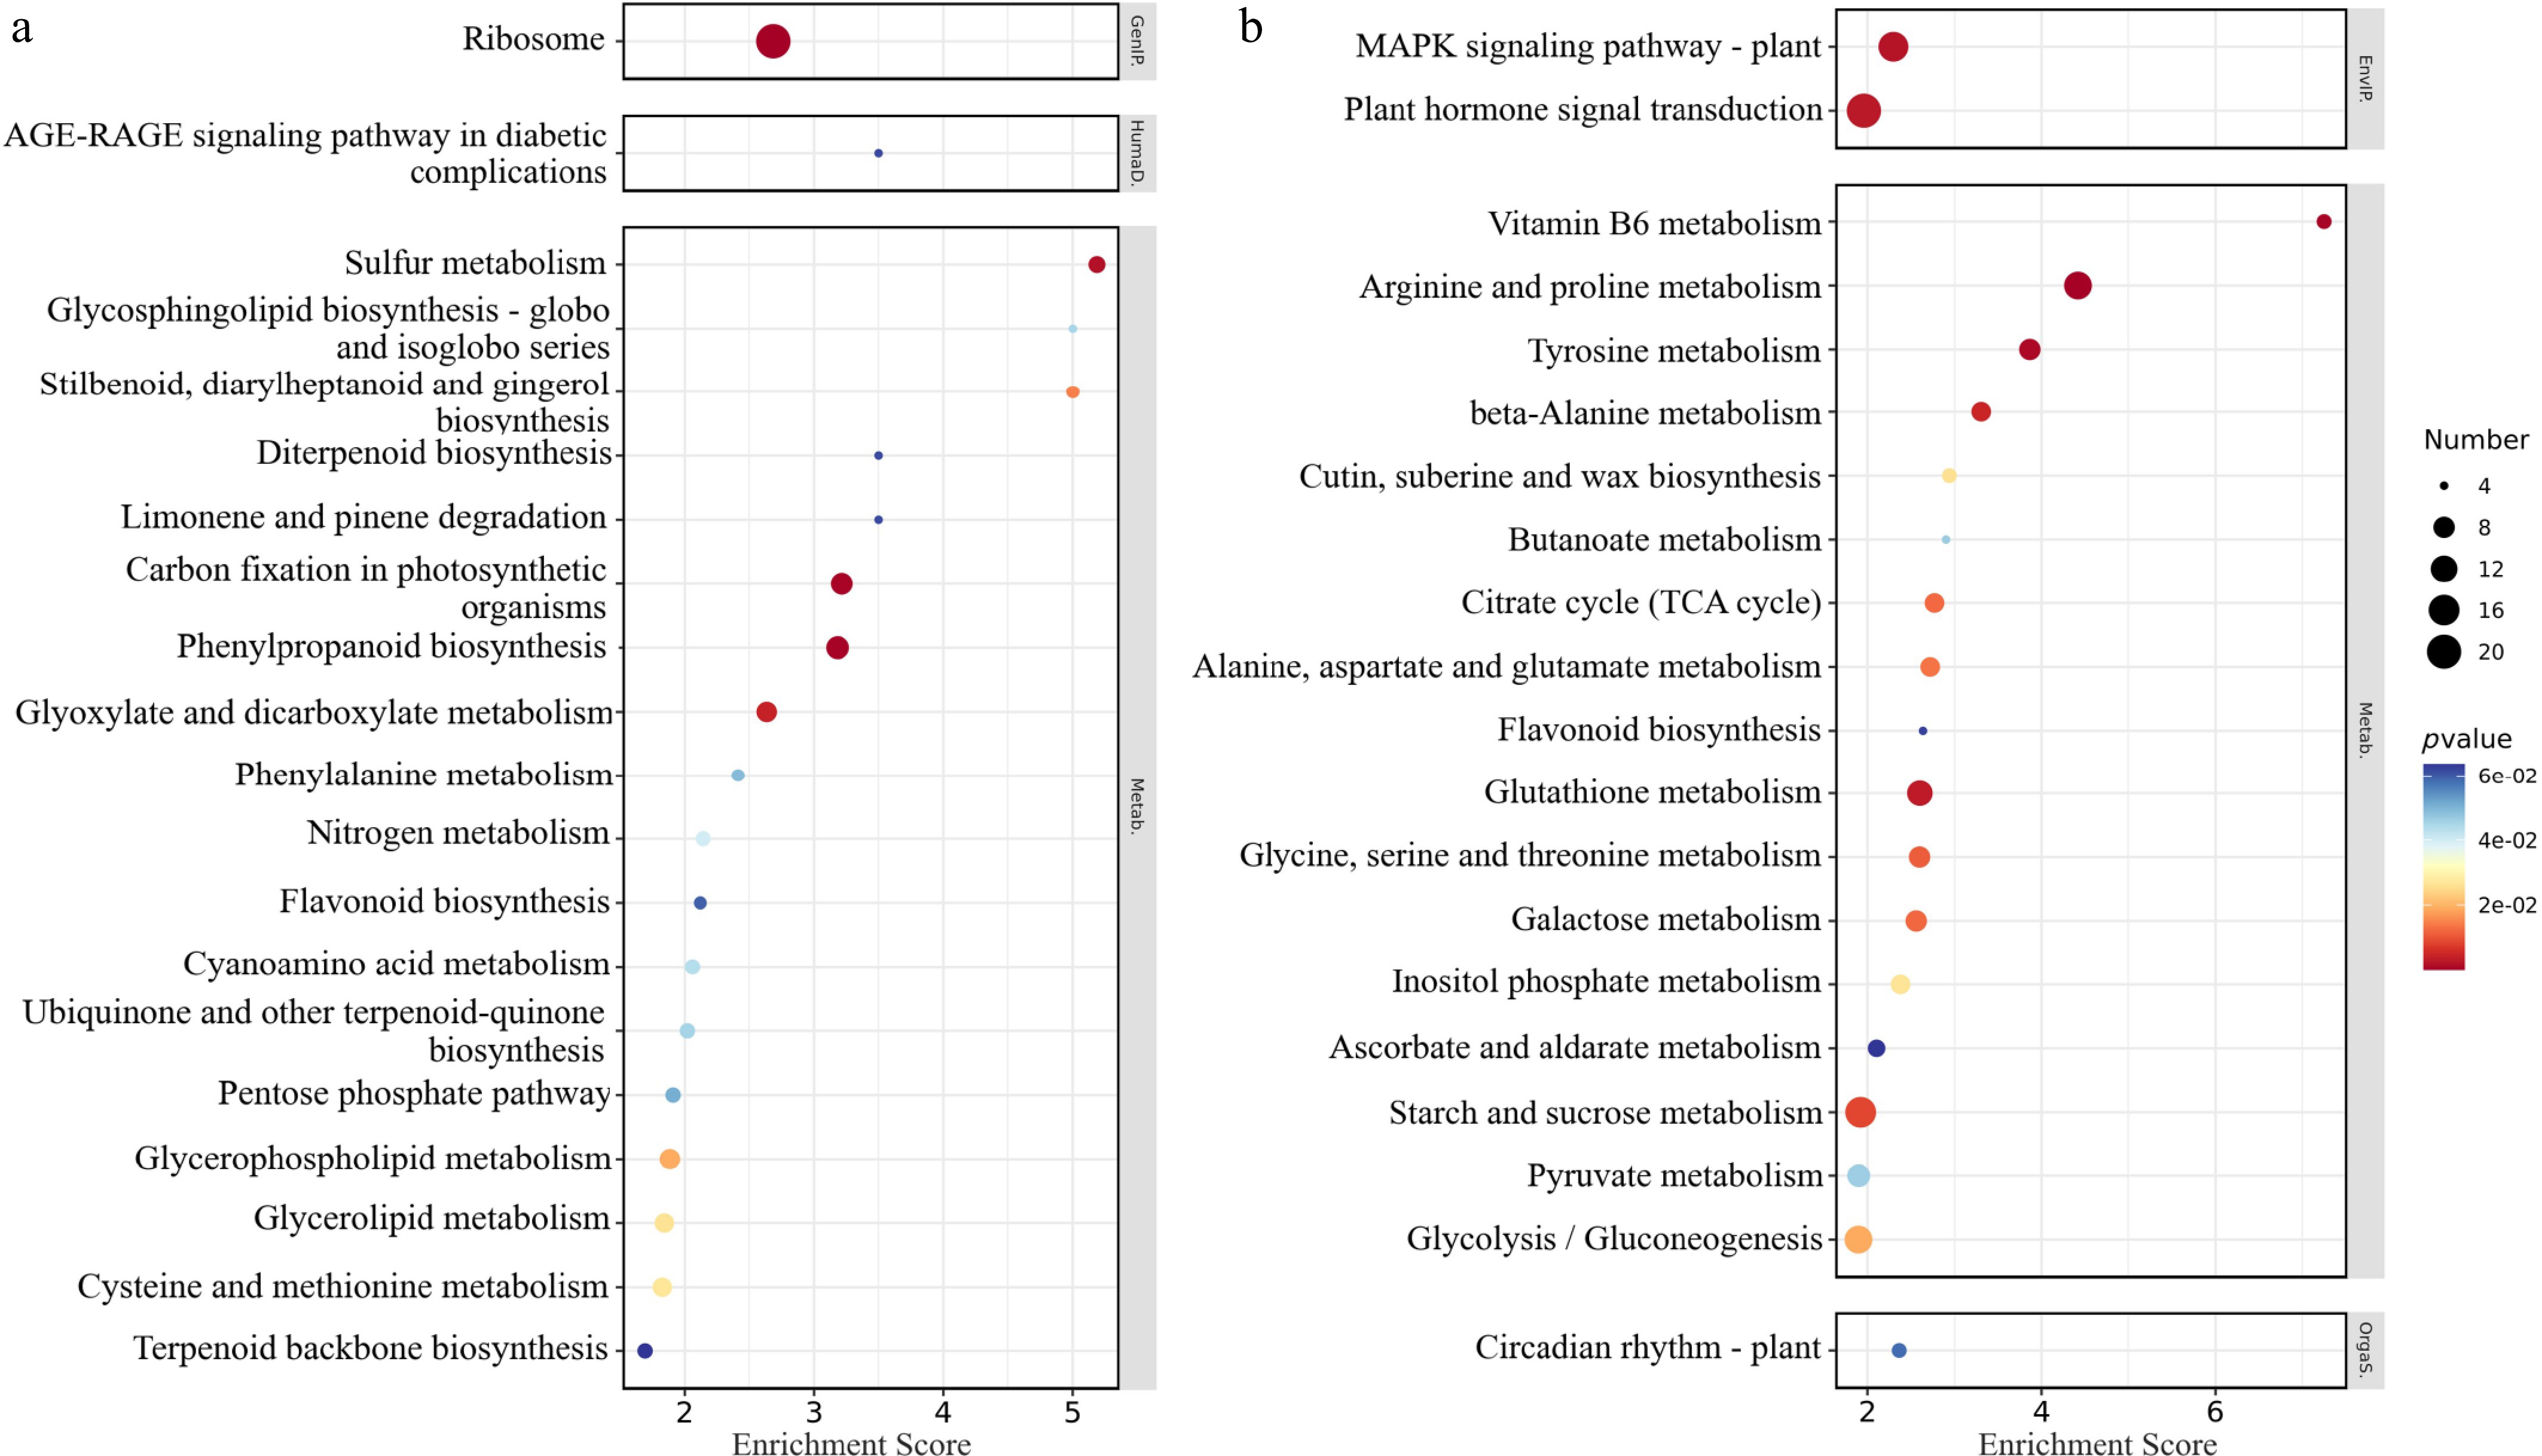
Figure 9.
KEGG enrichment analysis bubble chart of differentially expressed genes. (a) Downregulated gene enrichment pathway enrichment score top 20. (b) Upregulated gene enrichment pathway enrichment score top 20. The abscissa concentrates the enrichment score; the ordinate represents the KEGG pathway; and the size of the bubble represents the number of DEGs annotated to the KEGG pathway. The color of the bubble changes from blue-white-yellow-red, and the smaller the p-value, the greater the significance.
Under salt stress, transcriptomic analysis revealed a systemic upregulation of carbon metabolism-related genes, with distinct modulation across interconnected pathways (Fig. 10). In the citric acid (TCA) cycle, key enzymes including ACO (aconitase), SDH1 (succinate dehydrogenase), aceE (pyruvate dehydrogenase subunit), and pckA (phosphoenolpyruvate carboxykinase) were significantly induced, suggesting enhanced mitochondrial energy production and anaplerotic flux. The starch and sucrose metabolism pathway exhibited broad activation of genes encoding starch-degrading enzymes (E3.2.1.21 [β-amylase], E3.2.1.2 [α-amylase], MGAM [maltase-glucoamylase]) and sucrose synthase (SUS), while E3.2.1.58 (isoamylase) was downregulated, indicative of prioritized carbohydrate mobilization over storage. Within glycolysis/gluconeogenesis, genes driving glycolytic flux (PDC [pyruvate decarboxylase], ADH1 [alcohol dehydrogenase], gapA [GAPDH]) and gluconeogenic enzymes (MINPP1 [multiple inositol polyphosphate phosphatase], gpml [phosphoglucomutase]) were upregulated, whereas GALM (galactose mutarotase), ALDO (aldolase), and ALDH (aldehyde dehydrogenase) were suppressed, reflecting a shift toward pyruvate-derived energy synthesis. Notably, HK (hexokinase), a pivotal node linking glycolysis and starch/sucrose metabolism, was markedly induced, potentially coordinating carbon partitioning between energy generation and osmotic protectant biosynthesis.
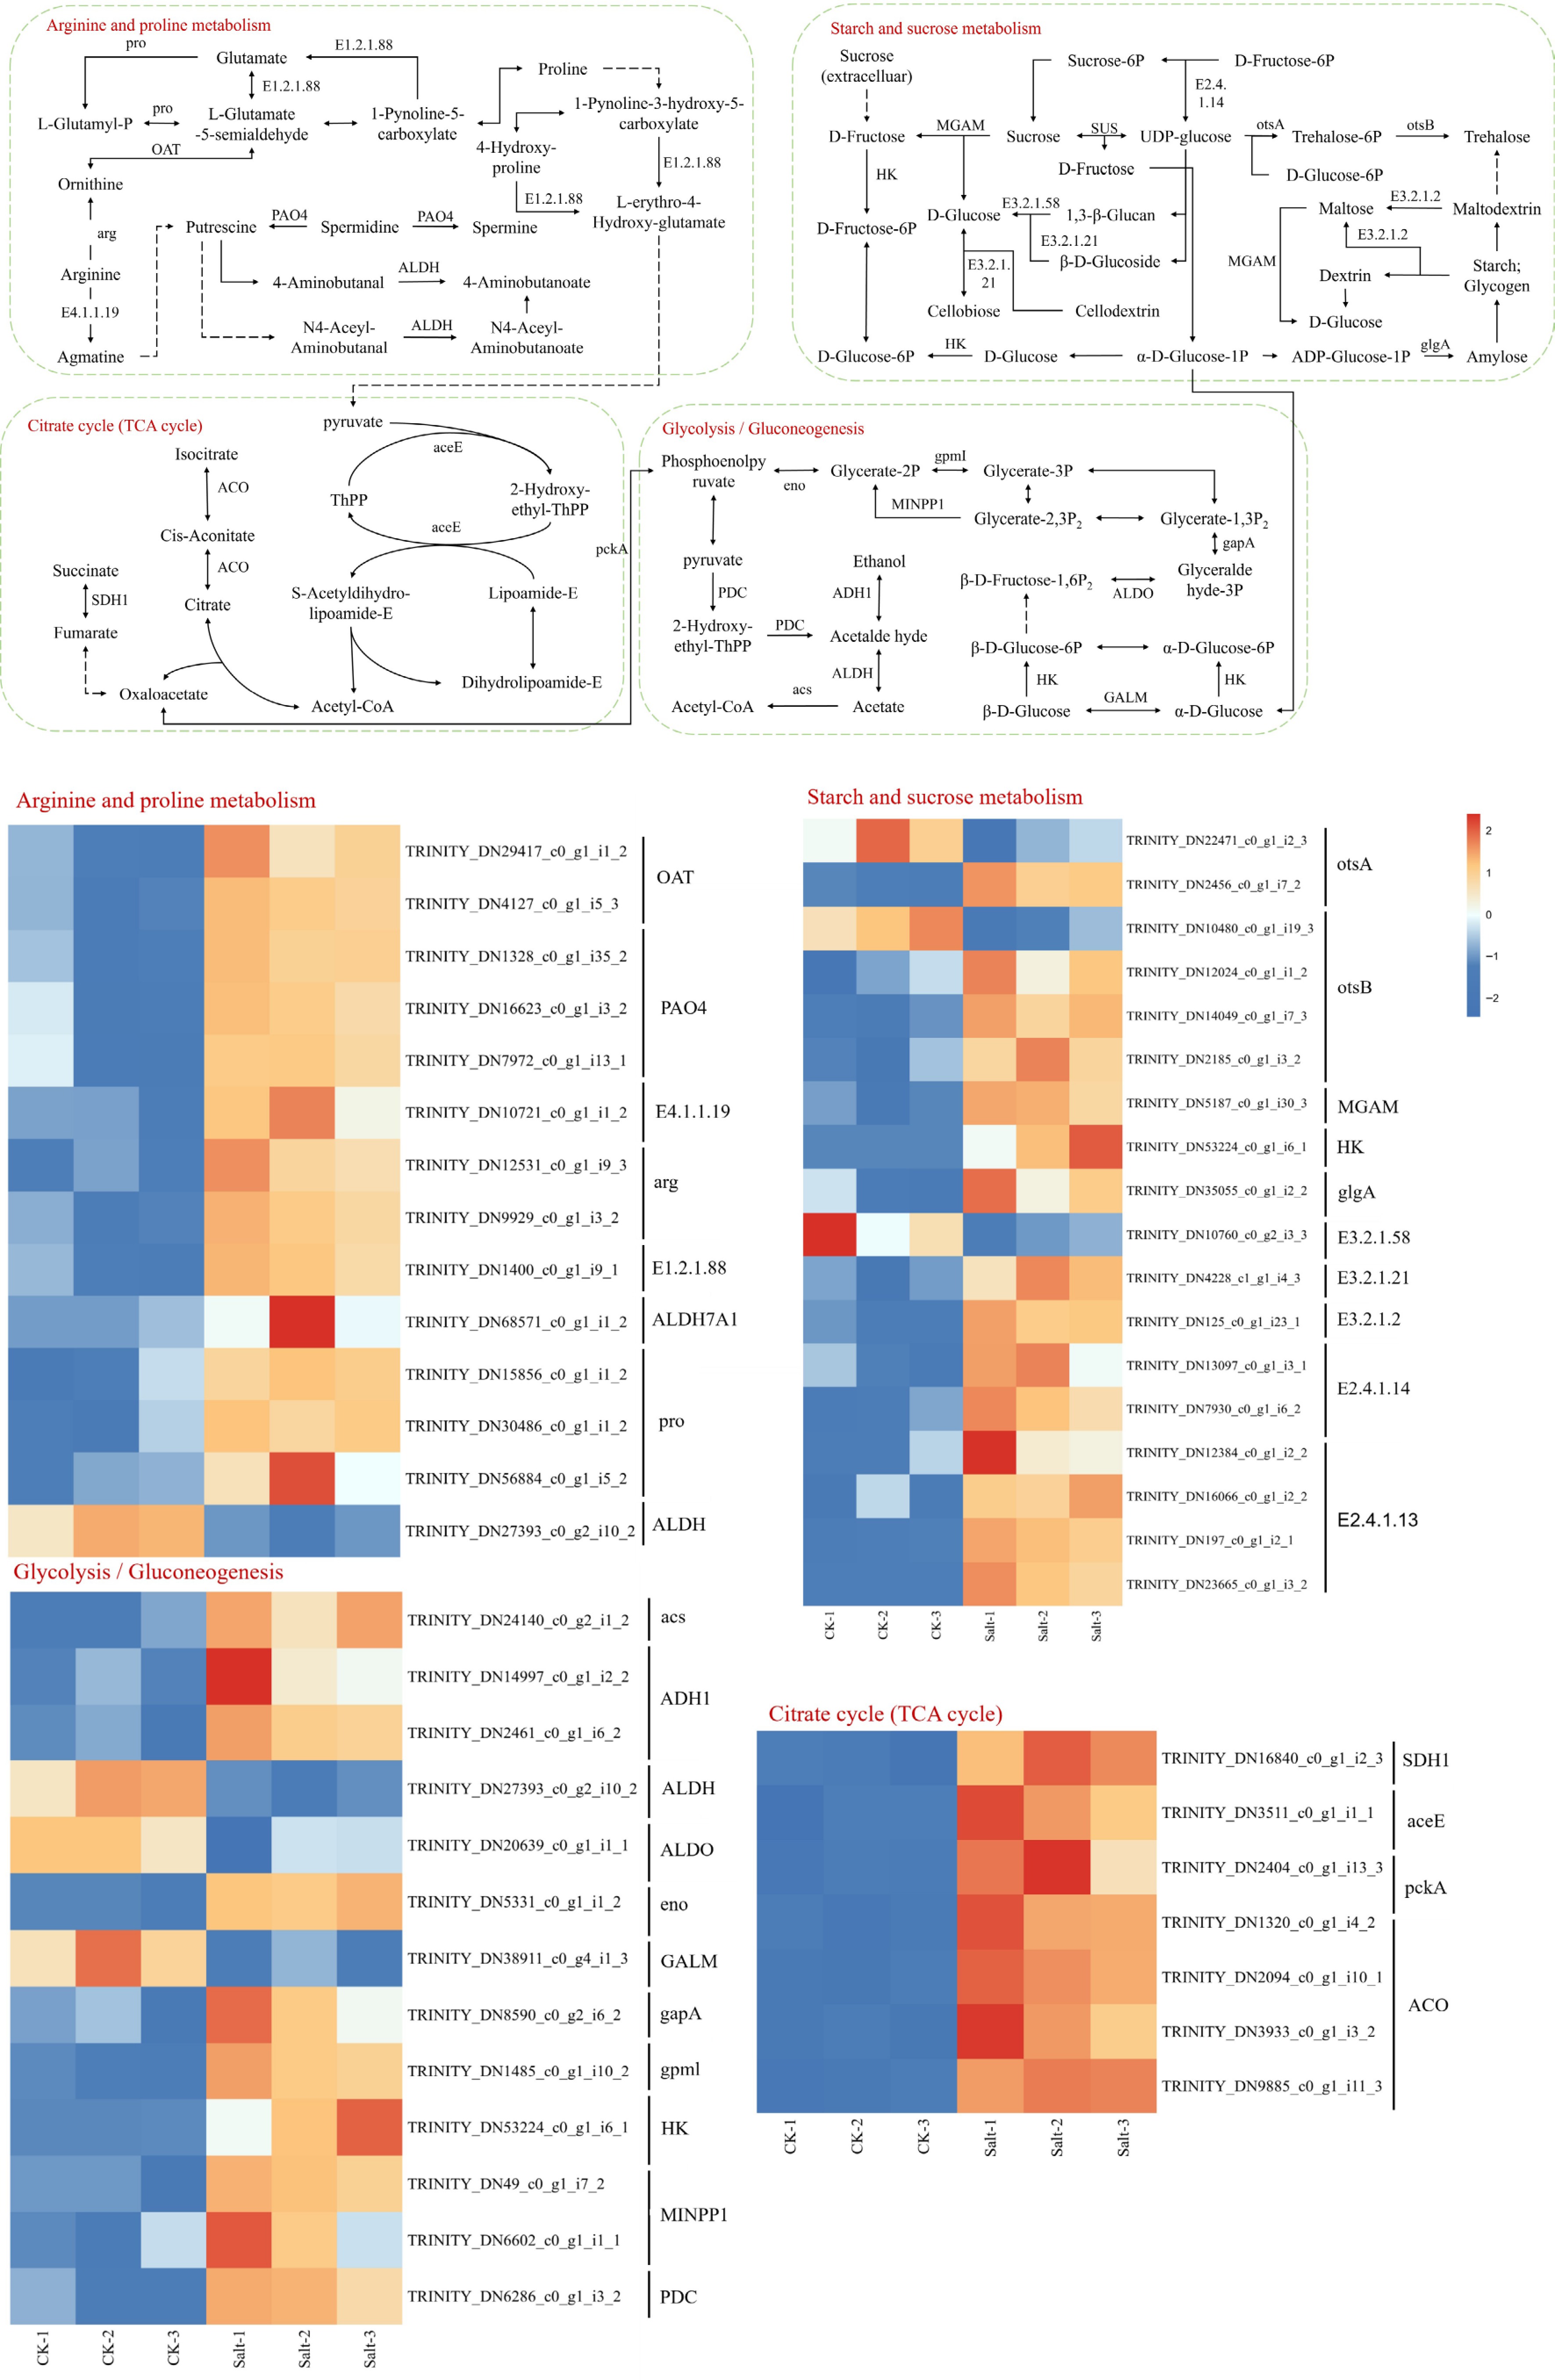
Figure 10.
KEGG significantly enriched DEGs in arginine and proline metabolism, starch and sucrose metabolism, citrate cycle and glycolysis/gluconeogenesis. Expression levels are displayed as log2-transformed FPKM values (Fragments Per Kilobase per Million mapped reads), color scale indicates relative expression levels: red (upregulation), and blue (downregulation).
Within amino acid metabolism, the arginine and proline biosynthesis pathway exhibited pronounced upregulation under salt stress, functionally interconnected with the citric acid (TCA) cycle through pyruvate (Fig. 9). Key enzymes driving this activation included E1.2.1.88 (glutamate-5-semialdehyde dehydrogenase), E4.1.1.19 (argininosuccinate lyase), arg (arginase), OAT (ornithine aminotransferase), PAO4 (polyamine oxidase), and proB (γ-glutamyl kinase), collectively enhancing proline synthesis while replenishing TCA intermediates via anaplerotic reactions. Notably, ALDH (aldehyde dehydrogenase), a bifunctional enzyme participating in both glycolysis/gluconeogenesis and oxidative stress responses, was downregulated.
Transcription factors analysis
-
Under salt stress conditions, a total of 65 transcription factors (TFs) family genes were identified as differentially expressed in F. rubra (Fig. 11). Among these, 13 TF families exhibited significant upregulation, including key stress-responsive regulators such as AP2/ERF-ERF, WRKY, NAC, MYB, bZIP, and bHLH, which are widely associated with abiotic stress signaling. Additional upregulated families encompassed B3, C2H2, C3H, GARP-G2-like, HB-HD-ZIP, HSF, and MYB-related, suggesting a coordinated activation of transcriptional networks governing osmotic adjustment, redox homeostasis, and cellular adaptation.

Figure 11.
Distribution of differentially expressed transcription factor families. The dark blue represents the number of transcription factors among all the genes measured, yellow represents the number of transcription factors among differentially expressed genes, light blue represents the number of transcription factors among downregulated differentially expressed genes, and pink represents the number of transcription factors among upregulated differentially expressed genes.
-
Soil salt stress represents a major abiotic constraint limiting plant growth and agricultural productivity. Therefore, a deeper understanding of the regulatory mechanisms underlying salt tolerance in F. rubra is essential for advancing adaptation research. In this study, plants were subjected to two-week salt stress, during which key physiological and molecular responses were assessed, including leaf relative conductivity, osmotic adjustment substances, photosynthetic performance, antioxidant enzyme activities, and transcriptome profiles.
It was demonstrated that salt stress severely compromises photosynthetic function in F. rubra, aligning with conserved inhibitory patterns across plant species while revealing the subtle differences in species specificity. Significant reductions in net photosynthetic rate were observed in plants under salt stress, consistent with reports in cotton (Gossypium spp.), tobacco (Nicotiana tabacum L.), and rice (Oryza sativa L.)[33−35]. This common suppression of carbon assimilation capacity is attributed primarily to stomatal limitation, corroborated by reduced stomatal conductance and transpiration in Callistemon citrinus, Viburnum lucidum, and Desmostachya bipinnata[36,37]. Chlorophyll fluorescence analysis revealed both conserved and divergent photochemical responses[38]: PSII photoinhibition was evidenced by decreased Fv/Fm, Fq'/Fm', and ETR, mirroring patterns in Eutrema salsugineum, cotton, and Corylus heterophylla × C. avellana[37,39−41]. Elevated NPQ induced by salt stress observed in F. rubra, cotton, Desmostachya bipinnata, and E. salsugineum indicates a conserved photoprotective strategy for excess energy dissipation[37,39,40], further supported by reduced 1-qP in F. rubra.
Oxidative stress, a secondary effect of salt stress, rapidly induces toxic ROS accumulation and damage[15]. Plant cells perceive high ROS levels and initiate elimination through enzymatic and non-enzymatic scavengers[42]. Many enzymatic and non-enzymatic antioxidant scavengers help to prevent ROS-induced damage in plants under salt stress[43]. A robust antioxidant response was triggered in F. rubra, characterized by coordinated upregulation of SOD, POD, CAT, and APX activities. This aligns with the universal induction of enzymatic ROS scavengers documented under salt stress in tomato (Lycopersicon esculentum L.), pea sprouts (Pisum sativum L.), maize (Zea mays L.), Azolla, cotton, and mung bean (Vigna radiata)[22,34,44−46]. Elevated MDA content induced by salt stress was observed in F. rubra despite enzymatic activation, indicating persistent oxidative damage as documented in pea sprouts and cotton[19,45]. This antioxidant induction likely involves MAPK pathway activation—a master regulator of ROS homeostasis conserved from cotton to Salvia miltiorrhiza[40,47]—which bridges ion toxicity (via SOS crosstalk) and enzymatic defense[48].
Transcriptomic analysis revealed profound reprogramming of hormone signaling in F. rubra under salt stress, with the ABA pathway serving as the central hub. Upregulation of ABA biosynthesis genes which mirrored ABA accumulation patterns, contributed to enhanced salt tolerance in maize (Zea mays L.), potato (Solanum tuberosum L.), and Schrenkiella parvula[11,49,50]. Coordinated induction of PP2C (negative regulator) and SnRK2 (positive effector) directly paralleled ABA signaling activation mechanisms in wheat (Triticum aestivum) under salt stress, where PP2C-ABF modules drive stress-responsive expression[51], confirming PP2C-SnRK2-ABF phosphorylation cascades as evolutionary foundations for salt stress adaptation. KEGG enrichment implied crosstalk with other phytohormones (e.g., jasmonate/ethylene), highlighting signal network plasticity as a resilience determinant.
Salt stress induces the biosynthesis and accumulation of compatible osmolytes, which can reduce the intracellular osmotic potential and stabilize protein and cell structure and morphology[52]. Conserved osmotic adjustment strategies were employed by F. rubra, characterized by significant proline and soluble sugar accumulation supported by transcriptional reprogramming of arginine/proline metabolism and starch/sucrose metabolism. Elevated proline levels confirmed its role as a core osmolyte, consistent with reports in rice, tomato, kenaf (Hibiscus cannabinus), maize, and Acacia auriculiformis[22,44,53−55]. Increased soluble sugars corresponded to patterns in DY22-inoculated soybean and pea sprouts[45,56]. The coordinated induction of the TCA cycle and glycolysis/gluconeogenesis pathways resembled the energy-metabolism synergy observed in oat (Avena sativa) and Leymus chinensis[57]. This coordination balances carbon-energy homeostasis during osmotic adjustment, representing a strategy convergent with stress-resilient transgenic rice[53].
When plants are under stress, transcription factors bind to their target DNA sites and regulate gene expression by activating or blocking transcription mechanisms on gene promoters in response to stress. Transcriptional reprogramming was orchestrated through coordinated activation of 13 TF families, with AP2/ERF, WRKY, NAC, MYB, bZIP and bHLH forming the core network. Significant NAC upregulation aligned with systemic induction in Arabidopsis and tolerance-enhancing functions in rice (OsNAC45/OsNAC6), while SNAC1 conferred cross-species tolerance when expressed in wheat[21,58−60]. WRKY TFs critically regulated defense responses[61], converging functionally with maize memory regulators (WRKY40, WRKY46, and others) and Arabidopsis sensitivity modulators (WRKY18/WRKY60)[22,62]. Under salt stress, MYB TFs in F. rubra reflect the conserved stress-regulation observed in wheat (Triticum aestivum L.; MYB3/4/13/59) and Arabidopsis (MYB49), with soybean GmMYB46 further demonstrating their ability to co-activate antioxidant and osmotic genes[63,64]. Regulatory roles of bHLH, AP2/ERF, and bZIP TFs under salt stress were corroborated in foxtail millet (Setaria italica), and maize[20,65].
-
Salt stress elicits a coordinated adaptive response in F. rubra, integrating physiological adjustments with transcriptional reprogramming. The stress severely compromises photosynthetic function, manifested through suppressed gas exchange parameters (net photosynthetic rate, stomatal conductance, intercellular CO2 concentration, and transpiration rate) and impaired photochemical efficiency. Concurrently, a robust antioxidant defense is activated, characterized by the concerted induction of key enzymes to mitigate oxidative damage. Hormonal signaling pathways, particularly ABA transduction, are centrally engaged through upregulation of ABA biosynthesis genes and core regulatory components, including SnRK2 kinases and PP2C phosphatases. To counteract osmotic stress, the plant accumulates compatible solutes such as proline and soluble sugars, driven by transcriptional enrichment in arginine/proline metabolism and starch/sucrose metabolic pathways. Ultimately, this multi-faceted adaptation is orchestrated by the synergistic induction of 13 transcription factor families—including AP2/ERF, WRKY, NAC, MYB, bZIP, and bHLH—which jointly reorganize the transcriptional network to integrate antioxidant activity, hormone signaling, osmotic adjustment, and photosynthetic resilience into a unified defense framework.
We are grateful for the support of the National Key R&D Program of China (Grant Nos 2024YFF1307800, 2024YFF1307802).
-
The authors confirm contributions to the paper as follows: study conception and design: Guo Q; data collection: Xiong X, Jing Y, Tang Y, Chen Y, Zhang H; analysis and interpretation of results: Xiong X, Jing Y; draft manuscript preparation: Xiong X. All authors reviewed the results and approved the final version of the manuscript.
-
Raw and processed RNA-Seq data files were deposited in SRA (www.ncbi.nlm.nih.gov/sra) under the following accession numbers: PRJNA1307194. The datasets generated during and/or analyzed during the current study are available from the corresponding author on reasonable request.
-
The authors declare that they have no conflict of interest.
- Supplementary Table S1 The relative abundance of DEGs under salt treatments DEGs.
- Supplementary Fig. S1 BUSCO Integrity Assessment Chart.
- Supplementary Fig. S2 Effects of different concentrations of salt treatment on leaf growth rate of Festuca rubra.
- Supplementary Fig. S3 Effects of different concentrations of salt treatment on gas exchange parameters of Festuca rubra.
- Copyright: © 2025 by the author(s). Published by Maximum Academic Press, Fayetteville, GA. This article is an open access article distributed under Creative Commons Attribution License (CC BY 4.0), visit https://creativecommons.org/licenses/by/4.0/.
-
About this article
Cite this article
Xiong X, Jing Y, Tang Y, Chen Y, Zhang H, et al. 2025. Physiological and transcriptome analyses reveal key responses of Festuca rubra to salt stress. Grass Research 5: e027 doi: 10.48130/grares-0025-0024 

Physiological and transcriptome analyses reveal key responses of Festuca rubra to salt stress
- Received: 16 July 2025
- Revised: 10 September 2025
- Accepted: 12 September 2025
- Published online: 03 November 2025
Abstract: Soil salinization seriously damages plant growth and productivity. Festuca rubra (F. rubra) is a perennial grass with ecological and economic value, showing significant salt tolerance. However, its potential physiological and molecular mechanisms remain not fully elucidated. To explore F. rubra's response to salt stress, this study treated plants with salt stress (1% NaCl solution, w/v). Physiological parameters (relative electrical conductivity, photosynthetic traits, antioxidant systems) and transcriptomic profiles were analyzed at the terminal stress stage. Salt-stressed plants accumulated significantly higher levels of osmolytes (soluble sugars and proline). Antioxidant defenses were activated, as evidenced by increased activities of key antioxidant enzymes and elevated malondialdehyde (MDA) content. Net photosynthetic rate markedly declined under salt stress. Transcriptomic analysis revealed that salt stress activated genes associated with antioxidant enzymes and phytohormone signaling (predominantly ABA). It also induced upregulation of genes involved in carbon metabolism and amino acid biosynthesis pathways. These results demonstrate that F. rubra coordinates osmotic adjustment, activates antioxidants, and regulates transcription (specifically through ABA signaling and metabolic reprogramming) to mitigate salt-induced damage. These insights offer potential strategies for enhancing salt stress tolerance in graminaceous crops.
-
Key words:
- Salt stress /
- Festuca rubra /
- Transcriptome /
- Photosynthesis