-
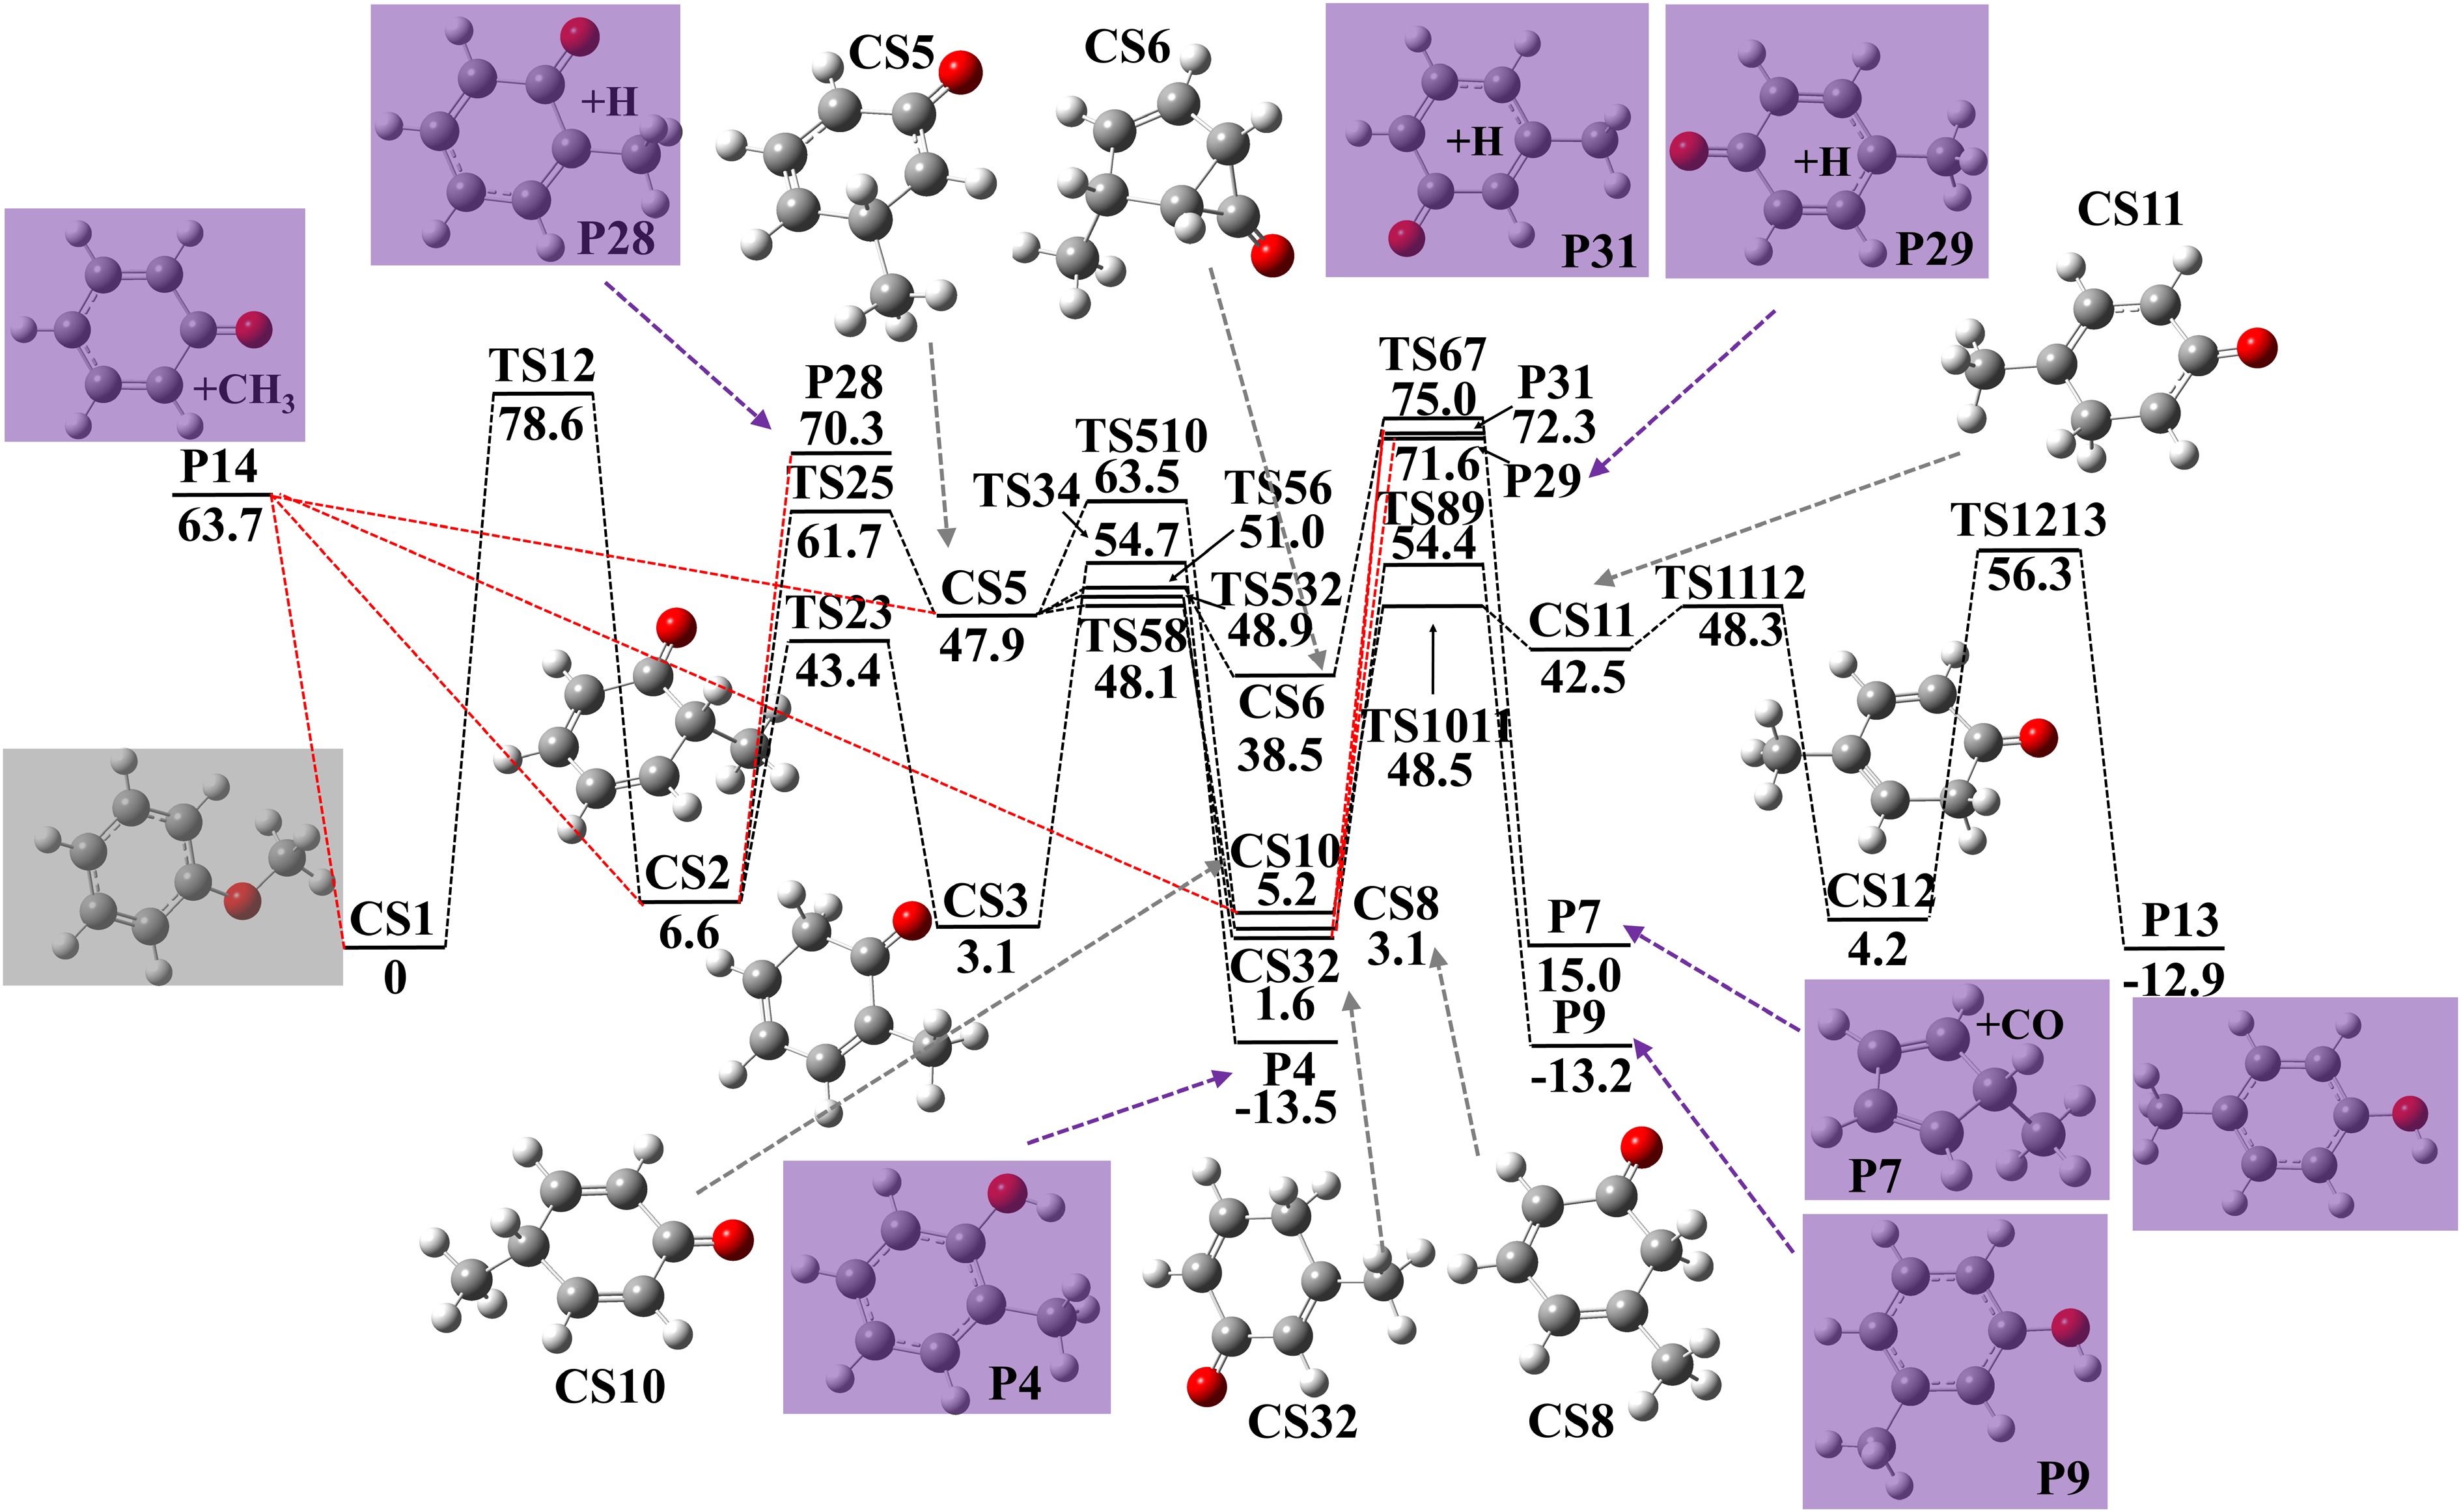
Figure 1.
Potential energy surface of anisole decomposition and following reactions to produce cresols. Energies with units of kcal·mol−1 were calculated using G4 theory. Zero point energy corrections are included at 0 K.
-
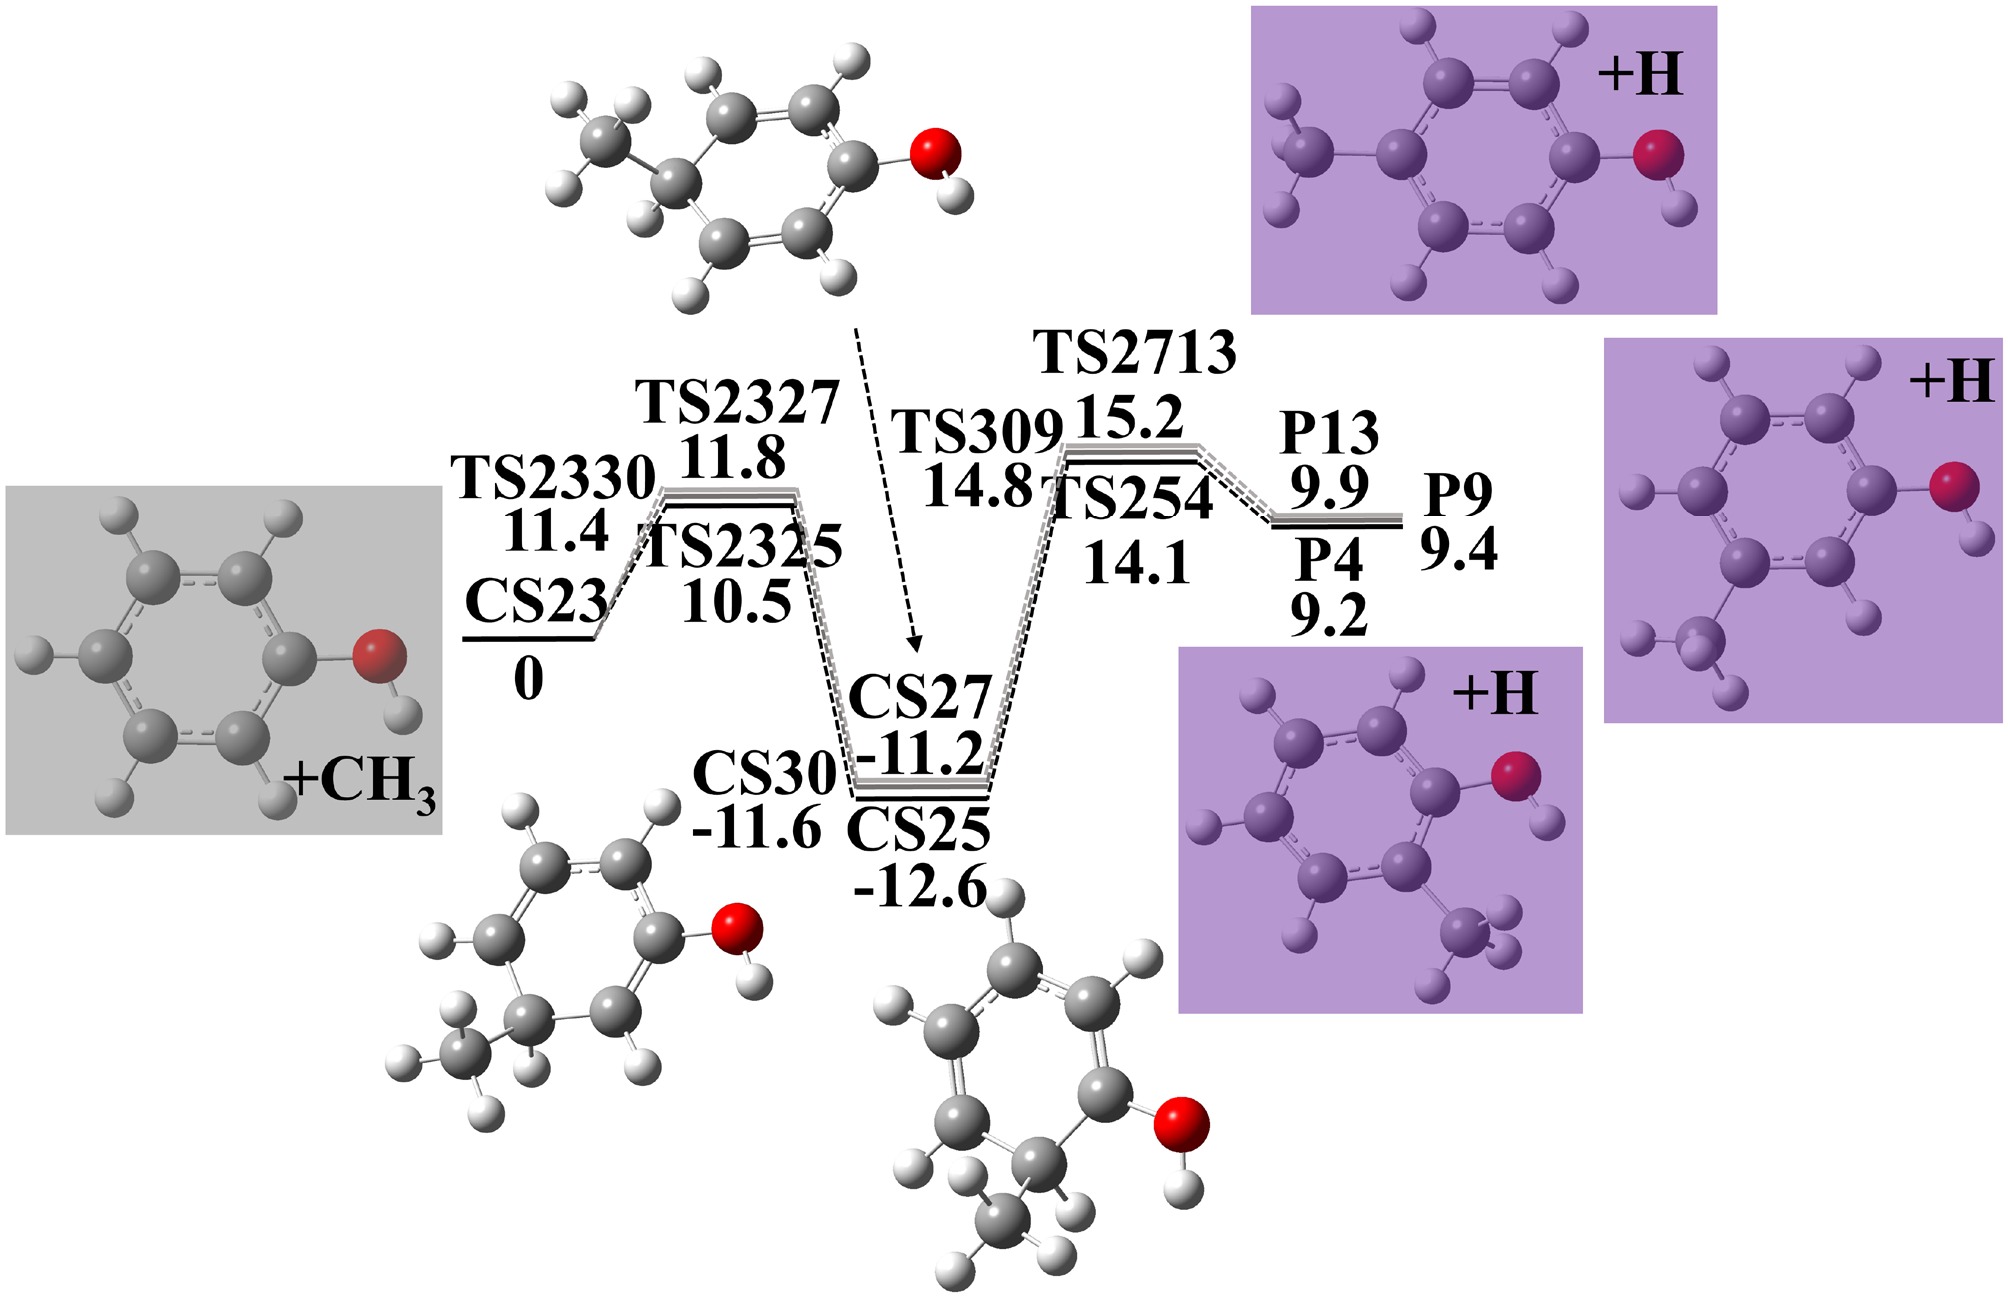
Figure 2.
Potential energy surface of phenol + CH3 reactions to produce cresols. Energies with units of kcal·mol−1 were calculated using G4 theory. Zero point energy corrections are included at 0 K.
-
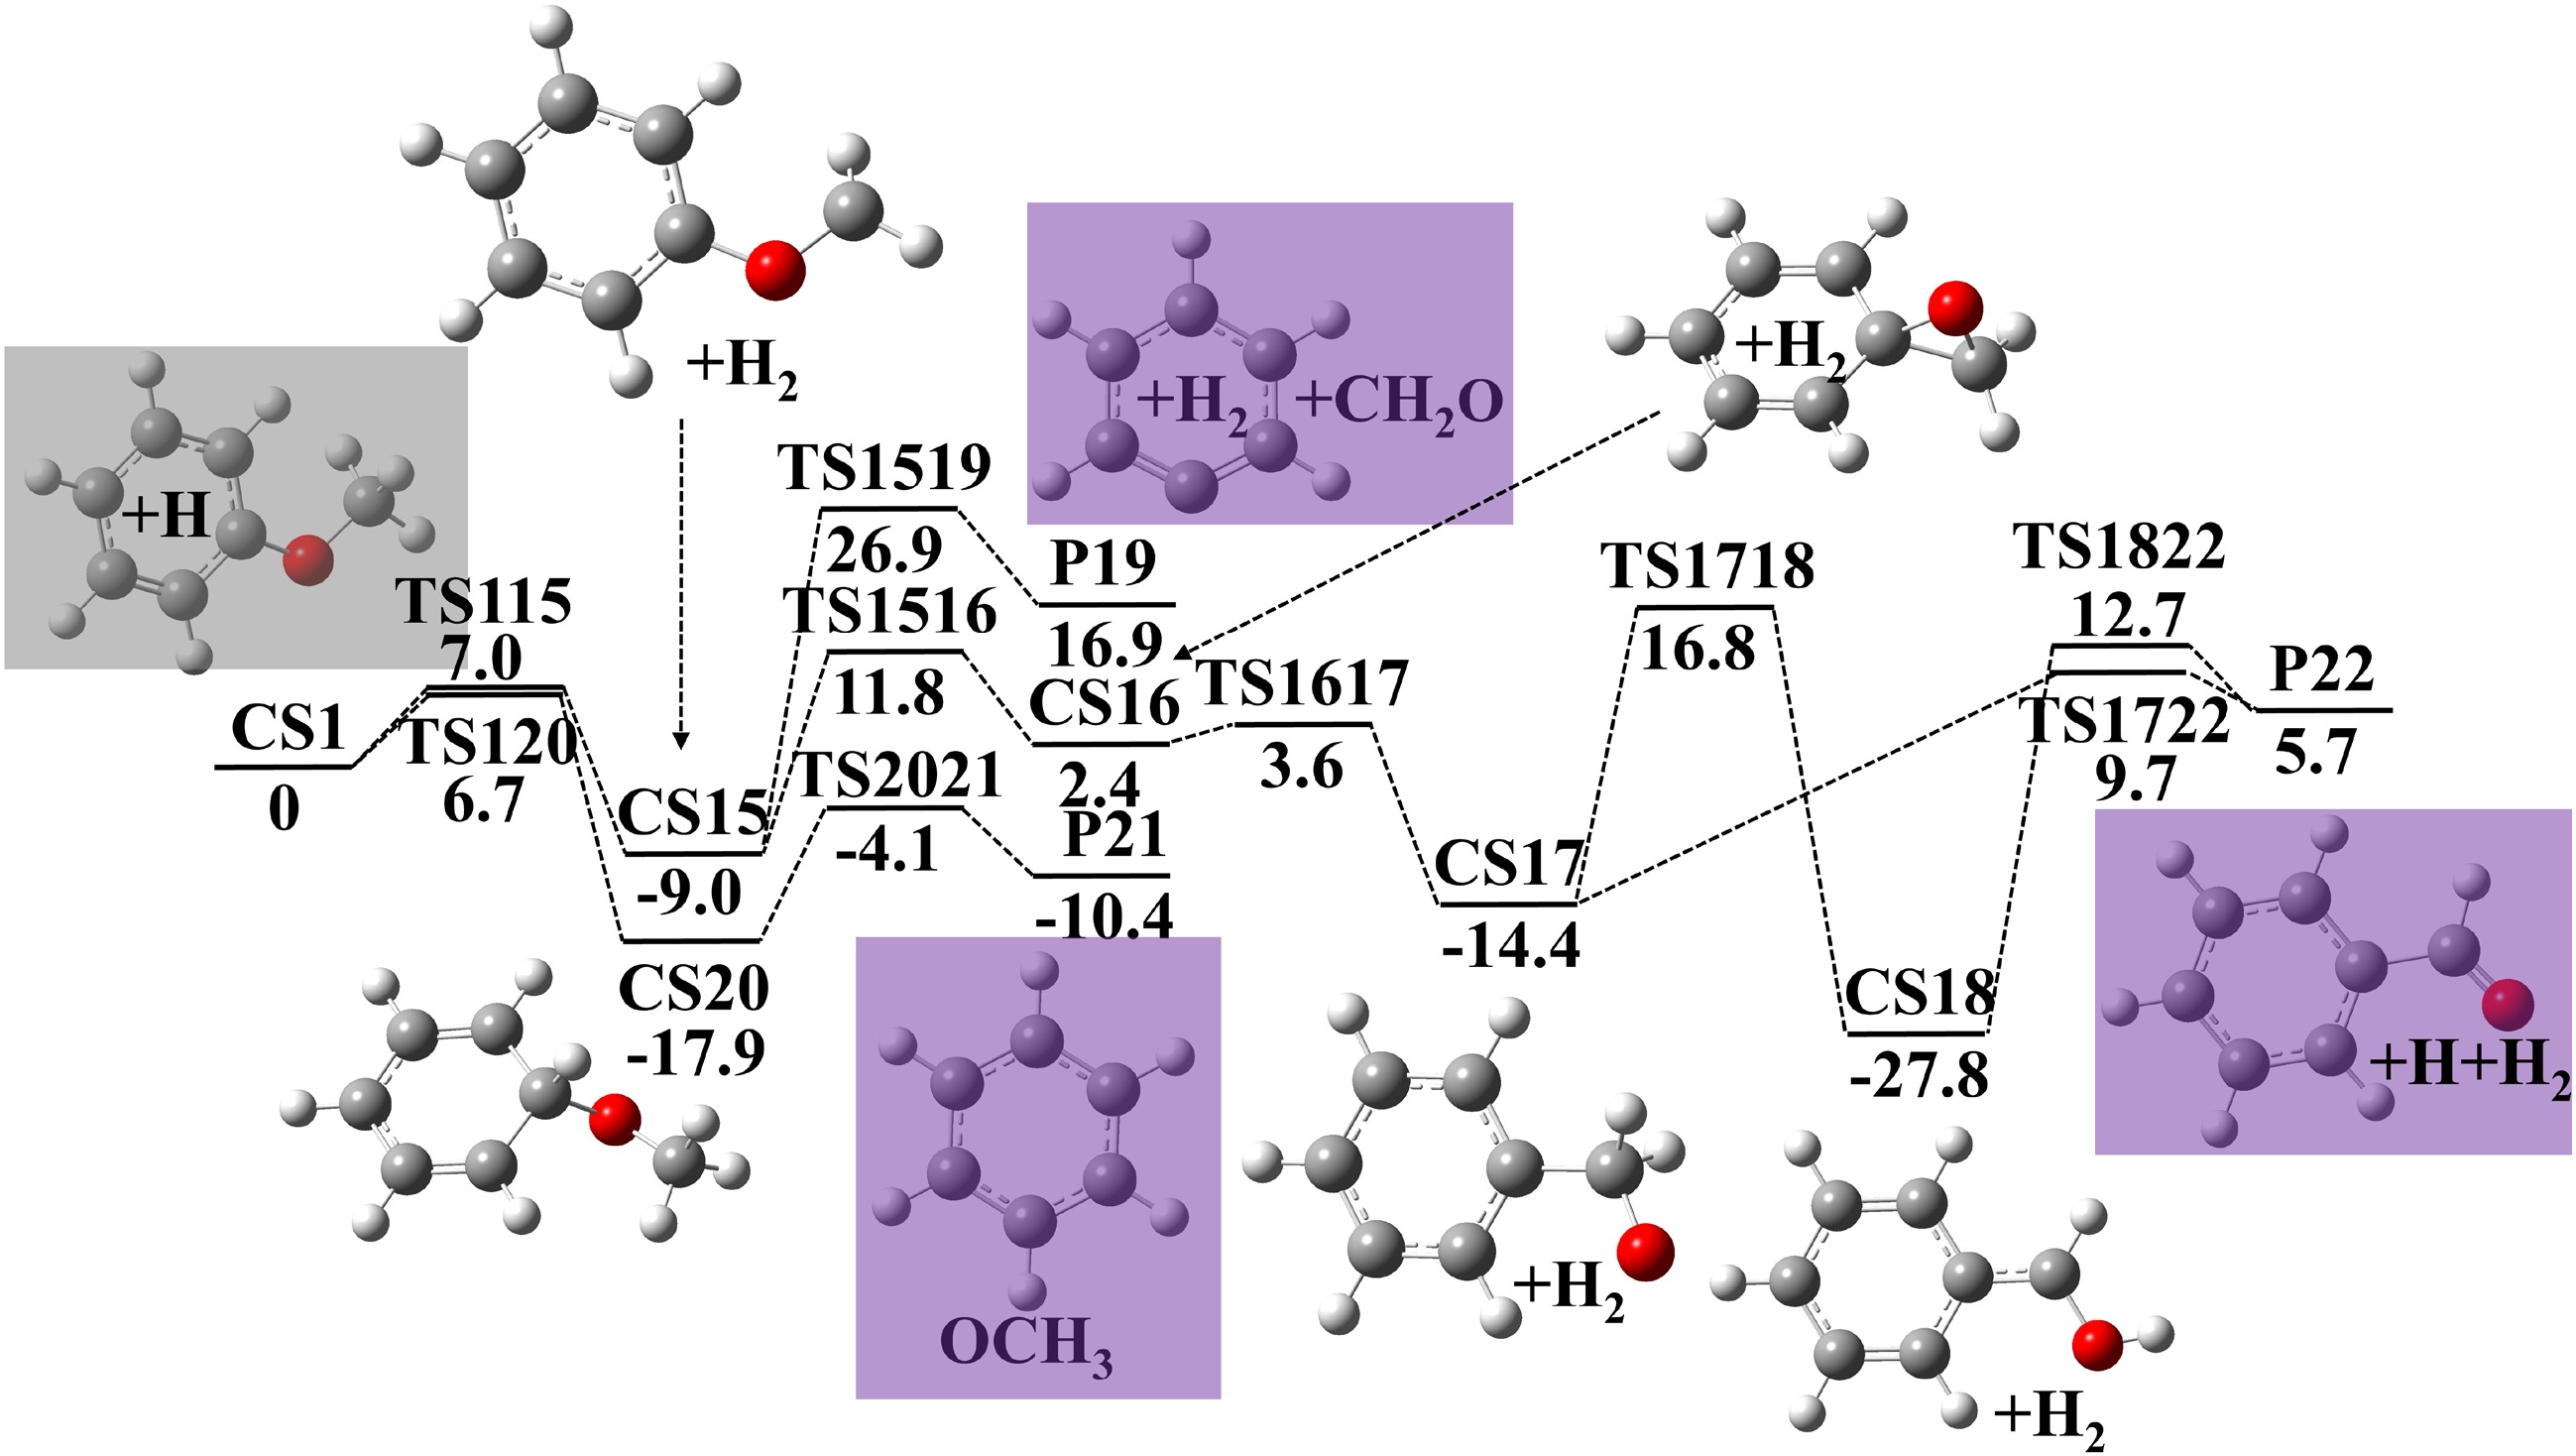
Figure 3.
Potential energy surface of anisole decomposition reactions initiated by H-atom abstraction and H-atom addition. Energies with units of kcal·mol−1 were calculated using G4 theory. Zero point energy corrections are included at 0 K.
-
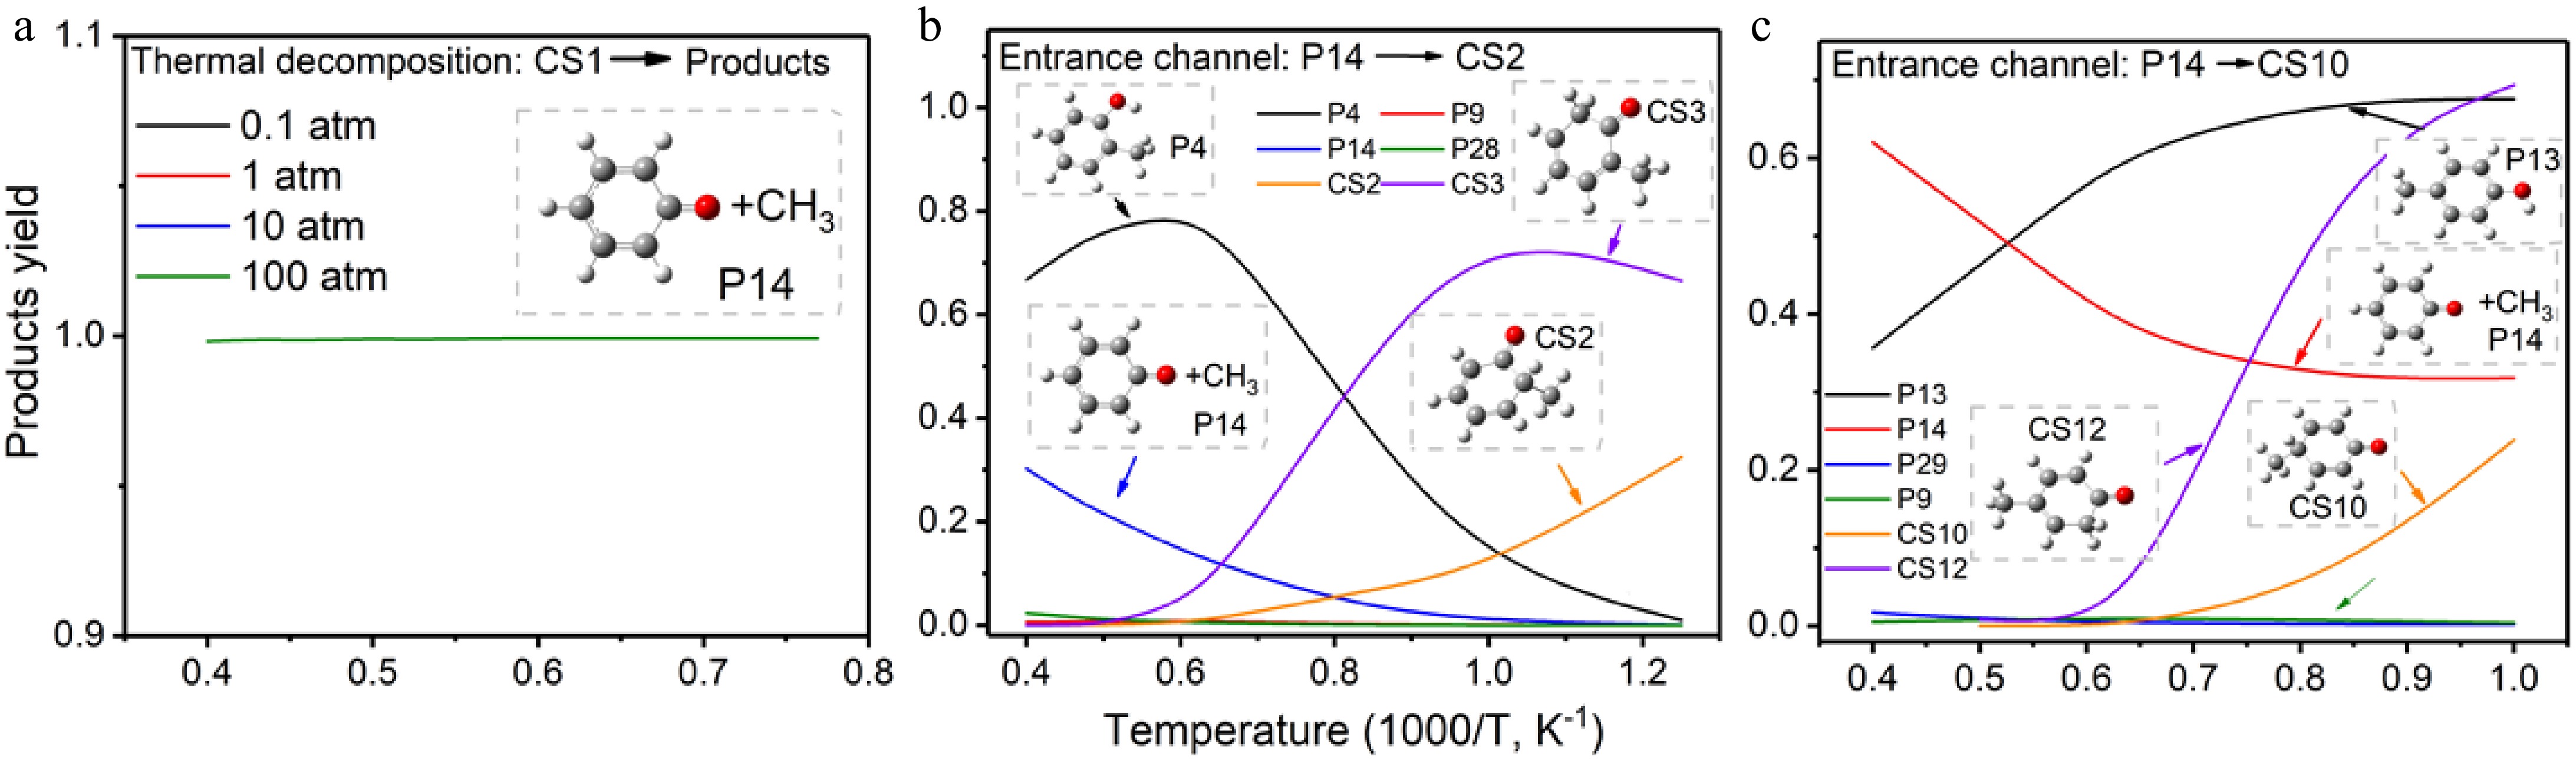
Figure 4.
Product yield of (a) thermal decomposition of anisole, (b) recombination pathway with entrance reaction of CH3 + C6H5O → CS2, (c) recombination pathway with entrance reaction of CH3 + C6H5O → CS10.
-
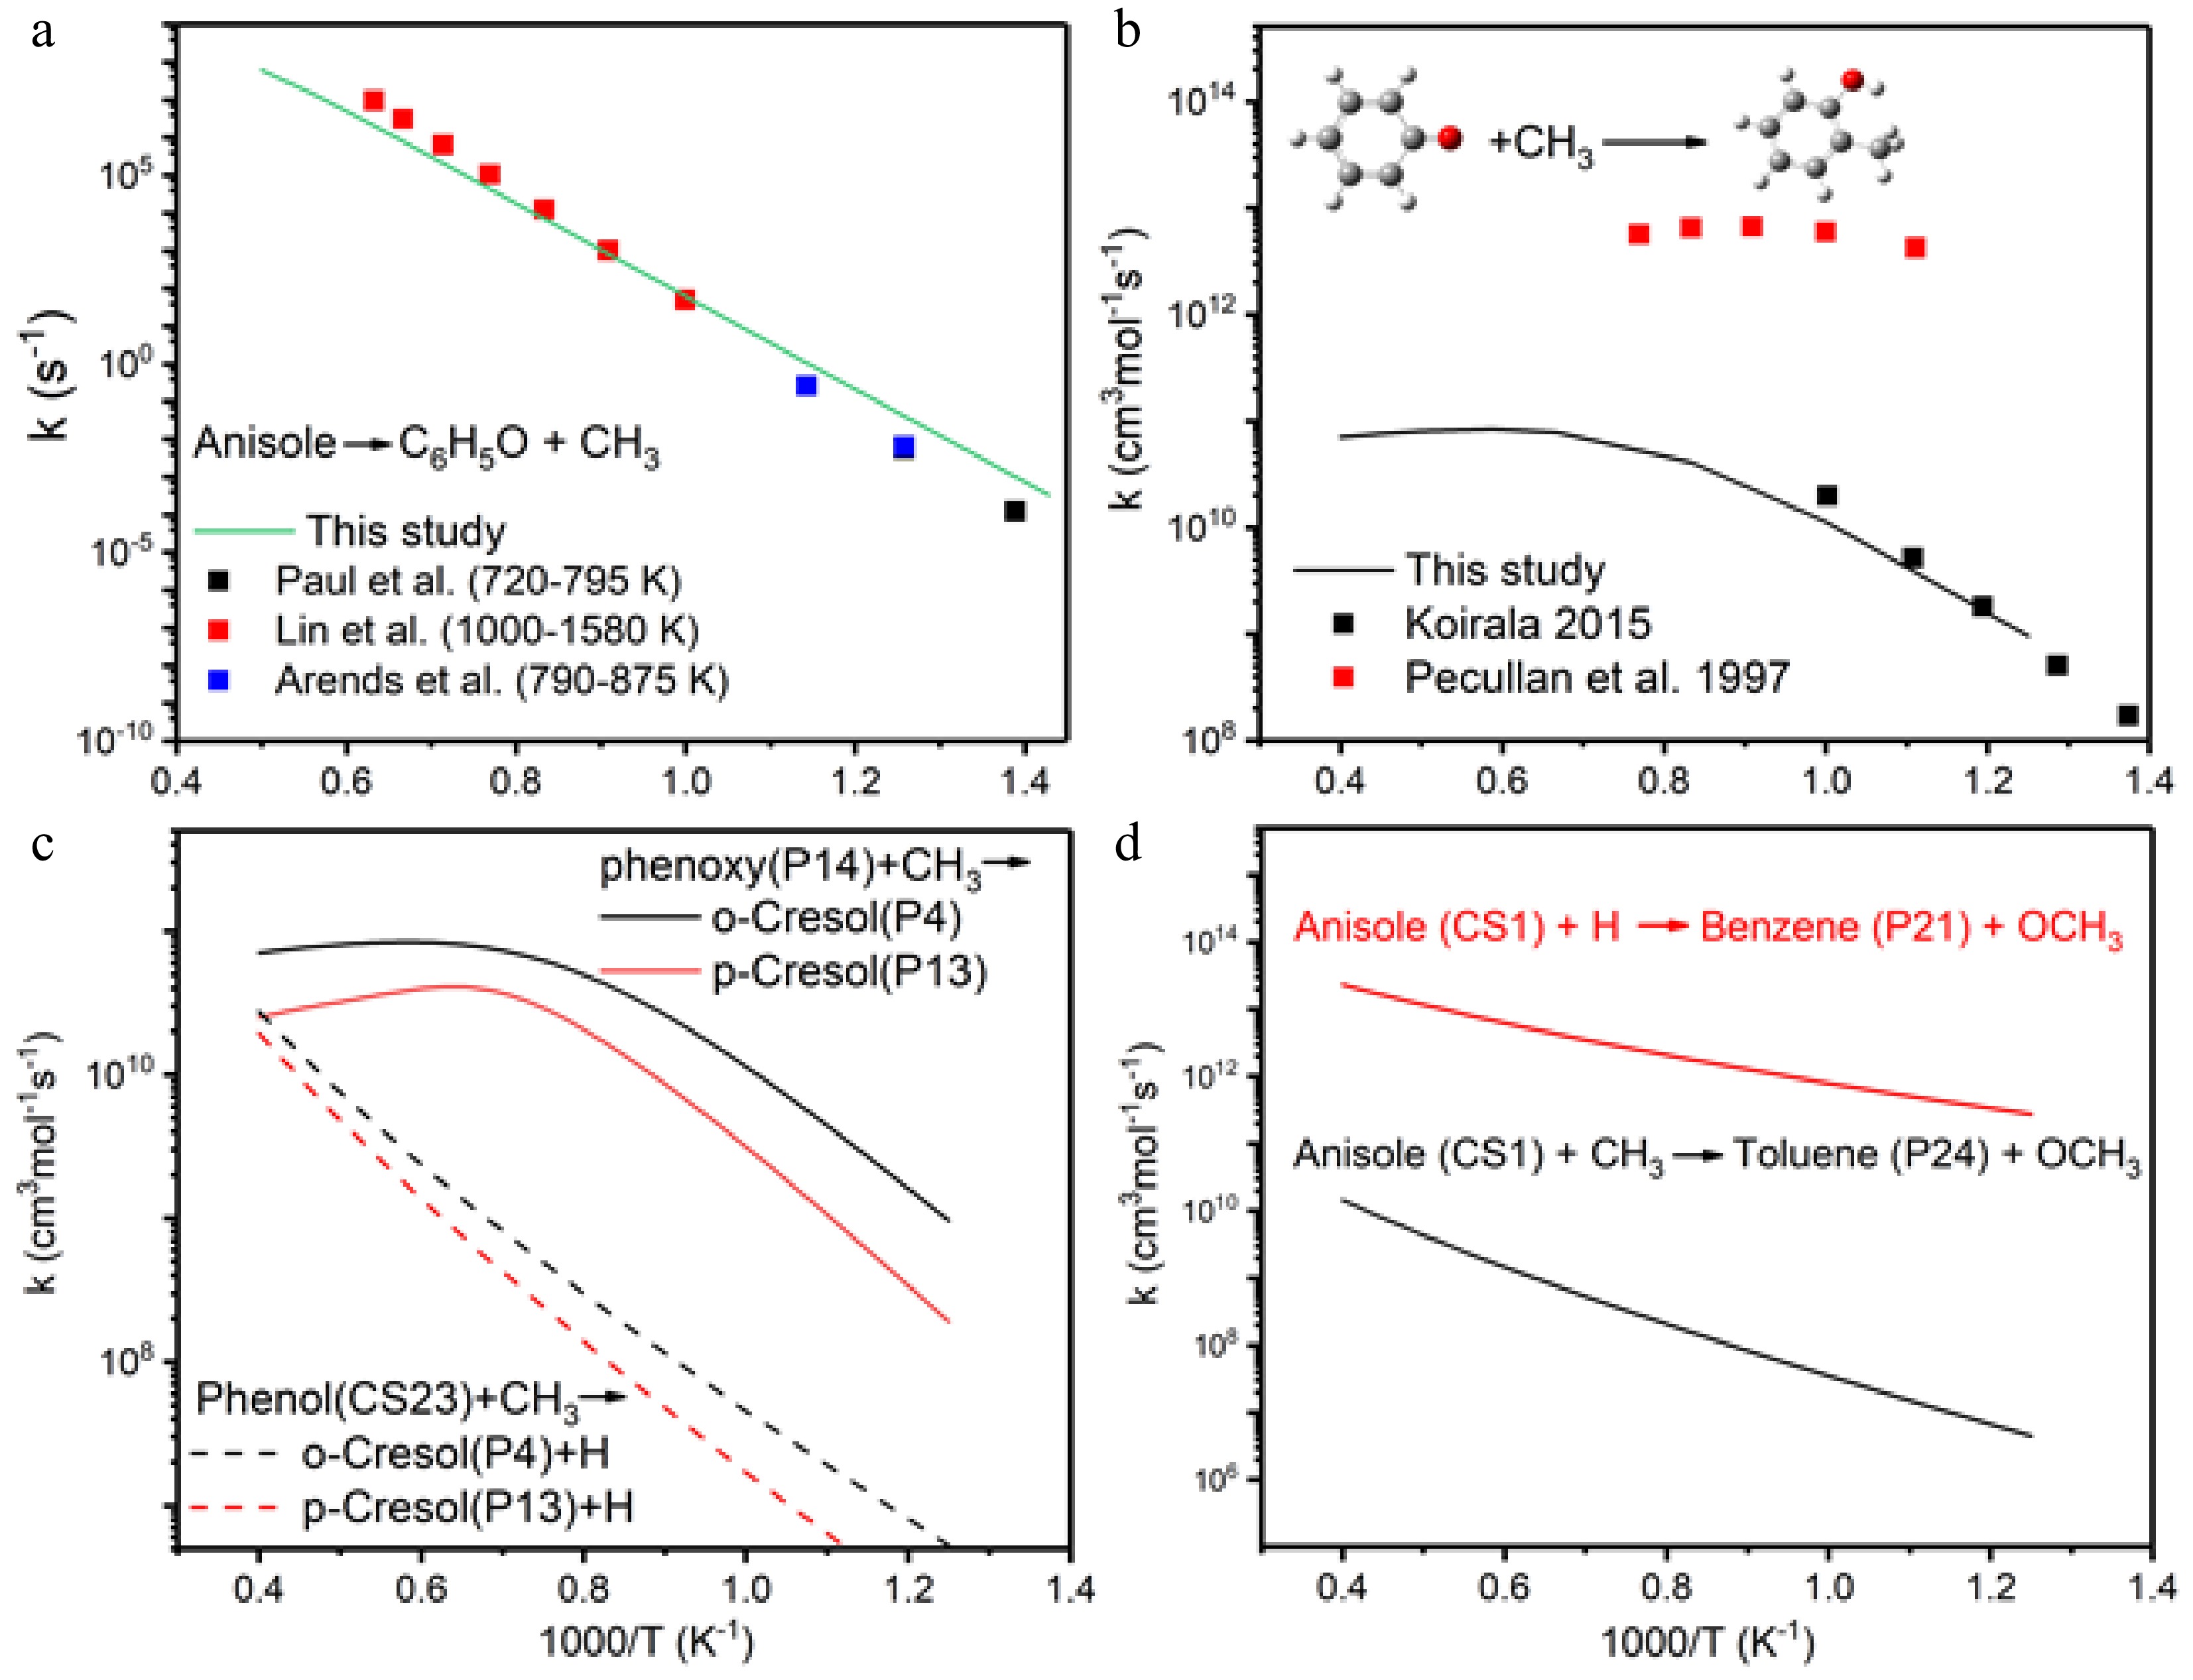
Figure 5.
Reaction rate coefficients of (a) thermal decomposition of anisole, (b) o-cresol formation, (c) comparison of o-cresol and p-cresol formation, (d) OCH3 elimination followed by H/CH3 addition.
-
-
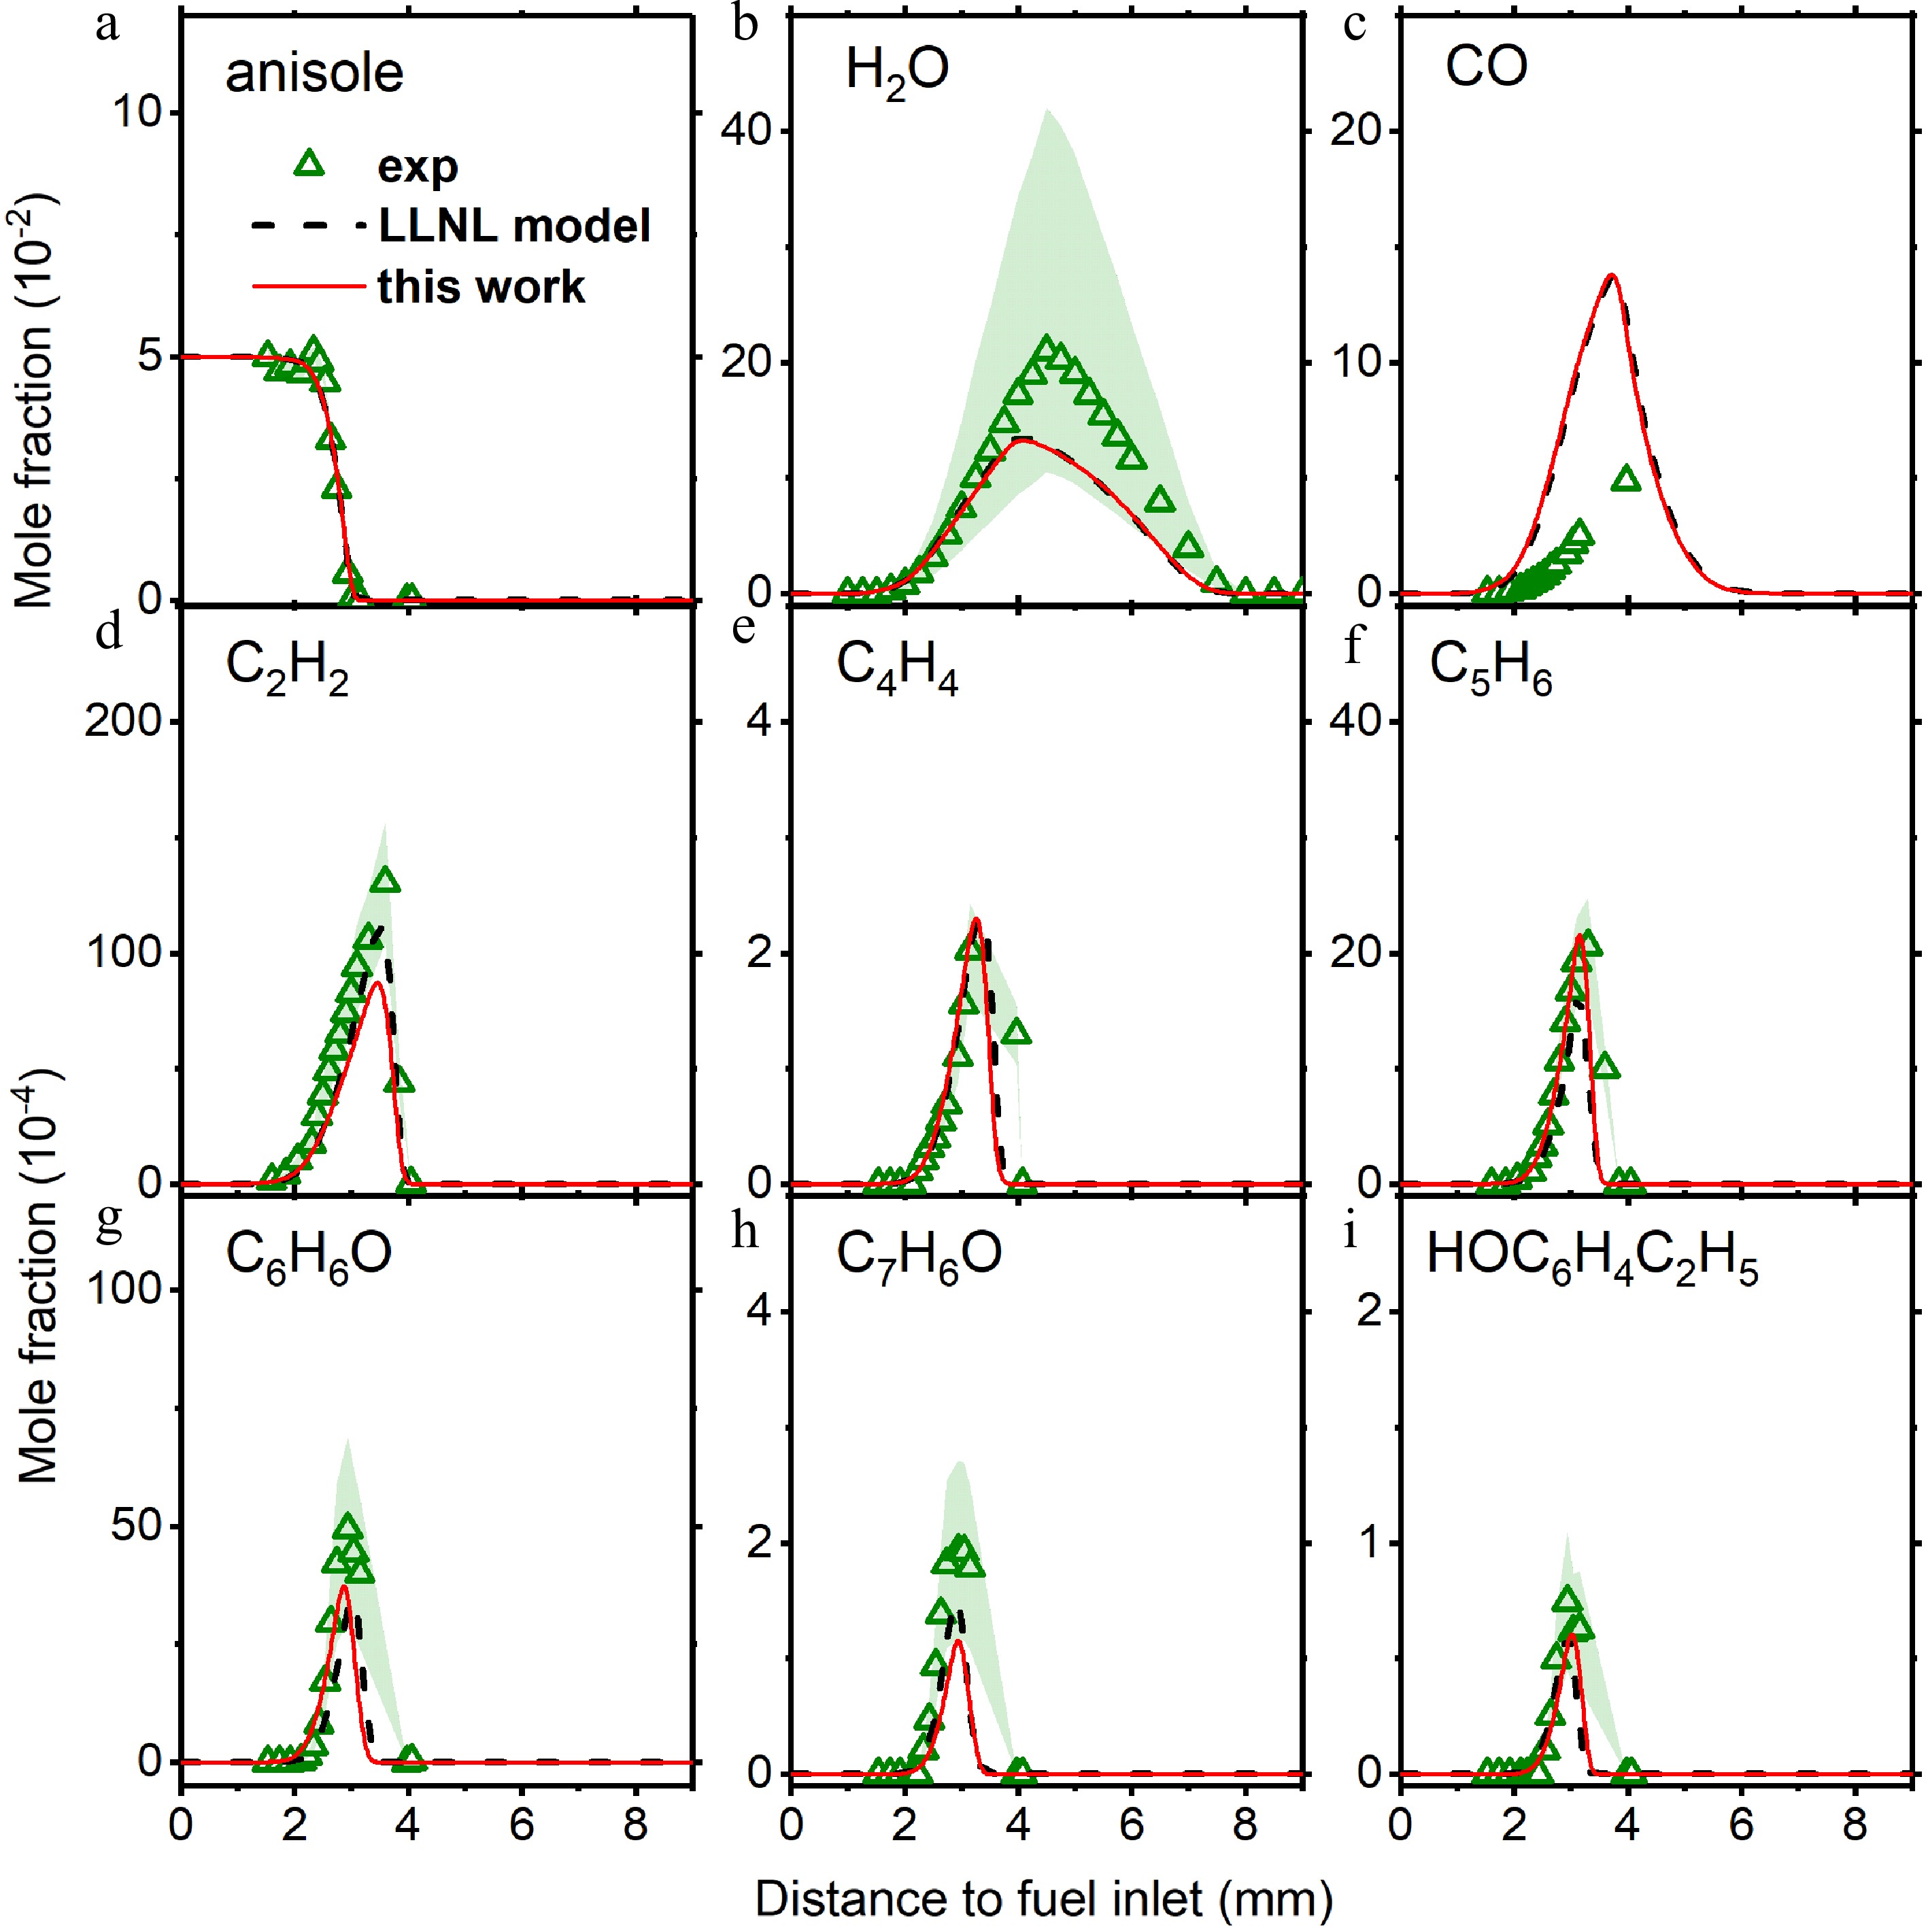
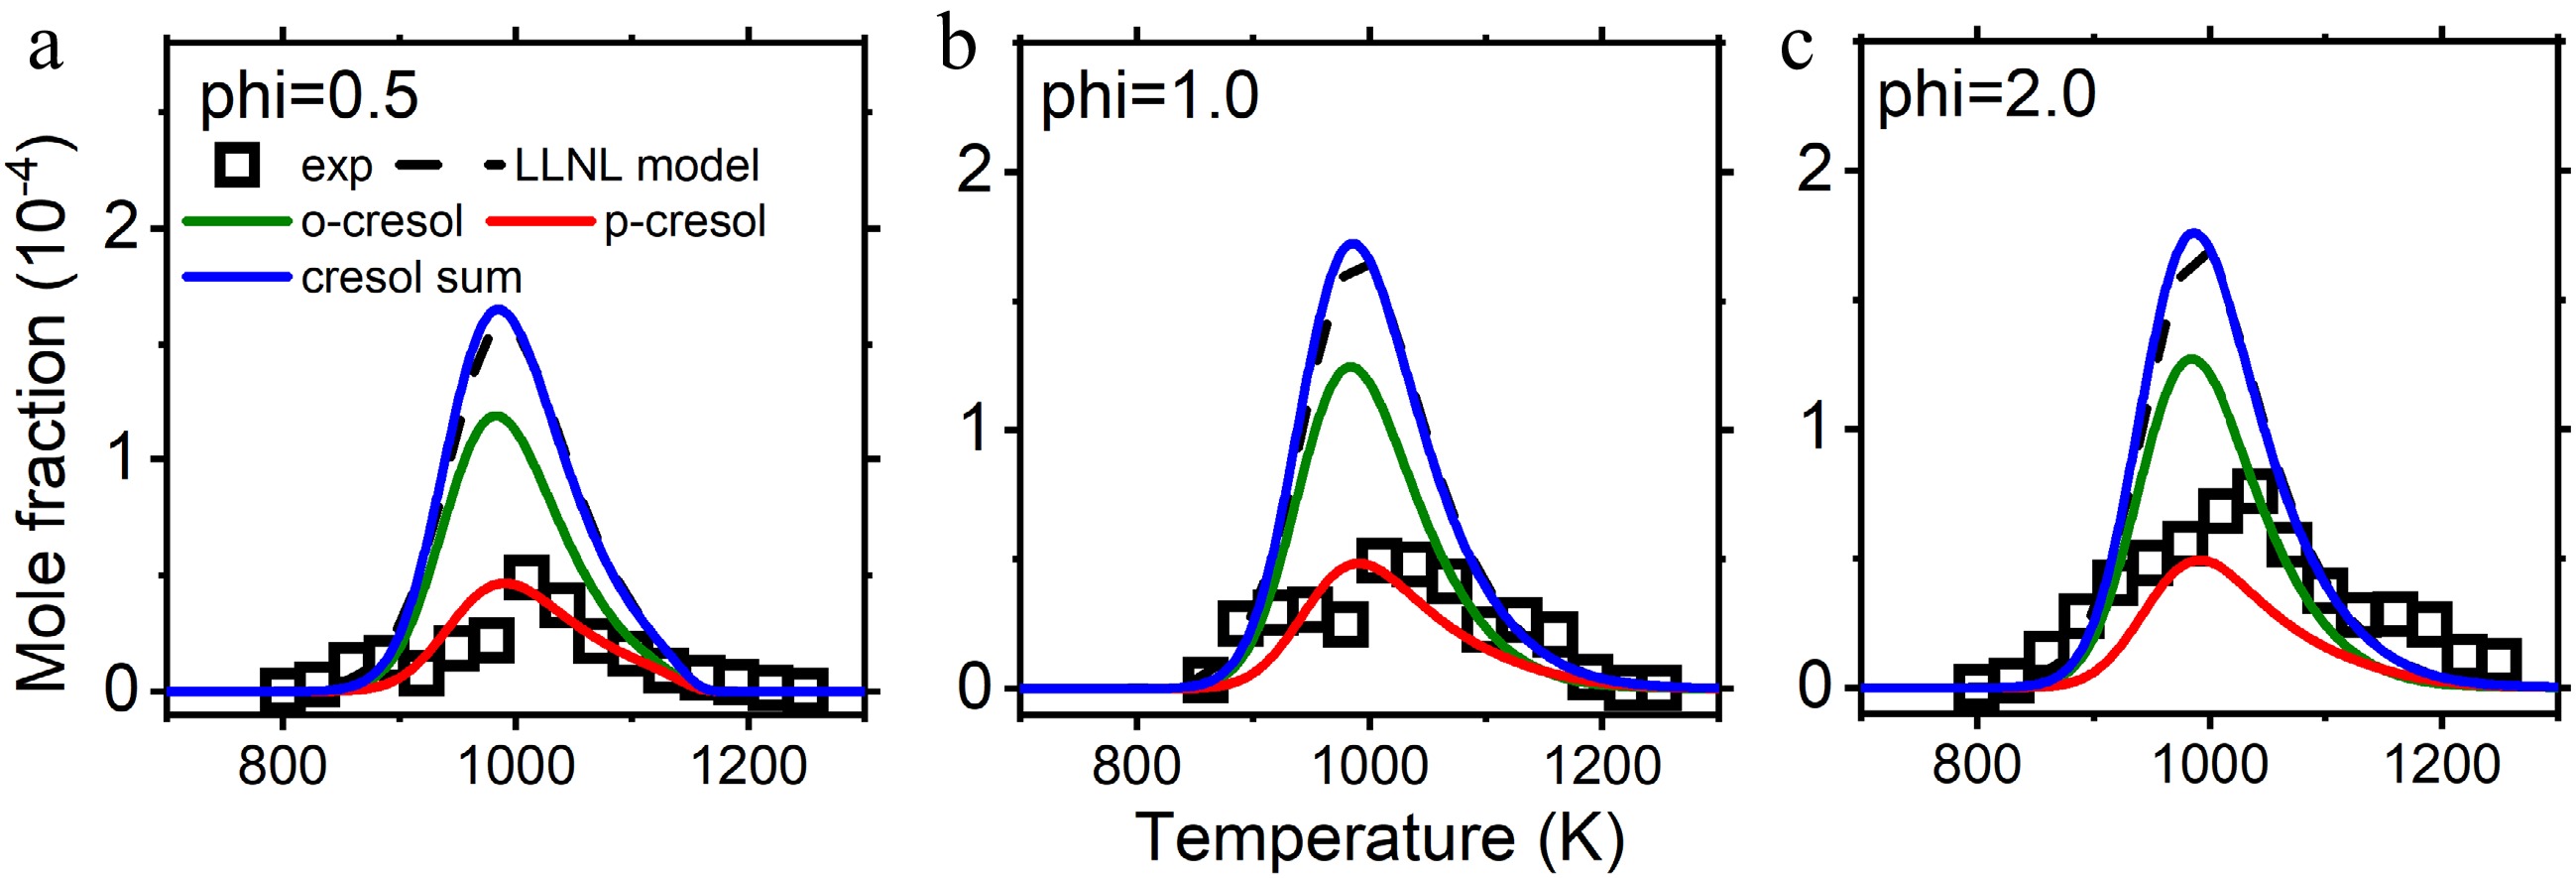
Figure 7.
Mole fraction profiles of reactants, main products, and important intermediate species in anisole counterflow diffusion flame. Experimental data are taken from Chen et al.[28]. The solid lines are simulation using the model with the isomer-specific cresol formation pathways, compare to the dashed lines using the LLNL model[8].
-
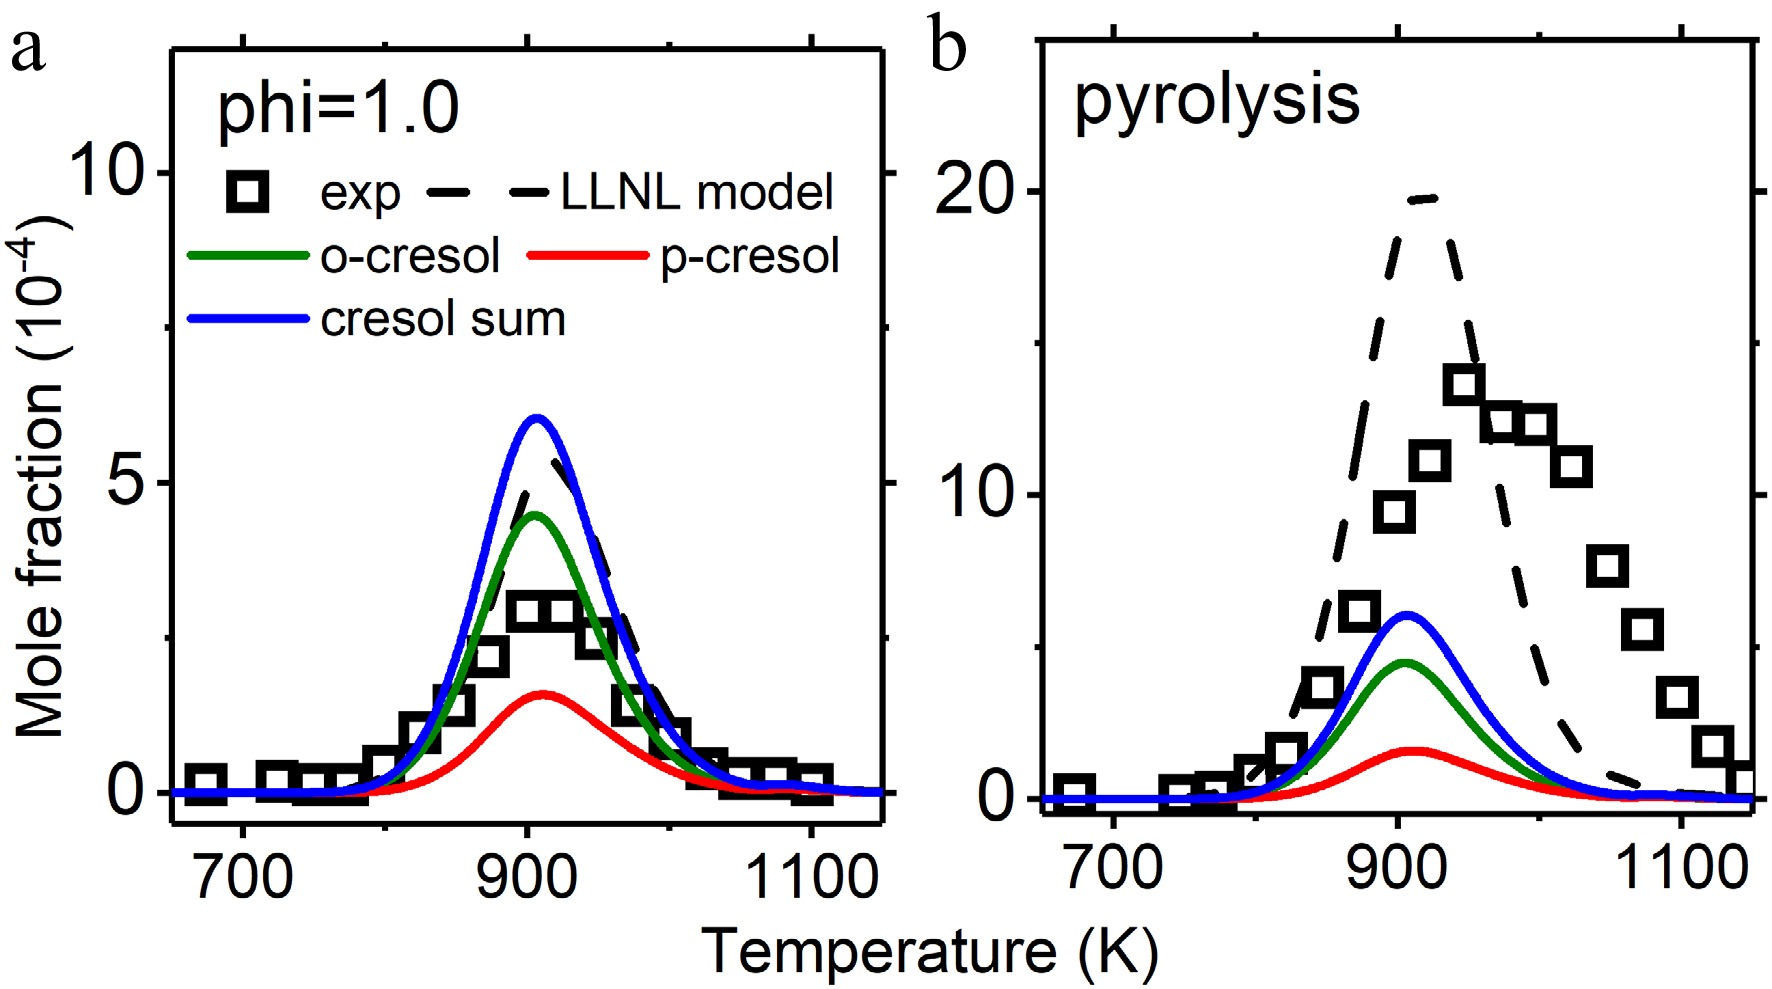
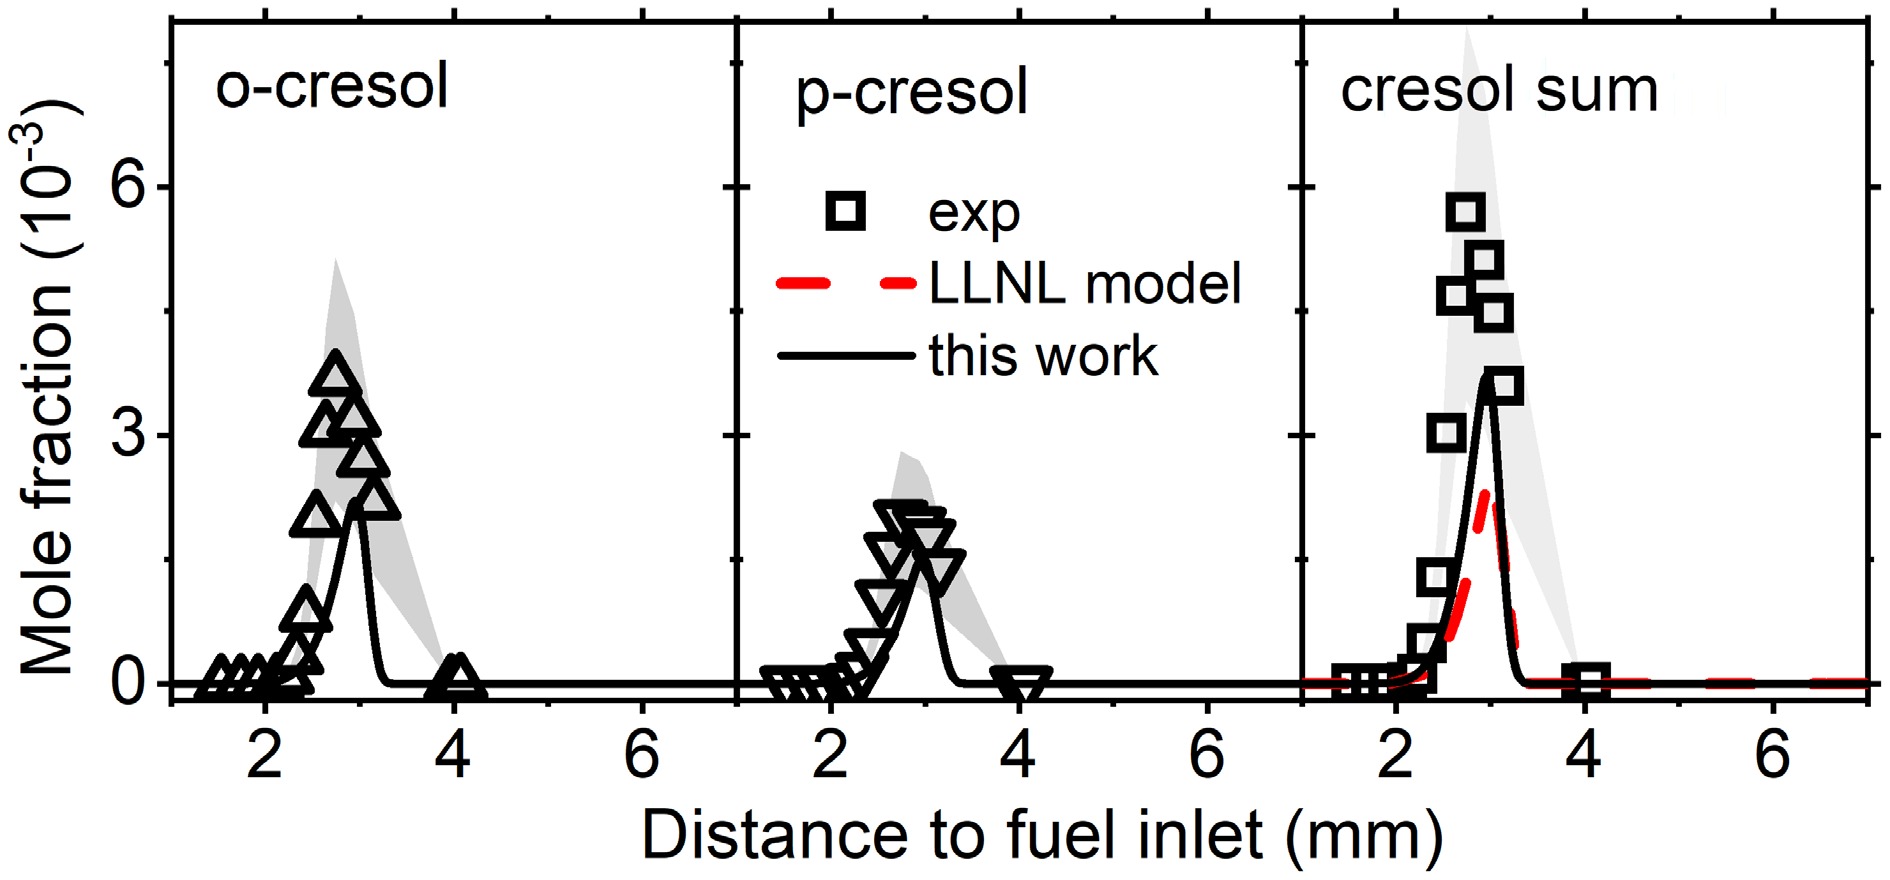
Figure 8.
Mole fraction profiles of cresol in jet stirred reactor oxidation and pyrolysis. Experimental data are taken from Nowakowska et al.[23]. The solid lines are simulations using the model with the isomer-specific cresol formation pathways, compared to the dashed lines using the LLNL model[8].
-
-
Reactions A n E P (atm) CS1 → P14 +CH3 1.21 × 10¹⁹ −1.452 59.48 H-P CS1 + H → P21 (benzene) + OCH3 1.05 × 10⁸ 1.511 4.984 0.1−100 P21 + OCH3 → CS1 + H 1.82 × 10⁻¹ 3.535 15.13 0.1−100 CS1 + CH3 → P24 (toluene) + OCH3 5.22 × 101 2.78 11.58 0.1−100 P24 + OCH3 → CS1 + CH3 2.52 × 10⁻¹ 3.028 4.73 0.1−100 CS1 + H → CS15 + H2 7.75 × 10⁵ 2.313 4.26 H-P CS15 + H2 → CS1 + H 3.06 × 10² 2.926 11.28 H-P CS15 → P19 + CH2O 1.17 × 1056 −11.71 88.18 0.1 CS15 → P19 + CH2O 8.12 × 1033 −5.842 63.38 1 CS15 → P19 + CH2O 5.20 × 1024 −3.479 49.0 10 CS15 → P19 + CH2O 7.64 × 10¹⁸ −2.0 37.3 100 CS15 → P22 + H 1.05 × 10¹⁹ −2.024 40.52 0.1 CS15 → P22 + H 8.73 × 1032 −6.061 45.36 1 CS15 → P22 + H 3.62 × 1028 −4.999 35.82 10 CS15 → P22 + H 1.74 × 10²² −3.268 27.82 100 P14 + CH3→ P4 (through CS2) 1.90 × 1042 −8.572 14.52 H-P P14 + CH3→ P9 (through CS2) 9.81 × 1045 −10.08 21.54 H-P P14 + CH3→ P28 + H (through CS2) 4.75 × 10¹⁶ −1.704 4.56 H-P P14 + CH3→ CS3 (through CS2) 6.99 × 1099 −26.18 31.68 H-P P14 + CH3 → P13 (through CS10) 1.59 × 1053 −11.46 31.62 H-P P14 + CH3 → P7 (through CS10) 2.29 × 1031 −6.054 26.6 H-P P14 + CH3 → P9 (through CS10) 5.17 × 1061 −14.22 42.62 H-P P14 + CH3→ P29 + H (through CS10) 5.99 × 10¹⁵ −1.369 9.83 H-P P14 + CH3 → CS12 (through CS10) 1.98 × 1084 −21.68 28.74 H-P CS23 + CH3 → P4 + H 3.93 × 100 3.193 11.5 0.1−100 P4 + H → CS23 + CH3 4.05 × 10⁸ 1.343 3.52 0.1−100 CS23 + CH3 → P13 + H 1.00 × 101 3.092 13.93 0.1-100 P13 + H → CS23 + CH3 7.48 × 10⁷ 1.357 3.69 0.1−100 CS23 + CH3 → P9 + H 2.78 × 101 2.964 13.05 0.1−100 P9 + H → CS23 + CH3 3.19 × 10⁸ 1.271 4.33 0.1−100 CS8 → P31 +H 5.78 × 10¹⁴ −1.026 53.50 H-P CS32→ P31 + H 2.01 × 10¹⁶ −0.937 45.34 H-P Table 1.
Reaction rate coefficients in the form of k = A·Tn·exp(−E/RT). The units are s−1 (k), cm3·mol−1·s−1 for bimolecular reactions and s−1 for unimolecular reactions (A) and kcal·mol−1 (E).
-
Species Formula H (298K)
(kcal·mol−1)S (298K)
(cal·K−1·mol−1)Cp
(cal·K−1·mol−1)298 K 1,000 K 2,500 K CS3 C7H8O −13.15 86.64 30.46 68.84 85.99 CS12 C7H8O −12.22 84.74 29.24 66.46 86.81 CS5 C7H8O 31.66 84.07 31.15 69.51 86.13 CS2 C7H8O −9.88 84.71 29.85 68.74 85.94 CS10 C7H8O −11.20 82.89 29.98 68.80 85.98 P4 C7H8O −29.94 82.56 30.67 68.83 85.81 P9 C7H8O −29.63 83.21 30.69 68.84 85.81 P13 C7H8O −29.13 84.83 30.82 68.85 85.81 P28 C7H7O 2.43 82.50 29.18 65.28 81.98 P29 C7H7O 3.46 84.59 29.24 65.27 80.60 Table 2.
Thermochemistry data of new species.
Figures
(9)
Tables
(2)