-
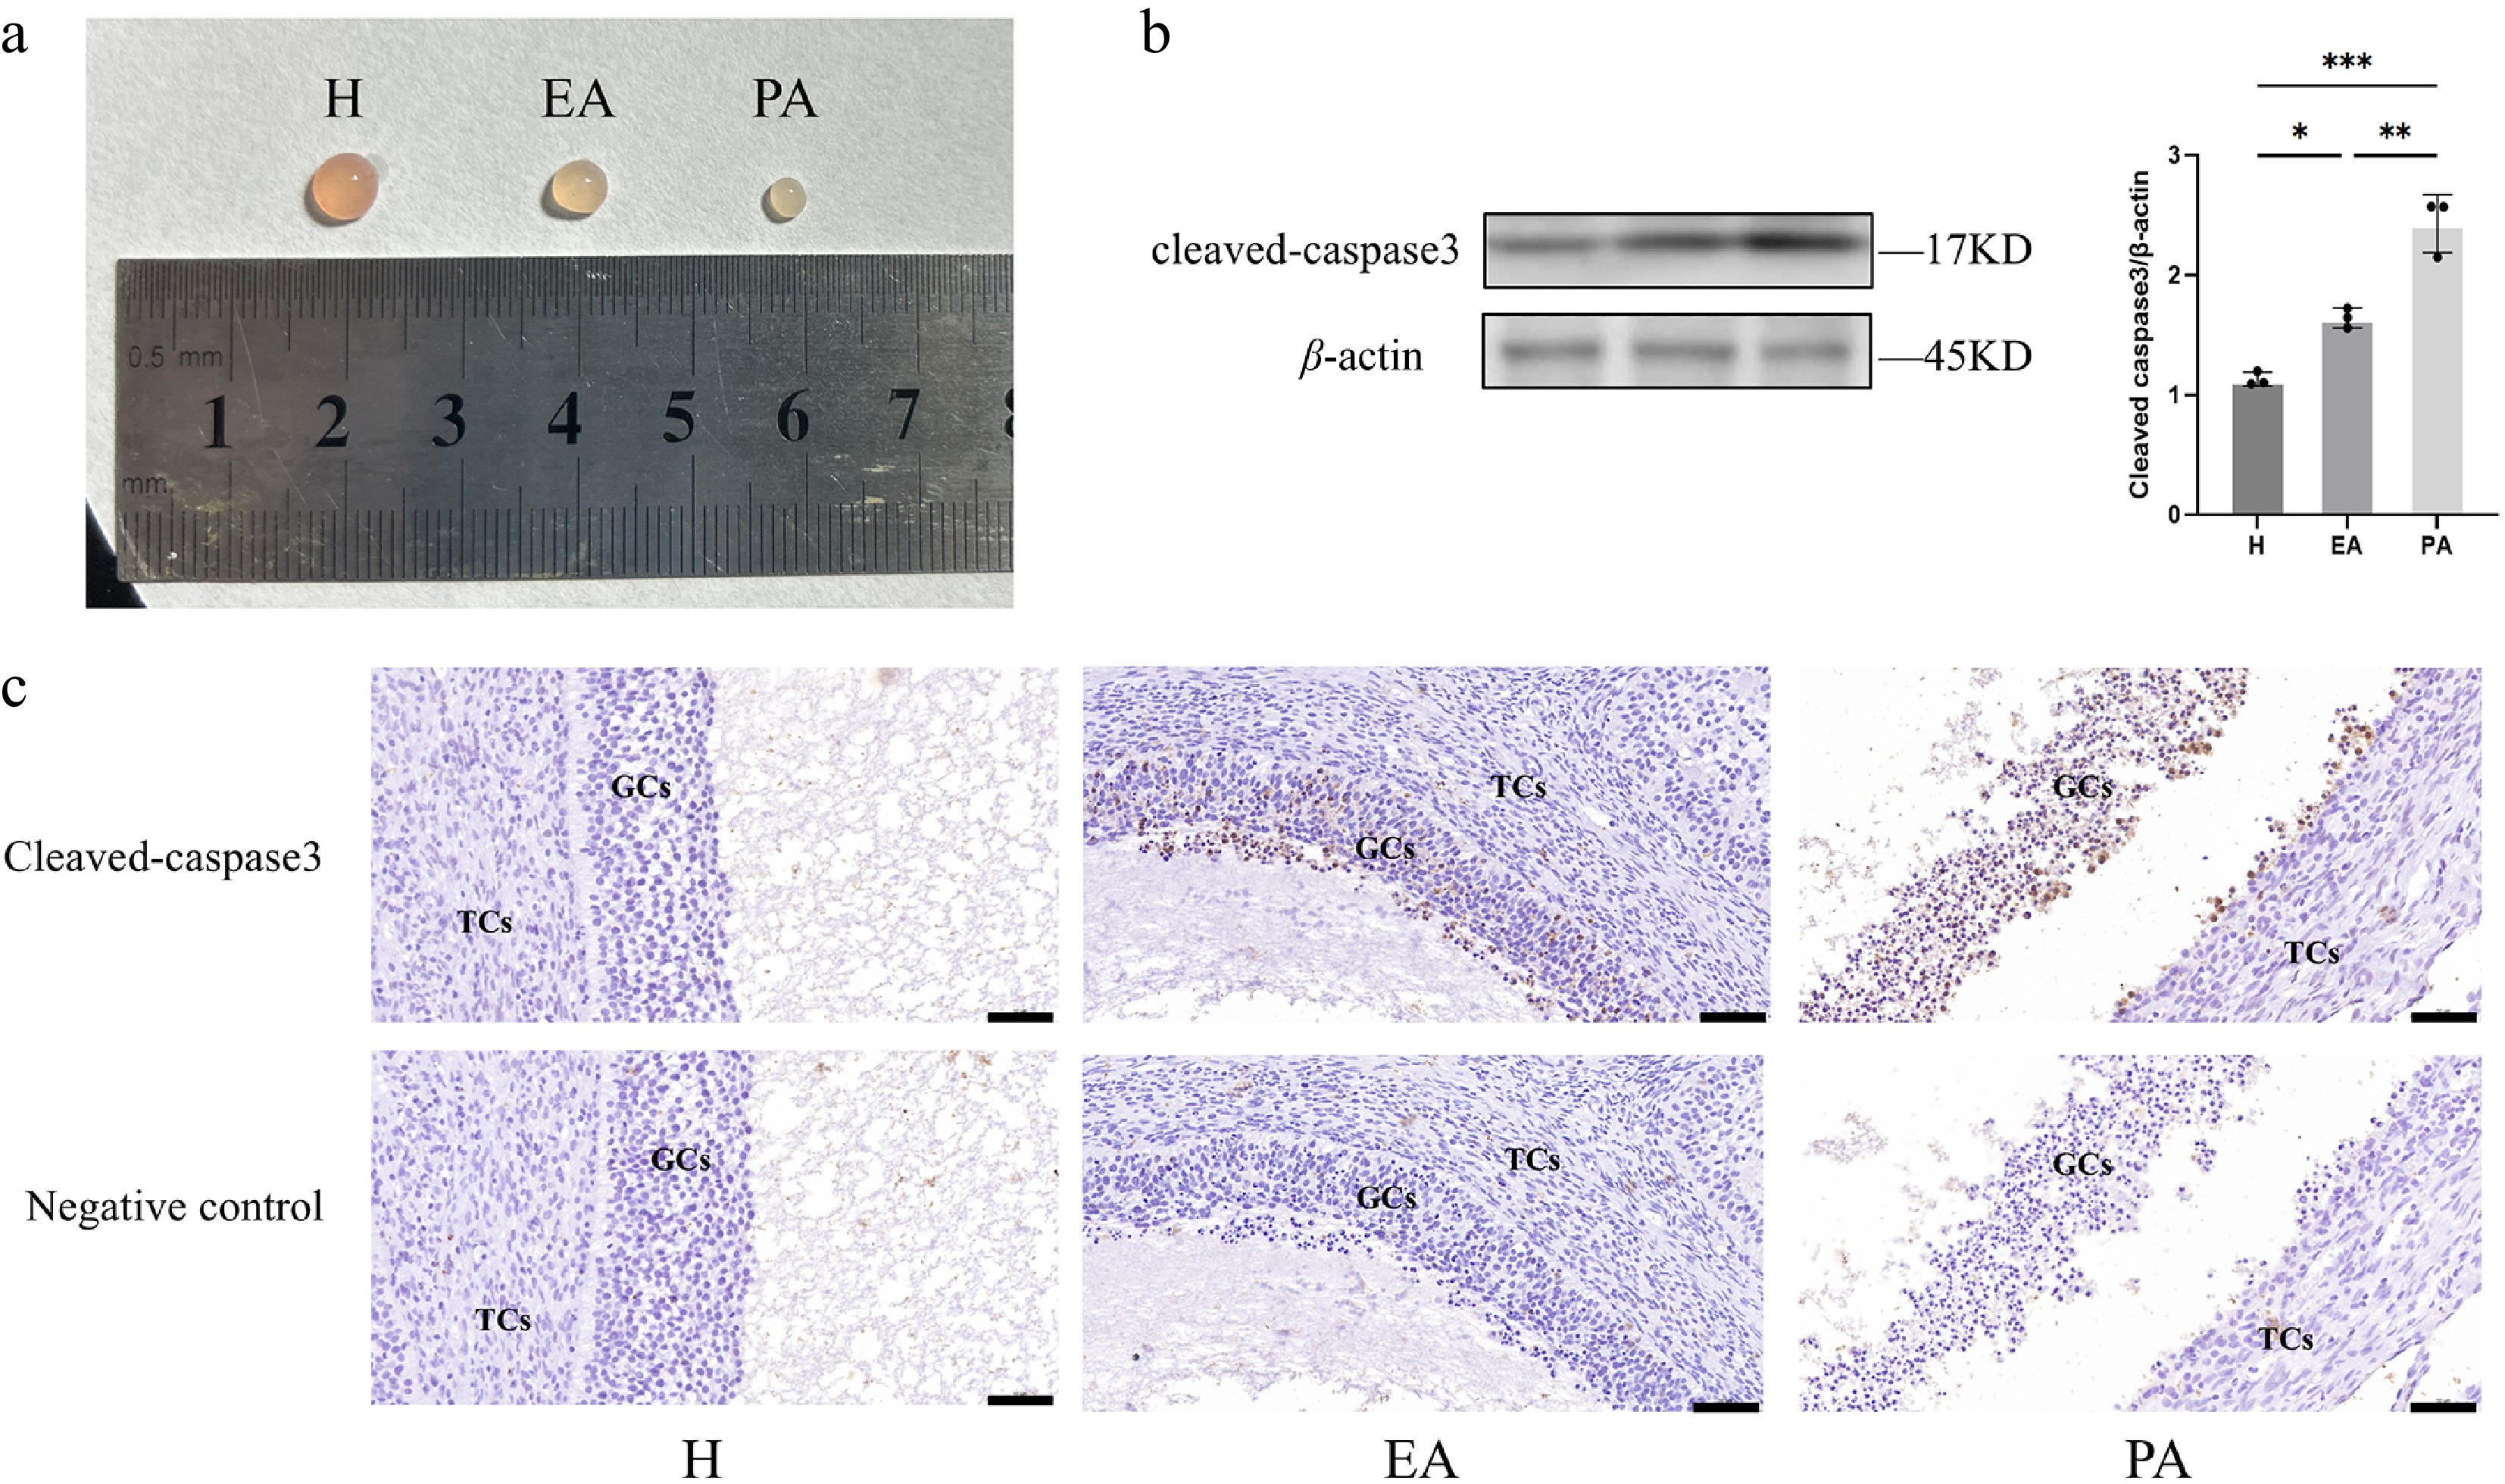
Figure 1.
Follicular morphometric classification and dynamics of GC apoptosis in porcine ovarian follicles. (a) Morphological characteristics distinguishing different types of follicles. (b) Western blot quantification of Cleaved Caspase-3 expression in GC populations. (c) Immunohistochemical staining of Cleaved Caspase-3 in paraffin-embedded follicular sections. H, healthy follicles; EA, early atretic follicles; PA, progressively atretic follicles. Data are represented as the mean ± SEM. Scale bar, 50 μm. *p < 0.05, **p < 0.01, ***p < 0.001.
-
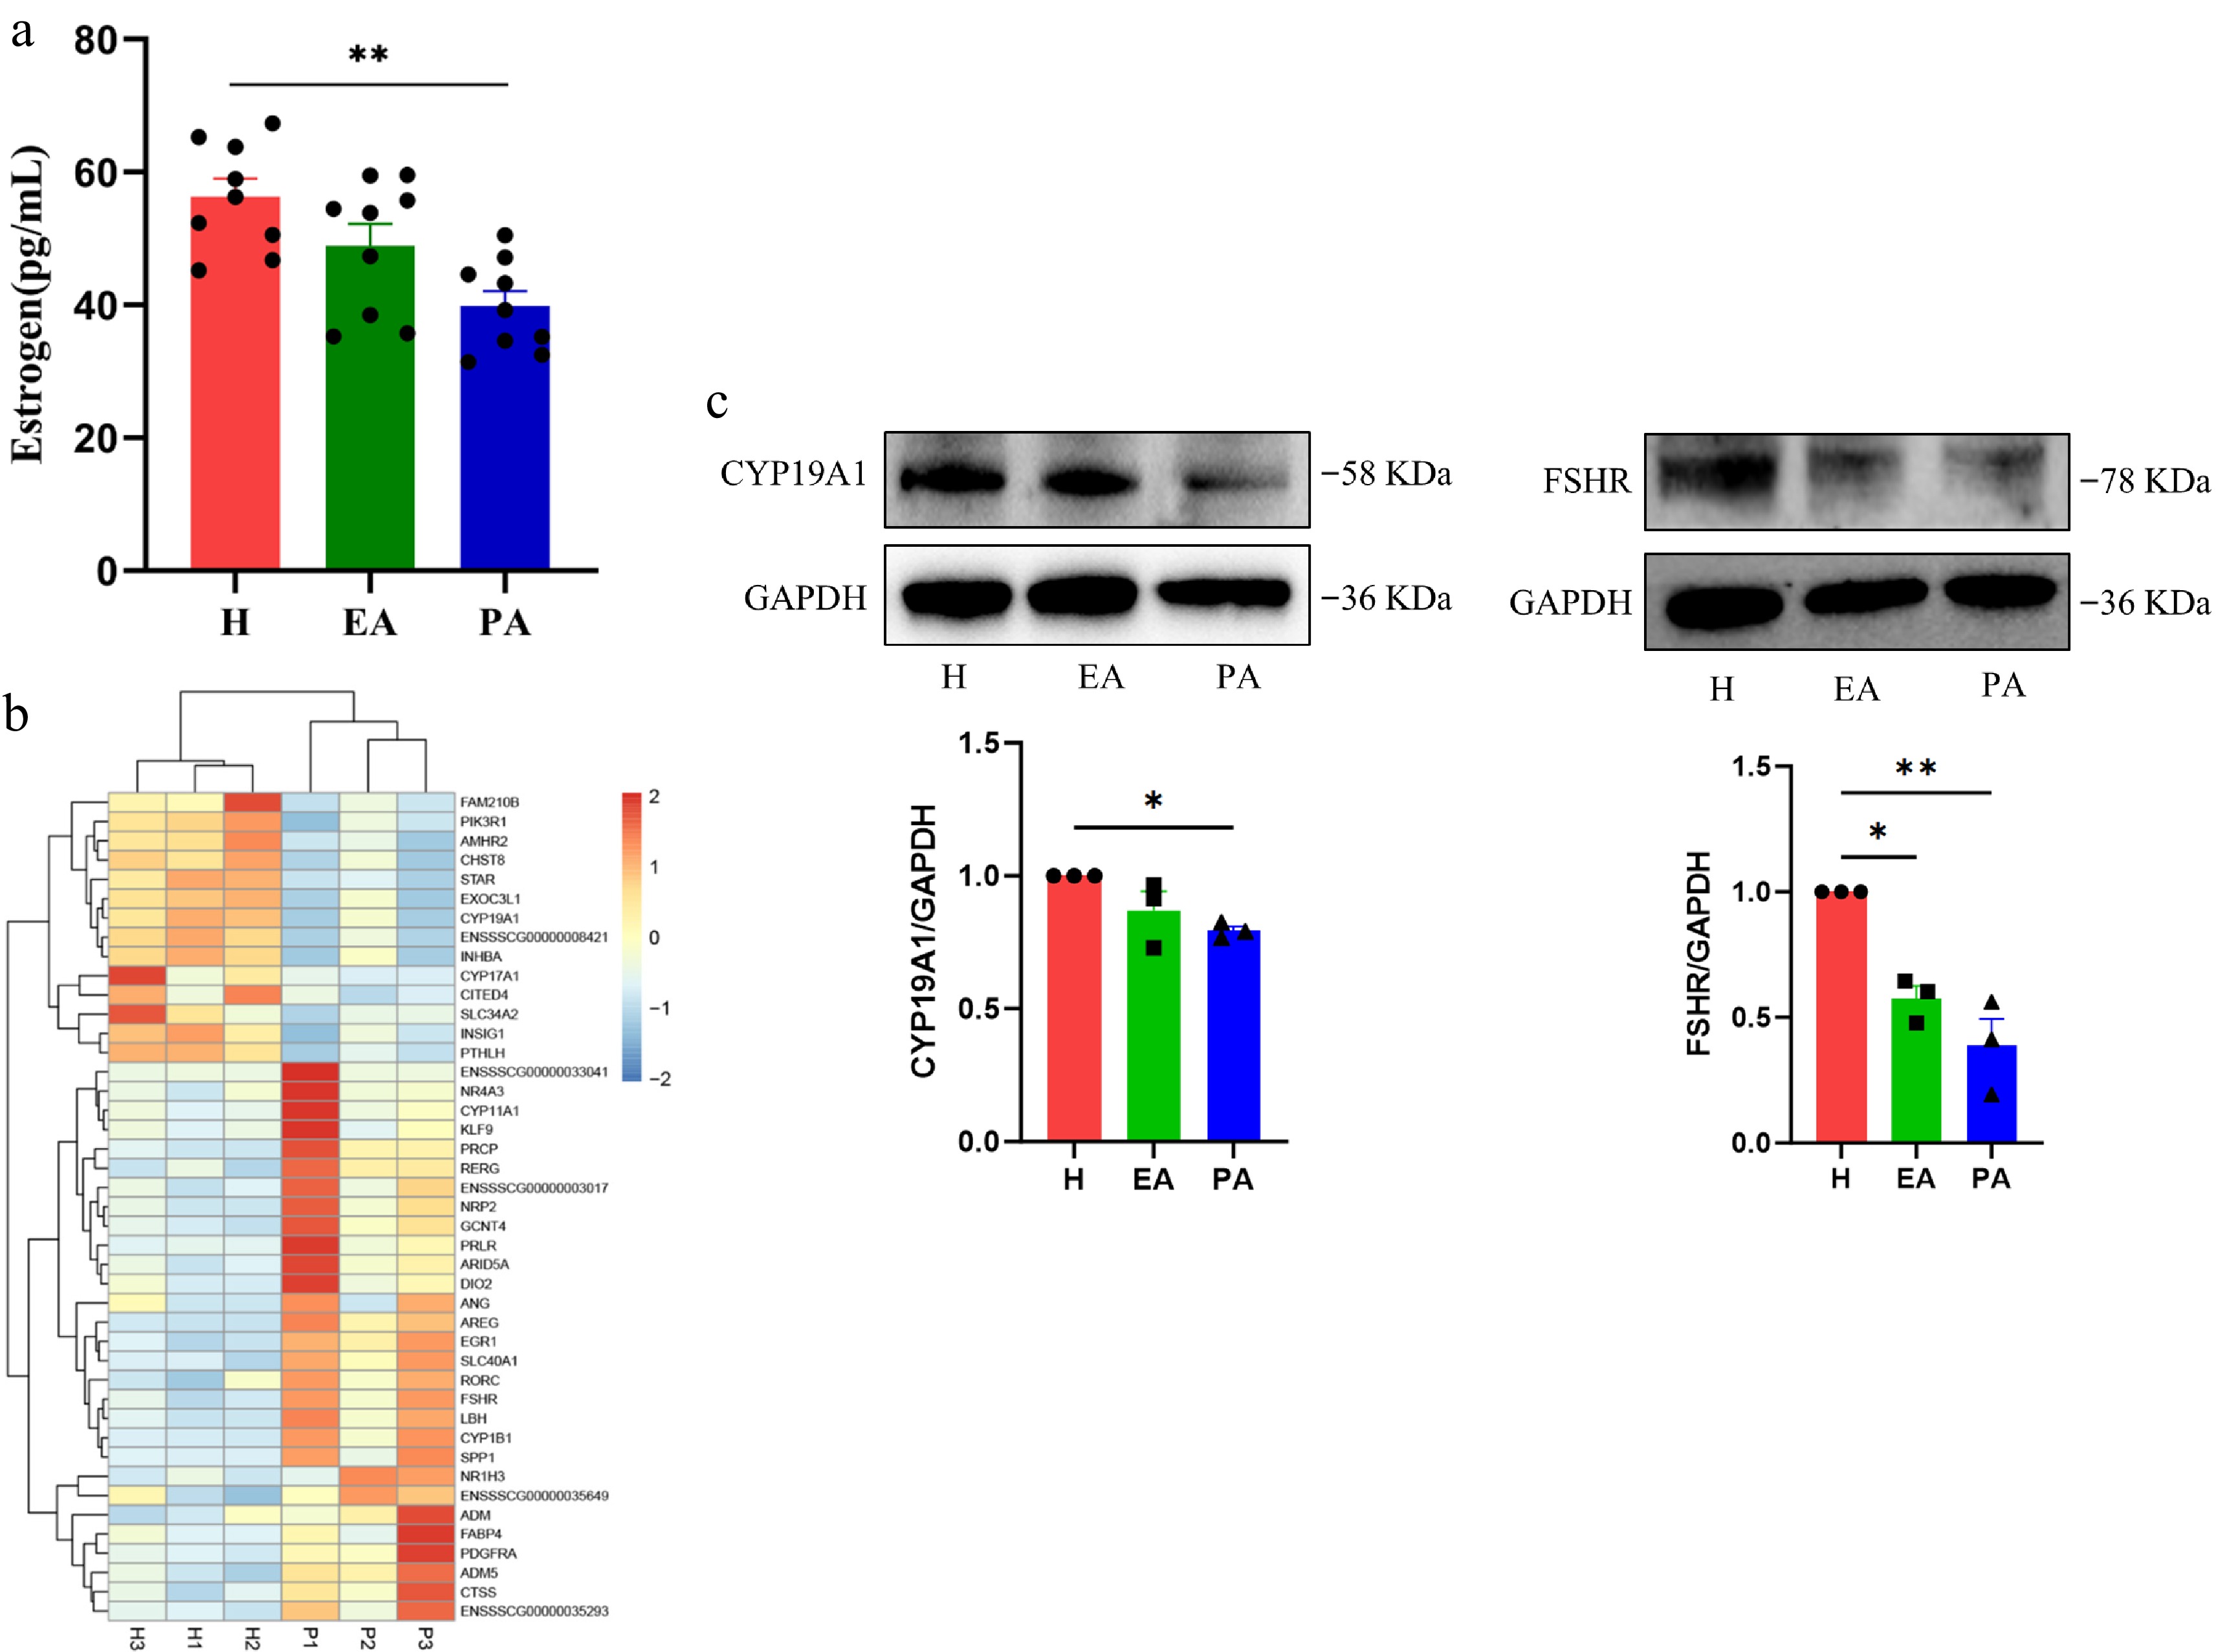
Figure 2.
Estrogen secretion levels in different types of follicles and the expression of hormone secretion-related genes and proteins in granulosa cells. (a) ELISA for estrogen in the follicular fluid of H, EA, and PA. (b) Heatmap of hormone secretion-related genes in granulosa cells of H and PA. Blue, downregulated genes; red, upregulated genes. (c) Western blotting analysis of hormone secretion-related proteins in granulosa cells from H, EA, and PA. H, healthy follicles; EA, early atretic follicles; PA, progressively atretic follicles. Data are represented as the mean ± SEM. * p < 0.05, ** p < 0.01.
-
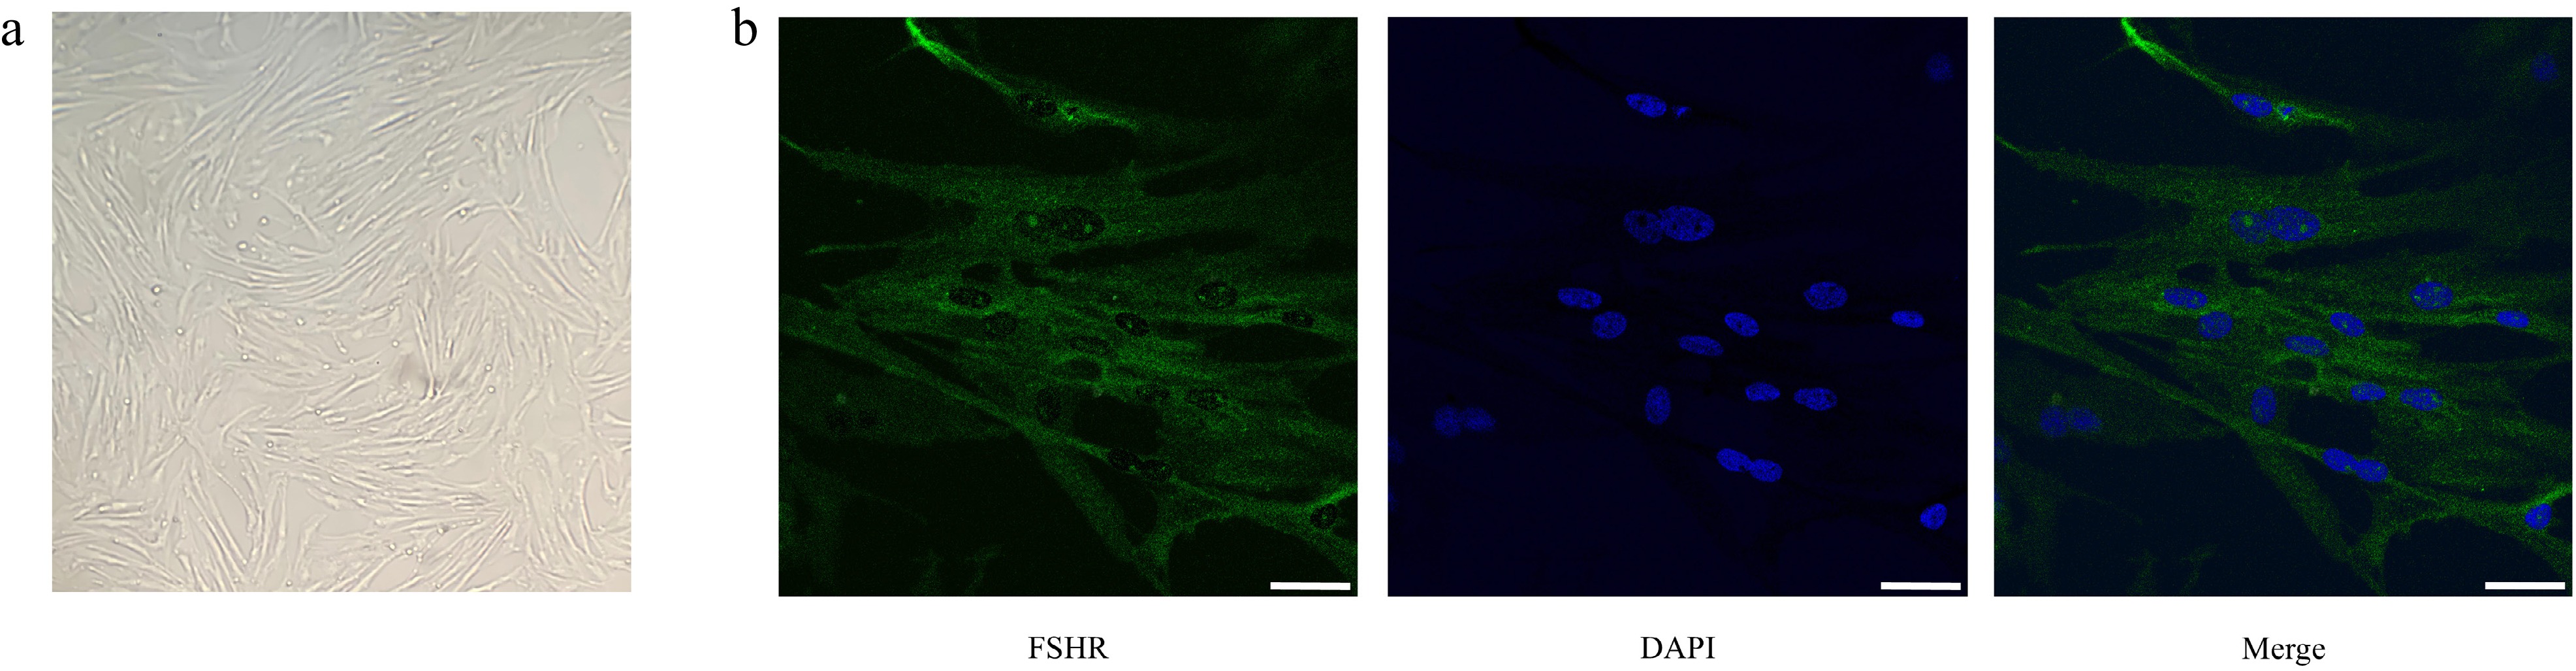
Figure 3.
Morphological observation and purity identification of porcine follicular granulosa cells. (a) Observation of granulosa cells' morphology by inverted microscopy. (b) Immunofluorescence staining of FSHR. From left to right: FSHR fluorescence staining (green); nuclear DAPI staining (blue); merged image. Scale bar, 20 μm.
-
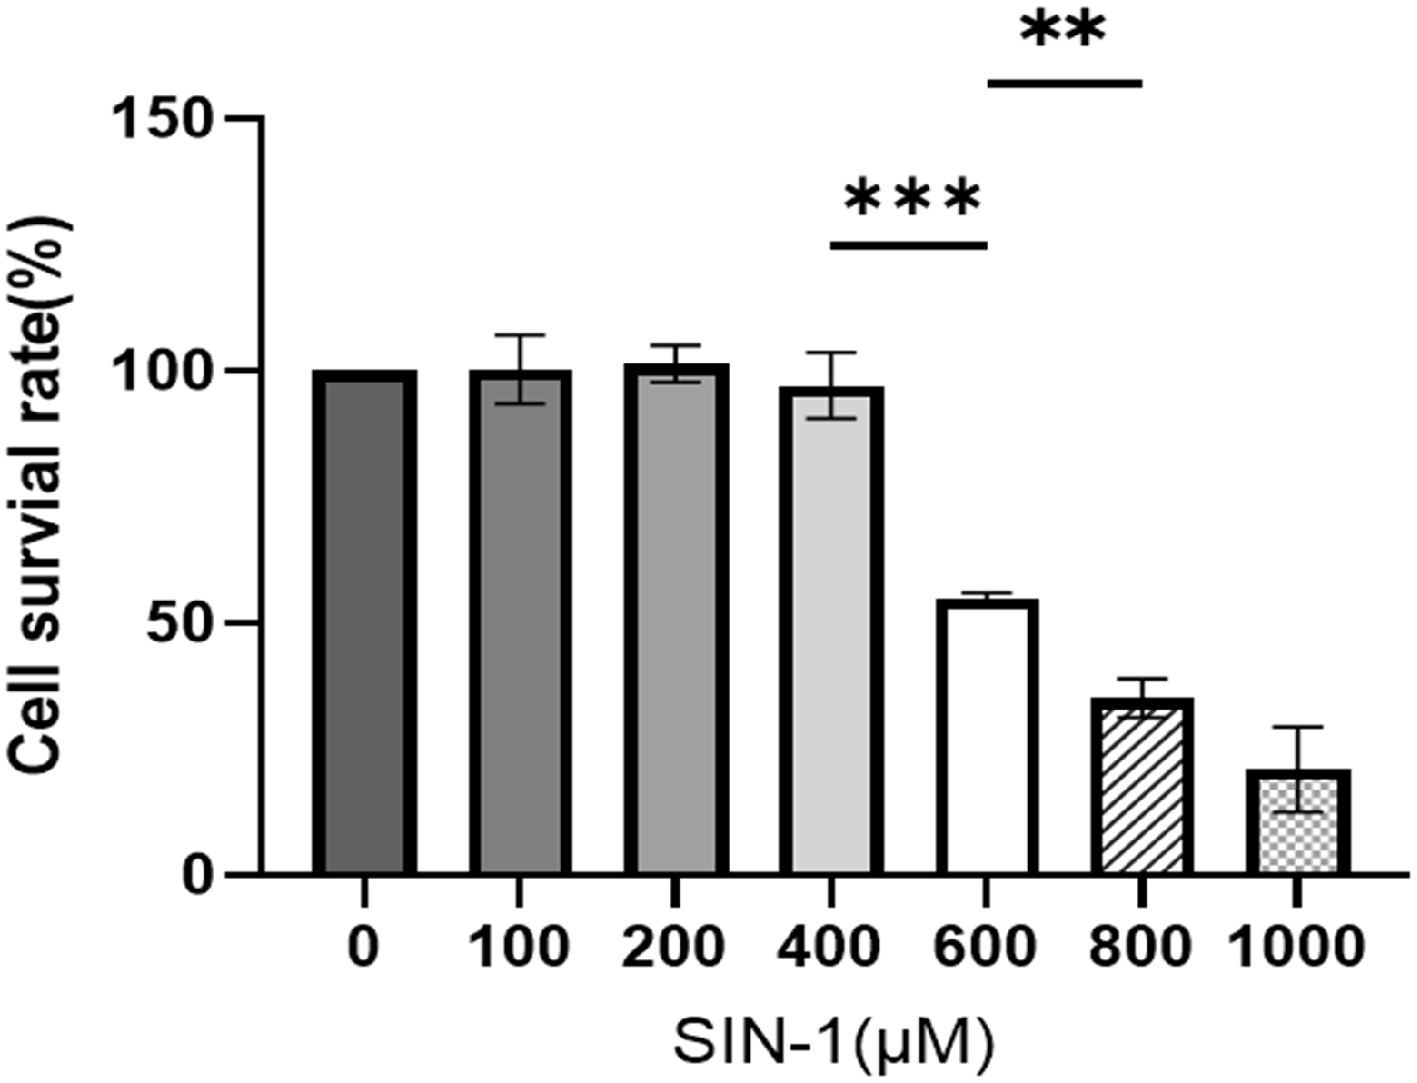
Figure 4.
Cell survival rate of SIN-1-treated granulosa cells. Viability assessment via a CCK-8 assay following 24 h of exposure to SIN-1. Data are presented as the mean ± SEM. ** p < 0.01, *** p < 0.001.
-
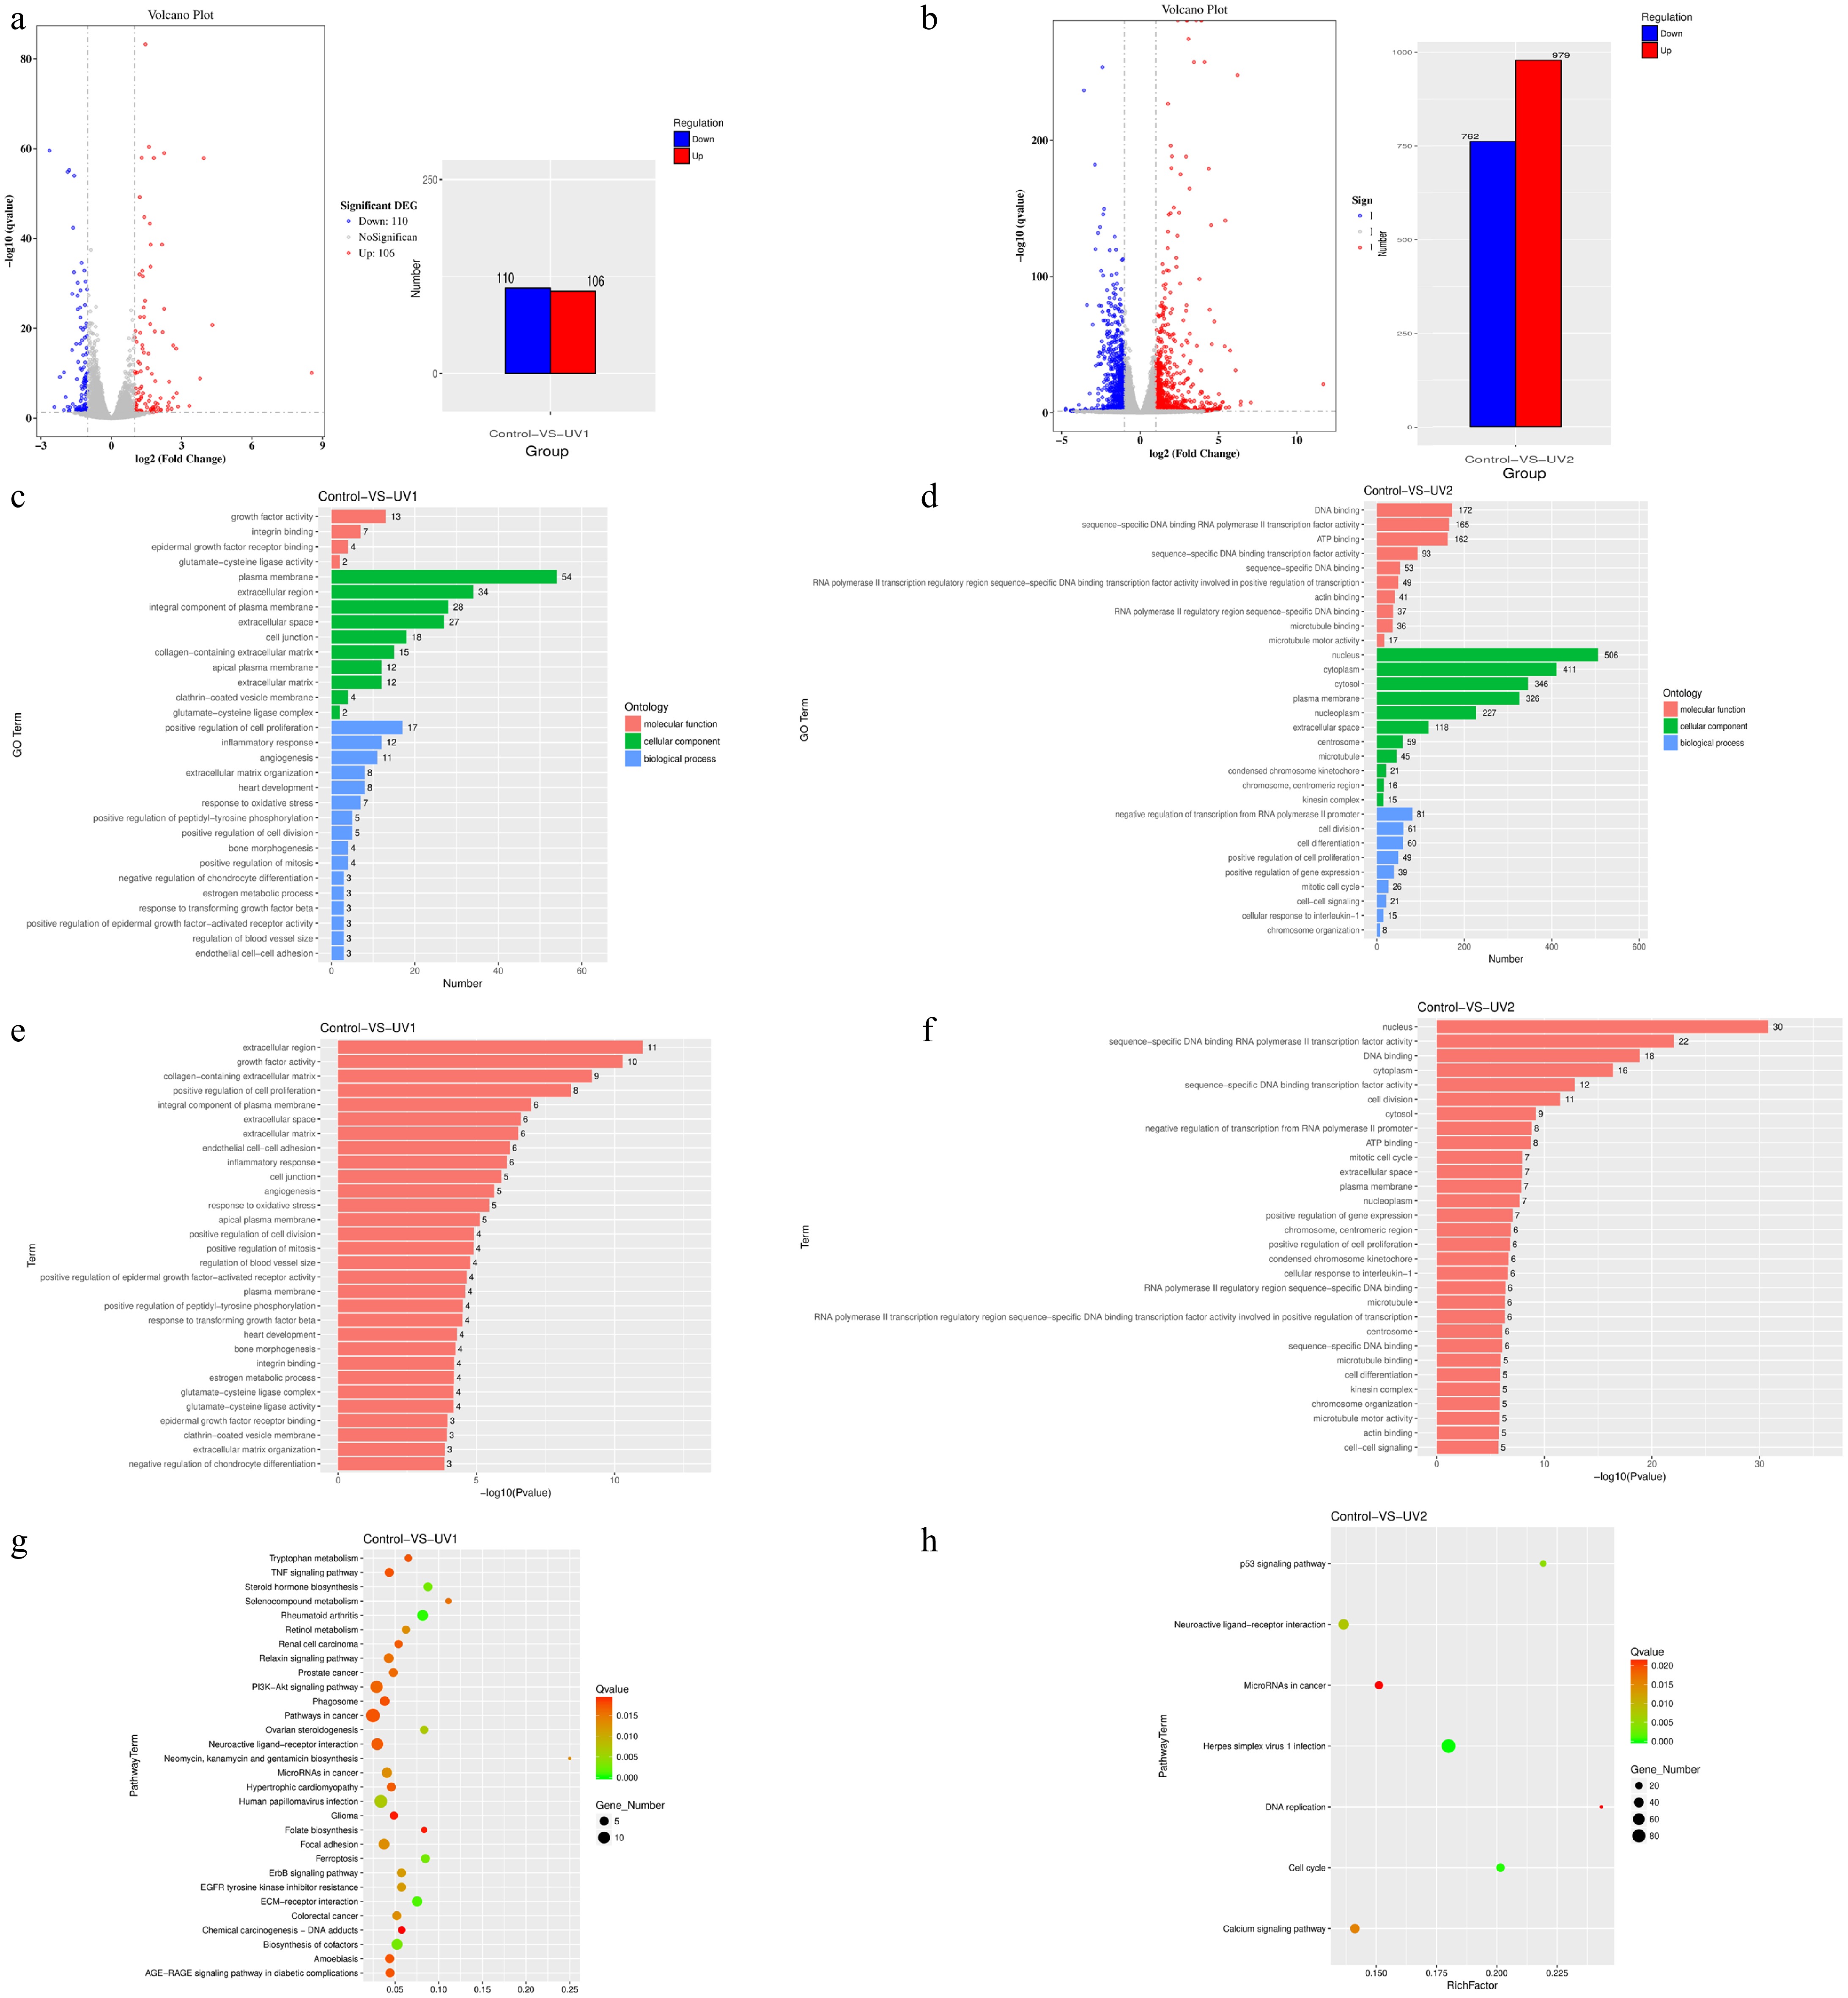
Figure 5.
Number of differentially expressed genes, and GO enrichment and KEGG enrichment of differentially expressed genes in each group after SIN-1 treatment. (a) Volcano plot and bar graph of the DEGs of the 400 μM SIN-1-treated and control groups. The bar graph shows that of all 216 DEGs, 110 of them were downregulated and 106 were upregulated. (b) Volcano plot and bar graph of the DEGs of the 800 μM SIN-1-treated and control groups. The bar graph shows that of all 1741 DEGs, 762 of them were downregulated and 979 were upregulated. For the visualization of the DEGs in the volcano plots. The horizontal coordinate is the fold change in expression in the control and SIN-1-treated groups, and the vertical coordinate is the statistical significance of the change in expression. Different colors indicate different classifications: blue (downregulation), red (upregulation), and gray (no significant difference). (c, d) GO enrichment analysis of DEGs in the control, 400 μM SIN-1-treated, and 800 μM SIN-1-treated groups. The vertical coordinate is the enriched GO term, and the horizontal coordinate is the number of DEGs in that term. Different colors are used to distinguish different enriched terms: blue (biological processes), green (cellular components), and red (molecular functions). (e, f) Statistical significance profiles of GO terms. The vertical coordinate is the enriched GO term and the horizontal coordinate is the p-value. (g, h) KEGG enrichment analysis of DEGs in the control, 400 μM SIN-1-treated, and 800 μM SIN-1-treated groups. The vertical coordinate indicates the name of the pathway, the horizontal coordinate indicates the enrichment factor, the dot size correlates with the quantity of DEGs, the color gradient indicates the q-value significance. Control, 0 μM SIN-1-treated group; UV1, 400 μM SIN-1-treated group; UV2, 800 μM SIN-1-treated group.
-
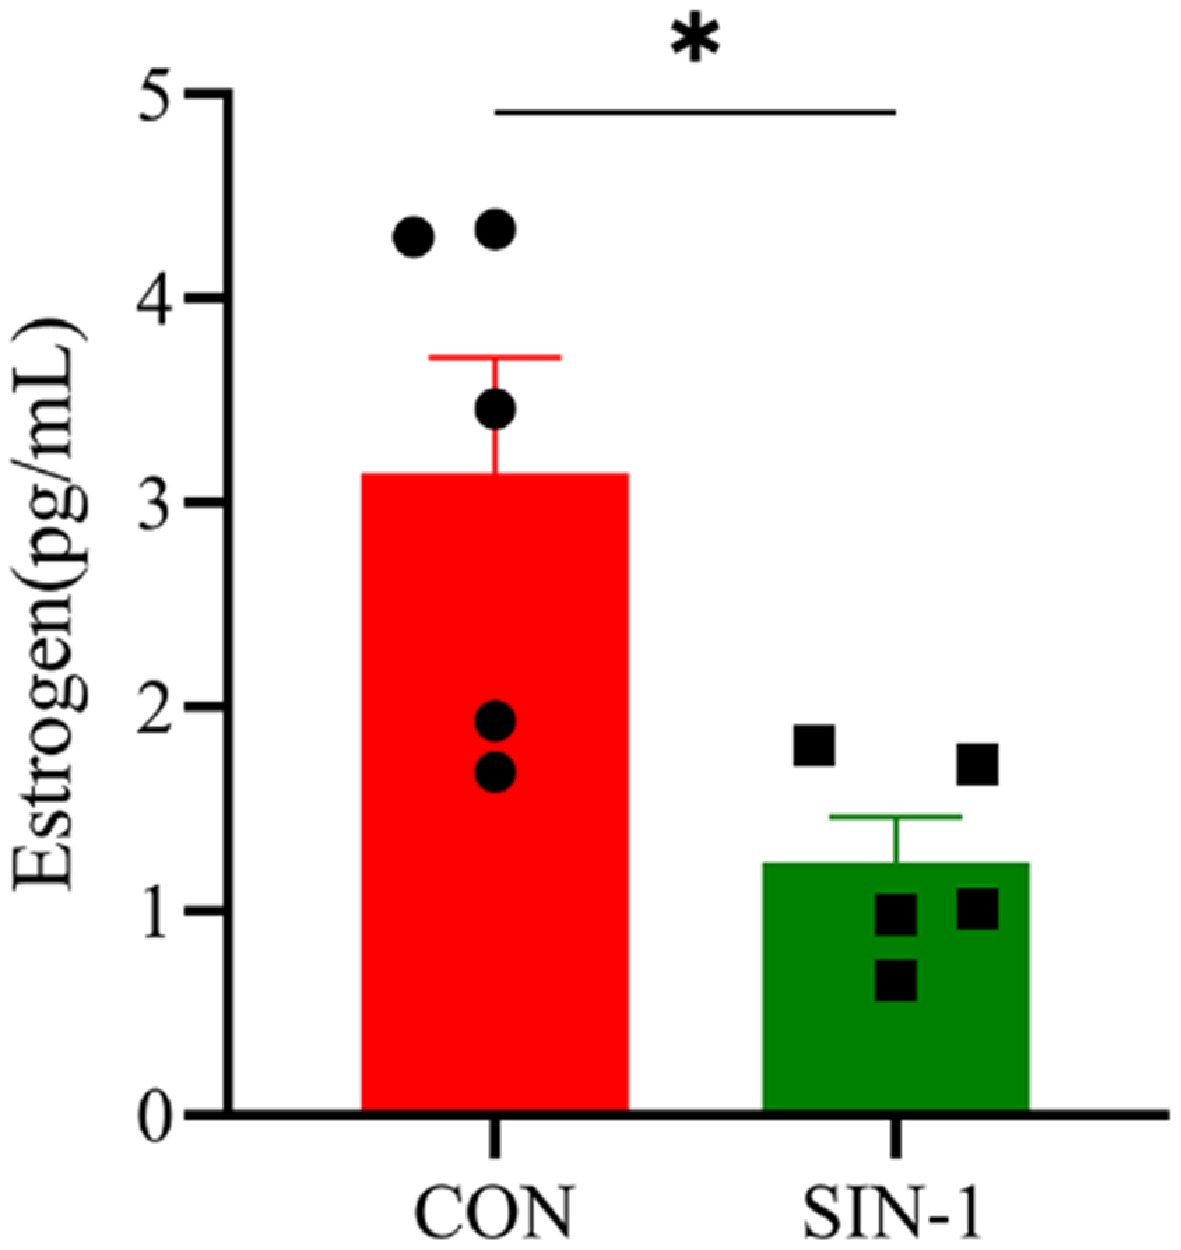
Figure 6.
Hormone secretion levels in SIN-1-treated granulosa cells. Estrogen levels in the cell supernatants tested with an ELISA kit. CON, 0 μM SIN-1-treated group; SIN-1, 400 μM SIN-1 treatment group. Data are presented as the mean ± SEM. * p < 0.05, ** p < 0.01.
-
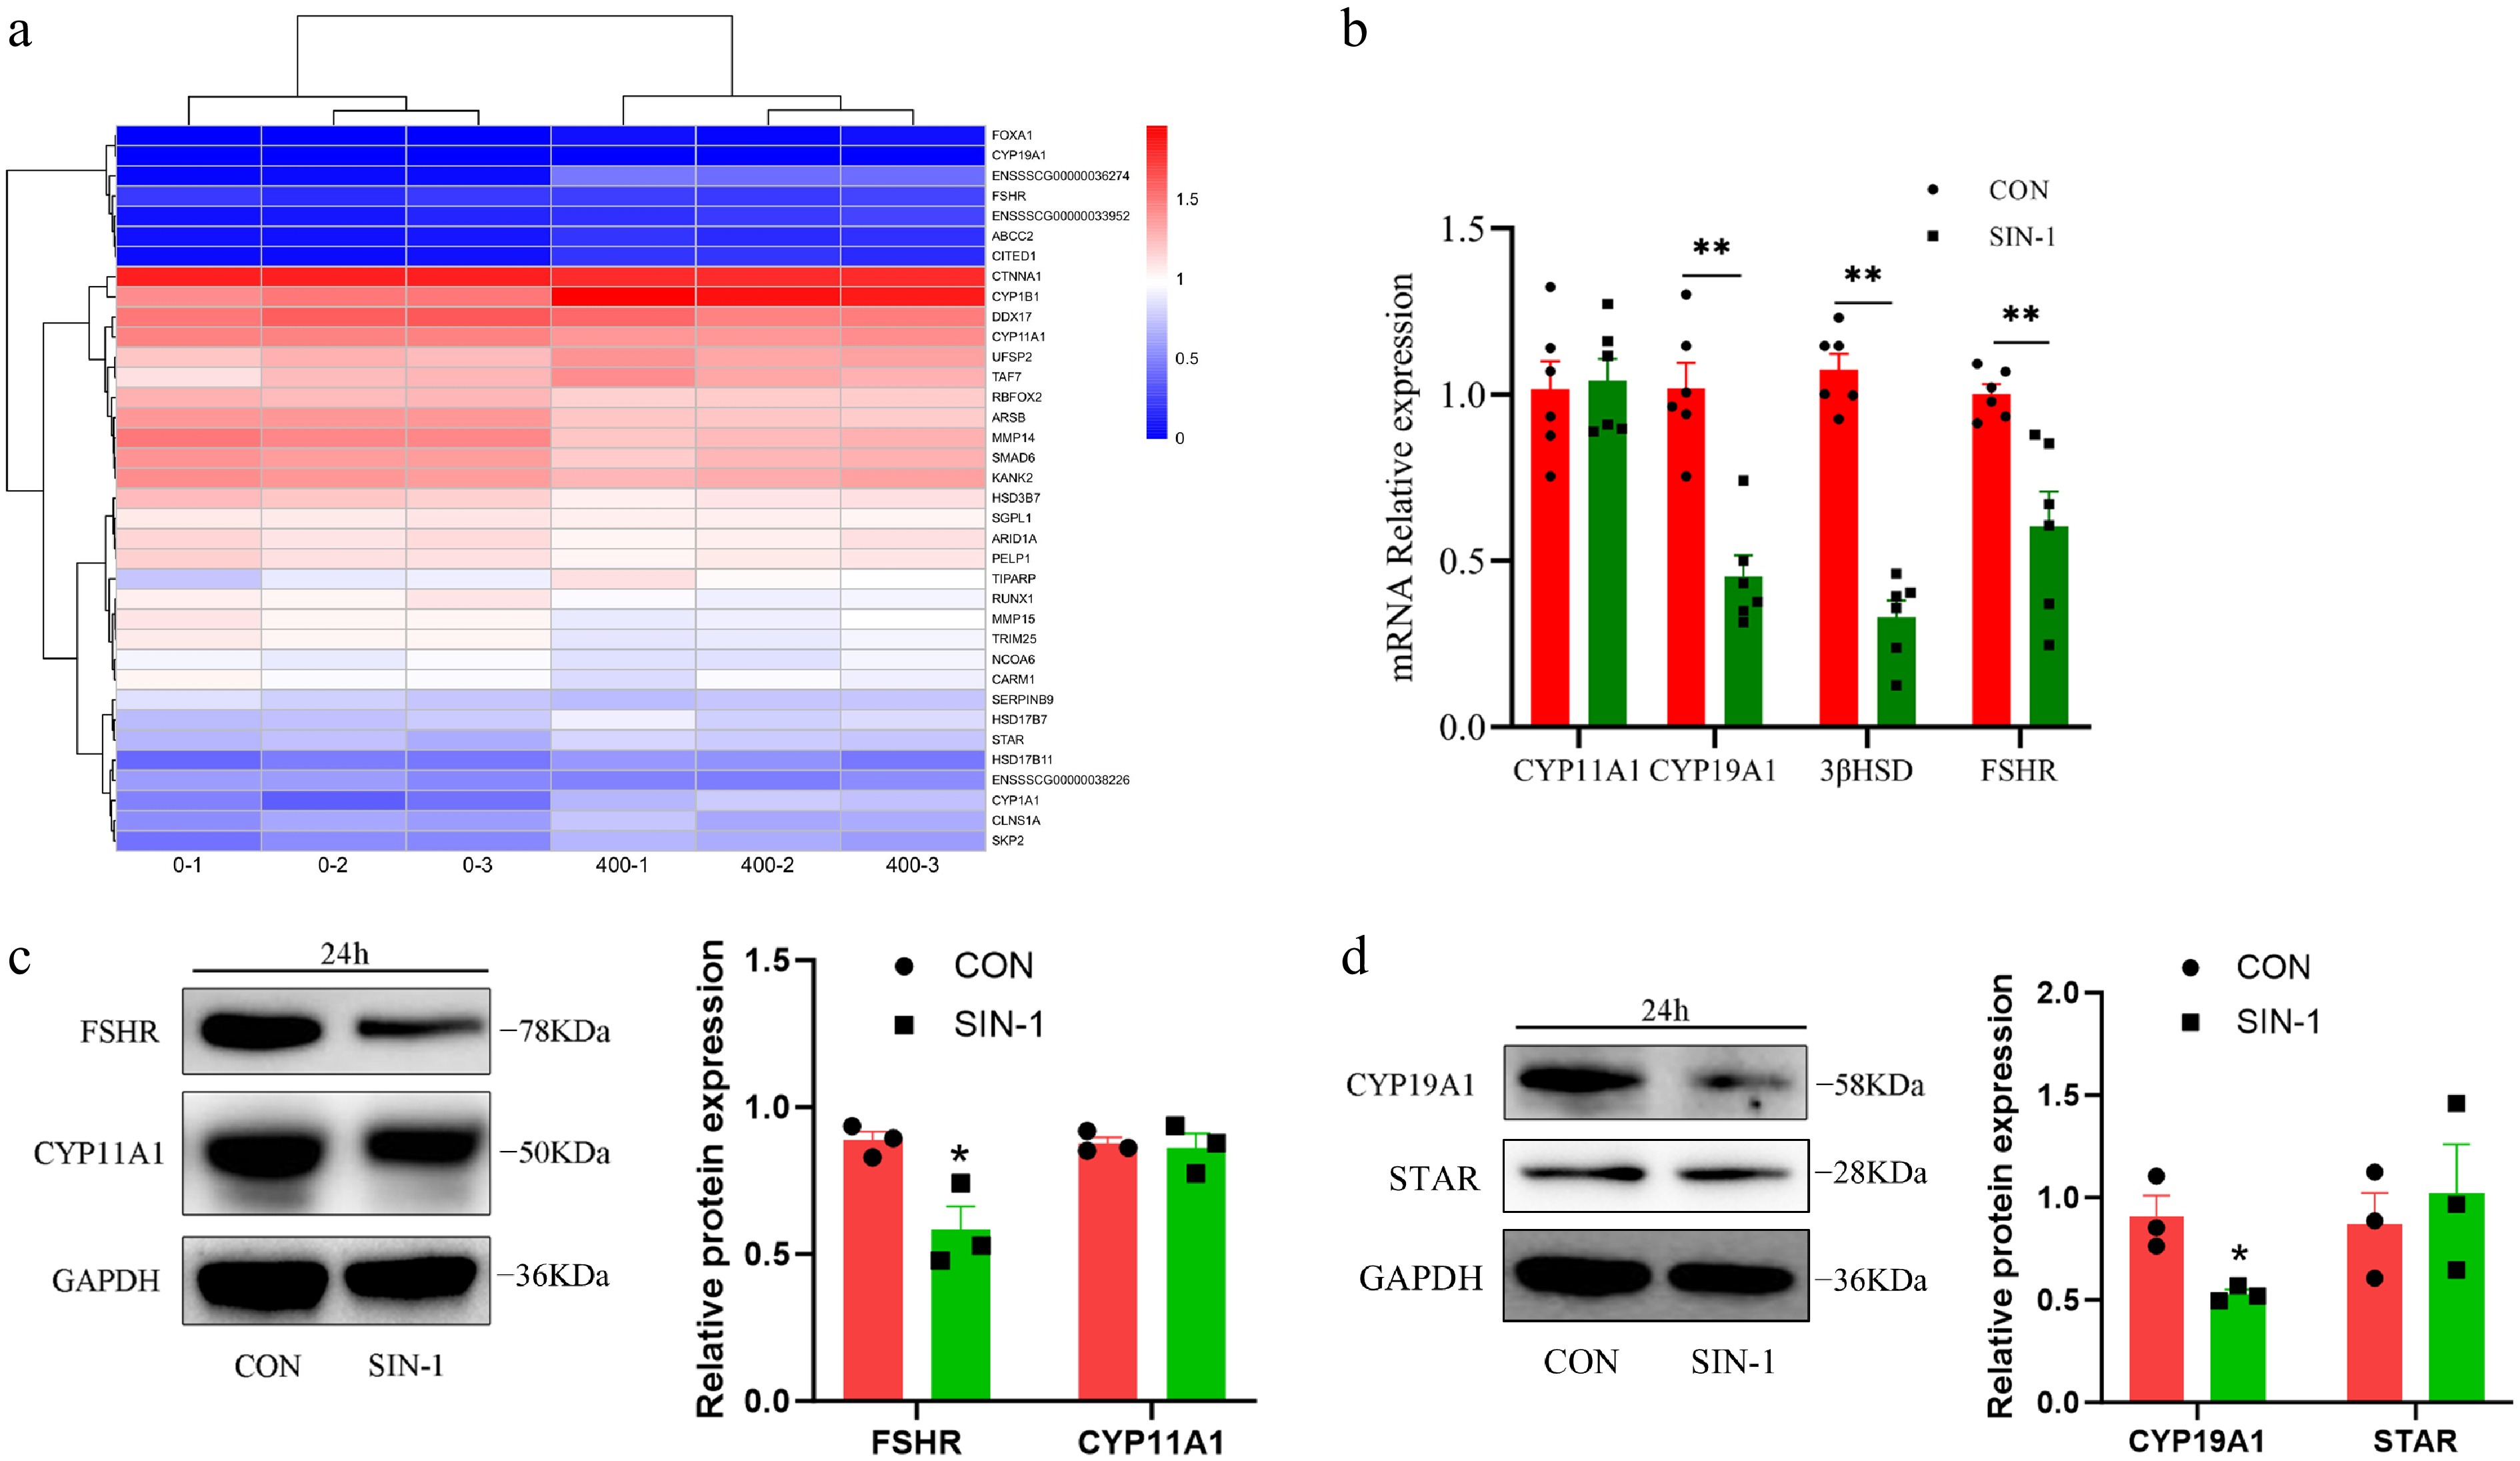
Figure 7.
Expression of hormone secretion-related genes and proteins in granulosa cells. (a) Heatmap of hormone secretion-related DEGs; 0-1, 0-2, and 0-3 are the control groups, whereas 400-1, 400-2, and 400-3 are the 400 μM SIN-1 treatment groups. Blue, downregulated genes; red, upregulated genes. (b) RT-PCR analysis of the relative expression of the mRNA of hormone secretion-related genes in granulosa cells. (c, d) Western blot analysis of hormone secretion-related proteins in granulosa cells. CON, control group; SIN-1, 400 μM SIN-1-treated group. Data are presented as the mean ± SEM. * p < 0.05, ** p < 0.01.
-
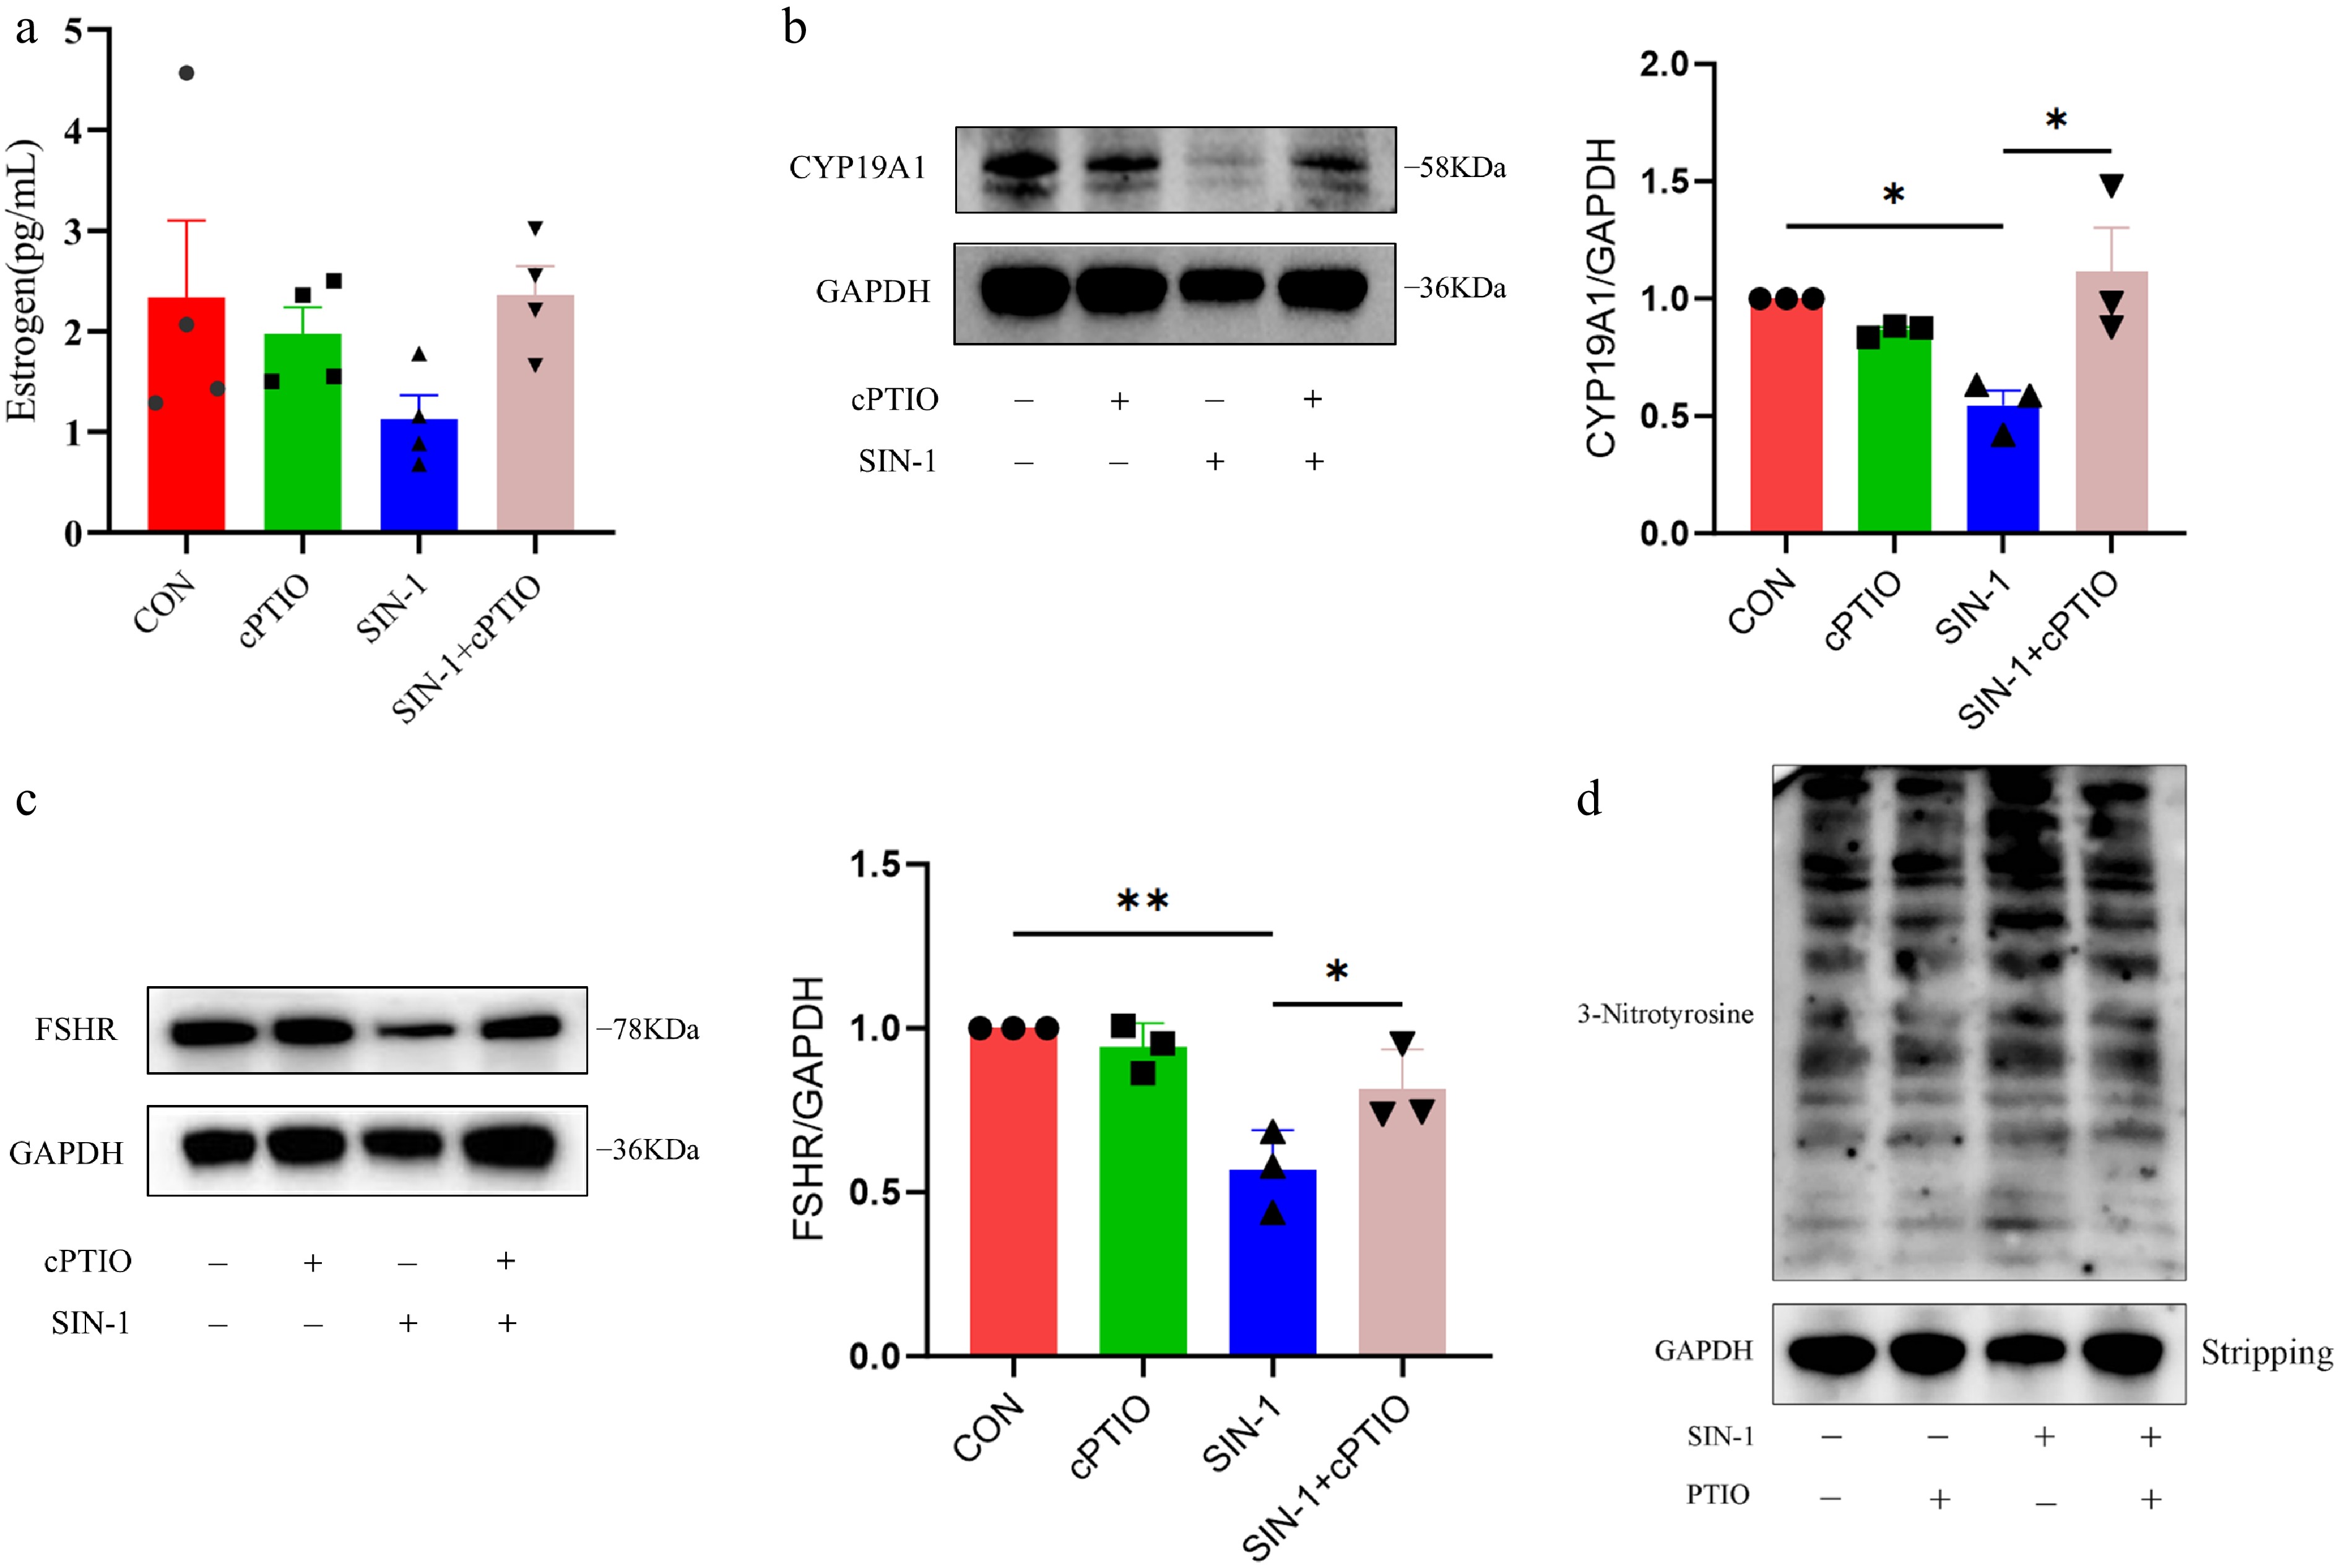
Figure 8.
Levels of E2 secretion and hormone-related protein expression and overall nitroxylation in granulosa cells. (a) ELISA for estrogen levels in cell supernatants. (b, c) Western blot analysis of hormone secretion-related proteins in granulosa cells. (d) Western blot analysis of total nitroxylation in granulosa cells. Data are presented as the mean ± SEM. * p < 0.05, ** p < 0.01.
-
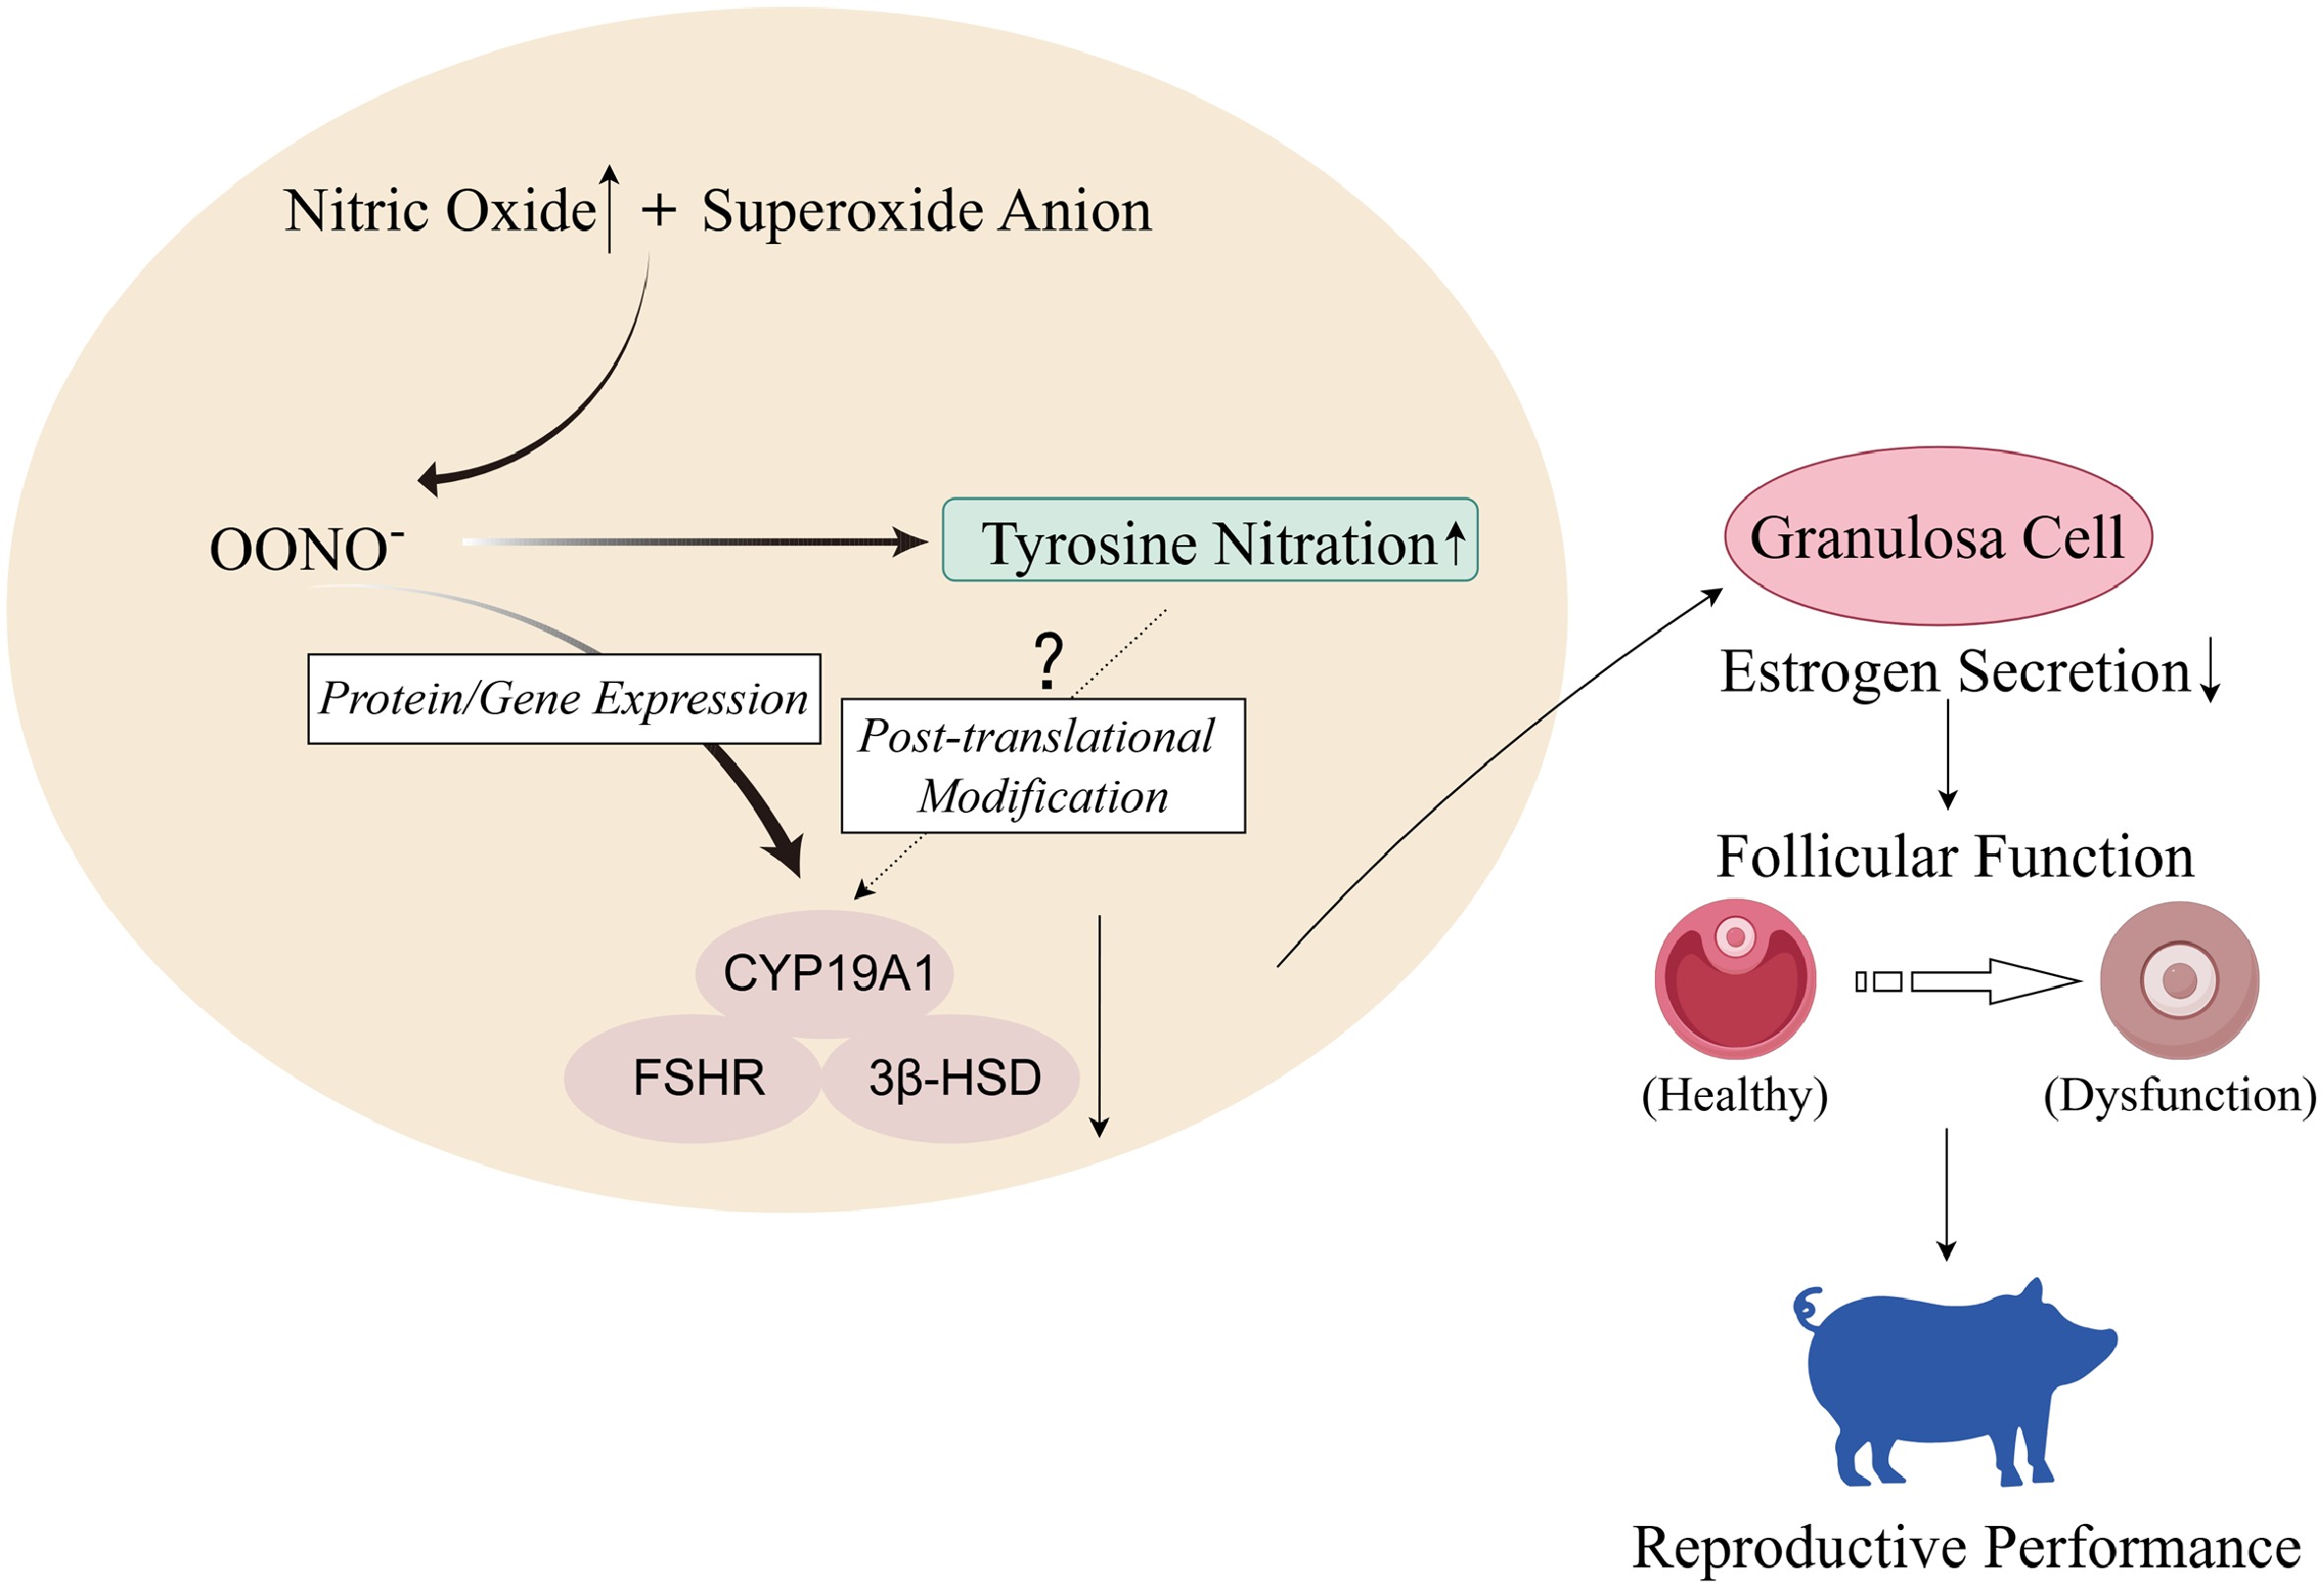
Figure 9.
High concentrations of nitric oxide in organisms react with superoxide anions in reactive oxygen species (ROS) to generate peroxynitrite ions. In porcine ovarian GCs, OONO− inhibits gene and protein expression of CYP19A1, FSHR, and 3β-HSD, thereby inhibiting GCs' E2 secretion, leading to ovarian dysfunction and affecting sows' reproductive performance. In addition, OONO− will also increase the level of tyrosine nitration in GCs, but whether it will cause nitration of hormone synthesis-related proteins needs further experimental verification (figure created with Figdraw).
-
Primary antibody Purpose Dilution Source Cat No. Cleaved Caspase-3 pAb WB 1:1,000 Cell Signaling #9661L β-actin pAb WB 1:5,000 Affinity #AF7018 CYP19A1 pAb WB 1:1,000 CST #14528 GAPDH pAb WB 1:10,000 Affinity #AF7021 FSHR pAb WB 1:1,000 Abclone A3172 CYP11A1 pAb WB 1:1,000 Santa A1713 HSD3β pAb WB 1:1,000 Santa sc-515120 STAR pAb WB 1:1,000 Santa sc-166821 3-Nitrotyrosine mAb WB 1:1,000 Abcam ab110282 Table 1.
Primary antibodies.
-
Components Volume (μL) 2 × ChamQ SYBR qPCR Master Mix 10 Forward primer 0.4 Reverse primer 0.4 50× ROX reference dye 0.4 cDNA template 2 Nuclease-free water 6.8 Table 2.
Real-time qualitative PCR system.
-
Gene Sequence (5'–3') Accession number Forward primer Reverse primer CYP11A1 TCGCCTTTGAGTCCATCACC TCCGTCTCAGGTCCCAGTAG NM_214427.1 CYP19A1 GGGTCACAACAAGACAGGACT ACCTGGTATTGAAGATGTGTTTTT NM_214429.1 3βHSD ACAATCTTACAGGGCCACCC TGGCCTTTGACCCAGGTTAG XM_021088745.1 FSHR CGCGGTTGAACTGAGGTTTG GCAGGTTGTTGGCCTTTTCA XM_021085884.1 GAPDH GGCCGCACCACTGGCATTGTCAT AGGTCCAGACGCAGGATGGCG XM_003126531.5 Table 3.
Primer sequences used for real-time qualitative PCR.
Figures
(9)
Tables
(3)