-
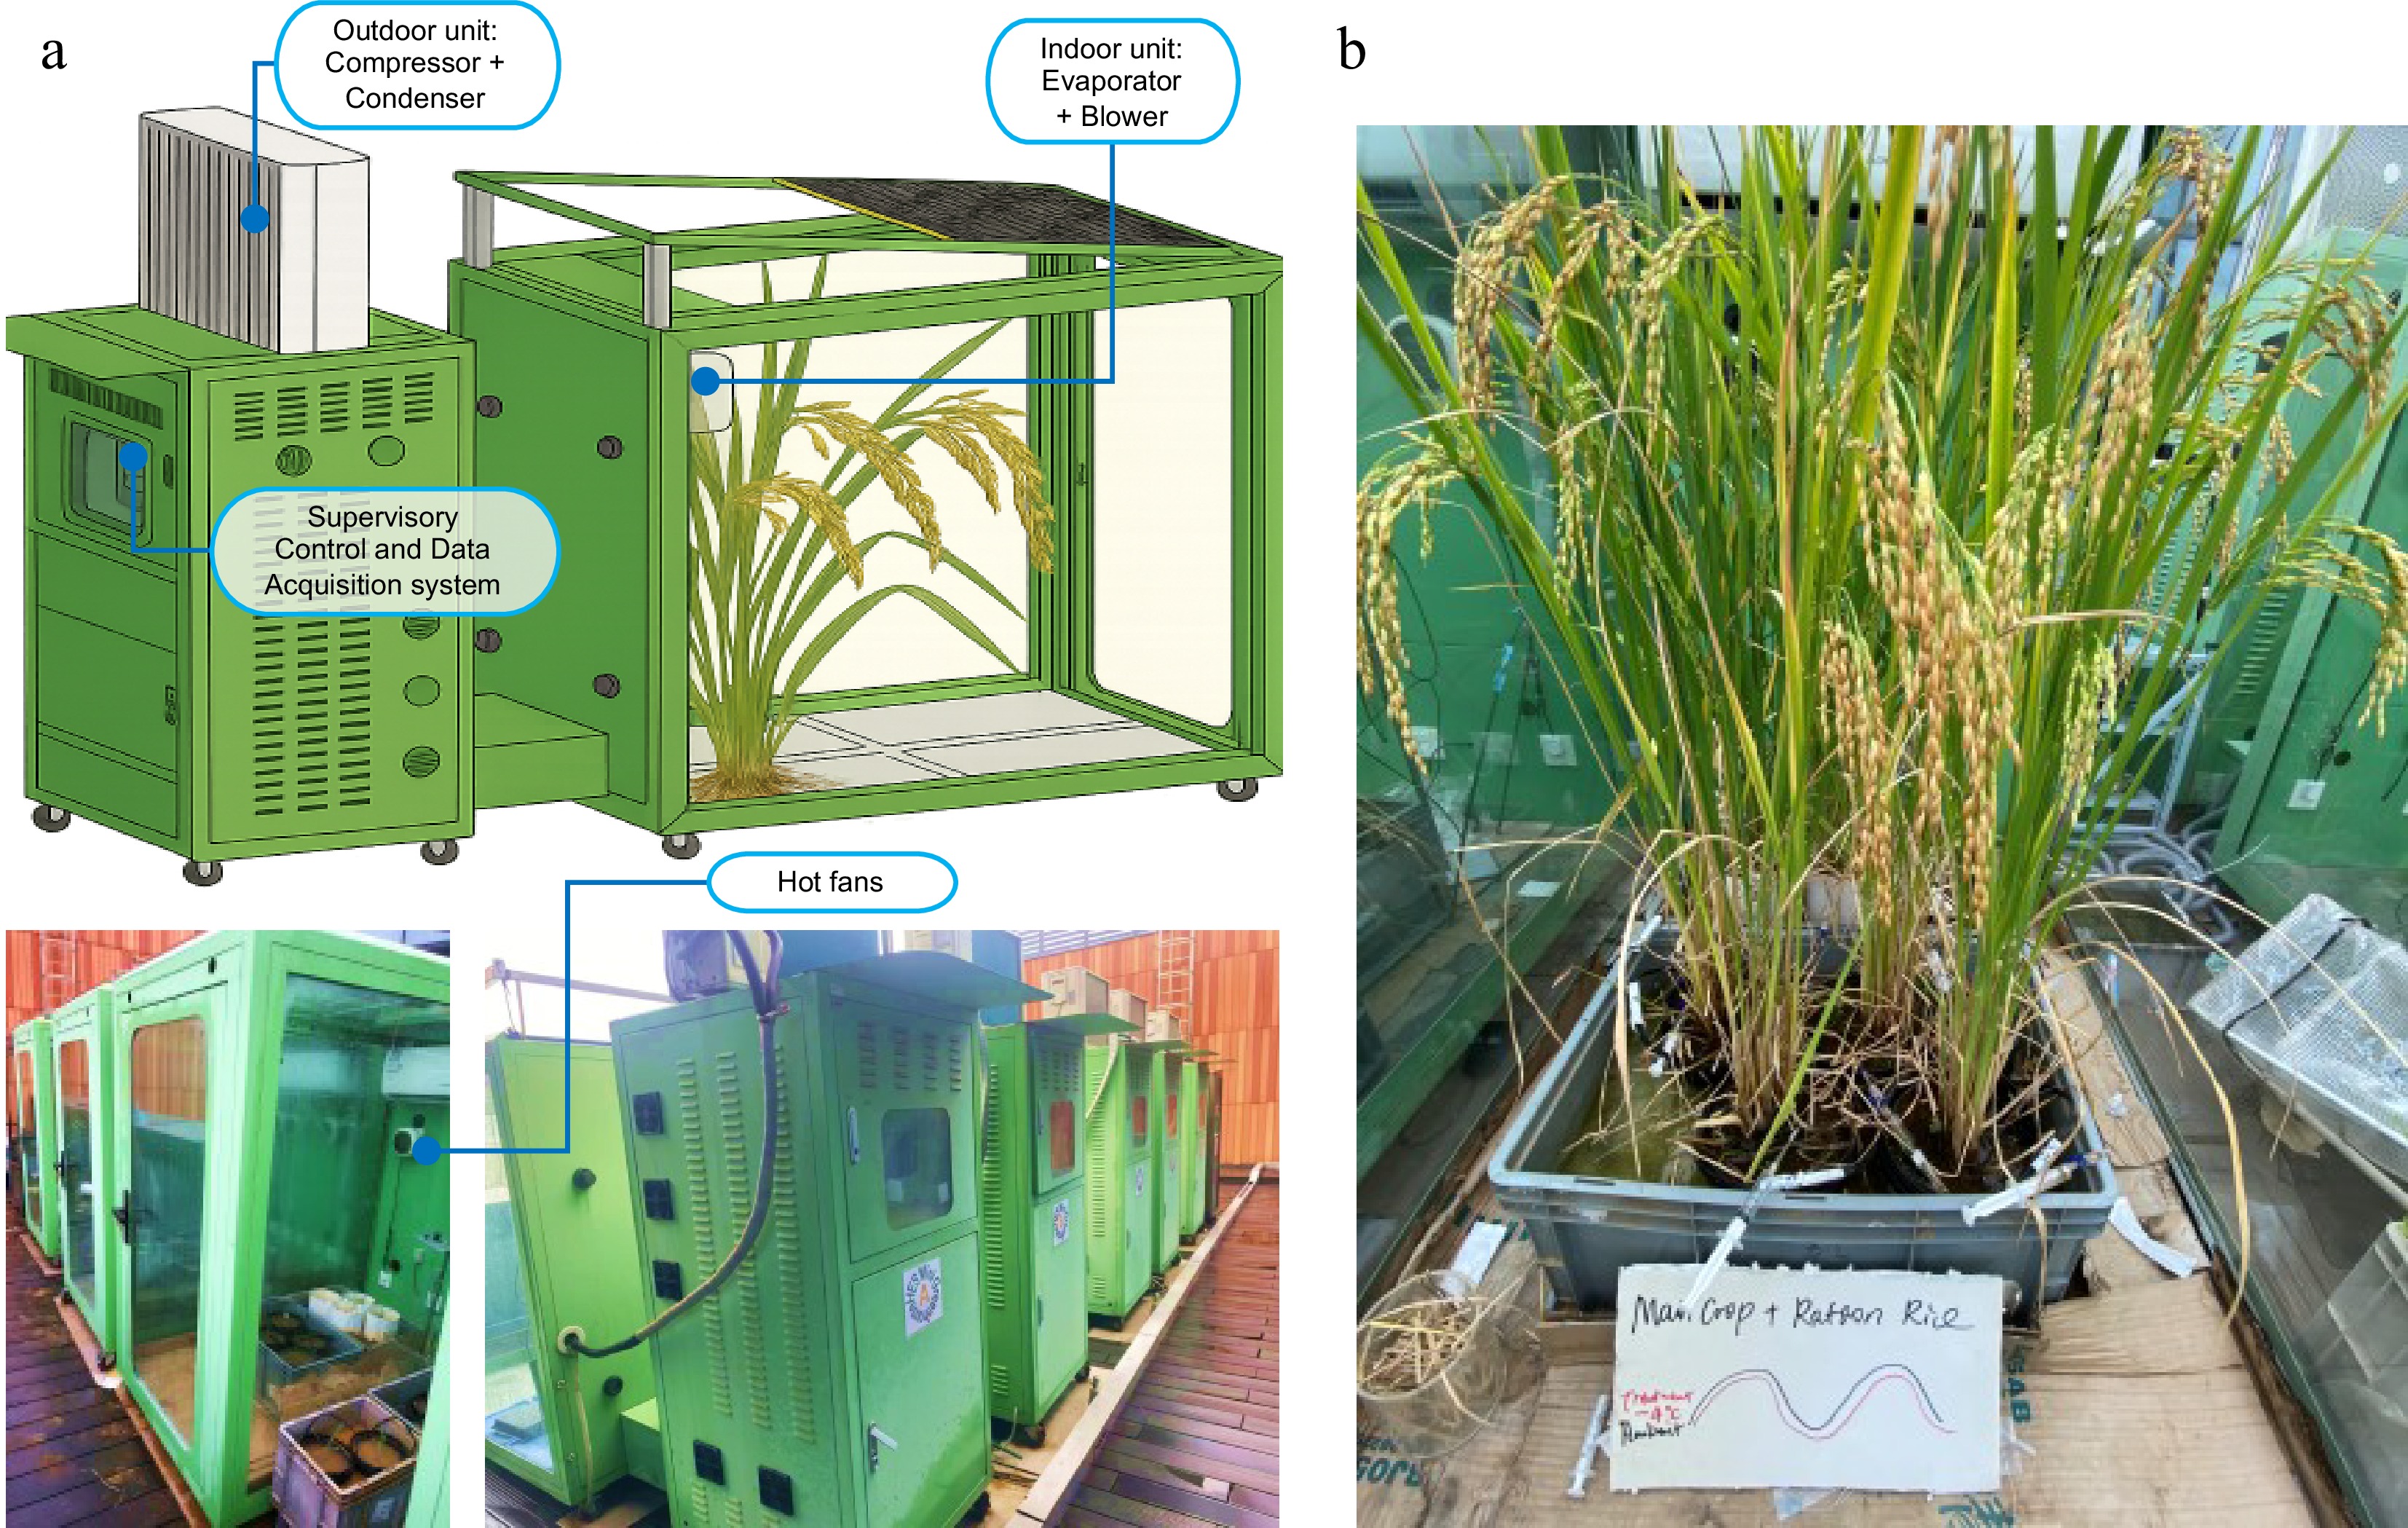
Figure 1.
(a) Diagram of the sunlit AmbControl facility. Each unit contains one 1,895 W cooling-only air conditioner and two 500 W hot fans. Facilities are portable and can be relocated between fields. Conditioned air is mixed around the canopy level. (b) Rice has grown to maturity inside an AmbControl unit.
-
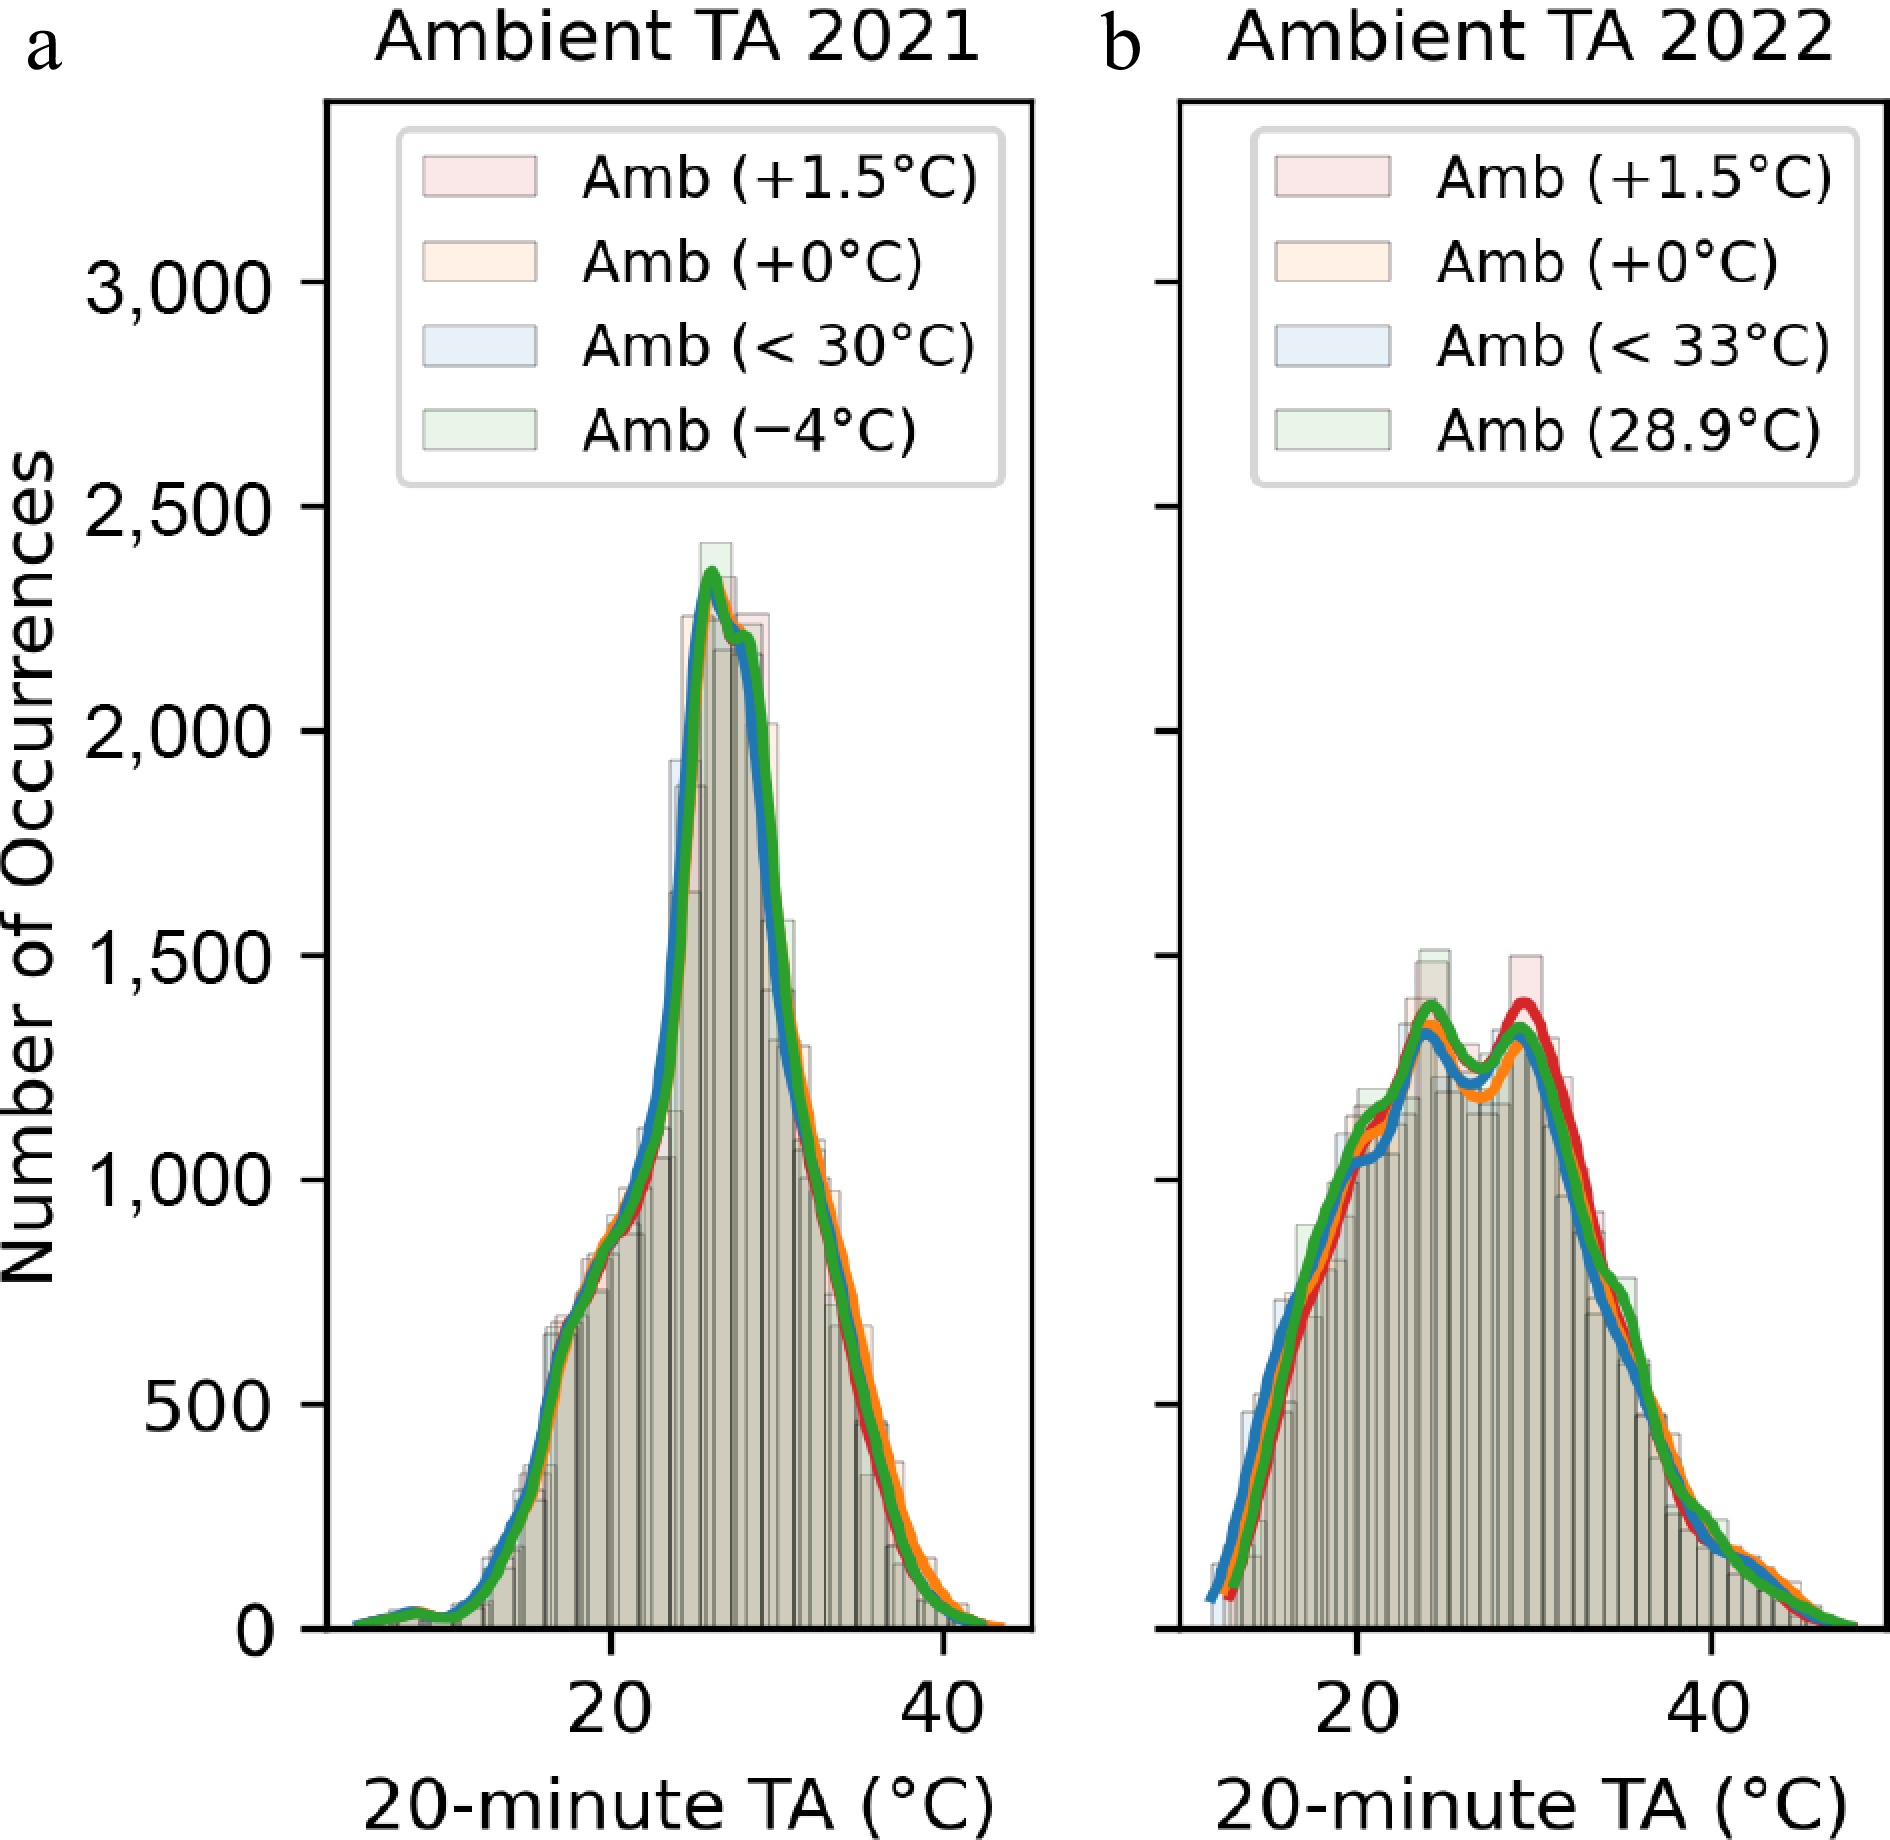
Figure 2.
Temperature sensor stability and reproducibility among four AmbControl units in the years (a) 2021 and (b) 2022.
-
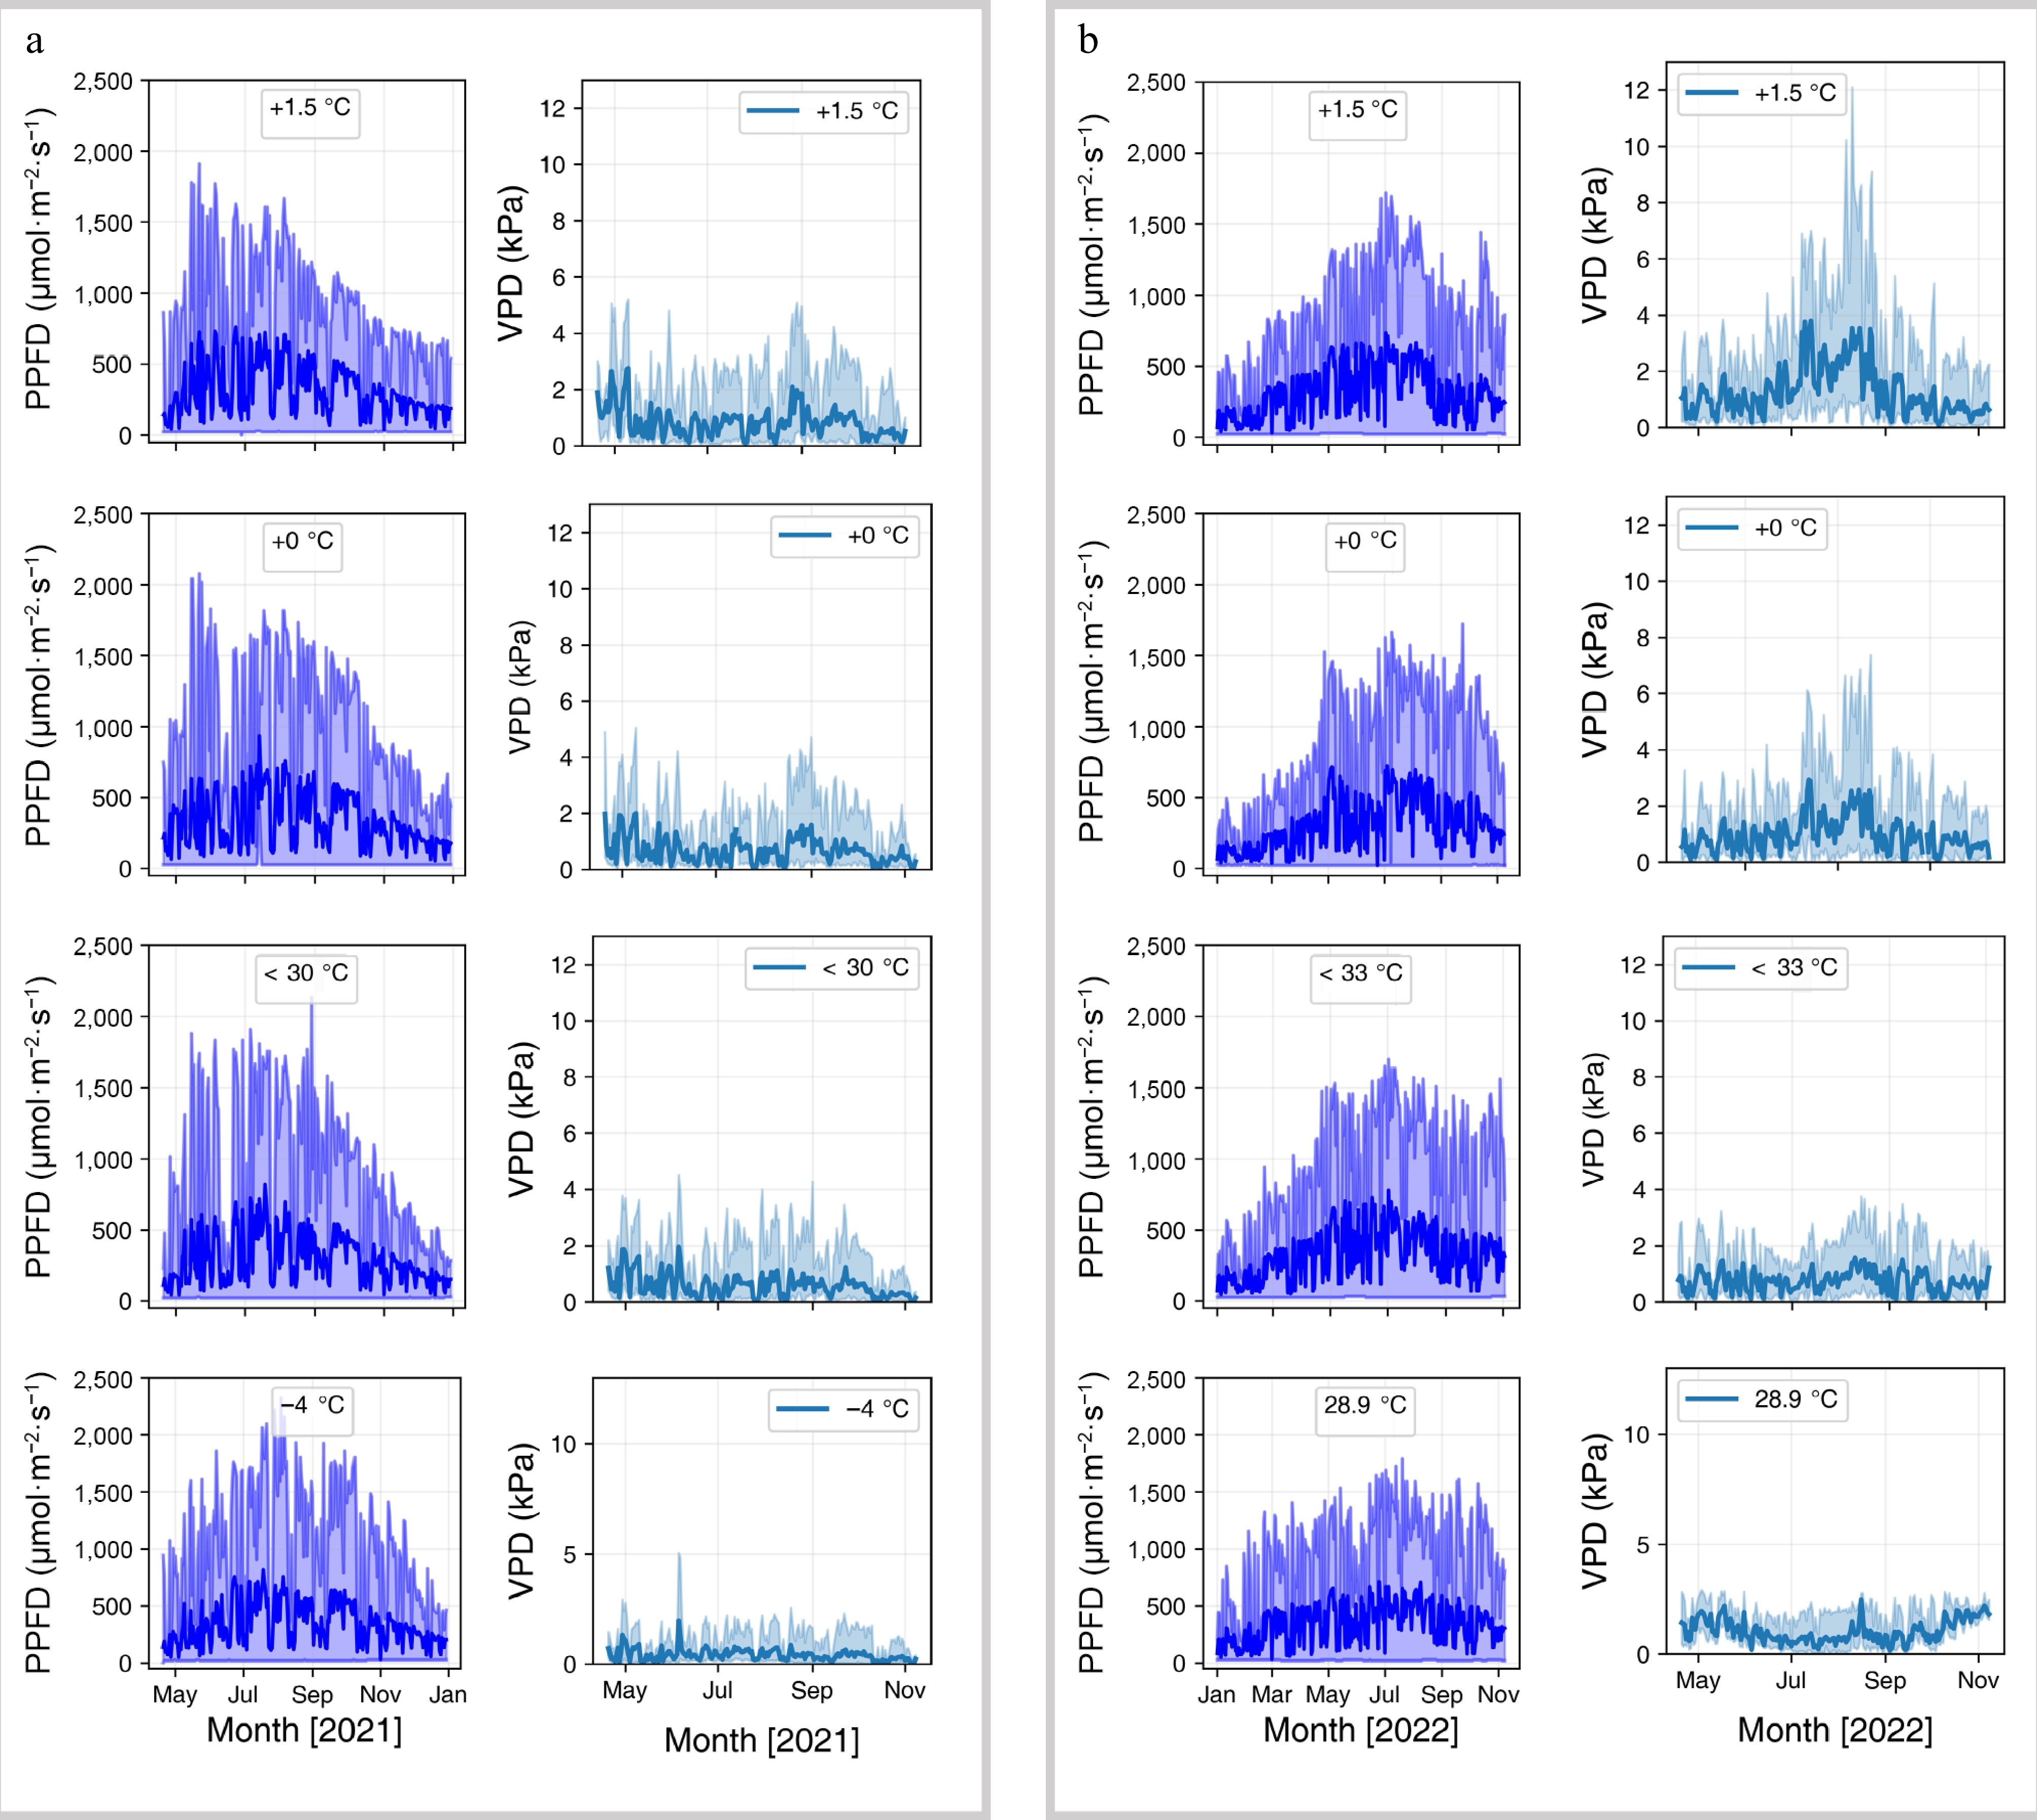
Figure 4.
(a) PPFD (daytime only), and (b) VPD fluctuations at 20 min resolution for 2021 and 2022. Bold lines are daily means. Temperature treatments as in Fig. 3. PPFD was measured at the canopy level within each AmbControl unit; small differences among units reflect partial shading by rice leaves and minor variation in glass transmissivity due to dust deposition (despite weekly cleaning). VPD is a function of both TA and humidity and thus diverges among units under different temperature treatments. Interannual climatic variability accounts for the differences observed between 2021 and 2022.
-
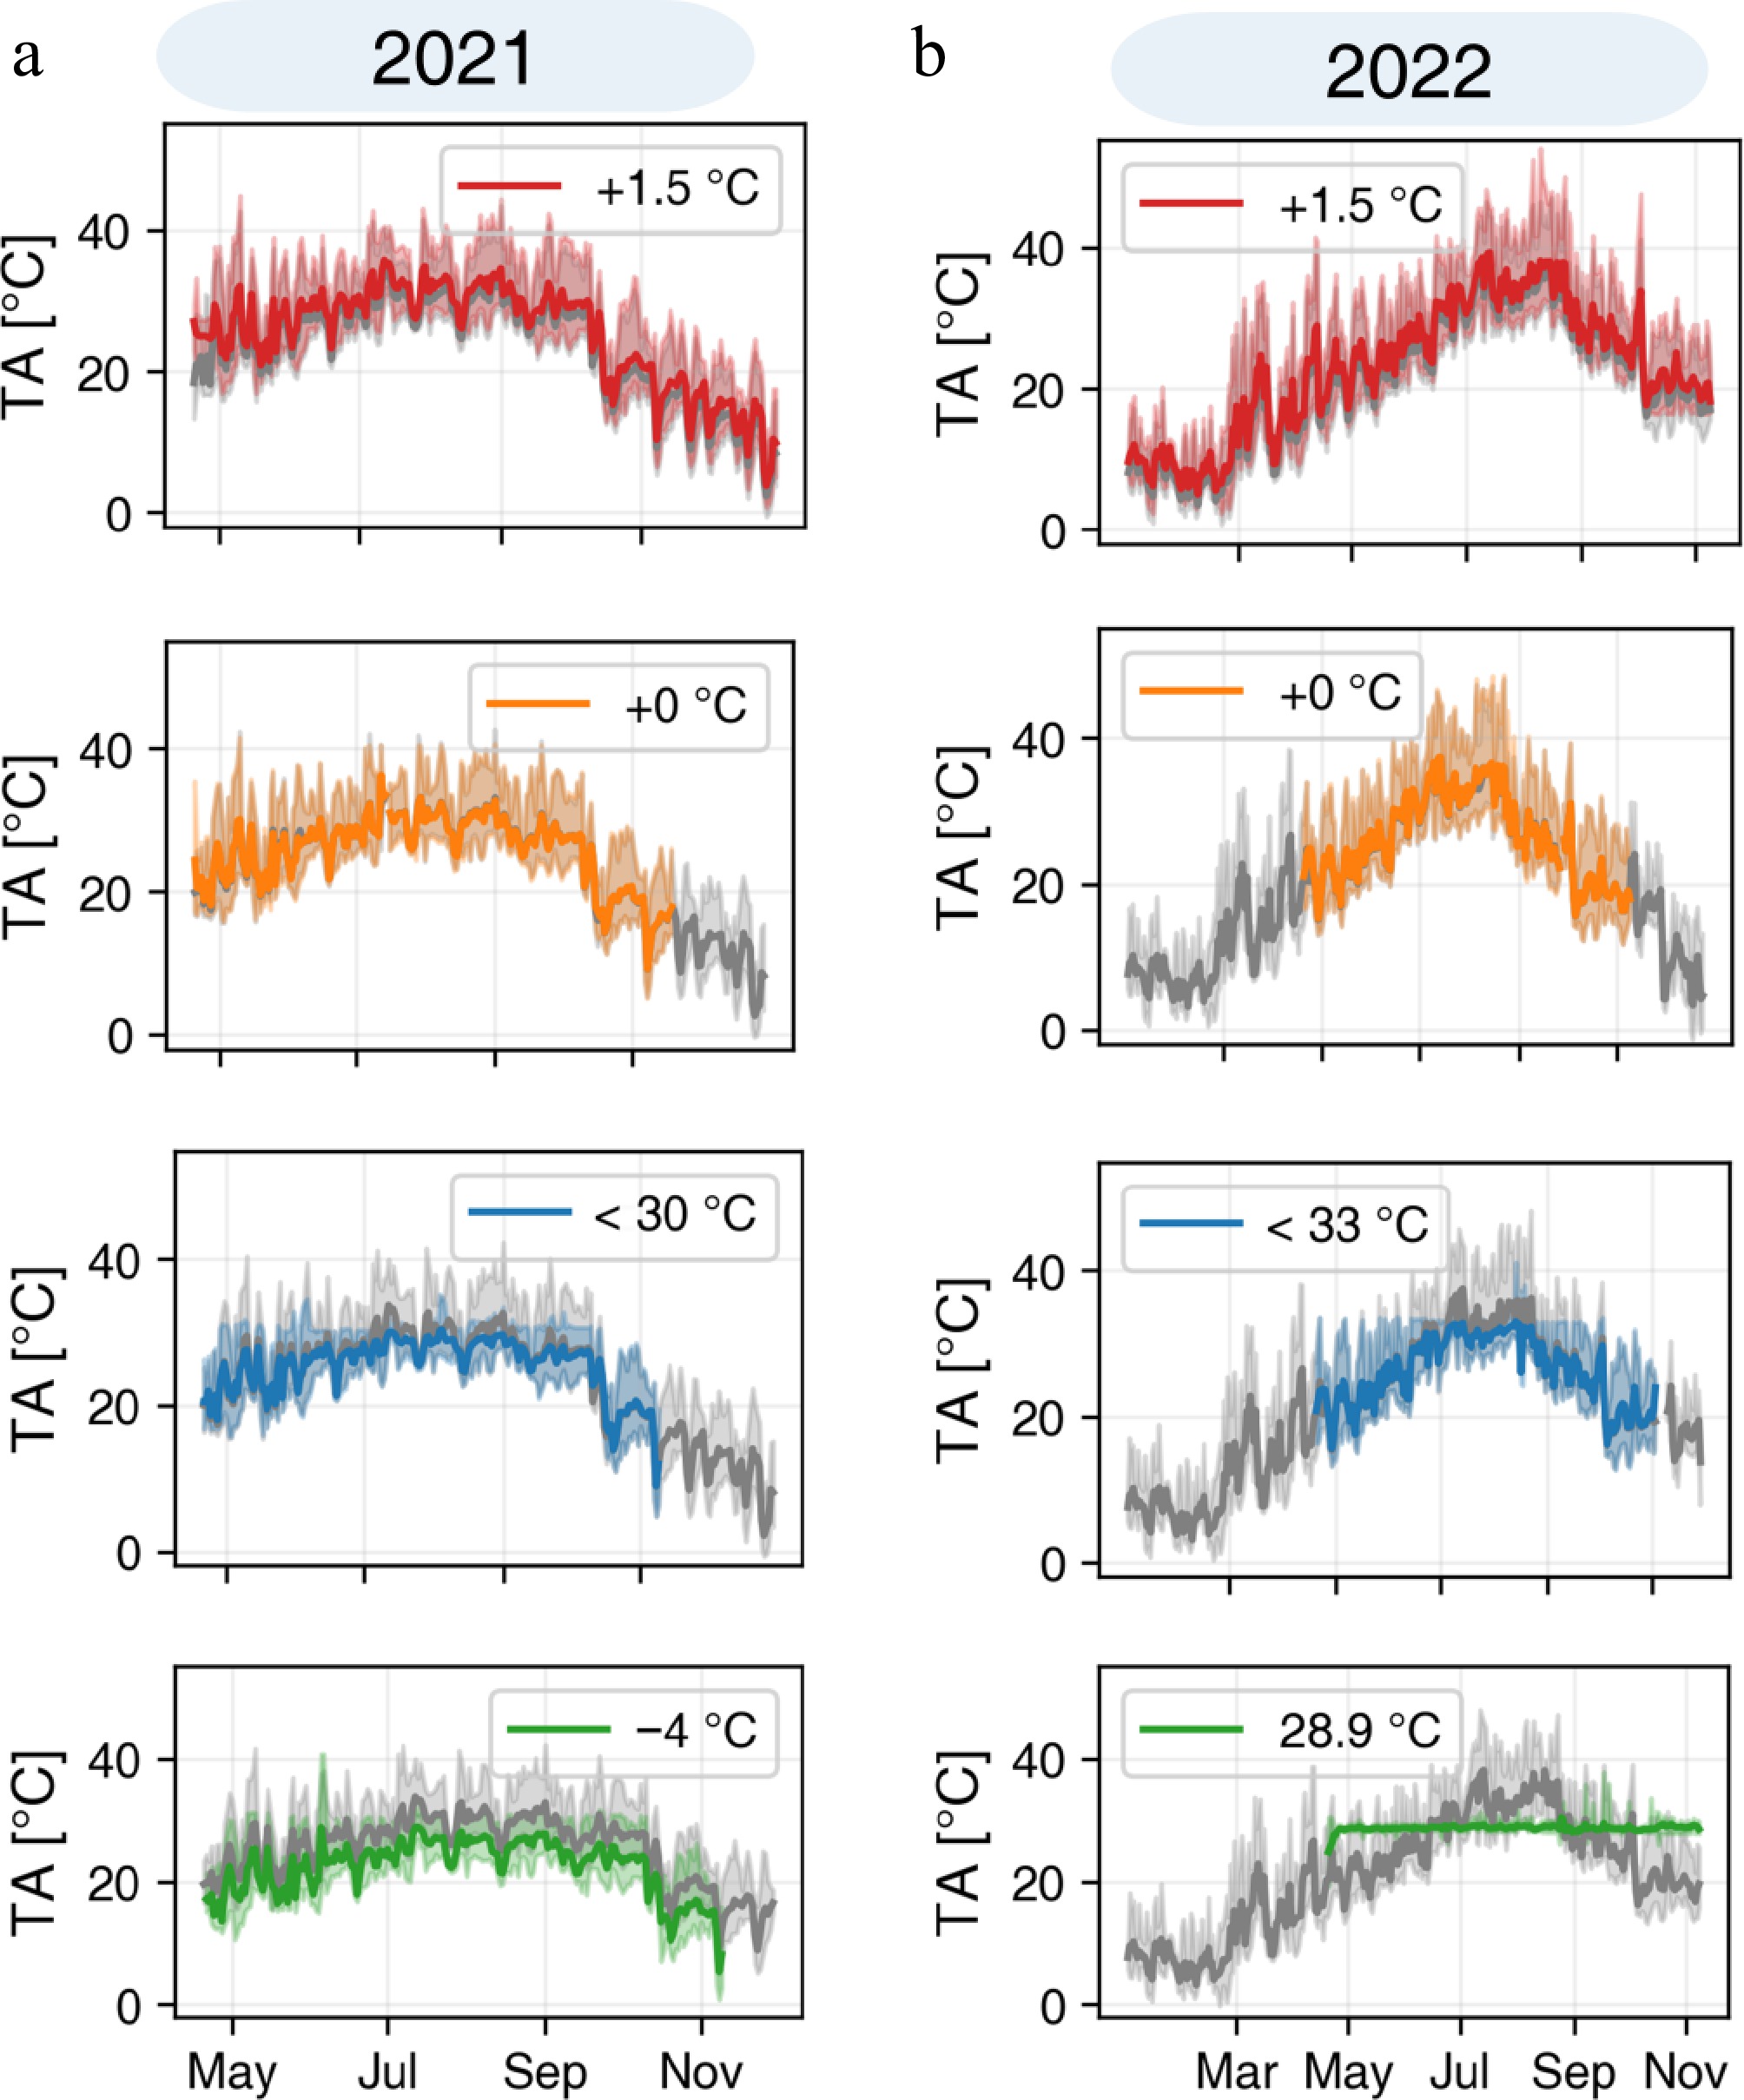
Figure 3.
(a), (b) Twenty-minute canopy TA in 2021 and 2022, respectively. Gray curves show ambient TA from independent AmbControl units. 2021 scenarios: +1.5 °C, +0 °C, Tmax < 30 °C, and −4 °C. 2022 scenarios: +1.5 °C, +0 °C, Tmax < 33 °C, and constant 28.9 °C (mean TA from June–September 2021).
-
Features Unit 2021 2022 +1.5 °C +0 °C < 30 °C −4 °C +1.5 °C +0 °C < 33 °C Fixed 28.9 °C Mean PPFD† μmol·m−2·s−1 353 367 325 367 371 433 385 383 Standard deviation 338 386 364 386 338 376 378 356 Minimum PPFD 0 26 22 18 22 22 26 18 Maximum PPFD 1,911 2,078 2,132 2,323 1,723 1,722 1,699 1,788 Mean VPD KPa 1.3 1.1 0.9 0.7 2.0 2.0 1.1 1.3 Standard deviation 1.0 0.9 0.8 0.6 1.6 1.4 0.7 0.6 Minimum VPD 0.029 0.017 0.012 0.013 0.039 0.016 0.017 0.038 Maximum VPD 5.2 5.0 4.5 5.1 12.1 7.4 3.8 2.9 † PPFD is calculated from daytime hours: 6:30 to 17:30. Table 1.
Seasonal PPFD and VPD statistics for all treatments in 2021 and 2022.
-
No. Key features AmbControl SPAR PhenoSphere Greenhouse T-FACE Control precision 1 Heating control YES. Heating air YES. Heating air YES. Heating air VARIABLE. Natural control YES. Heating subjects directly PhenoSphere > AmbControl ≥ SPAR > T-FACE > Greenhouse 2 Cooling control YES. Cooling air YES. Cooling air YES. Cooling air VARIABLE. Natural ventilation NO. AmbControl ≥ SPAR ~ PhenoSphere > Greenhouse ~ T-FACE 3 Akin to ambient temperature fluctuations YES. Precisly
(± 0.3 °C)YES. Precisly YES. Moderate, using a sinus curve simulation YES. Moderate. Piecewise constant or natural YES. Precisly AmbControl ~ SPAR ~ PhenoSphere > T-FACE ~ Greenhouse 4 Control and data-logging system Detailed control Detailed control Detailed control Weather-fed Detailed control PhenoSphere ~ SPAR ~ AmbControl > T-FACE > Greenhouse 5 Sunlight YES. Near sunlight due to glass
filteringYES. Near sunlight due to glass
filteringNO. LED simulation using historical
dataYES. Near sunlight due to glass
filteringYES. Natural sunlight T-FACE ≥ AmbControl ~ SPAR ~ Greenhouse > PhenoSphere 6 Humidity control No control Detailed control Detailed control No control No control SPAR ≥ PhenoSphere > > T-FACE ~ AmbControl ~ Greenhouse 8 Root zone size VARIABLE. Various soil containers Medium soil container, typically 60–100 cm VARIABLE. Various soil containers VARIABLE. Natural on-site soil or various soil containers Natural on-site soil T-FACE > Greenhouse ≥ AmbControl ~ SPAR ~ PhenoSphere 10 Portability and movability YES YES NO NO NO AmbControl > SPAR ~ PhenoSphere ~ Greenhouse ~ T-FACE Table 2.
Comparison of the features of five types of facilities for conducting temperature manipulation experiments.
Figures
(4)
Tables
(2)