


-
Seasonal heatwaves often exceed the thermal thresholds for optimal crop growth, posing serious risks to global food production and ecosystem stability. They can reduce crop yields, deteriorate grain quality, alter phenology, increase pest and disease susceptibility, and disrupt soil microbial activity[1−6]. Importantly, short-term episodic heatwaves during sensitive stages, such as flowering or grain-filling, can strongly influence rice yields, independent of long-term climate trends[3,7].
Although soil-plant responses to climatic variability have been widely studied, most research has emphasized individual processes, such as photosynthesis, transpiration, root growth, nutrient uptake, or soil microbial activity, rather than whole-system performance under heatwave vs no-heatwave conditions within a growing season[1,4,8]. In field settings, plant responses to heatwaves are influenced by dynamic interactions among air temperature (TA), relative humidity (RH), light quantity and quality, soil properties, and bio factors[9]. These factors are increasingly variable under global climate change[10], making result interpretation more difficult. Although field warming experiments have been conducted for over 30 years, results remain inconsistent, largely because most studies focus on average temperature increases while neglecting the timing, duration, and intensity of episodic heat events[5,11−13].
One major limitation is the lack of experimental tools capable of reliably manipulating episodic heatwaves in the field. Field warming systems such as open-top chambers typically passively raise TA by 0–3.5 °C, but they rarely include cooling capacity and cannot isolate the effects of extreme heat events[8,11,14]. As such, previous studies are largely opportunistic, relying on naturally occurring heatwaves, which are becoming more intense and less predictable under climate change[10,15]. Indoor controlled systems offer precise climate manipulation but fail to capture the complexities of field conditions. Phenotypic responses observed in such systems may not reflect real-world crop performance[2,16], often overlooking the dynamic nature of sunlight, temperature, vapor, and carbon dioxide (CO2)[17].
Methodological advancements in field and controlled-environment phenotypic analyses are rapidly improving[9,11,14,18,19]. For instance, advanced systems such as sunlit soil–plant–atmosphere research (SPAR) chambers[14], whole-ecosystem warming platform of peatland in northern Minnesota (USA)[20], and the recently developed PhenoSphere[21], attempt to bridge the gap between controlled and field conditions. These platforms typically achieve warming through infrared heaters, resistance heating, or air-based systems, while cooling capacity is generally absent. They offer process-oriented data by simulating realistic diel cycles while precisely regulating temperature and/or atmospheric CO2 concentrations. However, their ability to simulate natural heatwaves with both warming and cooling capacity has yet to be tested.
In this study, the development of AmbControl is presented, a cost-effective, sunlit field chamber system designed to manipulate TAs under natural sunlight without altering light dynamics. AmbControl accommodates full plant growth with ample airspace (~2 m) and operates autonomously to regulate internal TA based on ambient fluctuations, while monitoring RH, vapor pressure deficit (VPD), and sunlight intensity and quality. Across two full rice-growing seasons (2021–2022), six AmbControl units consistently reproduced natural heatwave dynamics and supported experiments under varied temperature scenarios, including elevated, stable, and mitigated thermal regimes (+1.5 °C, +0 °C, < 30 °C, −4 °C, < 33 °C, fixed 28.9 °C). These scenarios permitted comparative analyses of phenotypes under recent heatwaves, no-heatwave, stable temperature, or elevated temperature conditions.
The aim of this study was to address the critical gap between controlled-environment precision and field realism by introducing AmbControl, a sunlit field chamber system capable of both heating and cooling under natural sunlight. The specific objectives are: (i) to demonstrate AmbControl's capacity to capture and revise the dynamics of natural heatwaves while maintaining precise control of TA relative to ambient conditions; (ii) to establish no-heatwave controls in field settings, enabling direct comparisons of crop performance with and without heat stress; and (iii) to evaluate its stability across multiple thermal regimes and growing seasons. The scope of this work is to provide a practical and scalable platform for quantifying soil–plant responses to episodic heat extremes under field-relevant conditions, thereby generating robust data that can inform crop and climate models under future scenarios of increasing heatwave risk.
-
The AmbControl facilities were located in Suzhou, China (31°16'13.61" N, 120°44'09.83" E). Locally, temperature-abnormal days were defined as days with a maximum air temperature (Tmax) exceeding either 36 °C. These thresholds represent anomalies of +5 °C relative to the 30-year average Tmax (1961–1990) recorded at the Kunshan Meteorological Station. Heatwaves were operationally defined as periods of at least three consecutive days with the Tmax exceeding 36.1 °C. Although the physical basis of heatwaves lies in excess energy transfer through radiation and altered surface–atmosphere exchanges, agronomic and meteorological studies typically adopt TA thresholds to characterize them[22]. Following this convention, we applied a temperature-based definition to capture locally relevant extreme heat events[23].
AmbControl facility components
-
Six sunlit AmbControl chambers designed to mimic and manipulate natural heatwaves with precision comparable to fully climate-regulated systems were constructed. All six chambers operated under natural sunlight. Four were used for experimental treatments, while two remained on standby for redundancy. Each chamber allowed plants to receive a realistic photosynthetically active radiation (PAR) profile. The physical dimensions of each unit were 1.8 m (height) × 1.6 m (length) × 1.0 m (width), providing a growing volume of approximately 2.9 m3. Chambers were built using a double layer of 1.3 cm thick transparent glass and were mounted on wheels to allow positional randomization, minimizing location-based bias.
Each chamber was equipped with: (i) one air-conditioning unit (cooling power: 1,875 W) to remove latent and sensible heat during high-temperature periods; (ii) two hot-air fans (each 500 W) for rapid and flexible heating when elevated temperatures were required. Using separate systems ensured precise, bidirectional temperature control under fluctuating field conditions; and (iii) supplementary LED lights are used only for early-morning light compensation to avoid shading artifacts, not as a primary light source. Sensors (Bio Genetic Technology Co., Ltd., China) were used to monitor canopy TA, relative humidity (RH), and photosynthetic photon flux density (PPFD), with adjustable heights to match crop growth stages. The chambers were semi-open, with airflow directed above the plant canopy to induce leaf movement and heat dispersion. To ensure consistent ventilation and humidity balance, chambers had predrilled holes on their north-facing walls. The top glass panels were cleaned weekly to maintain optimal light transmission.
A centralized Supervisory Control and Data Acquisition system, with a user-friendly interface and web-based Application Programming Interface, enabled real-time climate monitoring and control. Environmental parameters (temperature, RH, and light intensity) were recorded at 1-min intervals throughout both rice-growing seasons (2021–2022). To evaluate chamber performance under natural heatwave conditions, the system continuously monitored internal TA, RH, PPFD, and VPD.
Implementation of Proportional-Integral-Derivative (PID) control in temperature regulation
-
The stability and efficiency of the present air conditioning and heating system are maintained by a PID controller[24]. This digital controller continuously compared the target setpoint temperature (Tset, often the ambient temperature) with the measured chamber TA (Tchamber) by Eq. (1) and adjusted the output power of the air-conditioning and heating units accordingly.
$ {e\left(t\right)=T}_{set}-{T}_{chamber} $ (1) The controller output (u(t)) that drives heating or cooling devices was calculated as Eq. (2).
$ u\left(t\right)={K}_{p}e\left(t\right)+{K}_{i}{\int }_{0}^{t}e\left(\mathrm{\tau }\right)d\mathrm{\tau }+{K}_{d}\dfrac{de\left(t\right)}{dt} $ (2) where, Kp, Ki, and Kd are the proportional, integral, and derivative gains, respectively. These parameters were tuned to balance responsiveness and stability in temperature regulation. In the present system, default values were set to Kp = 2.5, which corrects the temperature deviations (i.e., e(t)), Ki = 1.0 min−1 which repeats the control action per minute, and Kd = 0.5, that measures the rate of change over half a minute.
For the Kp, it adjusts the output power of climate control devices based on the current temperature error e(t), which is the difference between the desired setpoint and the actual chamber temperature. A high Kp yields a faster response but may cause the system to overreact to temperature deviations, creating oscillations, while a low Kp result in sluggish correction. For the Ki, it accumulated past error to eliminate steady-state offsets, ensuring the target temperature is reached and maintained. An increased Ki, however, can slow response time and induce system instability. For the Kd, it forecasts future temperature changes by evaluating the rate of error change, damping overshoot, and stabilizing rapid fluctuations.
The incremental PID algorithm's formula is employed for fine adjustments in a digital temperature control sphere, which is described as follows.
First, the change in error is calculated using Eq. (3),
$ \Delta e\left(t\right)= e\left(t\right)-e(t-1) $ (3) Second, the increment is calculated using Eq. (4),
$ \Delta u\left(t\right)=Kp\cdot \Delta e\left(t\right)+Ki\cdot e\left(t\right)+Kd\cdot \left(\Delta e\right(t)-\Delta e(t-1\left)\right) $ (4) Third, the updated control output is given by Eq. (5),
$ u\left(t\right) =u(t-1) + △u\left(t\right) $ (5) where,
$ \Delta $ $ \Delta $ Temperature manipulations
-
Temperature treatments were conducted across two full rice-growing seasons (2021 and 2022). The treatments included the following.
2021 experiments
-
• +1.5 °C scenario: chamber TA was maintained 1.5 °C above the ambient level. This treatment was designed to reflect the climate change target of the Paris Agreement and the IPCC projections, i.e., limiting global warming to 1.5 °C above pre-industrial levels, thereby simulating a near-future warming condition in rice production systems.
• +0 °C (ambient): natural temperature fluctuations were maintained without intervention, representing the local baseline control.
• < 30 °C scenario: maximum daily air temperature (Tmax) was limited to below 30 °C, effectively excluding extreme heat events for rice production.
• −4 °C scenario: chamber temperature was maintained 4 °C below the ambient level, and the maximum daily temperature (Tmax) was constrained to ≤ 30 °C. This treatment was used to mimic the cooler growing environments characteristic of temperate rice cultivation zones, in comparison with the current subtropical experimental site.
2022 experiments
-
In 2022, the experimental design was adjusted based on the 2021 observations. The +1.5 °C and +0 °C treatments were maintained, while the < 30 °C non-stress condition was replaced by a < 33 °C scenario. This adjustment was made because Yliangyou 1 exhibited no significant stress response at < 30 °C in 2021, indicating the need to set a slightly higher threshold for defining non-stress conditions. The −4 °C treatment was not repeated in 2022. A fixed 28.9 °C temperature scenario, based on the mean TA from June–September 2021 was also introduced.
To reduce sidewall heating effects and allow positional randomization, all experimental pots were placed inside larger insulated containers equipped with wheels.
Environmental parameters (TA, PPFD, RH, and VPD) were continuously monitored using integrated electronic sensors. VPD was calculated based on TA and RH using Eqs (6) and (7)[25,26].
$ S V P= 610.78{e}^{\frac{17.2694\times T}{T+237.3}} $ (6) $ V P D=S V P\left(1 -\dfrac{RH}{100}\right) $ (7) where, T is the TA (°C) inside the chamber. The unit of both saturation vapor pressure (SVP) and VPD is kPa.
Data analysis
-
In the experimental section, analysis of variance was employed to assess mean differences among multiple climate scenarios. Subsequently, Tukey's Honestly Significant Difference (HSD) test was conducted for post-hoc analysis, with a family-wise error rate of 0.05. This approach enabled the comparison of all possible pairs of group means while controlling for Type I error. The significance threshold was set at α = 0.05, ensuring a conservative evaluation of differences in means across the groups. All statistics are performed on Python (version 3.10) with SciPy and Statsmodels packages. All data charts were generated using Python.
-
Using high-precision sensors, the AmbControl facilities (Fig. 1) accurately captured ambient climatic dynamics during the rice growing seasons (April 22 to November 9). Figure 2 shows the frequency distributions of the 20-min mean ambient TA. No significant differences were detected among facilities at daily or seasonal scales (p > 0.05), indicating minimal experimental uncertainty due to equipment variability.
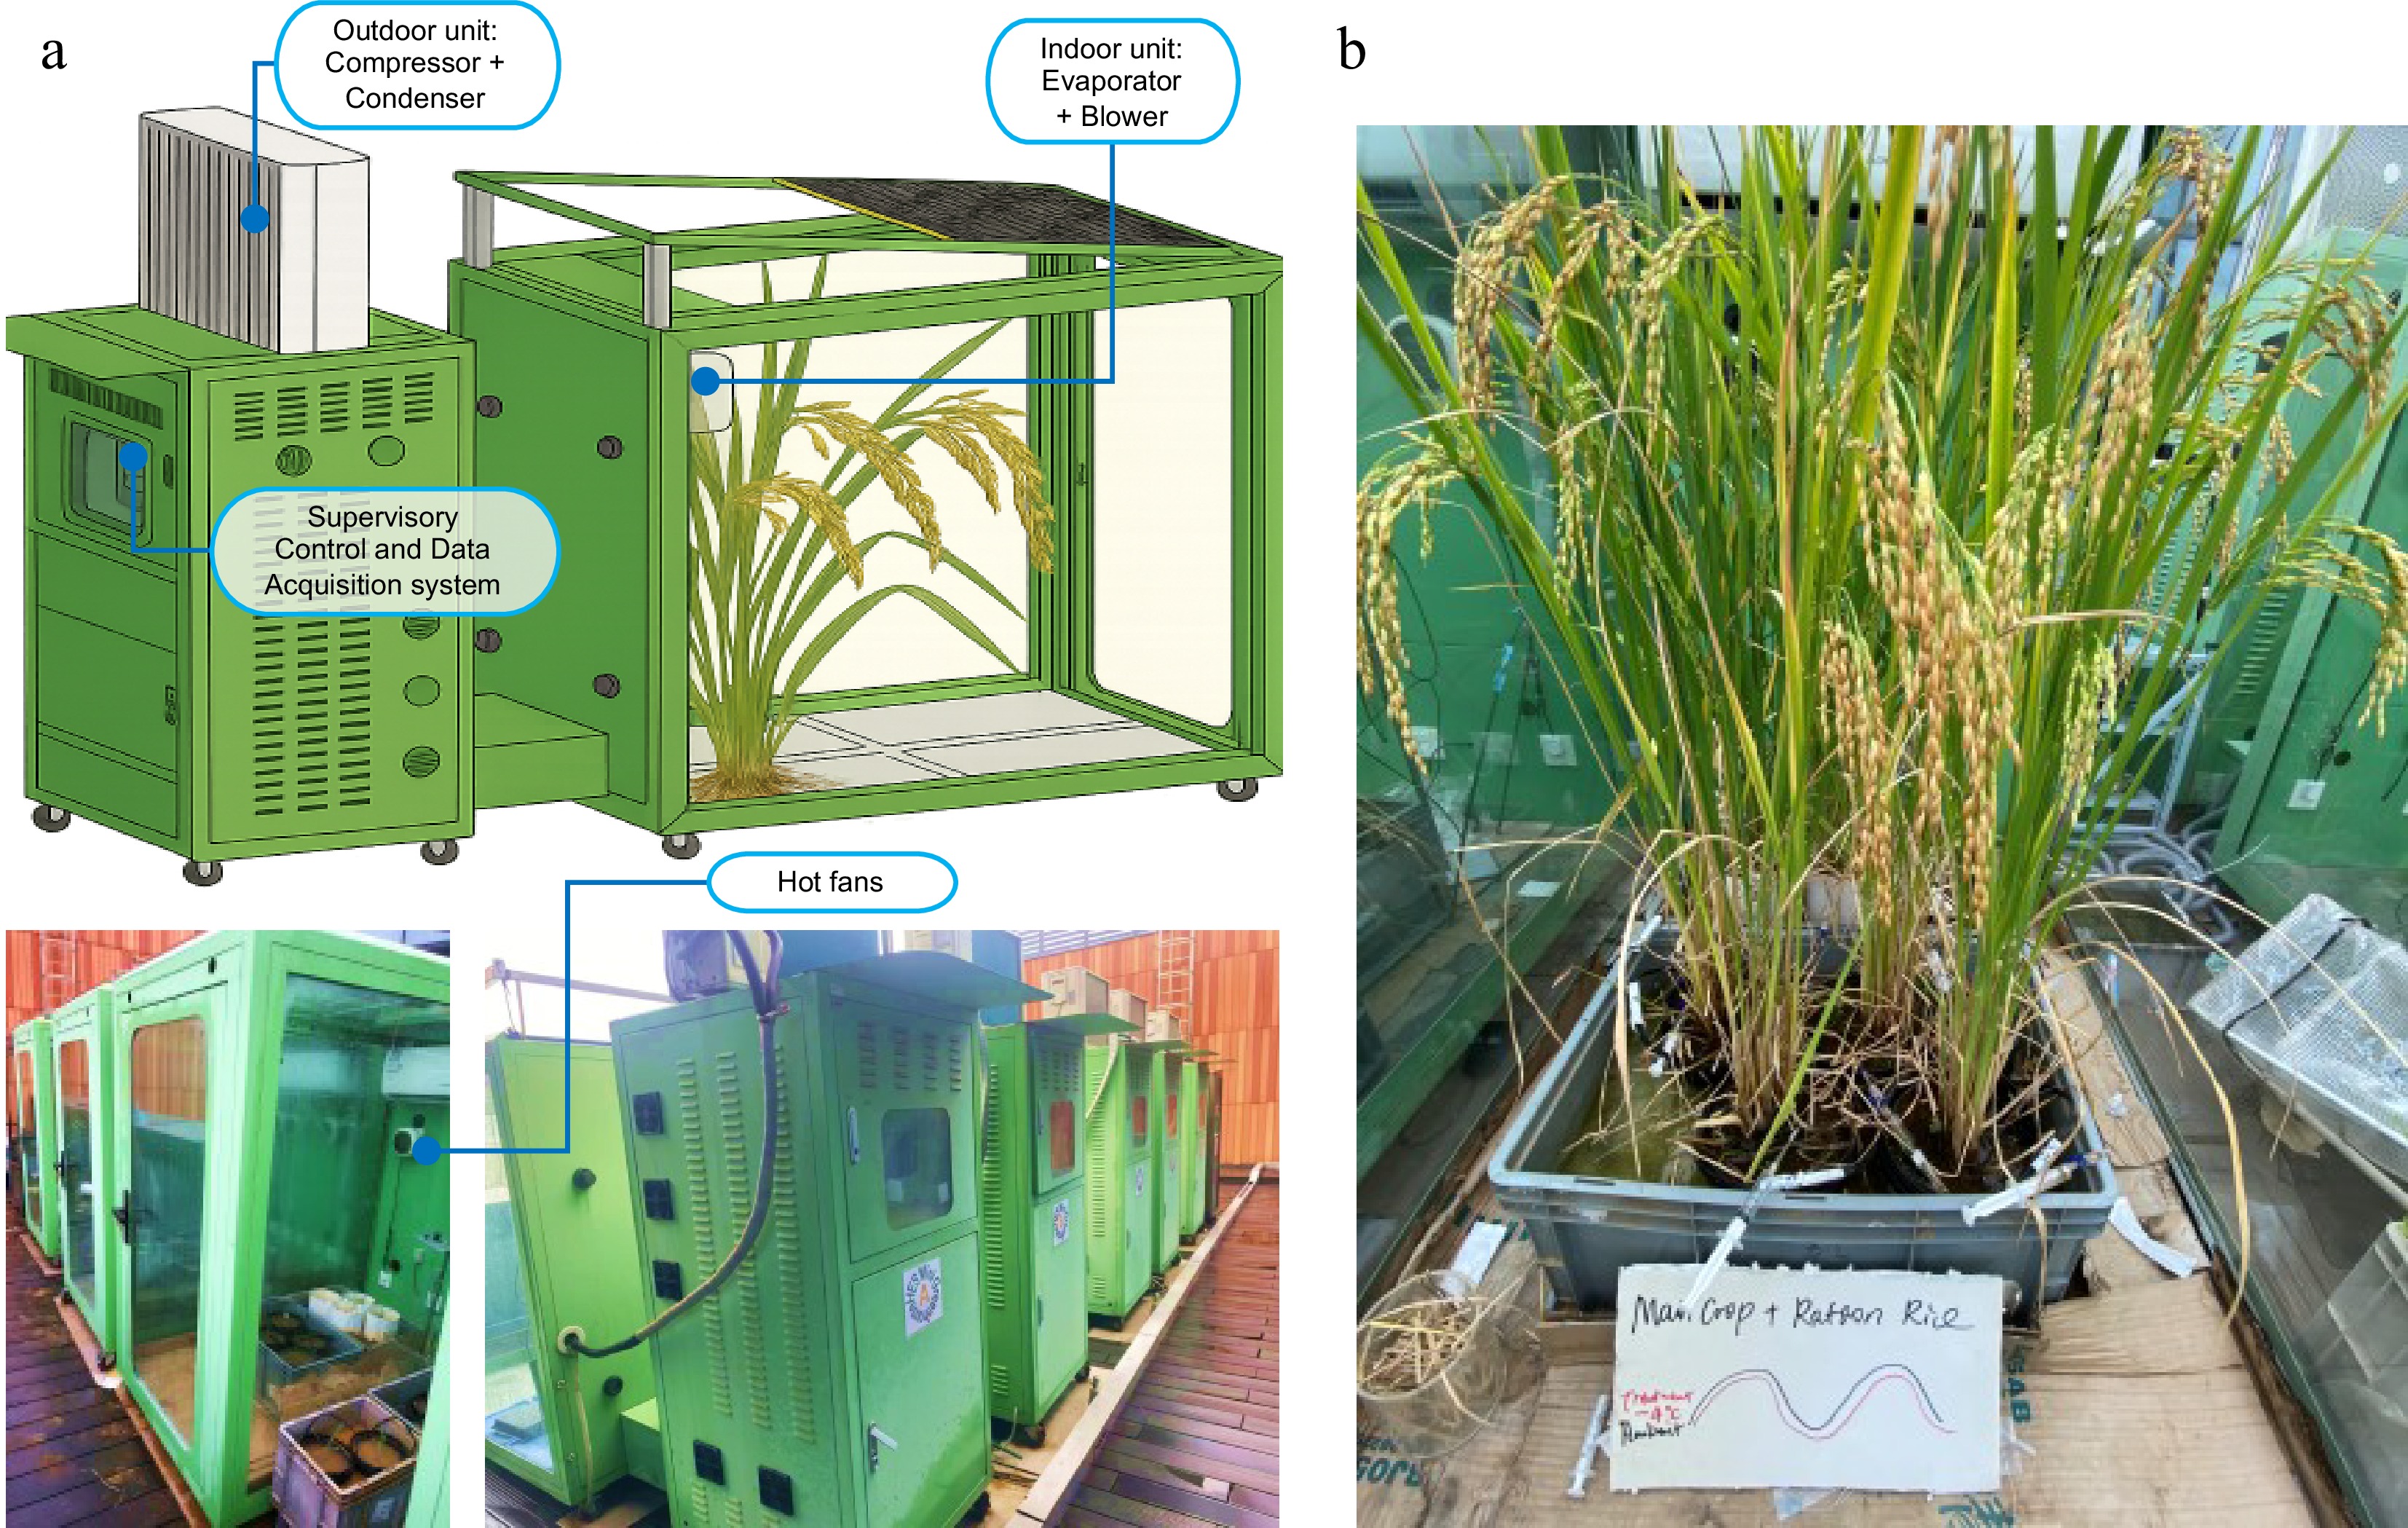
Figure 1.
(a) Diagram of the sunlit AmbControl facility. Each unit contains one 1,895 W cooling-only air conditioner and two 500 W hot fans. Facilities are portable and can be relocated between fields. Conditioned air is mixed around the canopy level. (b) Rice has grown to maturity inside an AmbControl unit.
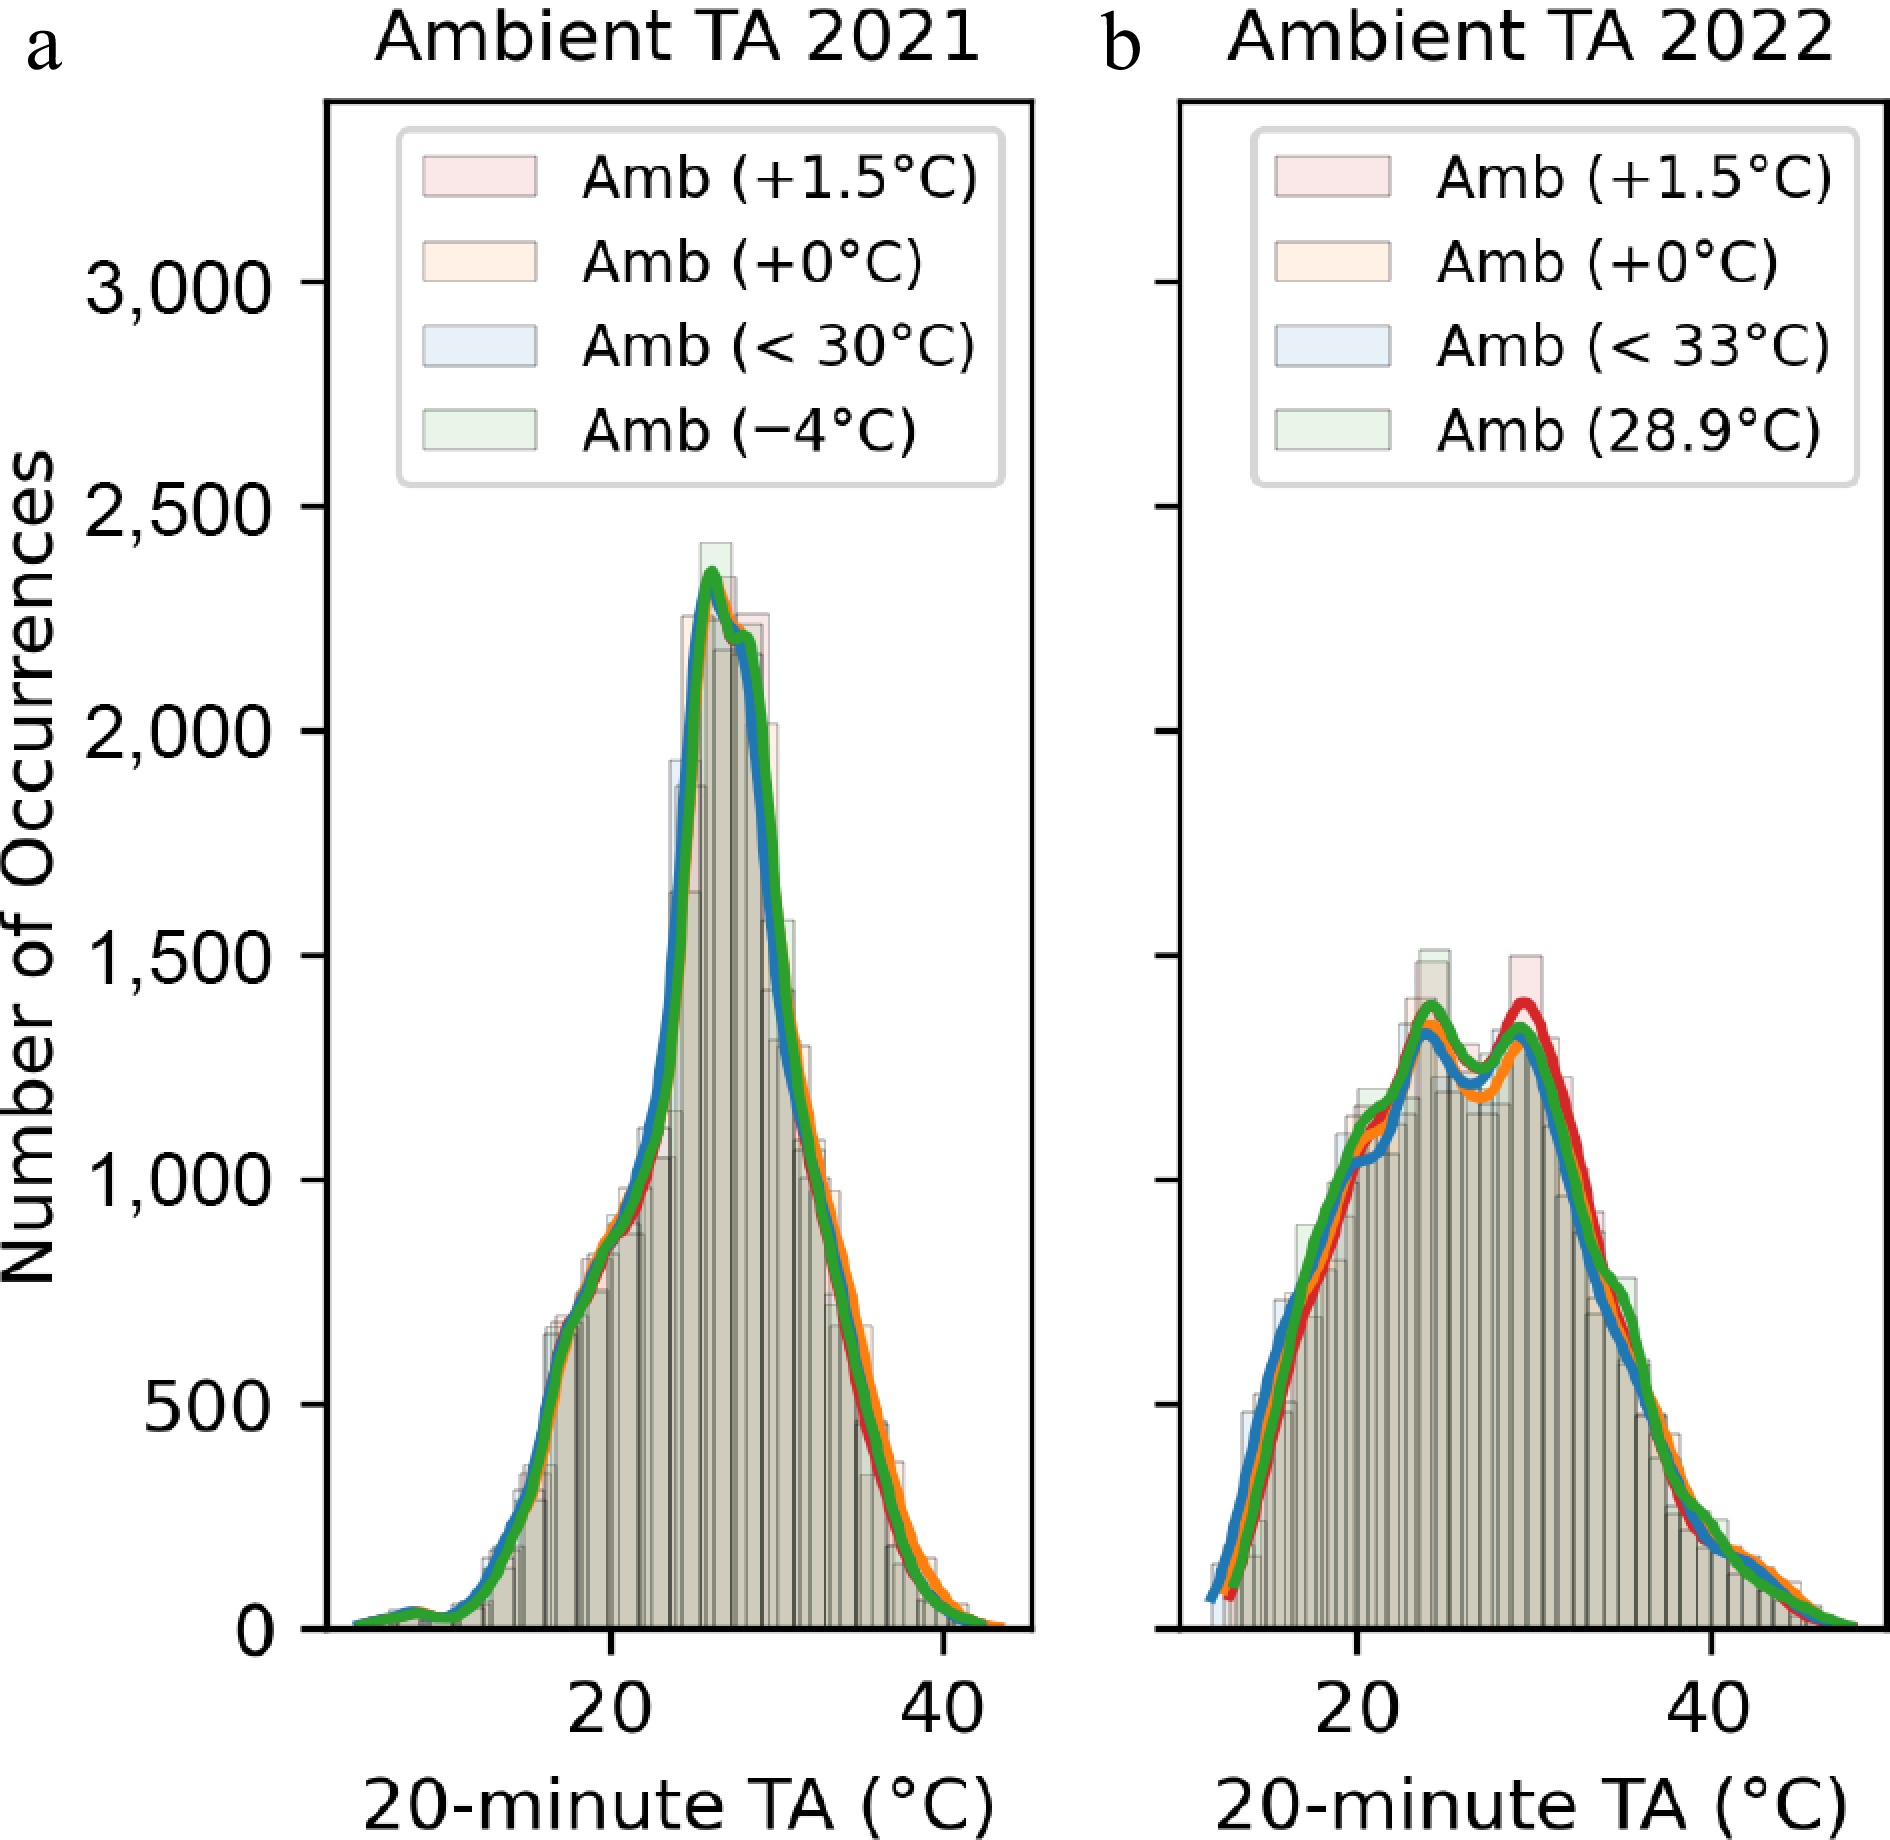
Figure 2.
Temperature sensor stability and reproducibility among four AmbControl units in the years (a) 2021 and (b) 2022.
In 2021, TA exceeded 36.1 °C for 2.5% of observations and 40 °C for 0.2%. These corresponded to 48 and 7 d above the respective thresholds. In 2022, exceedance frequencies increased to 7.6% (> 36.1 °C) and 2.6% (> 40 °C), representing 64 and 27 d. Based on the heatwave definition, five prolonged events (27 d total) occurred in 2021, and three (50 d total) in 2022. The latter coincided with the East Asian monsoon region's driest and hottest summer in over six decades.
Frequency distribution of 20-min ambient TA measured at 1.5 m above the ground from April 22 to November 9 in 2021 and 2022. Kernel Density Estimation (KDE) was used to plot distribution curves. Curves represent ambient reference temperatures outside different AmbControl units, illustrating sensor consistency and baseline environmental conditions. Differences between years reflect natural interannual variability in local climate.
Temperature control performance
-
Internal TA was regulated by the air-conditioning compressor and hot fans until the per-minute variance was < 0.3 °C, closely following real-world fluctuations. This synchronization mode served as the ambient control. TA, light, and RH were logged at 1-min intervals; VPD was calculated from TA and RH.
Temperature control accuracy was assessed by calculating ΔT (internal − external TA) and plotting distributions using KDE. For the +0 °C (ambient) scenario, seasonal mean ΔT was not significantly different from zero, confirming precise control. Under +1.5 °C settings, seasonal mean TA matched the target, but diurnal and nocturnal ΔT averaged +1.8 and +1.0 °C, respectively. This suggests a minor daytime cooling lag under strong solar radiation and enhanced nighttime heat loss through the glass walls. These deviations are primarily attributable to imbalances in surface energy fluxes, where sensible heat accumulation during the day lags due to the thermal inertia of chamber materials, while nighttime cooling is amplified by radiative losses and reduced latent heat exchange.
In milder climate scenarios, instantaneous ΔT during heat spells reached ±12 °C, yet seasonal averages were only −0.6 and −0.5 °C, with peaks statistically indistinguishable from zero. Such short-term fluctuations are rarely reported in previous studies, likely due to lower temporal resolution, but may be critical as plants respond more strongly to transient extremes than to seasonal means.
Photosynthetic photon flux density (PPFD)
-
PPFD varied greatly on diurnal and seasonal scales in both years, with an overall mean of 373 ± 365 µmol·m−2·s−1 (range: 0–2,323, Fig. 4a and Table 1). The fluctuations alternated between light-saturated conditions (e.g., > 1,200 µmol·m−2·s−1), where photosynthesis is limited by CO2 or enzymatic capacity rather than light, and light-limited conditions (e.g., < 400 µmol·m−2·s−1), where insufficient irradiance constrains photosynthetic rates[27,28]. Seasonal PPFD patterns mirrored TA fluctuations, peaking during grain filling in August with daytime means > 500 µmol·m−2·s−1.
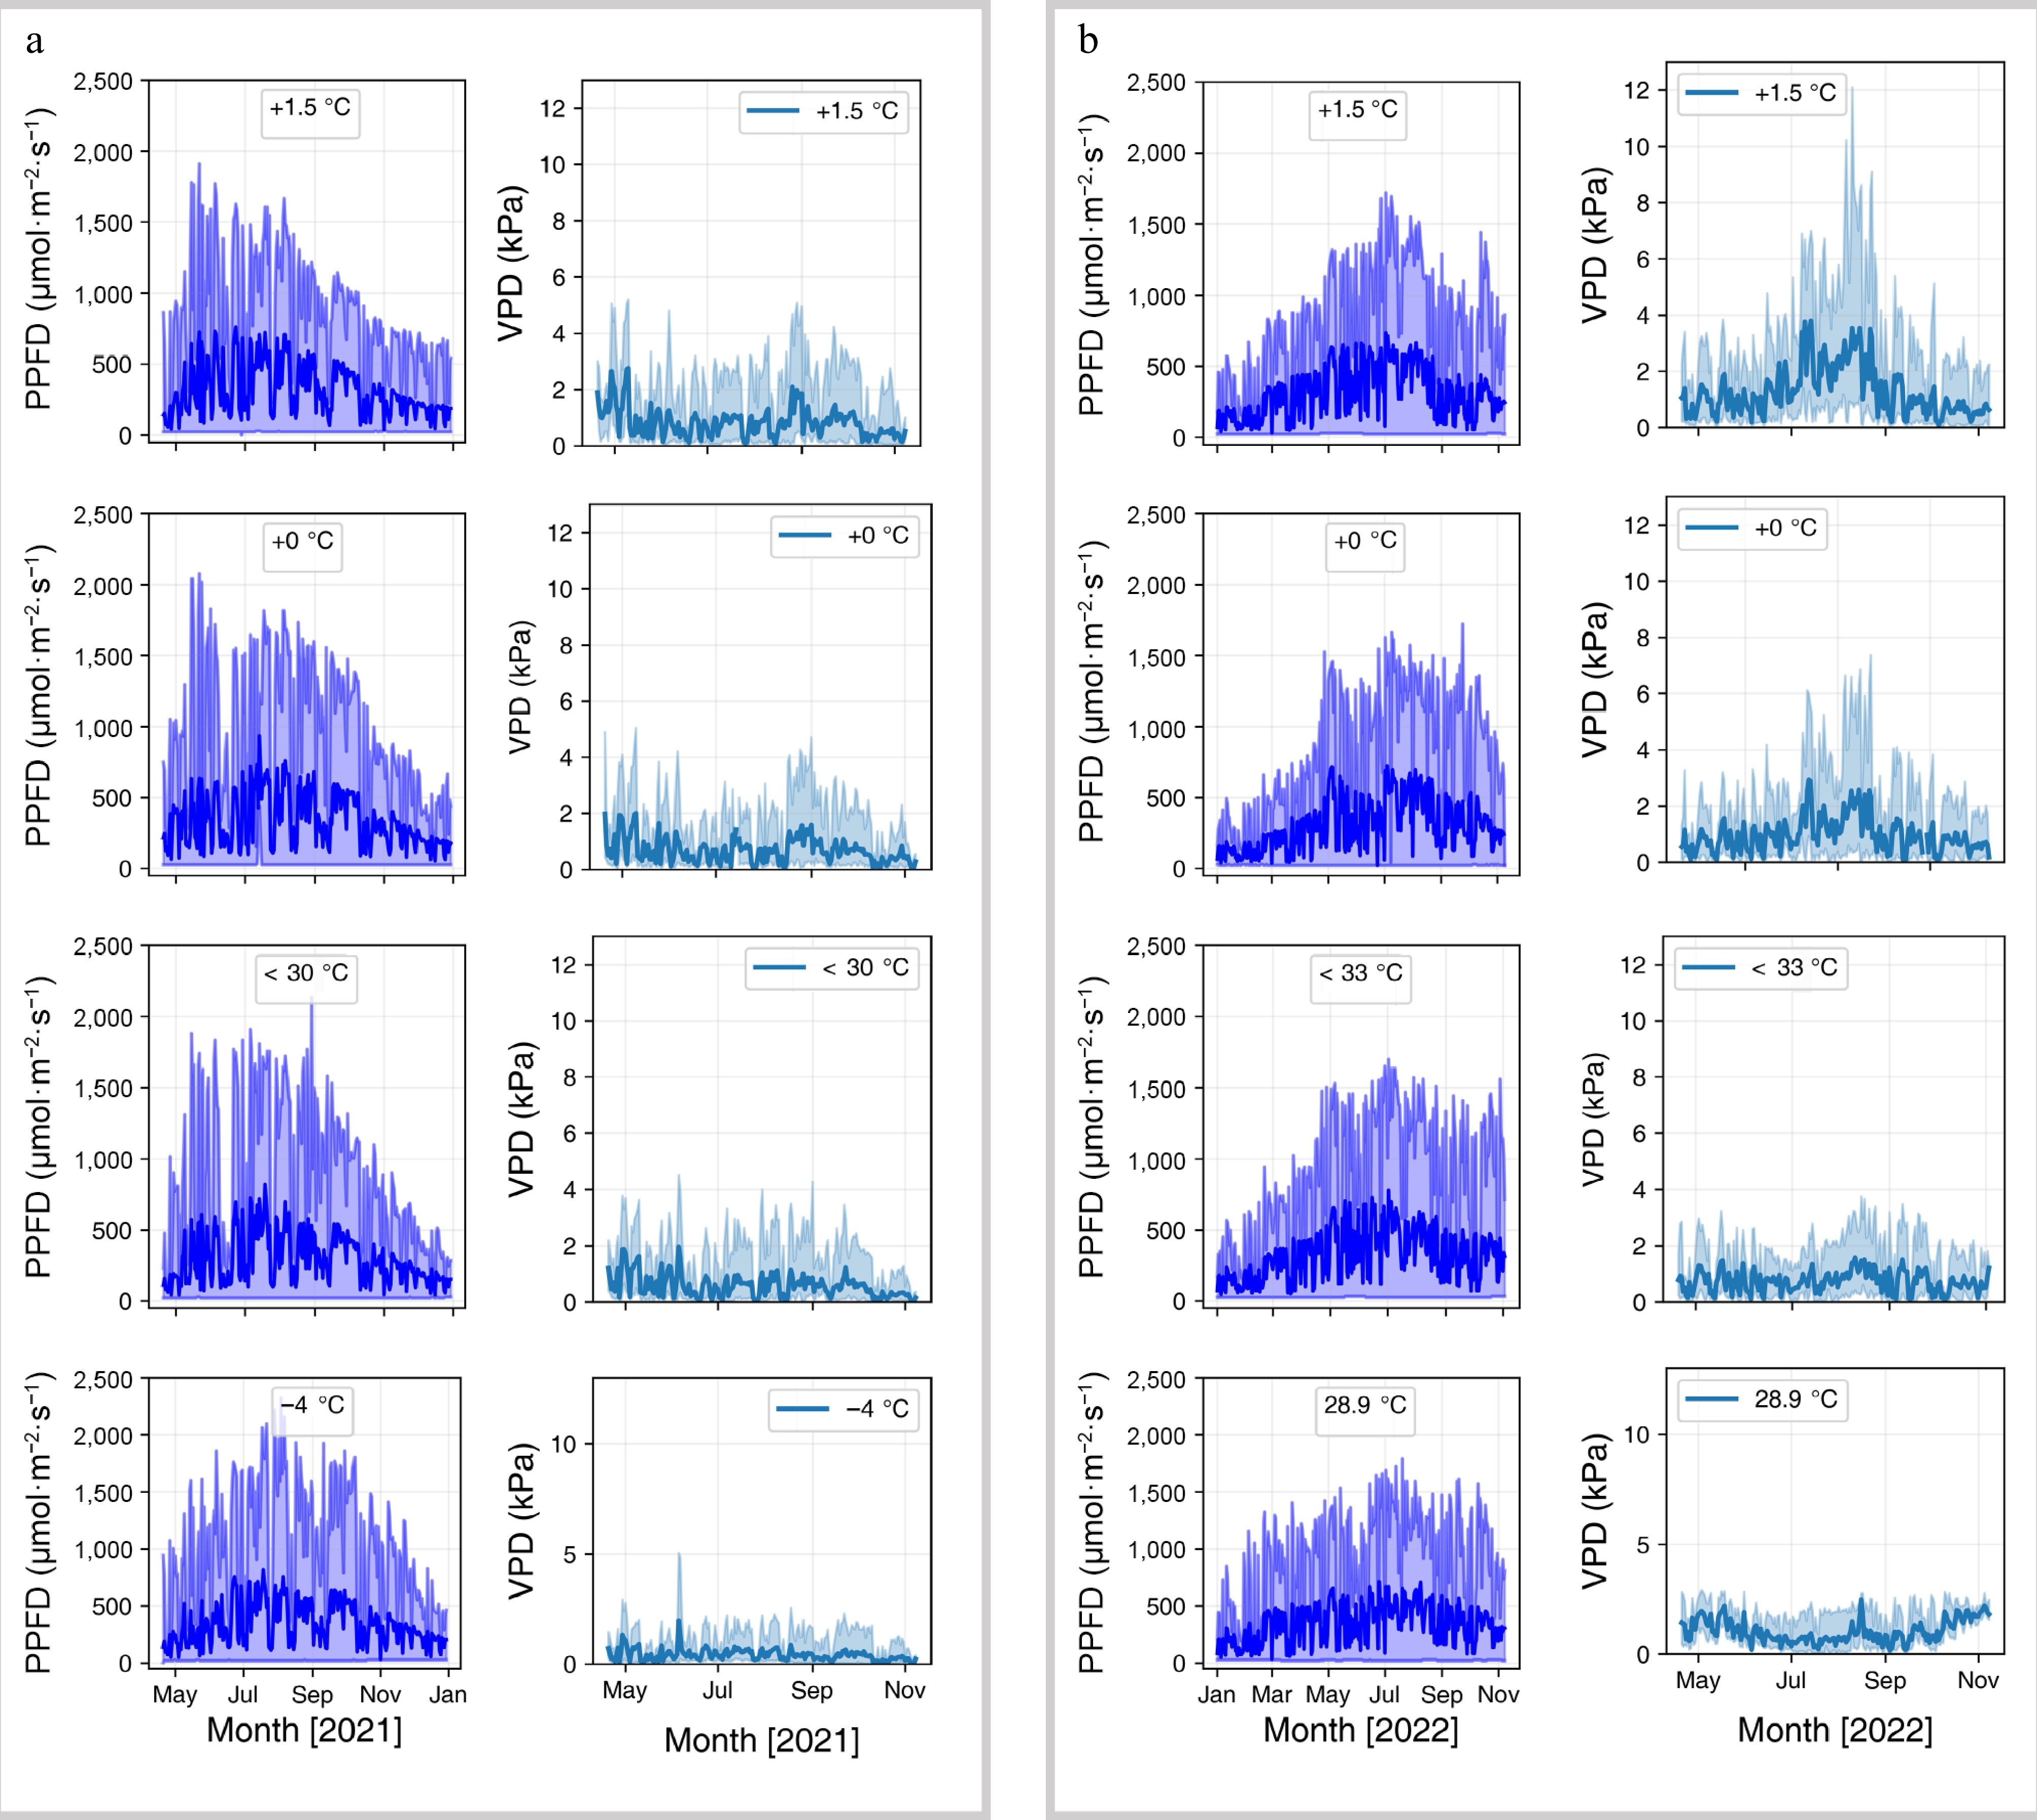
Figure 4.
(a) PPFD (daytime only), and (b) VPD fluctuations at 20 min resolution for 2021 and 2022. Bold lines are daily means. Temperature treatments as in Fig. 3. PPFD was measured at the canopy level within each AmbControl unit; small differences among units reflect partial shading by rice leaves and minor variation in glass transmissivity due to dust deposition (despite weekly cleaning). VPD is a function of both TA and humidity and thus diverges among units under different temperature treatments. Interannual climatic variability accounts for the differences observed between 2021 and 2022.
Table 1. Seasonal PPFD and VPD statistics for all treatments in 2021 and 2022.
Features Unit 2021 2022 +1.5 °C +0 °C < 30 °C −4 °C +1.5 °C +0 °C < 33 °C Fixed 28.9 °C Mean PPFD† μmol·m−2·s−1 353 367 325 367 371 433 385 383 Standard deviation 338 386 364 386 338 376 378 356 Minimum PPFD 0 26 22 18 22 22 26 18 Maximum PPFD 1,911 2,078 2,132 2,323 1,723 1,722 1,699 1,788 Mean VPD KPa 1.3 1.1 0.9 0.7 2.0 2.0 1.1 1.3 Standard deviation 1.0 0.9 0.8 0.6 1.6 1.4 0.7 0.6 Minimum VPD 0.029 0.017 0.012 0.013 0.039 0.016 0.017 0.038 Maximum VPD 5.2 5.0 4.5 5.1 12.1 7.4 3.8 2.9 † PPFD is calculated from daytime hours: 6:30 to 17:30. In 2021, mean daytime PPFD (6:30–17:30) across all AmbControl facilities was 353 ± 369 µmol·m−2·s−1, ranging from 0 to 2,323 μmol·m−2·s−1. No statistically significant differences were observed among facilities (p > 0.05). In 2022, mean daytime PPFD increased to 393 ± 362 µmol·m−2·s−1, significantly higher than 2021 (p < 0.01), reflecting the drier, sunnier growing season.
Vapor pressure deficit (VPD)
-
VPD dynamics mirrored TA changes and were highly variable across scenarios (Fig. 4b, Table 1). The seasonal mean VPD across all scenarios was 1.3 ± 0.9 kPa (range: 0.012–12.1 kPa). Because VPD increases non-linearly with TA, temperature manipulations within AmbControl units translated into substantial VPD differences among scenarios. Using the TA threshold of 36.1 °C, the corresponding abnormal VPD was approximately 0.86 kPa. Only the −4 °C scenario, maintained 4 °C below ambient, had a seasonal mean VPD below this value (0.7 kPa). In 2022, the ambient (+0 °C) scenario had a mean VPD of 2.0 kPa (range: 0.016–7.4 kPa), substantially larger than in 2021. These results show that TA manipulations can substantially alter VPD inside AmbControl units despite continuous ventilation. Therefore, VPD should be considered a potential confounding factor when interpreting plant responses to heat treatments.
-
This discussion examines AmbControl, SPAR chambers, PhenoSphere, conventional greenhouses, and the temperature free-air controlled enhancement (T-FACE) system with respect to key functional features essential for controlled environment studies. The performance of AmbControl is evaluated directly based on the measurements obtained in this study to indicate that AmbControl facilities receive natural sunlight for supporting rice growth, and can replicate and manipulate the dynamics of naturally occurring heatwaves by heating and cooling the internal AT by high temporospatial resolution (0.3 °C). These features are compared with SPAR, PhenoSphere, greenhouse, and T-FACE systems for plant-soil warming studies[14,19,21]. Rather than ranking systems as better or worse, the comparison highlights whether specific functionalities are present or absent. Many detailed evaluations of sunlit field systems in experimental rising CO2 experiments have been comprehensively discussed[14,19,21]. Here, the key features of experimental warming systems are the focus (Table 2).
Table 2. Comparison of the features of five types of facilities for conducting temperature manipulation experiments.
No. Key features AmbControl SPAR PhenoSphere Greenhouse T-FACE Control precision 1 Heating control YES. Heating air YES. Heating air YES. Heating air VARIABLE. Natural control YES. Heating subjects directly PhenoSphere > AmbControl ≥ SPAR > T-FACE > Greenhouse 2 Cooling control YES. Cooling air YES. Cooling air YES. Cooling air VARIABLE. Natural ventilation NO. AmbControl ≥ SPAR ~ PhenoSphere > Greenhouse ~ T-FACE 3 Akin to ambient temperature fluctuations YES. Precisly
(± 0.3 °C)YES. Precisly YES. Moderate, using a sinus curve simulation YES. Moderate. Piecewise constant or natural YES. Precisly AmbControl ~ SPAR ~ PhenoSphere > T-FACE ~ Greenhouse 4 Control and data-logging system Detailed control Detailed control Detailed control Weather-fed Detailed control PhenoSphere ~ SPAR ~ AmbControl > T-FACE > Greenhouse 5 Sunlight YES. Near sunlight due to glass
filteringYES. Near sunlight due to glass
filteringNO. LED simulation using historical
dataYES. Near sunlight due to glass
filteringYES. Natural sunlight T-FACE ≥ AmbControl ~ SPAR ~ Greenhouse > PhenoSphere 6 Humidity control No control Detailed control Detailed control No control No control SPAR ≥ PhenoSphere > > T-FACE ~ AmbControl ~ Greenhouse 8 Root zone size VARIABLE. Various soil containers Medium soil container, typically 60–100 cm VARIABLE. Various soil containers VARIABLE. Natural on-site soil or various soil containers Natural on-site soil T-FACE > Greenhouse ≥ AmbControl ~ SPAR ~ PhenoSphere 10 Portability and movability YES YES NO NO NO AmbControl > SPAR ~ PhenoSphere ~ Greenhouse ~ T-FACE Heating and cooling control
-
Mimicking ambient temperature fluctuations is vital for creating field-like conditions. The ability of climate-control systems to replicate heatwave conditions depends on their precise heating and cooling capabilities, which are crucial for simulating the heat stress that plants experience. In this study, AmbControl reliably reproduced diel temperature cycles and heatwave events at 20 min resolution across two rice-growing seasons. SPAR chambers primarily regulate temperatures using electric heaters combined with cooling coils and forced air circulation, enabling precise diel control in confined chambers[14]. The whole-ecosystem warming platform in northern Minnesota employs resistance heating cables embedded in soil together with overhead infrared heaters, providing large-scale soil and air warming but lacking cooling capacity, thus restricting experiments to warming-only scenarios. The PhenoSphere integrates heat pumps with air-based heating and cooling systems, allowing fine-scale control of diel and seasonal cycles and simulating highly dynamic climates, although its ability to handle sudden natural heatwaves has not been tested[21]. AmbControl combines electric heating with an efficient air-based cooling system, which enables bidirectional manipulation of TA in sunlit field conditions. This dual functionality allows AmbControl not only to replicate the onset of natural heatwaves but also to create cooling treatments that are otherwise unavailable in field settings, thereby providing unique opportunities for establishing realistic no-heatwave controls in crop studies. Among these systems, only AmbControl has been tested directly under natural heatwave conditions. By contrast, T-FACE and many conventional greenhouses rarely report detailed time-series temperature control data, often only seasonal mean increases (e.g., +2 ± 1 °C)[29]. This implies hourly-scale control uncertainty was > 1 °C, which was larger than AmbControl precision. Furthermore, T-FACE lacks intrinsic cooling, restricting its use when cooling is needed to create realistic non-stress scenarios. Greenhouse environments naturally offer some passive temperature modulation via ventilation, but this is less controllable and more variable, suitable only for studies where natural fluctuations are desired.
Light environment
-
T-FACE allows for natural sunlight exposure without filtration, closely followed by greenhouse structures, AmbControl, and SPAR platforms, where glass may marginally restrict light penetration[14]. The PhenoSphere, which uses LED lighting to simulate sunlight, does not provide the full spectrum of natural light, potentially influencing plant photophysiology. However, it can reproduce ambient environments with high reproducibility[21].
Humidity and VPD control
-
Relative humidity is crucial for studying transpiration and water stress. The SPAR and PhenoSphere systems offer stringent manipulation of RH, surpassing the capabilities of AmbControl and greenhouses, where RH fluctuates according to environmental conditions. Precise RH control is advantageous for isolating the individual effects of plant responses to changes in air moisture[30]. In the AmbControl facility, an RH control module can be added in the future, which is important for comparing plant responses to wet and dry heatwaves.
Root-zone and pot size considerations
-
T-FACE and open-field experiments allow unrestricted root development. AmbControl uses large soil containers to approximate field root volumes but may not fully replicate in-soil rooting depth and heterogeneity. When root dynamics are a primary response variable, consider larger containers or in-ground installations where feasible.
Portability and experimental design flexibility
-
A distinctive feature of the AmbControl facility is its portability. Each unit can be relocated across field plots without compromising temperature regulation precision (± 0.3 °C), as confirmed by the present relocation tests during the rice seasons. This feature enables block randomization within heterogeneous fields and facilitates replication across experimental sites, which is not feasible with fixed infrastructures such as SPAR chambers, PhenoSphere, or conventional greenhouses. T-FACE installations are also generally fixed to specific field plots. Portability therefore, represents not only a logistical advantage, but also a scientific one, as it allows researchers to minimize site-specific biases, conduct multi-site trials, and integrate temperature manipulations into breeding or agronomic management experiments. In this respect, AmbControl expands the flexibility of experimental design while maintaining high temporal and spatial resolution of climate control.
However, the choice of system depends on research objectives. PhenoSphere excels in reproducibility and multisite standardization; SPAR and AmbControl are ideal for process studies that require a semi-natural light environment with controlled atmospheric conditions; T-FACE is appropriate when unmodified natural sunlight and in-situ rooting are required. AmbControl's demonstrated ability to reproduce natural heatwaves, and to both heat and cool environments makes it a practical and cost-effective platform for investigating plant–soil responses to realistic extreme events.
Comparison with previous studies and applications
-
The present results show that AmbControl effectively reproduces natural diel temperature cycles and heatwave events, with reproducibility across independent units (Figs 2, 3). This performance aligns with earlier reports from SPAR chambers and PhenoSphere systems, which also demonstrated precise control of diurnal fluctuations[14,21]. However, unlike most previous studies, AmbControl has been validated under naturally occurring heatwaves, providing stronger evidence for its utility in simulating extreme events in subtropical rice systems.
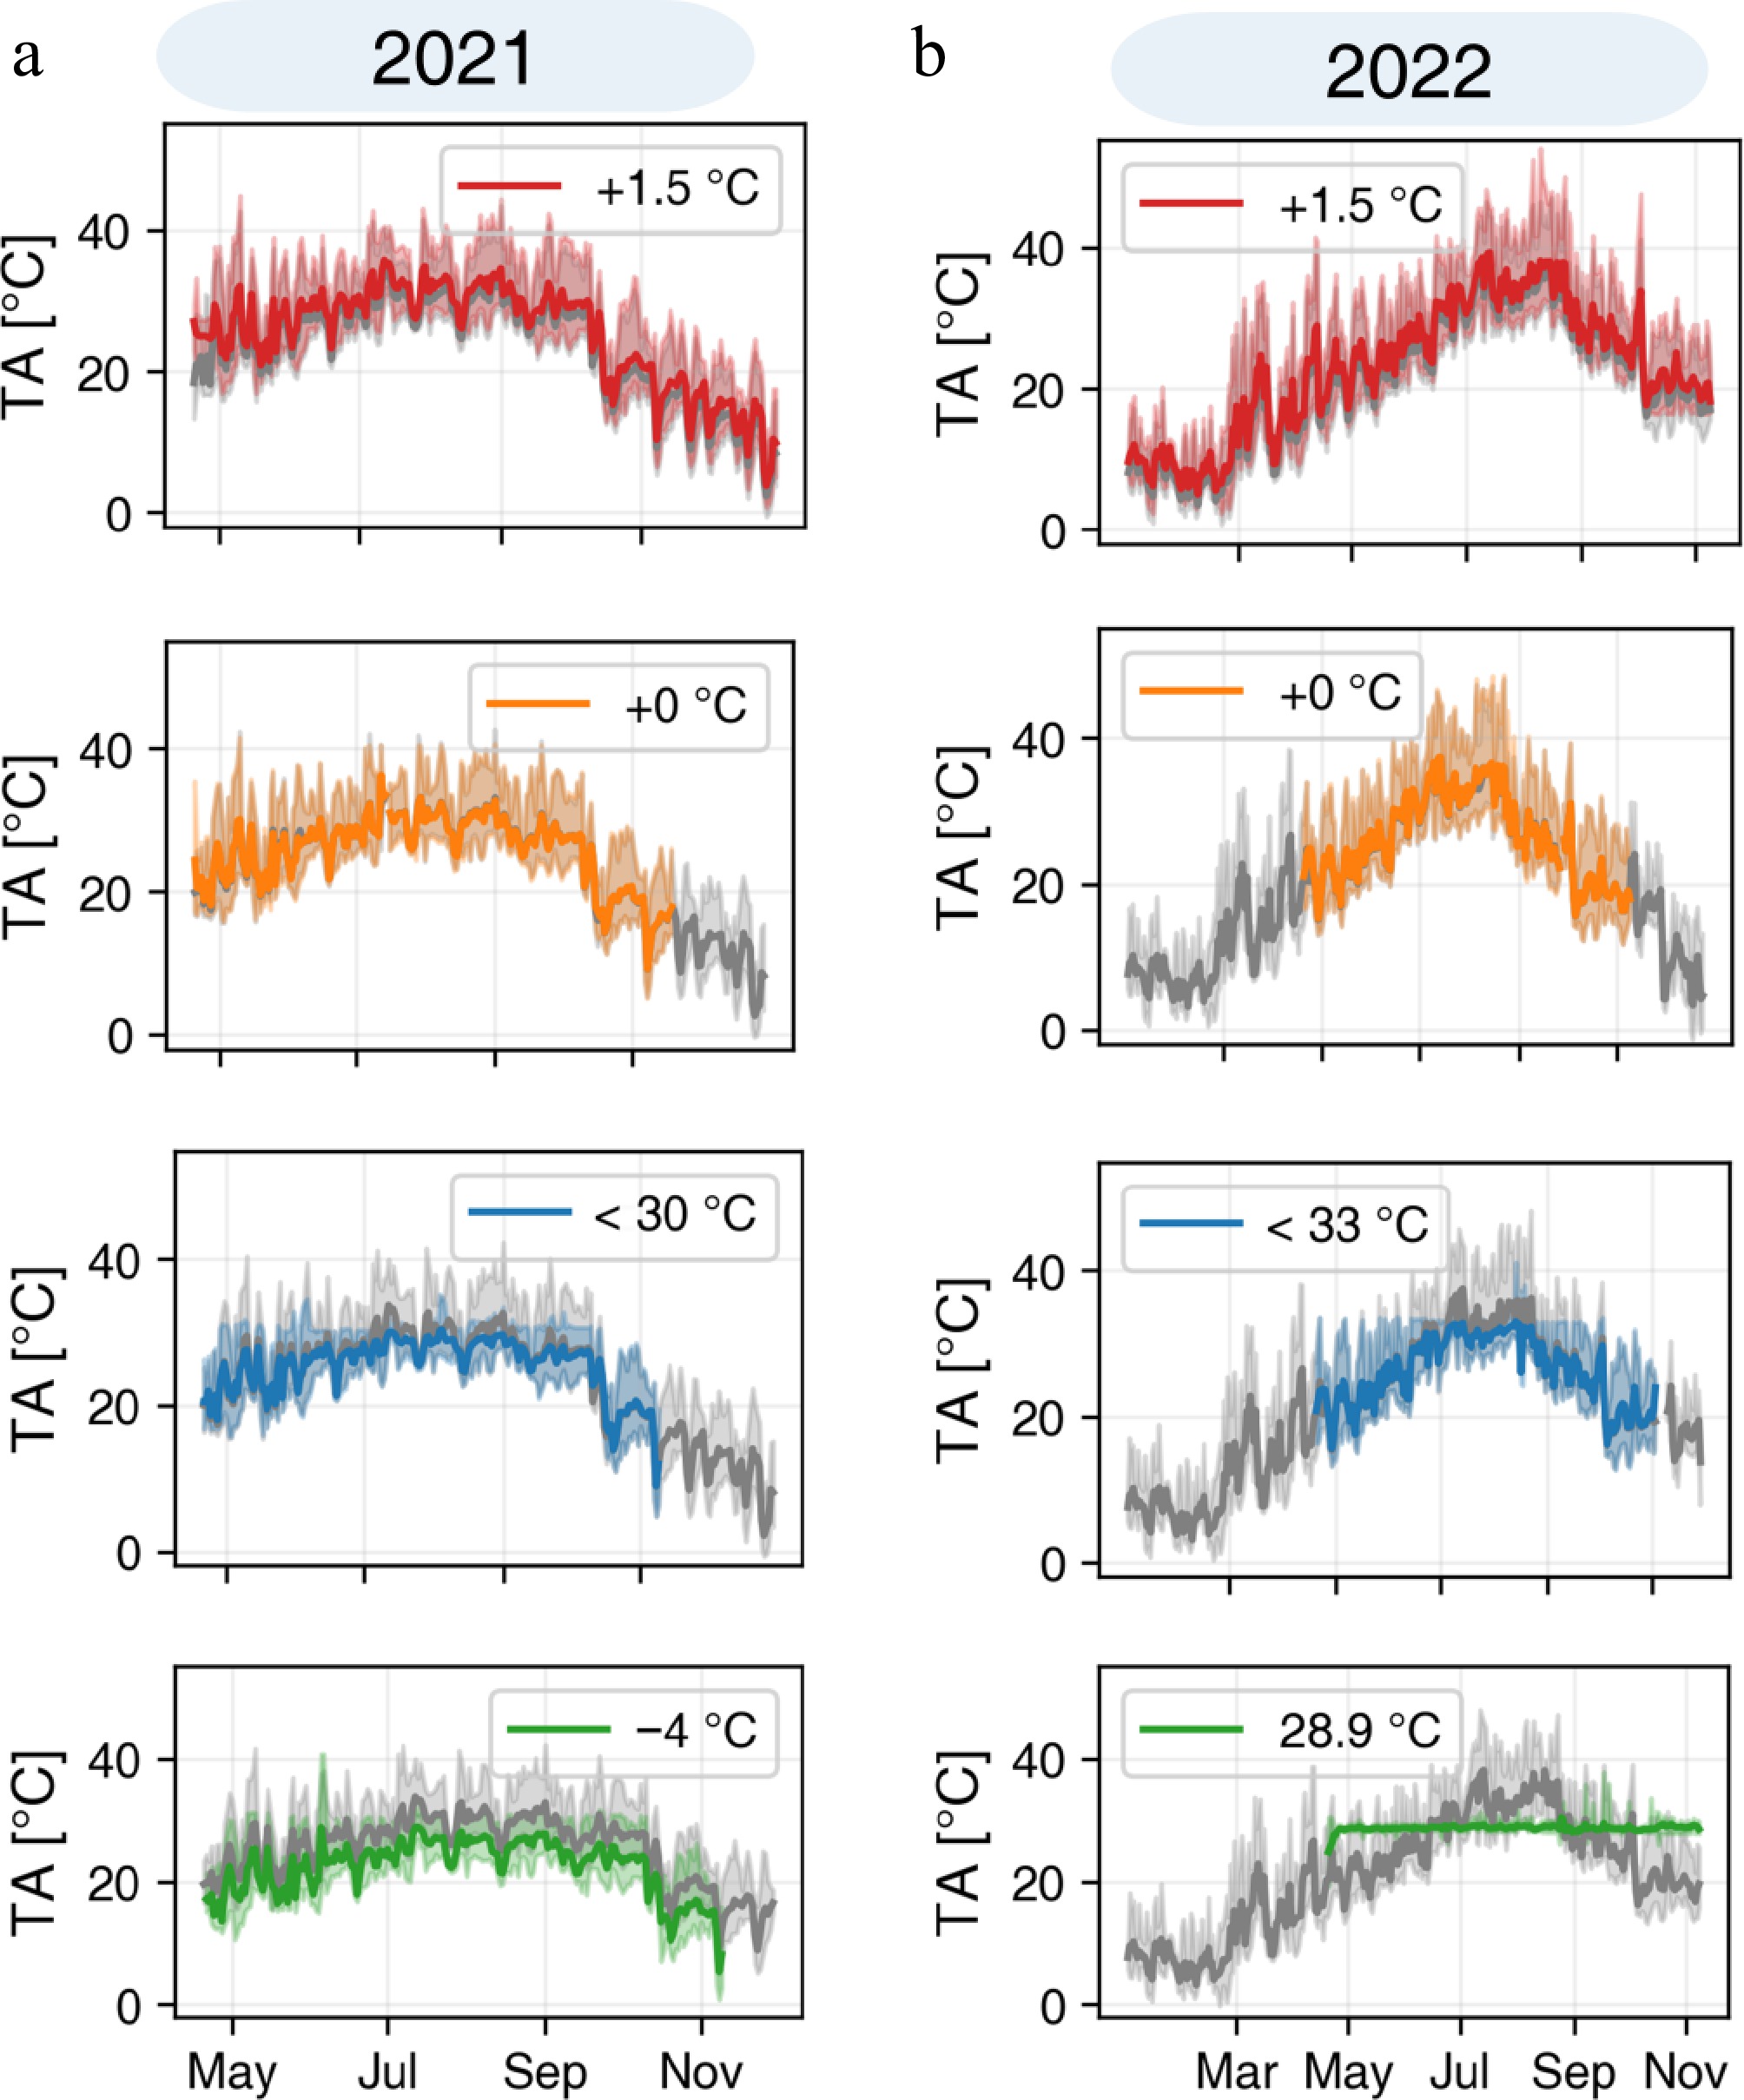
Figure 3.
(a), (b) Twenty-minute canopy TA in 2021 and 2022, respectively. Gray curves show ambient TA from independent AmbControl units. 2021 scenarios: +1.5 °C, +0 °C, Tmax < 30 °C, and −4 °C. 2022 scenarios: +1.5 °C, +0 °C, Tmax < 33 °C, and constant 28.9 °C (mean TA from June–September 2021).
In terms of crop responses, our multi-scenario design (+1.5 °C, Tmax thresholds, and −4 °C) parallels the climate targets discussed in recent crop-climate studies (e.g., IPCC 1.5 °C scenario), while also mimicking temperate vs subtropical growing environments. This dual capacity has not been reported in prior SPAR or T-FACE studies, where experiments generally focused on either warming or ambient comparisons without incorporating mitigation scenarios.
From an application perspective, AmbControl enables quantitative evaluation of plant–soil responses to realistic heat extremes while retaining portability and replication capacity across sites. This makes it a practical complement to existing large-scale infrastructures. Its ability to combine both heating and cooling functions is particularly relevant for breeding programs targeting heat tolerance and for agronomic management trials under climate variability. Thus, AmbControl not only fills a methodological gap between fully enclosed chambers and free-air systems but also provides a cost-effective platform for multi-site, field-relevant climate manipulation experiments.
-
AmbControl reliably manipulated ambient temperature fluctuations across multiple units and across two rice seasons, supporting diverse temperature scenarios from elevated (+1.5 °C) to mitigated (−4 °C) and fixed setpoints (28.9 °C). While seasonal mean temperature control was high, diurnal differences in ΔT during heatwaves indicate opportunities to improve night-time heating and daytime cooling response times. Natural PPFD dynamics within the units provided a more realistic light environment than conventional chambers but increased variability relative to fully controlled indoor systems. Notably, temperature manipulations induced substantial changes in VPD, which should be accounted for in experimental designs and interpretation. Taken together, these results demonstrate that AmbControl is a field-relevant platform that can reproduce and manipulate realistic heat extremes in crop systems, providing a practical basis for future multi-site and crop–climate studies.
This work was financially supported by the National Key Research and Development Program of China (2023YFC3709100), the Strategic Priority Research Program of Chinese Academy of Sciences (XDB0750400), and the National Science Foundation of China (No. 42477116).
-
The authors confirm their contributions to the paper as follows: conceptualization, design and construction of AmbControl units, data curation, formal analysis, and writing − original draft: Sha Zhang; experimental support, sensor calibration, and data collection: Xiao Zhou; writing − review & editing: Xiao Zhou, Dong Zhu, Zheng Chen; project supervision, methodology, and resources: Zheng Chen; funding acquisition: Dong Zhu, Zheng Chen. All authors read and approved the submitted manuscript.
-
Data is available from the corresponding author upon reasonable request.
-
The authors declare that they have no conflict of interest.
- Copyright: © 2025 by the author(s). Published by Maximum Academic Press, Fayetteville, GA. This article is an open access article distributed under Creative Commons Attribution License (CC BY 4.0), visit https://creativecommons.org/licenses/by/4.0/.
-
About this article
Cite this article
Zhang S, Zhou X, Zhu D, Chen Z. 2025. Manipulating natural heatwaves in AmbControl chambers: bridging controlled and field conditions for warming studies in plant–soil systems. Technology in Agronomy 5: e016 doi: 10.48130/tia-0025-0012 

Manipulating natural heatwaves in AmbControl chambers: bridging controlled and field conditions for warming studies in plant–soil systems
- Received: 08 August 2025
- Revised: 10 September 2025
- Accepted: 30 September 2025
- Published online: 10 November 2025
Abstract: Quantifying the impact of natural heatwaves on crop productivity requires direct comparison with a no-heatwave control. Yet conventional growth chambers, which rely on artificial lighting and stepwise heating–cooling programs, fail to capture natural sunlight and temperature variability, often leading to biased estimates of heatwave effects. Field-based experiments, on the other hand, provide realistic growing conditions but lack precise temperature control, especially air cooling, making it technically and economically infeasible to establish no-heatwave controls when extreme events occur. Heatwaves are increasingly unavoidable in rice-growing regions, but localized air cooling, under natural sunlight, on a small scale, is technically feasible. To address this gap, AmbControl was developed, a sunlit field chamber system designed to manipulate air temperature without altering natural light dynamics. The results showed that AmbControl successfully replicated the dynamics of natural heatwaves recorded in 2021 and 2022, enabling precise control of air temperature from +1.5 to −4 °C relative to ambient, as well as maintaining a fixed 28.9 °C treatment. Under +1.5 °C warming, daytime and nighttime temperatures were maintained within Δ1.8 °C and Δ1.0 °C of target values, respectively. Relative humidity and vapor pressure deficit co-varied with temperature treatments, highlighting RH as a potential confounding factor in warming studies. By combining environmental precision with field realism, AmbControl offers a versatile, field-relevant platform for directly quantifying plant–soil responses to extreme heat, with the objective of generating field-validated data that can be integrated into crop and climate models, to improve projections of crop resilience under future climate scenarios.
-
Key words:
- Heatwave /
- Climate control /
- AmbControl /
- Experimental warming /
- Plant–soil interactions /
- Rice system