-
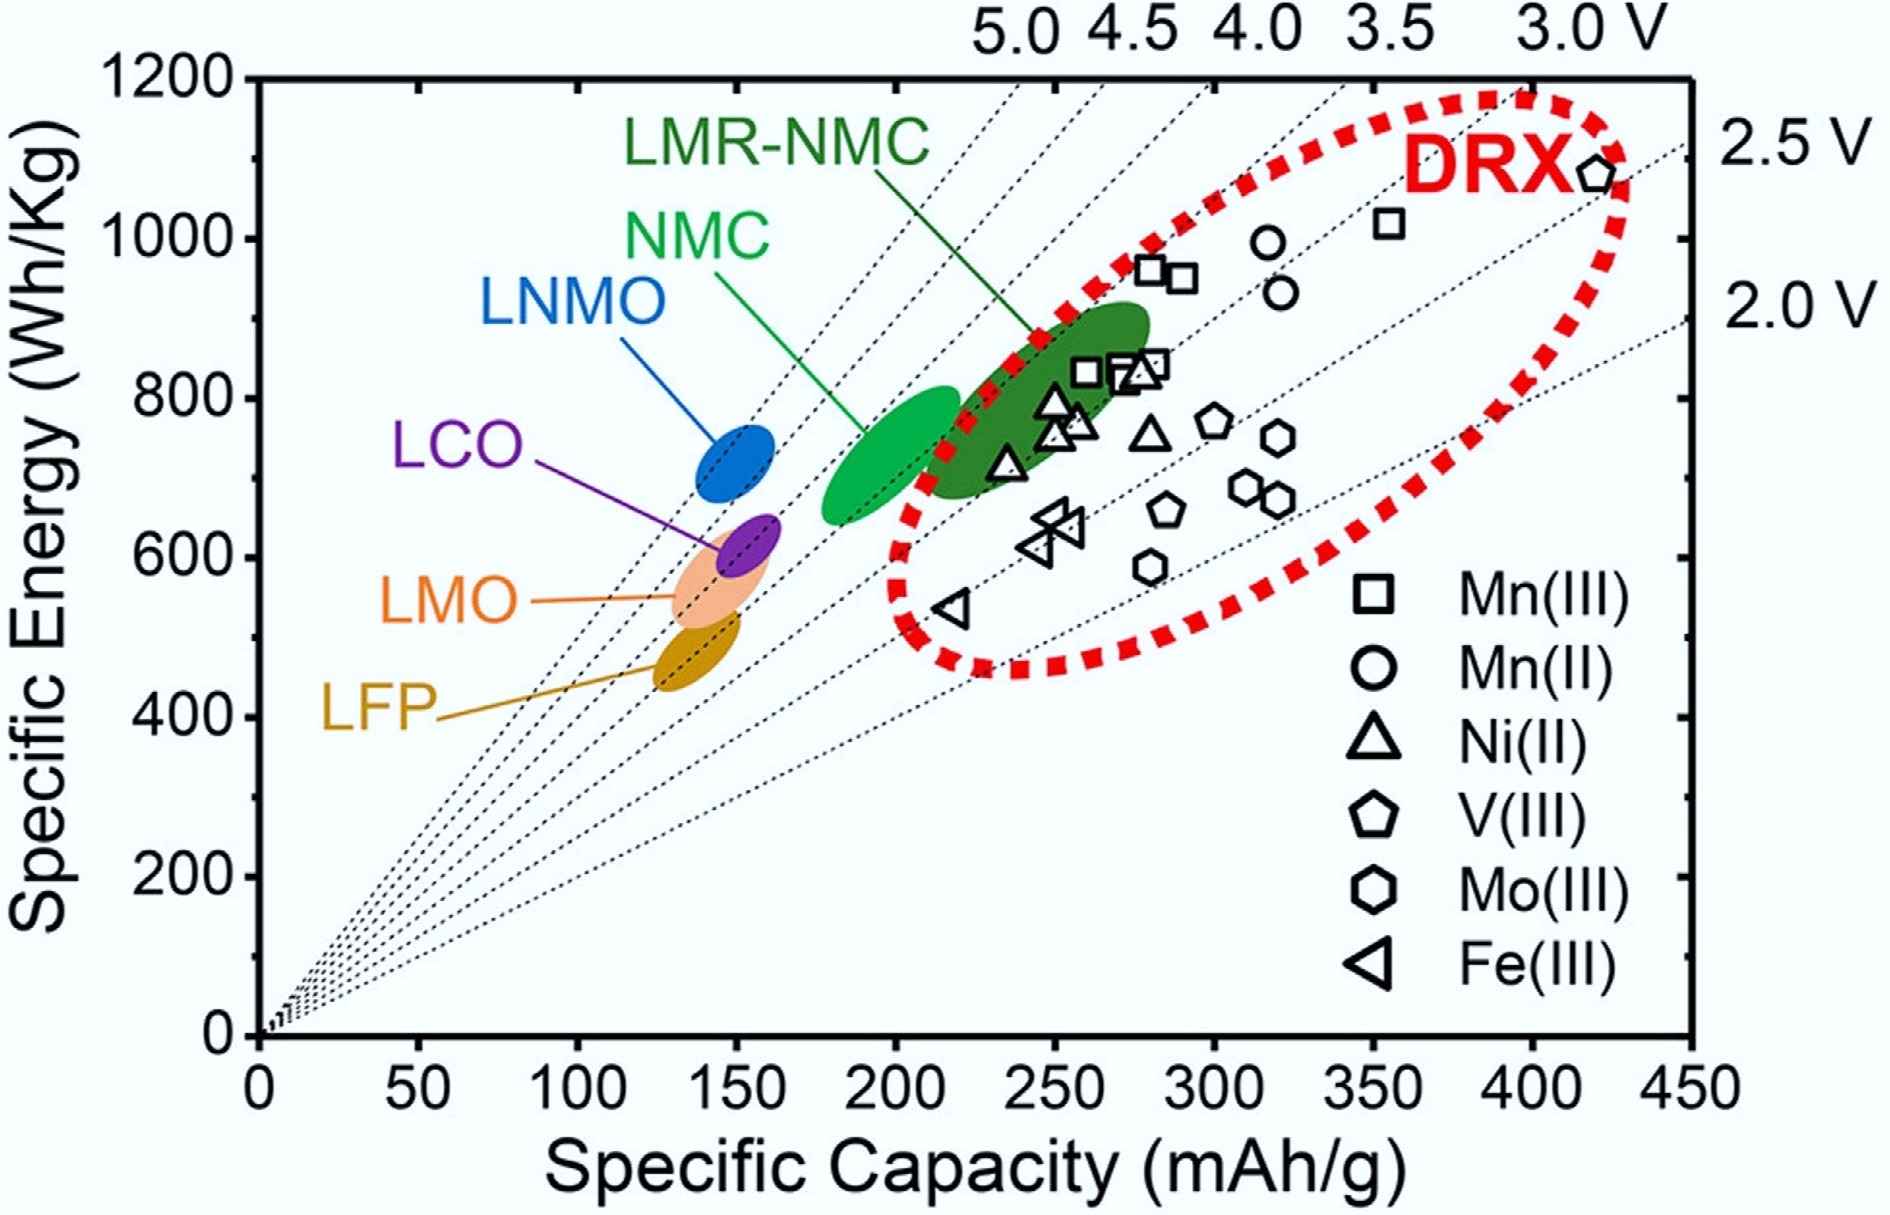
Figure 1.
Comparison of DRX and other cathode materials in specific capacity and energy. Reproduced with permission, Copyright © 2021, American Chemical Society[6].
-
-
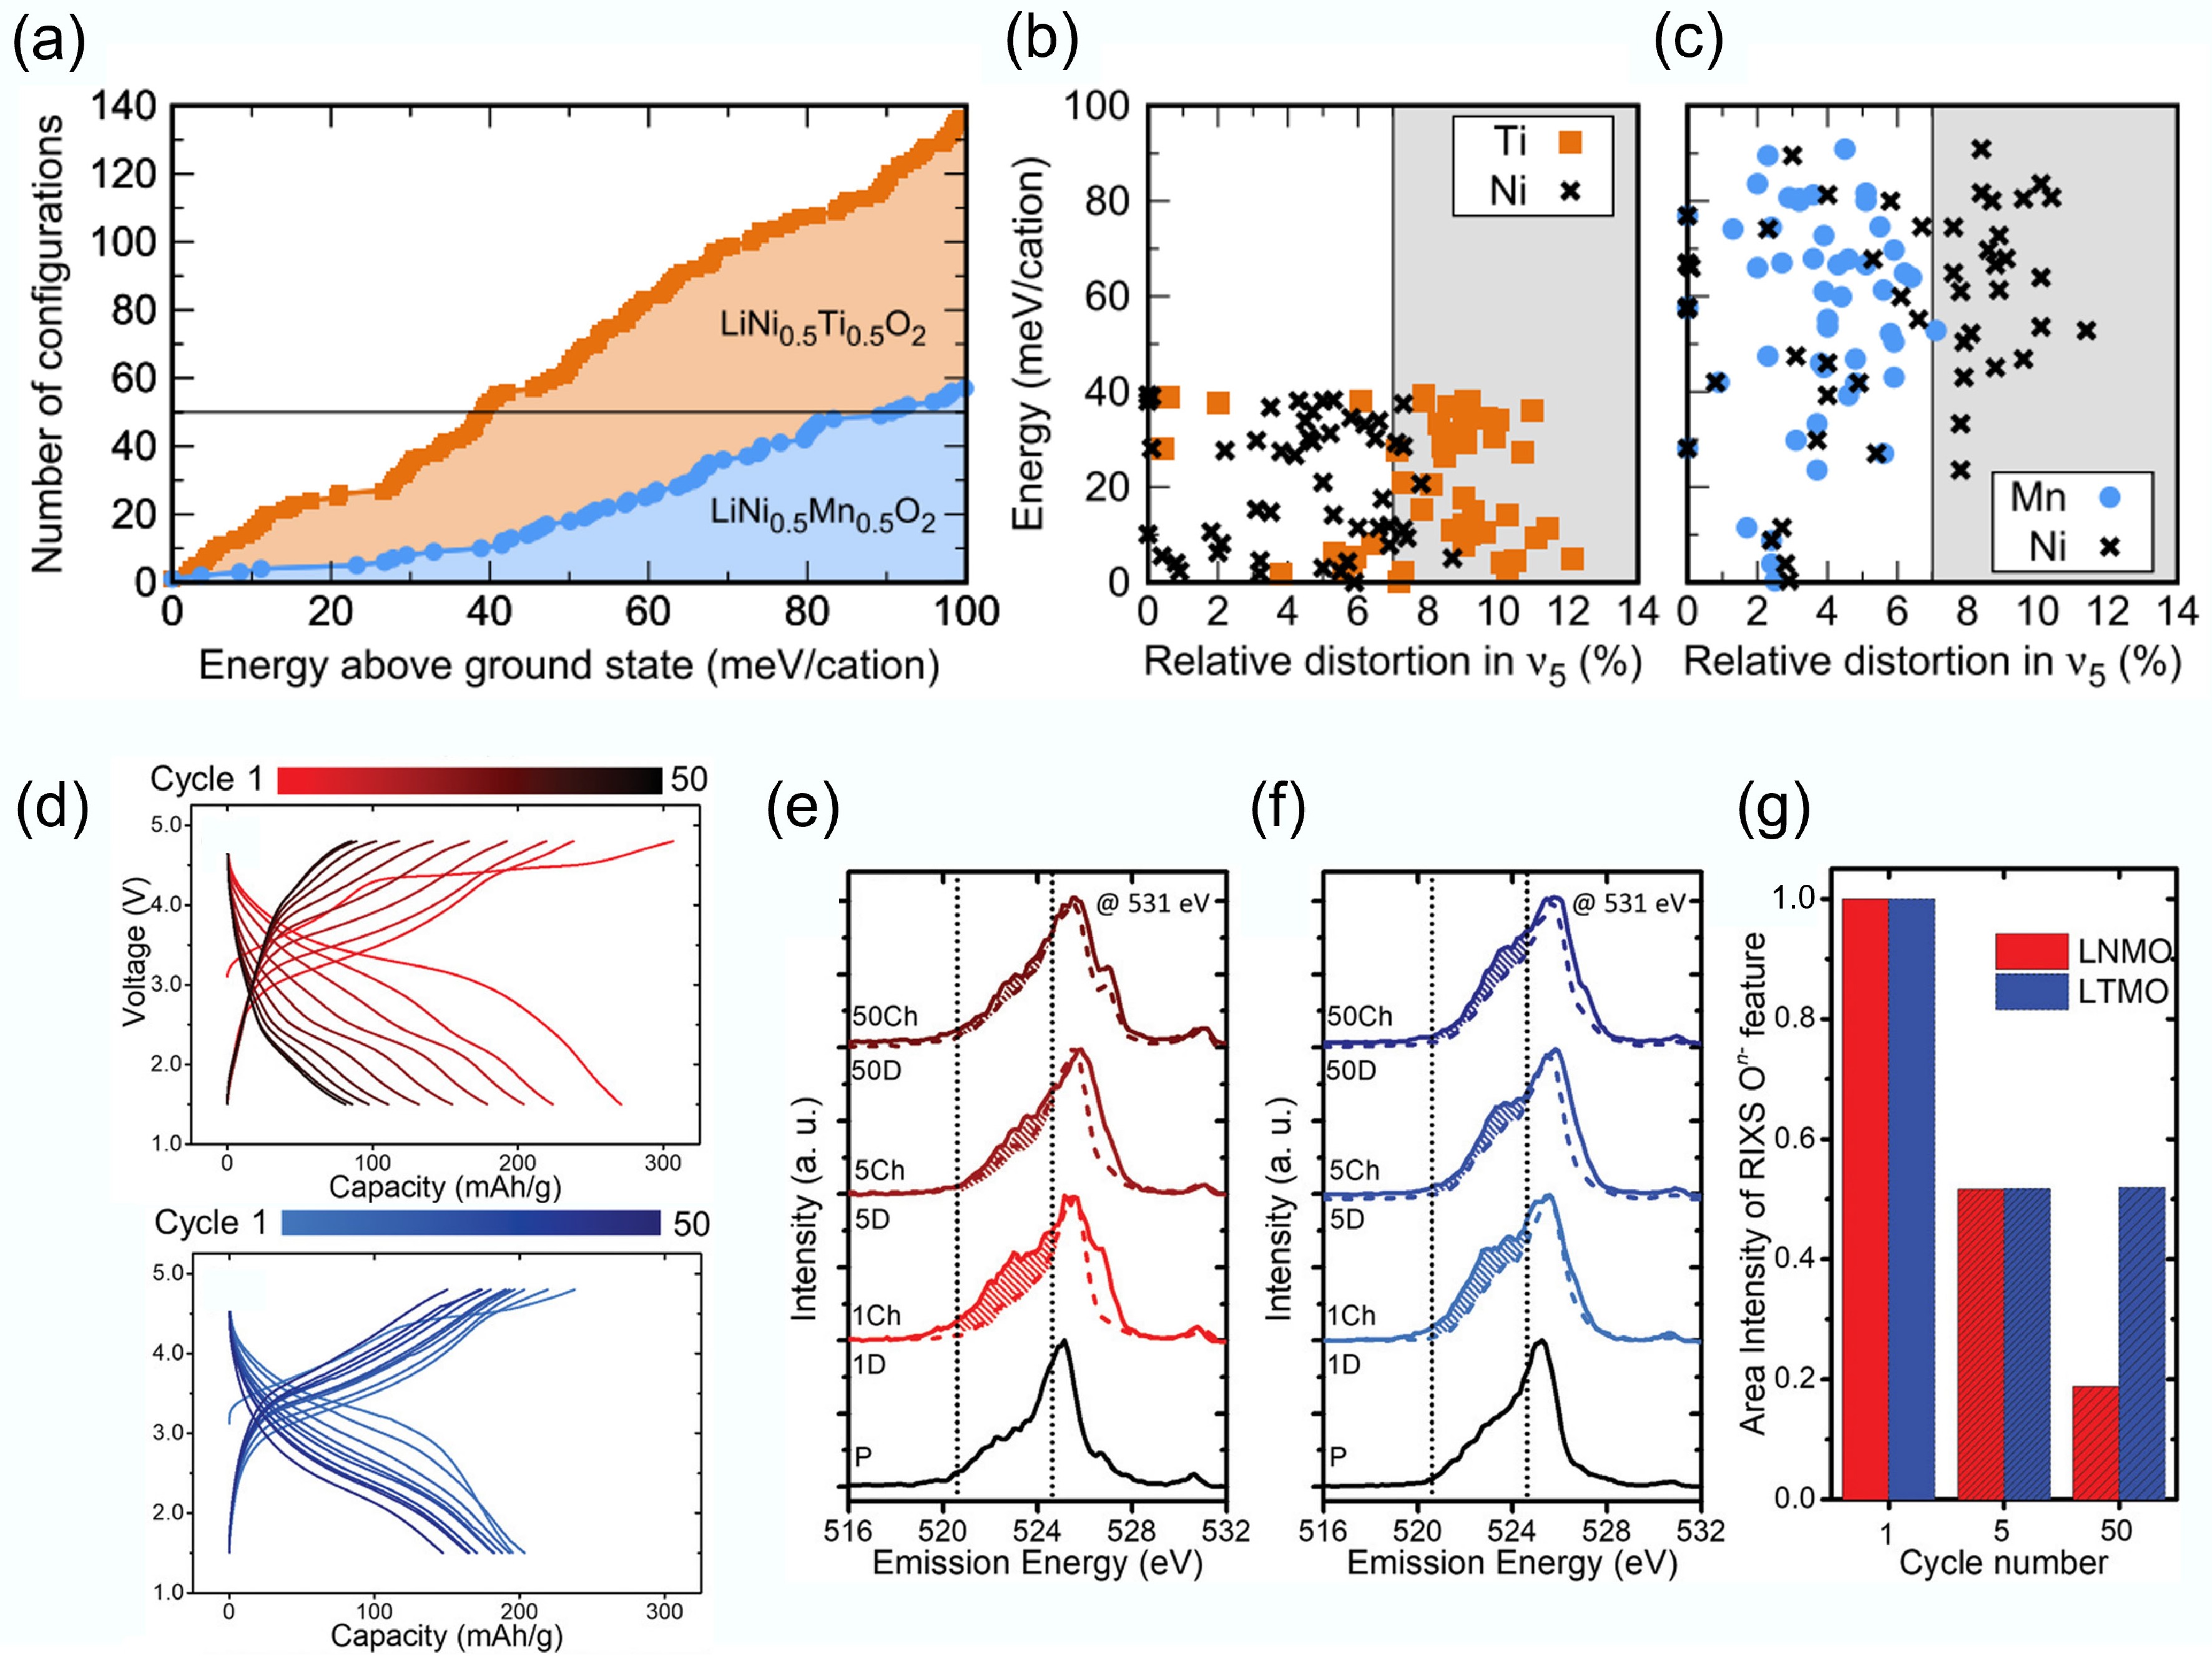
Figure 3.
(a) Atomic configuration number of DRX materials. Energy per cation and TM site distortion of the stable (b) LiNi0.5Ti0.5O2 and (c) LiNi0.5Mn0.5O2 materials. Reproduced with permission, Copyright 2017, American Physical Society[28]. (d) Voltage profiles of LNMO and LTMO. (b)–(d) RIXS cut spectra of LNMO and LTMO. Reproduced with permission, Copyright © 2020 WILEY-VCH Verlag GmbH & Co. KGaA, Weinheim[29].
-
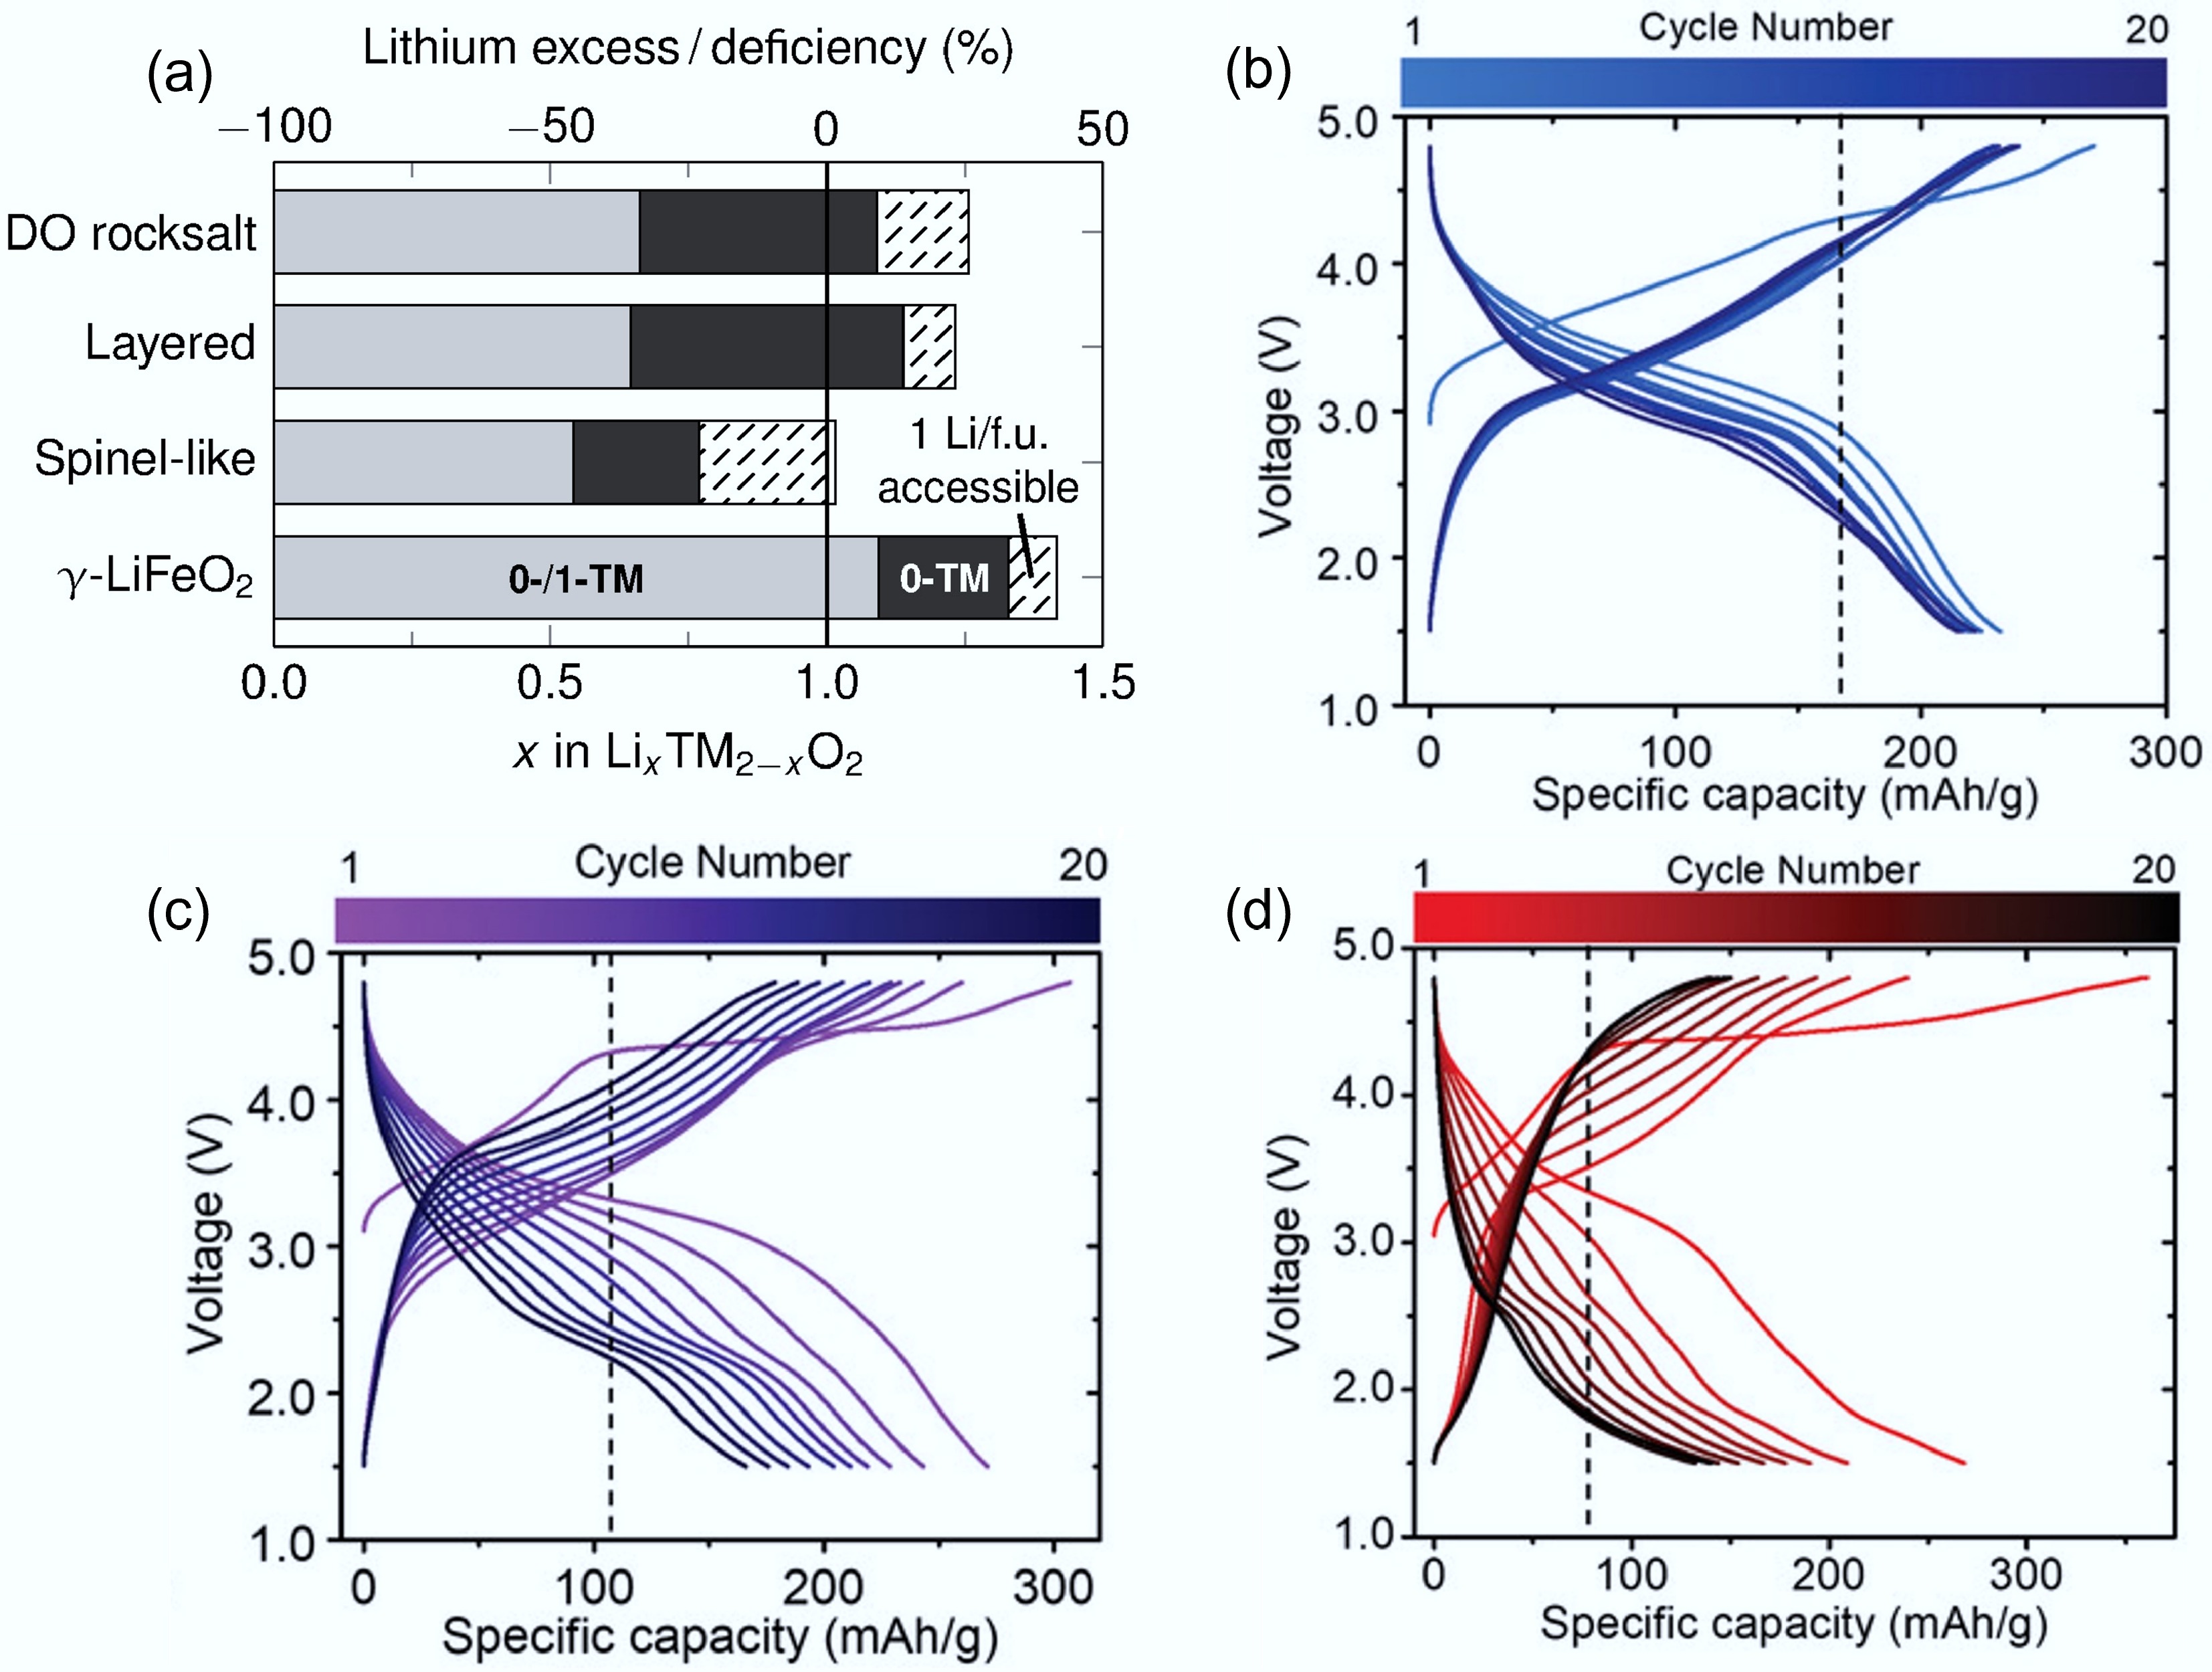
Figure 4.
(a) Critical Li concentrations in different LIB materials. The grey (both 0-TM and 1-TM), and black (only 0-TM) regions represent the lithium content required for percolation. Reproduced with permission, Copyright © 2014 WILEY-VCH Verlag GmbH & Co. KGaA, Weinheim[30]. Charge/discharge curves of (b) Li1.2Nb0.2Mn0.6O2, (c) Li1.3Nb0.3Mn0.4O2, and (d) Li1.4Nb0.4Mn0.2O2. Reproduced with permission, Copyright © 2019 WILEY-VCH Verlag GmbH & Co. KGaA, Weinheim[34].
-
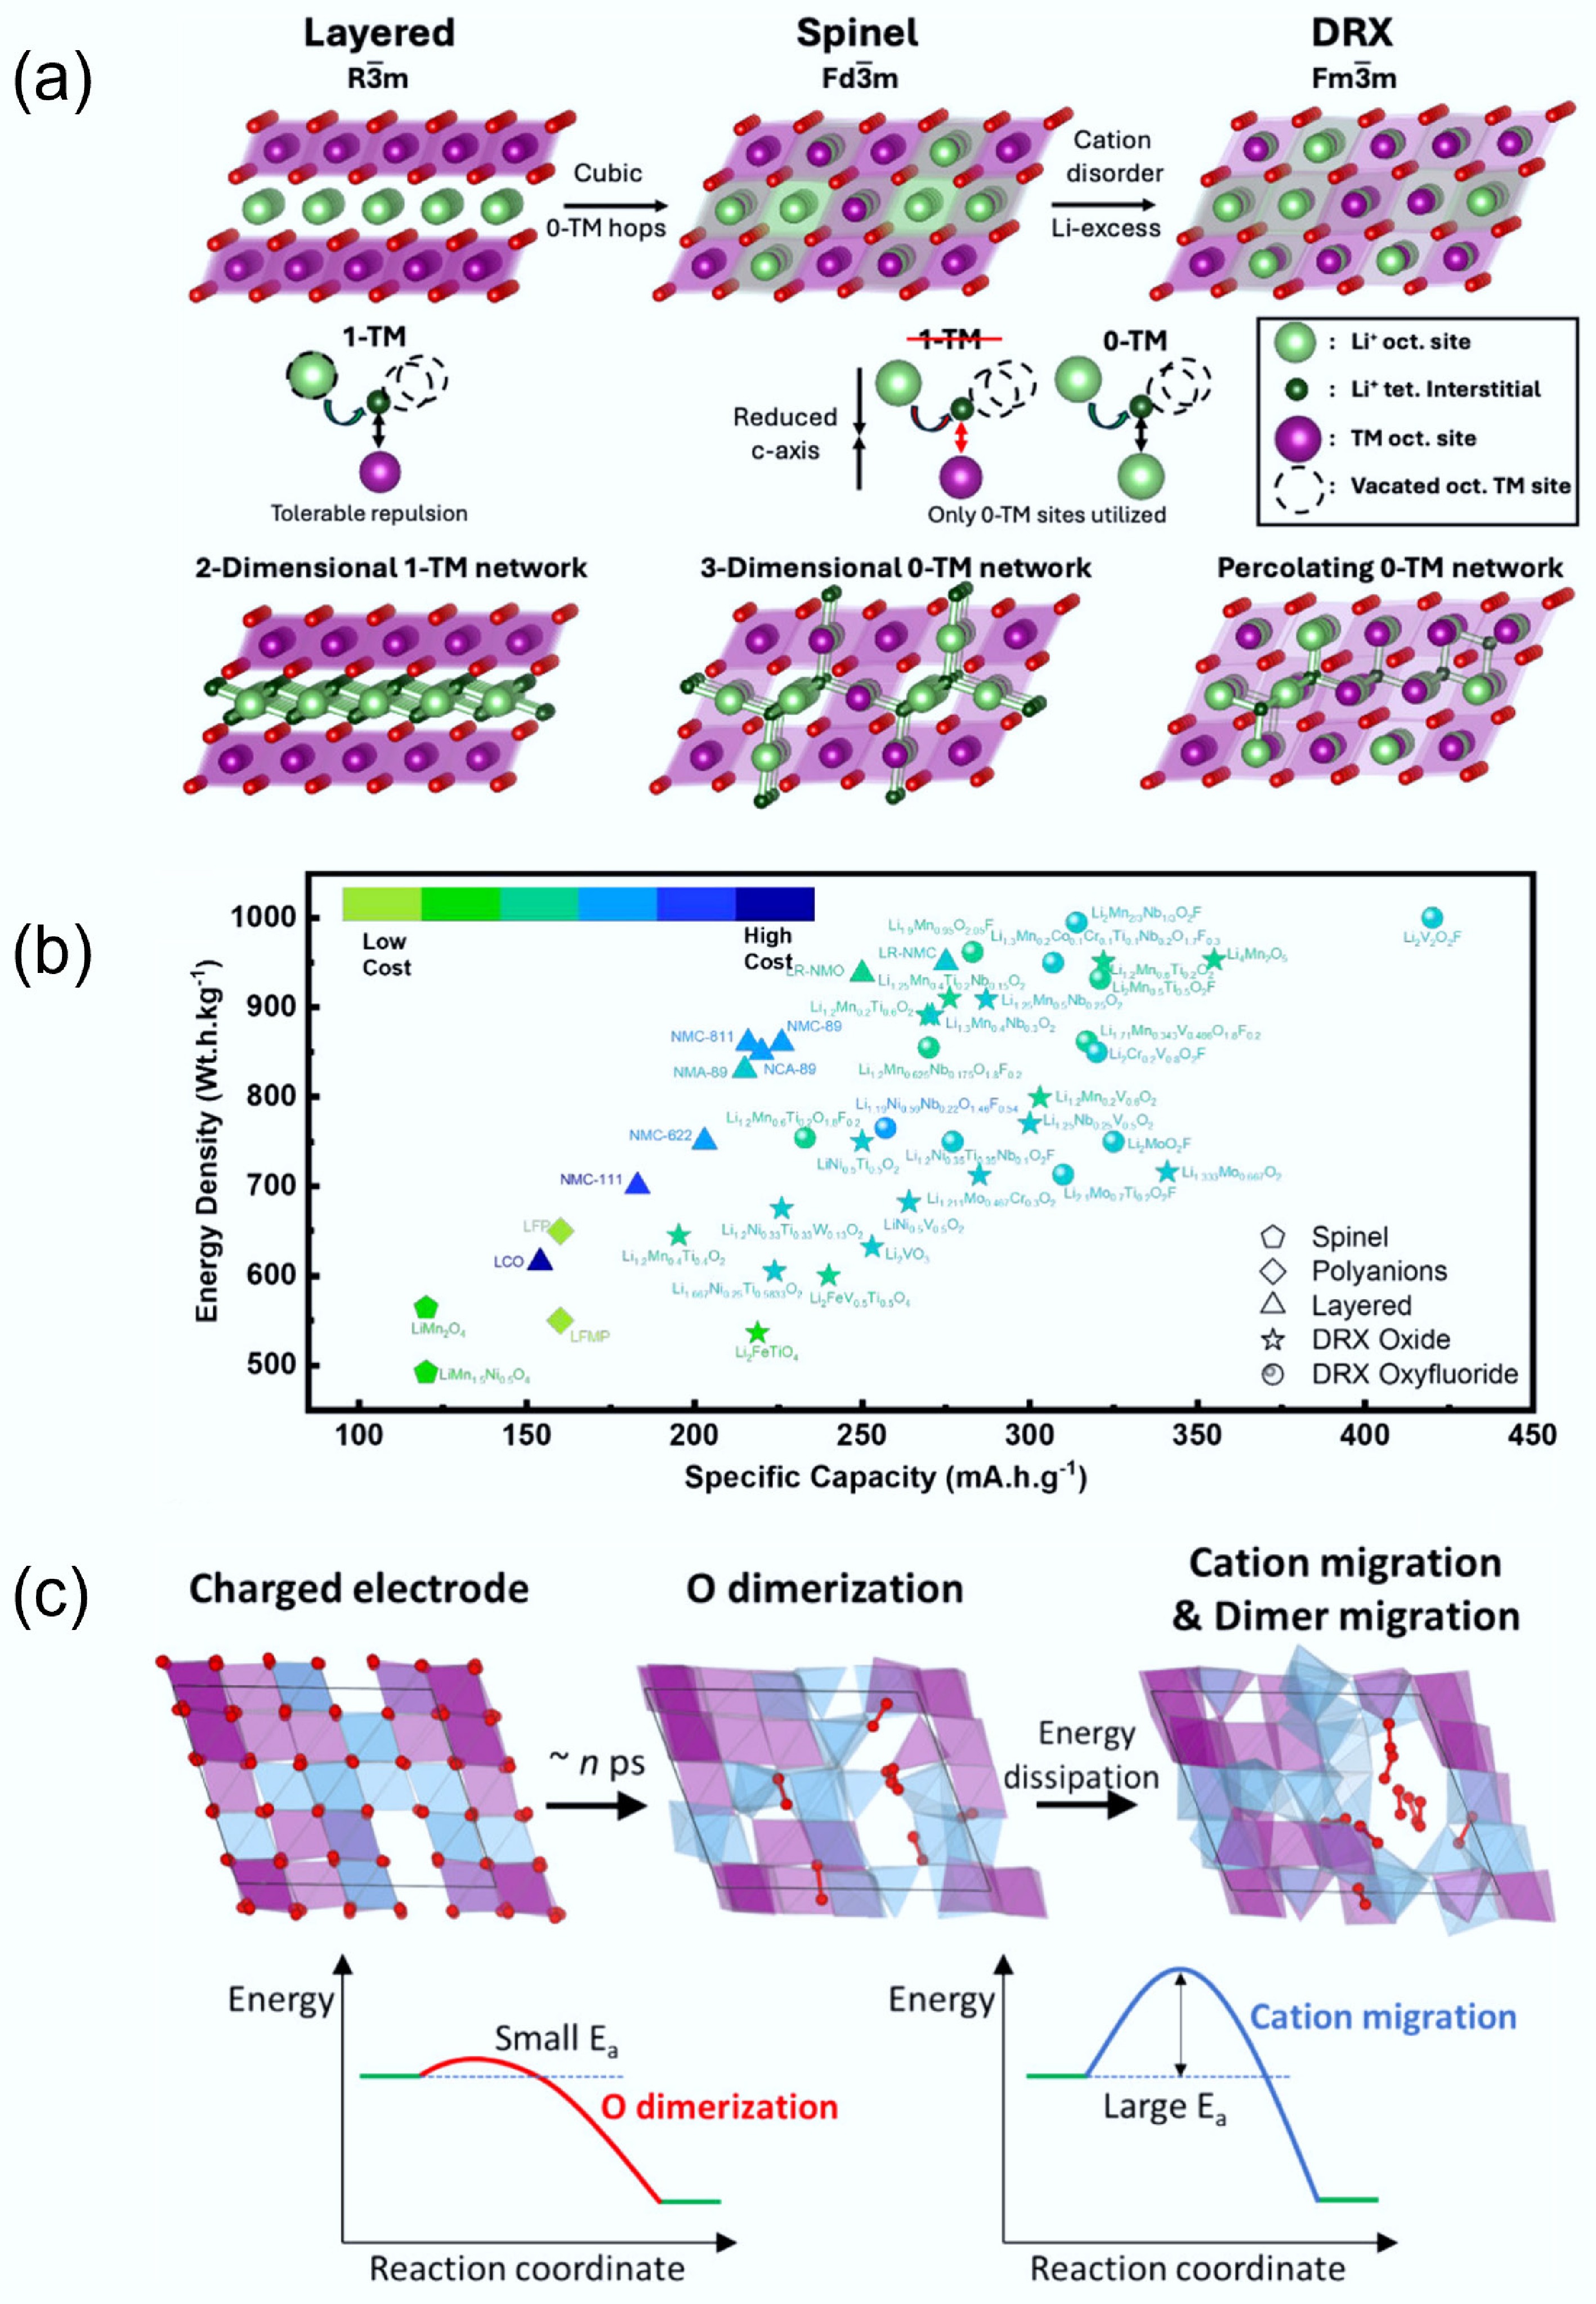
Figure 5.
(a) Li transport behaviour in different crystal structures. Reproduced with permission, Copyright © 2025 WILEY-VCH Verlag GmbH & Co. KGaA, Weinheim[9]. (b) Comparison of specific capacity and energy density between DRXs and traditional cathodes. Reproduced with permission, Copyright © 2024, American Chemical Society[8]. (c) Structure changes of DRX during the charging and discharging process. Reproduced with permission, Copyright © 2025, American Chemical Society[36].
-
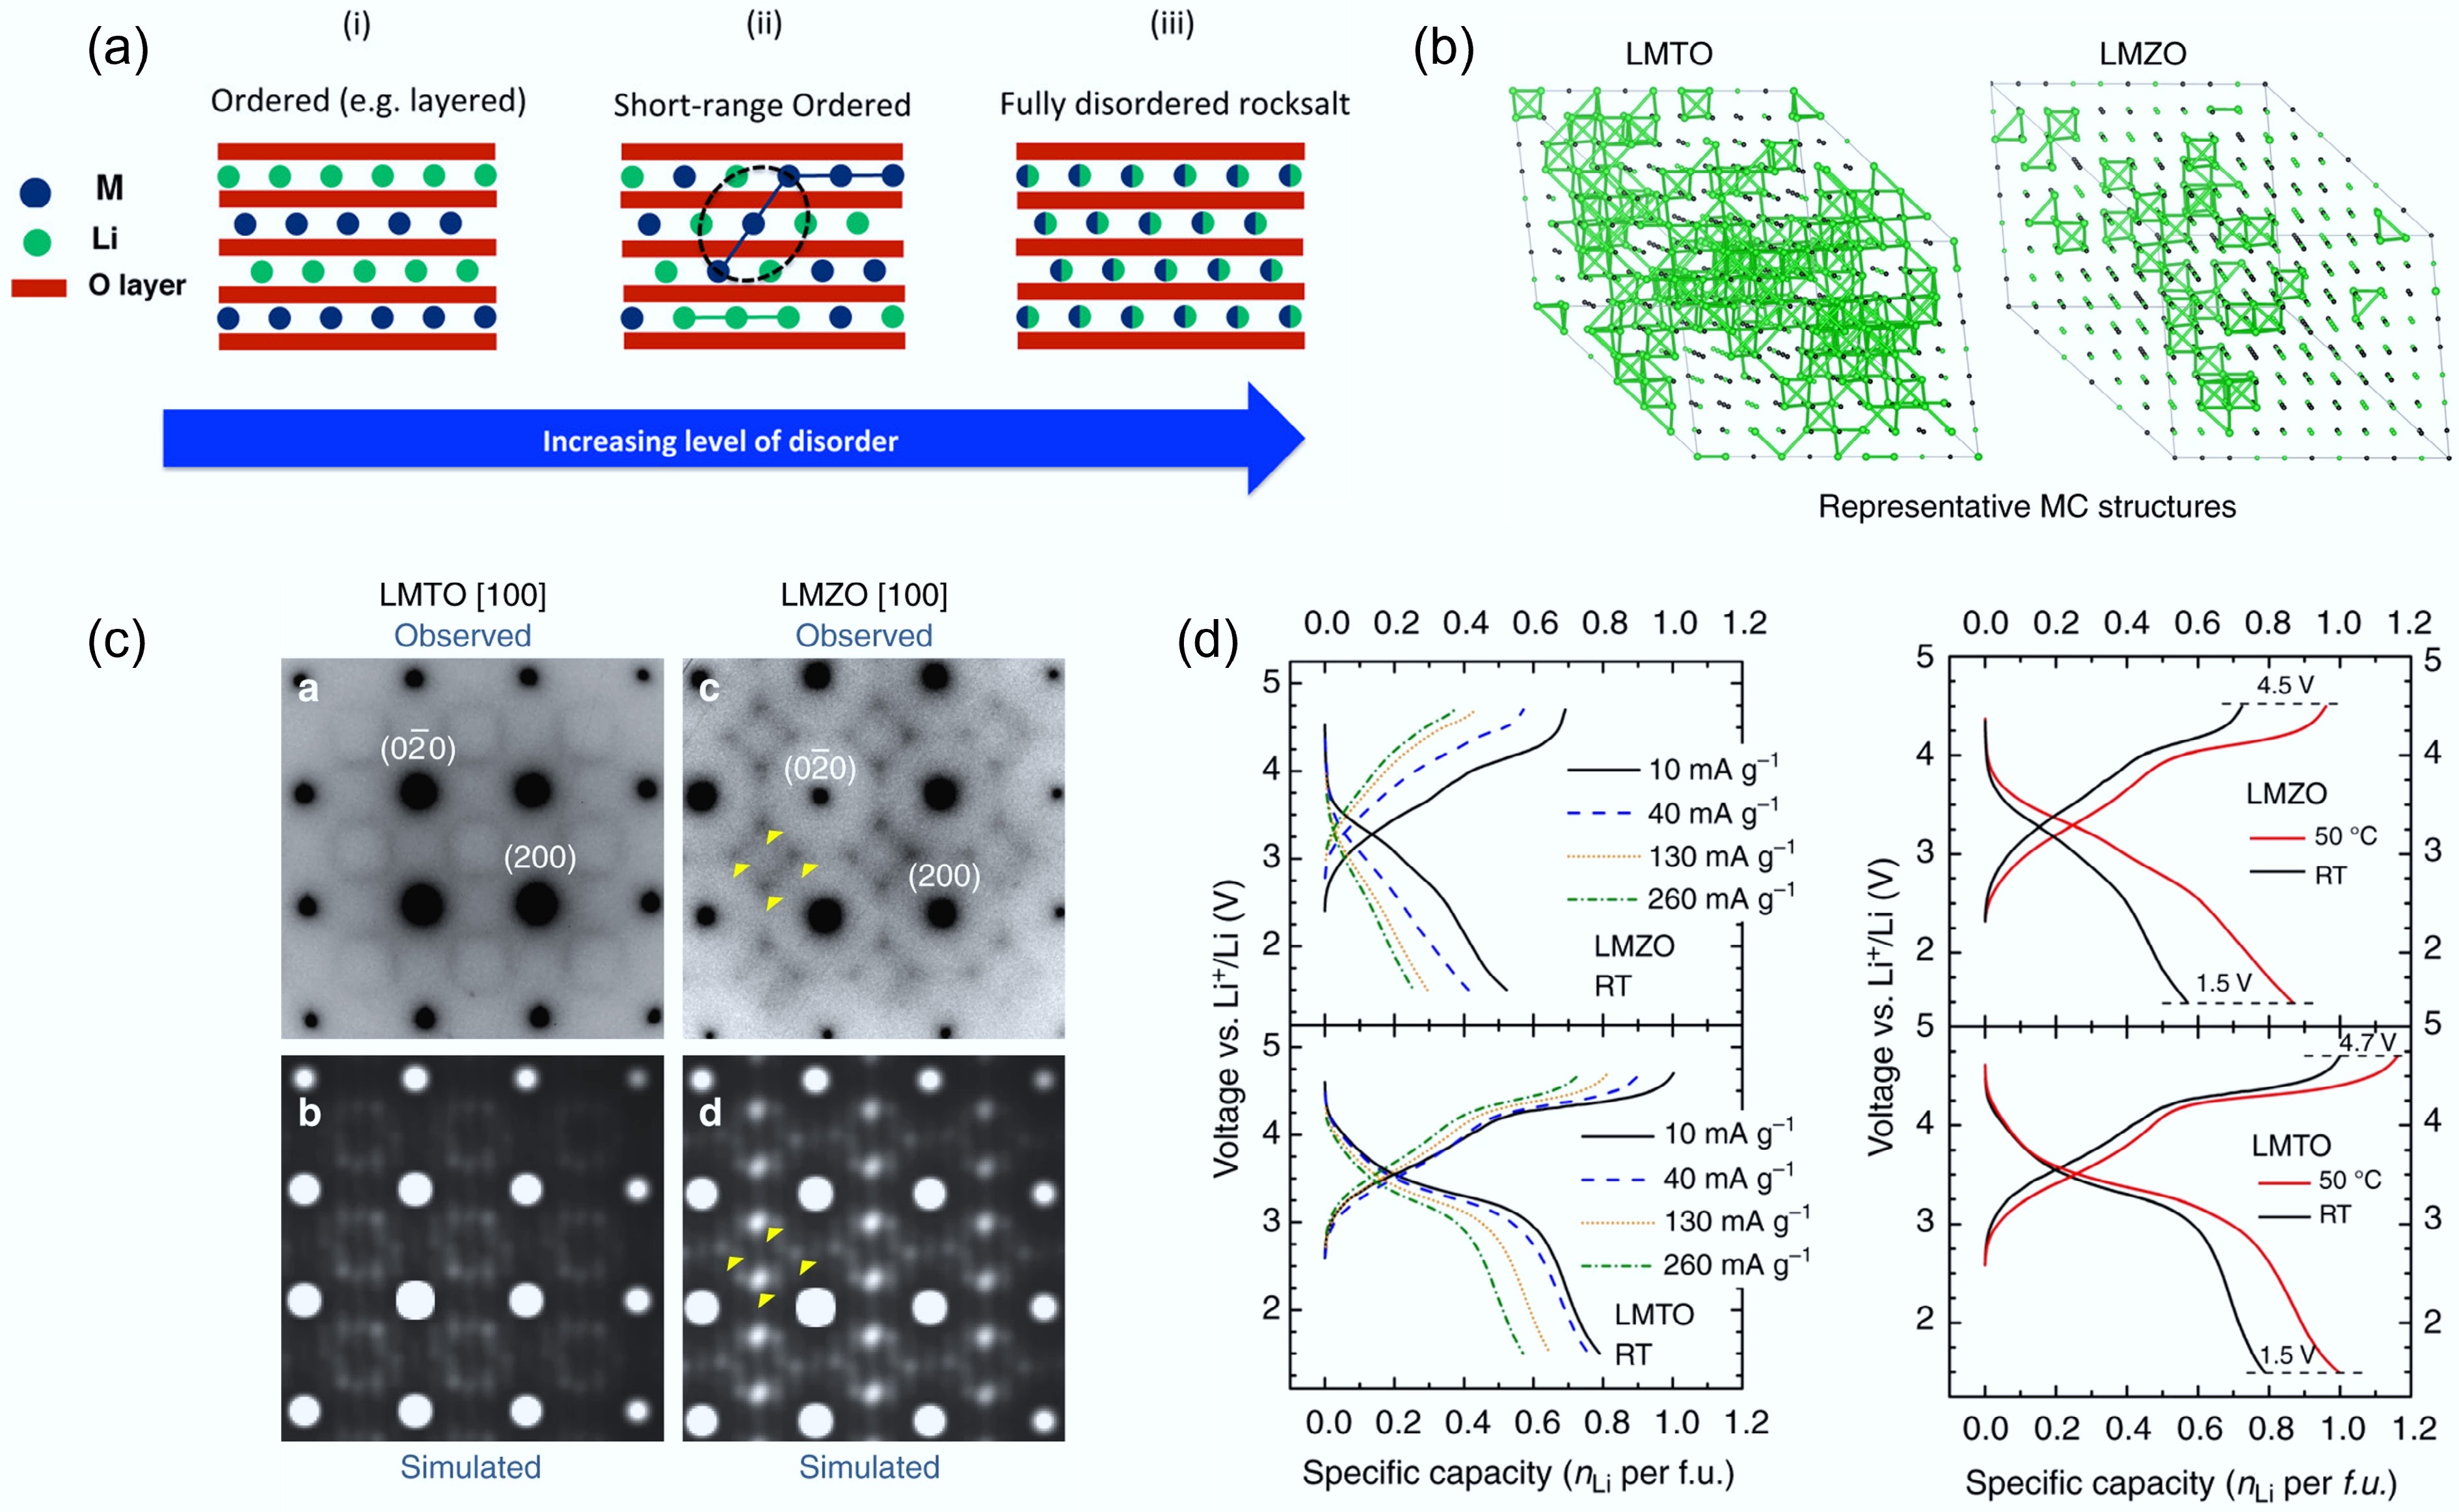
Figure 6.
(a) Illustration of the SRO structure. Reproduced with permission, Copyright © 2016 American Chemical Society[49]. (b) TEM images of LMTO and LMZO that visualise SRO. (c) Representative 0-TM channels in LMTO and LMZO. (d) Rate capability tests of LMTO and LMZO. Reproduced with permission, Copyright © 2024, Springer Nature[31].
-
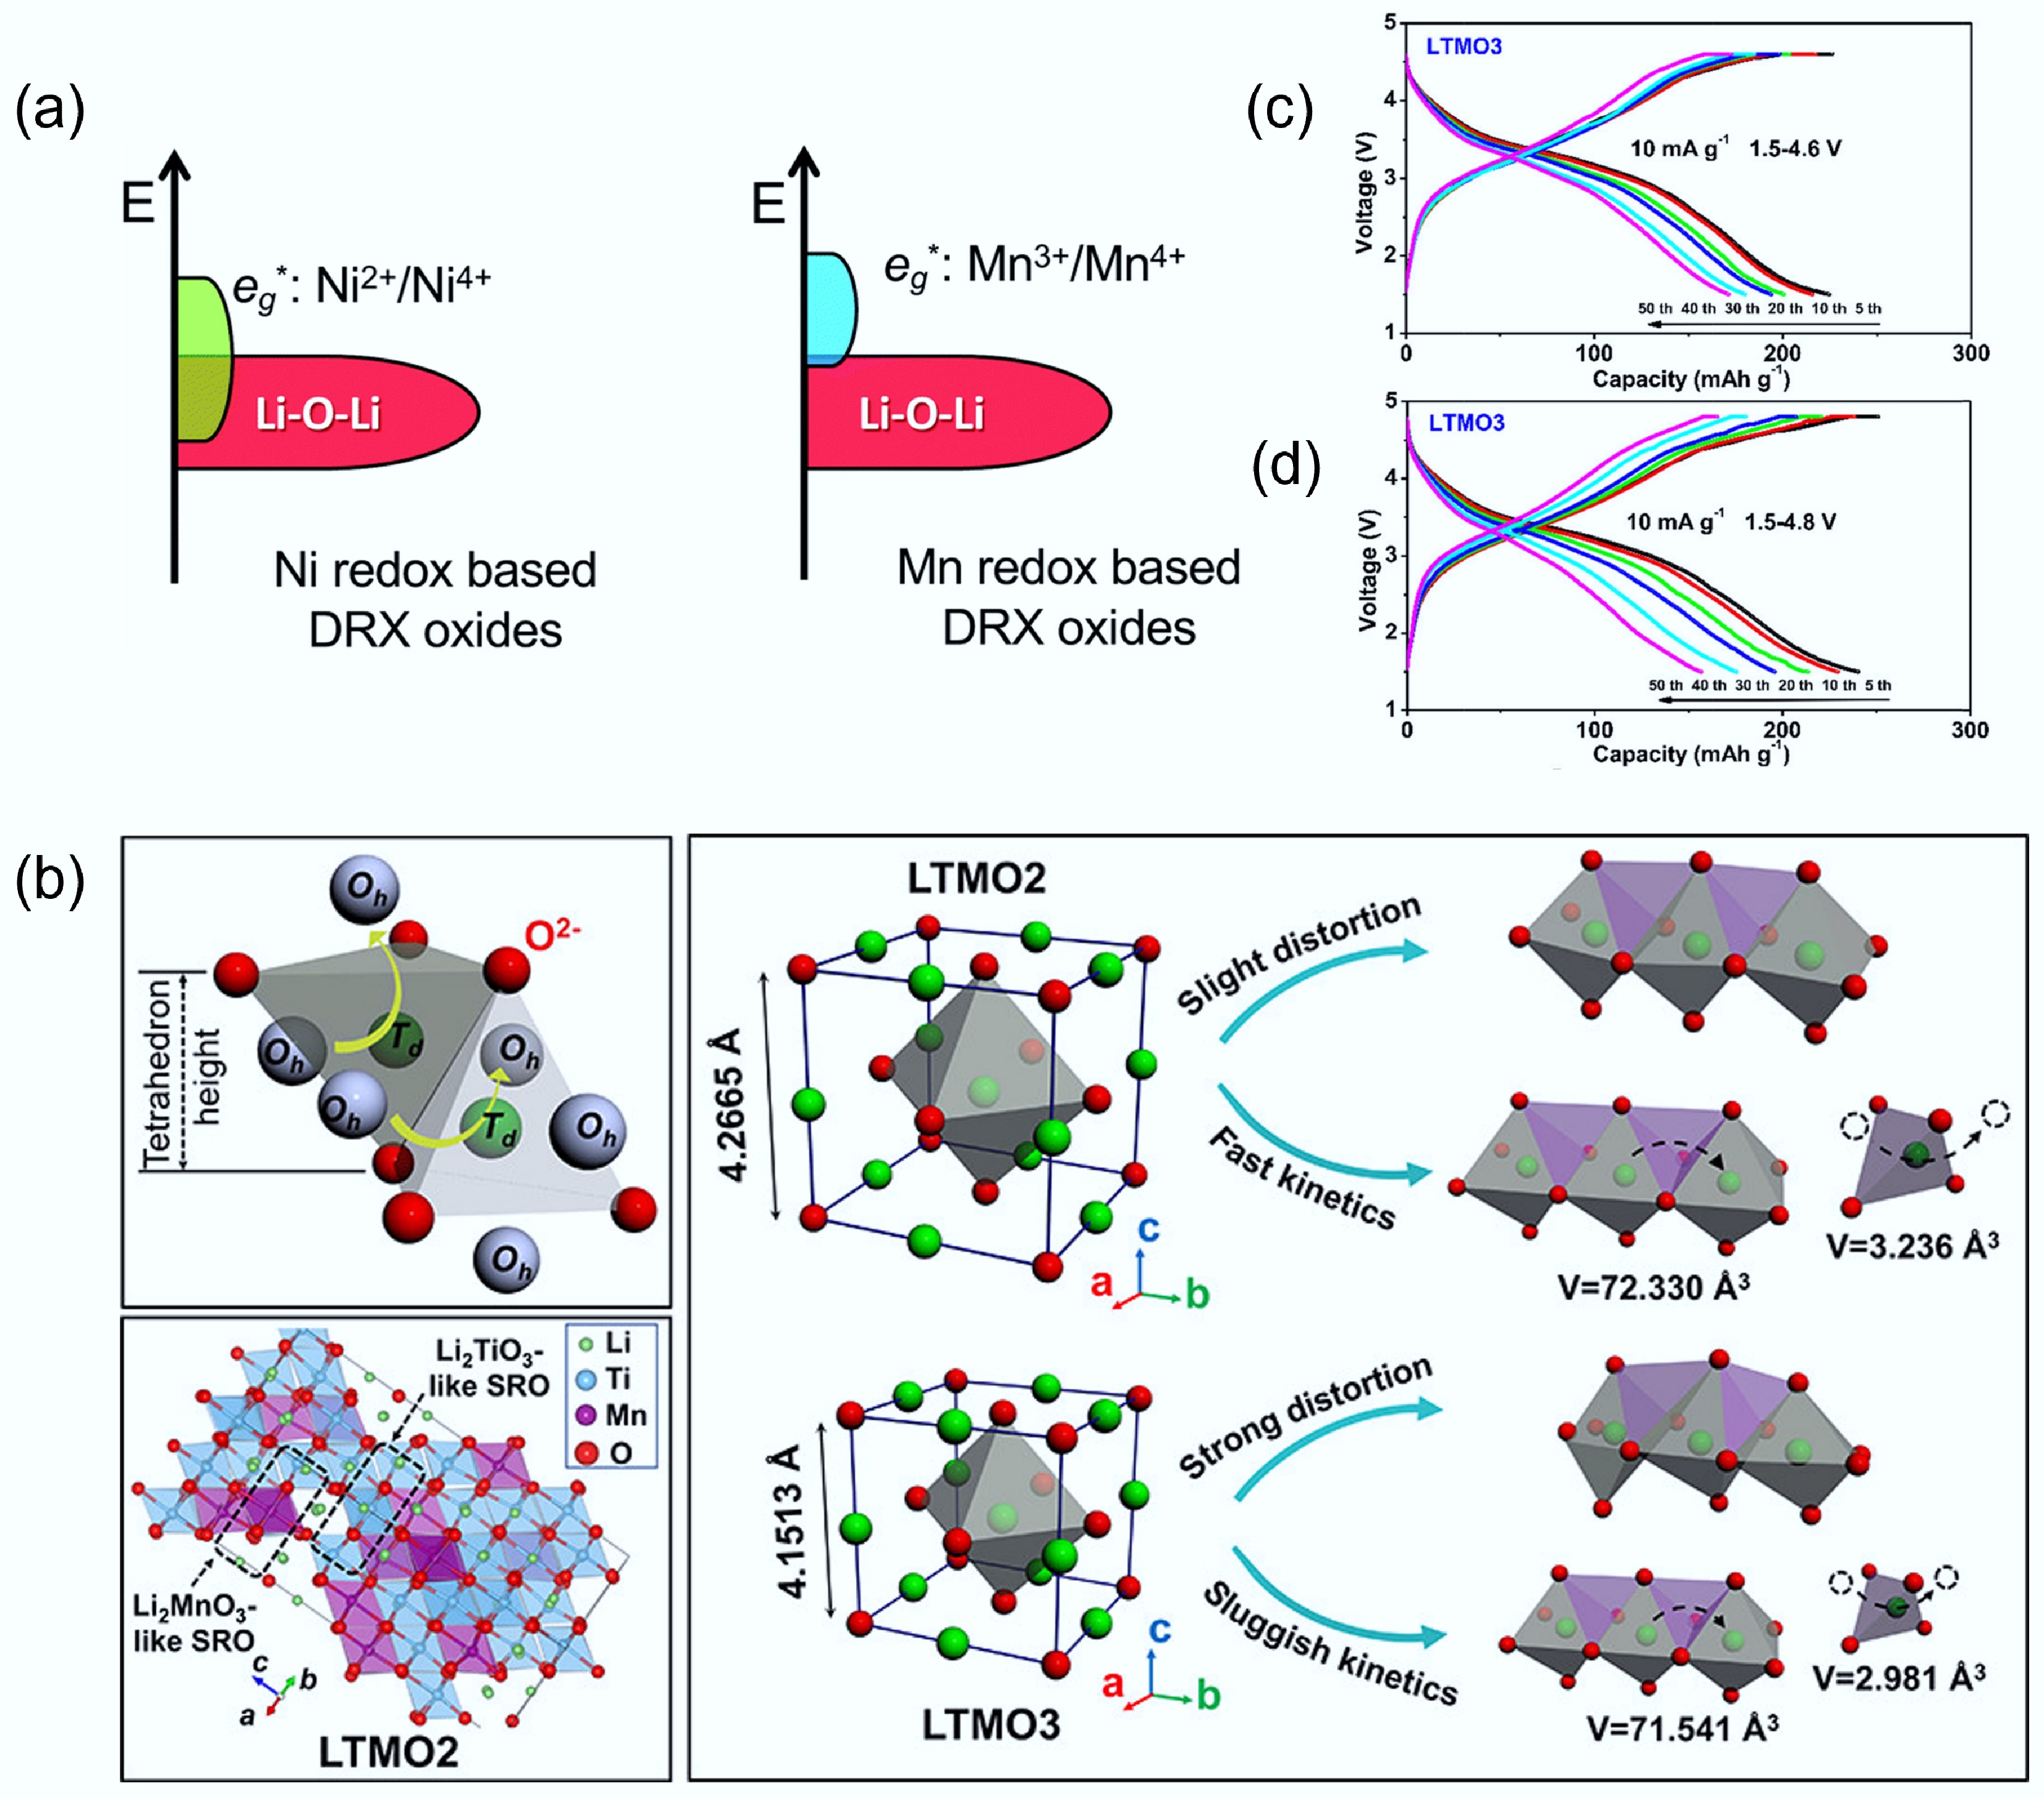
Figure 7.
(a) Electronic energy level diagrams of Ni-based and Mn-based DRX materials. Reproduced with permission. Copyright © 2020, Royal Society of Chemistry[11]. (b) Schematic diagram of the structural distortion and Li+ diffusion process in LTMO2 and LTMO3. Voltage profiles of (c) LTMO2 and (d) LTMO3, respectively. Reproduced with permission, Copyright © 2022 American Chemical Society[57].
-
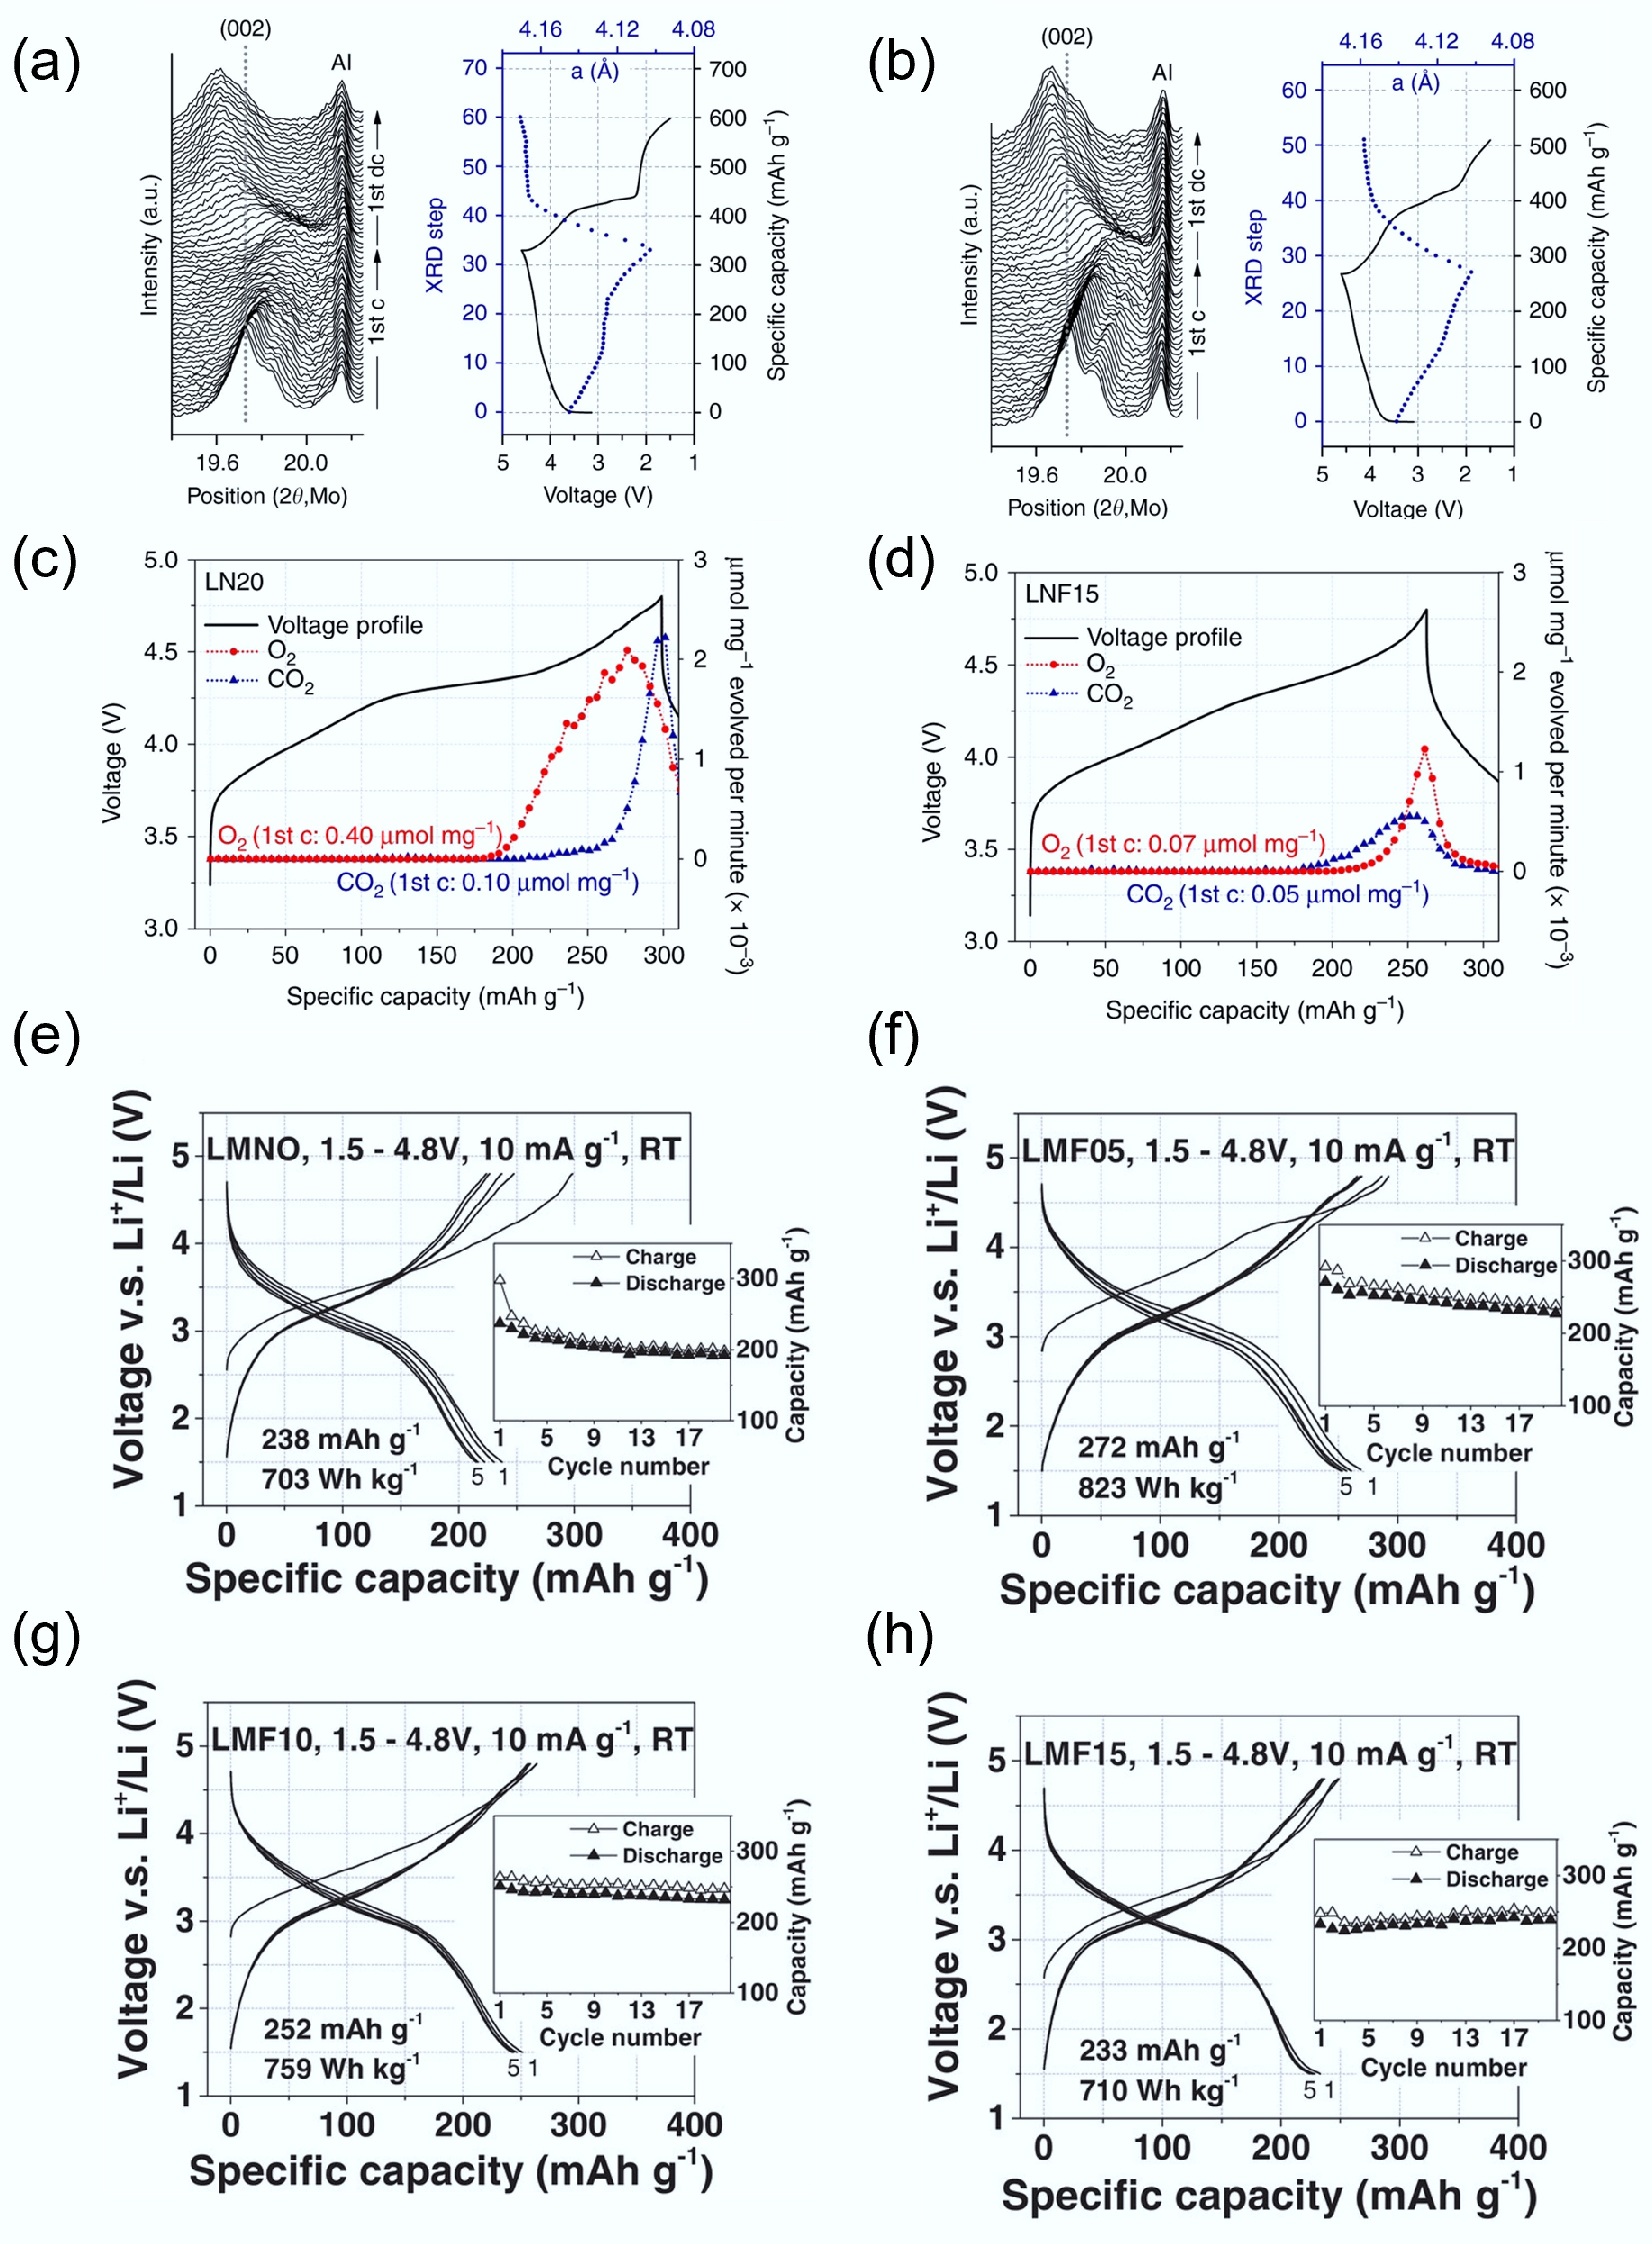
Figure 8.
In-situ XRD during initial cycling of (a) LN20 and (b) LNF15. In situ DEMS results on O2 and CO2. (c) LN20 and (d) LNF15. Reproduced with permission, Copyright © 2017, Springer Nature[40]. Charge/discharge curve of (e) LMNO, (f) LMF05, (g) LMF10, and (h) LMF15. Reproduced with permission, Copyright © 2018 WILEY-VCH Verlag GmbH & Co. KGaA, Weinheim[74].
-
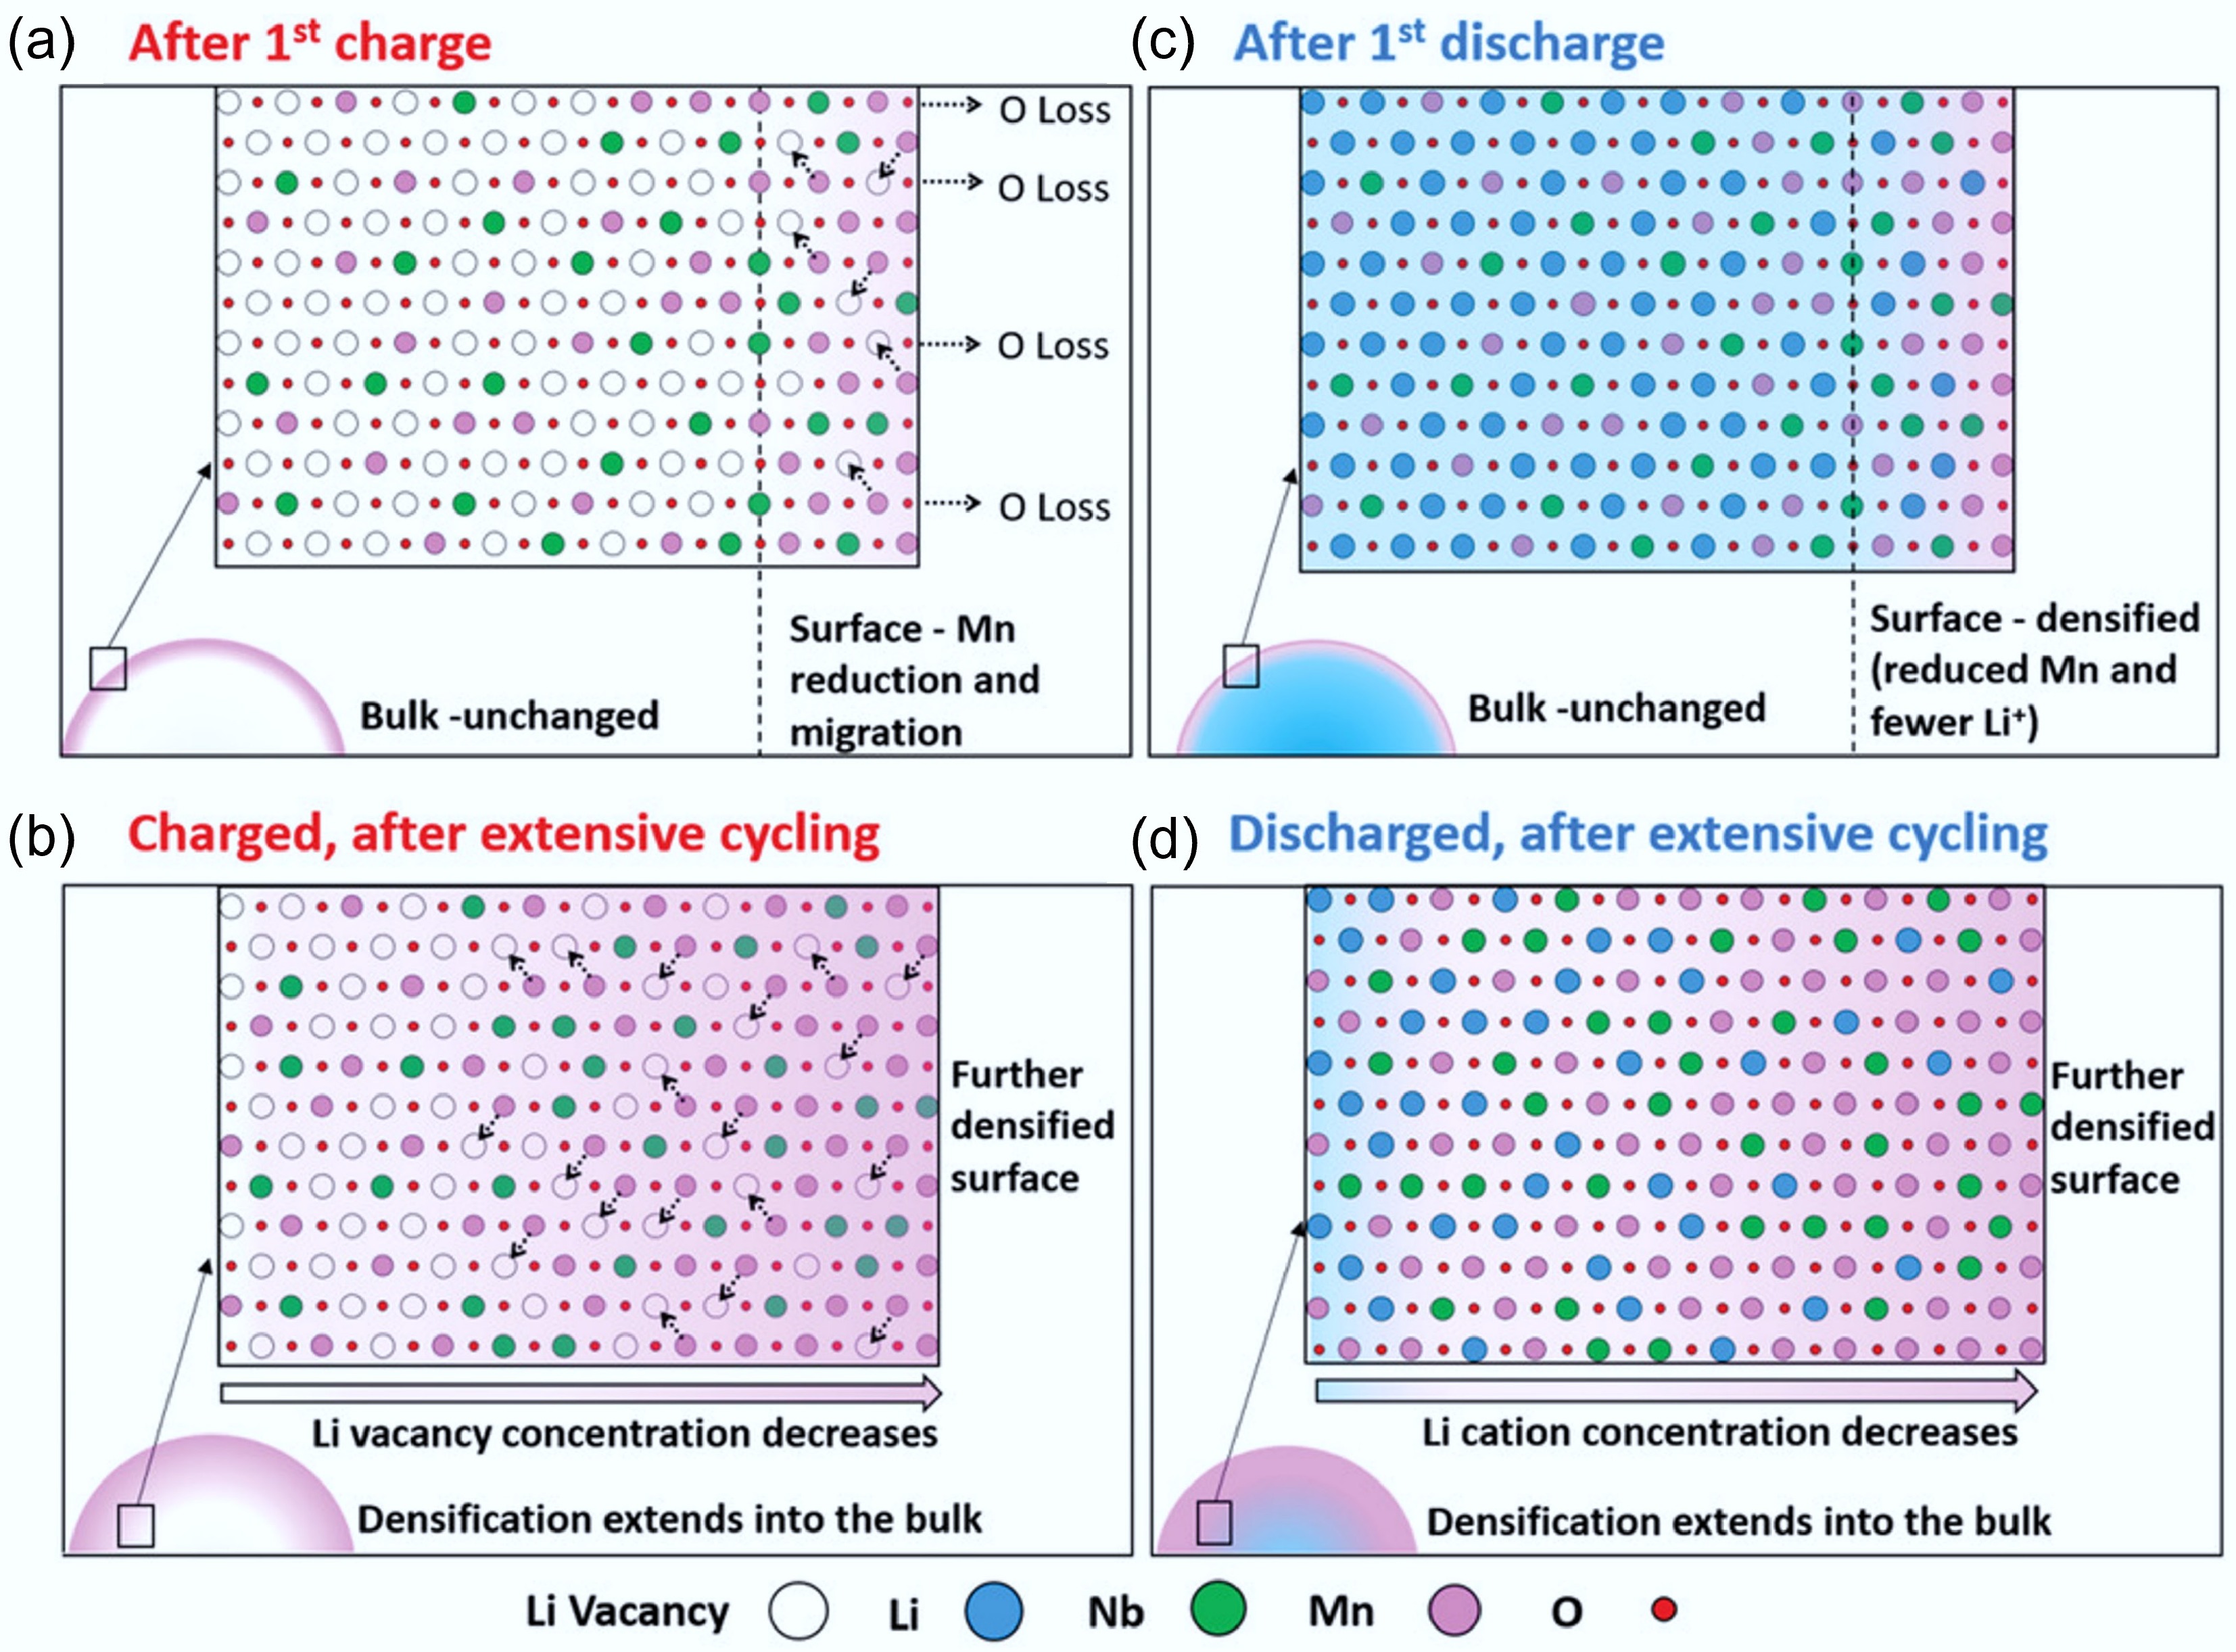
Figure 9.
(a)–(d) The degradation process of Li1.3Nb0.3Mn0.4O2 cathodes at different stages. Reproduced with permission, Copyright © 2019 WILEY-VCH Verlag GmbH & Co. KGaA, Weinheim [34].
-
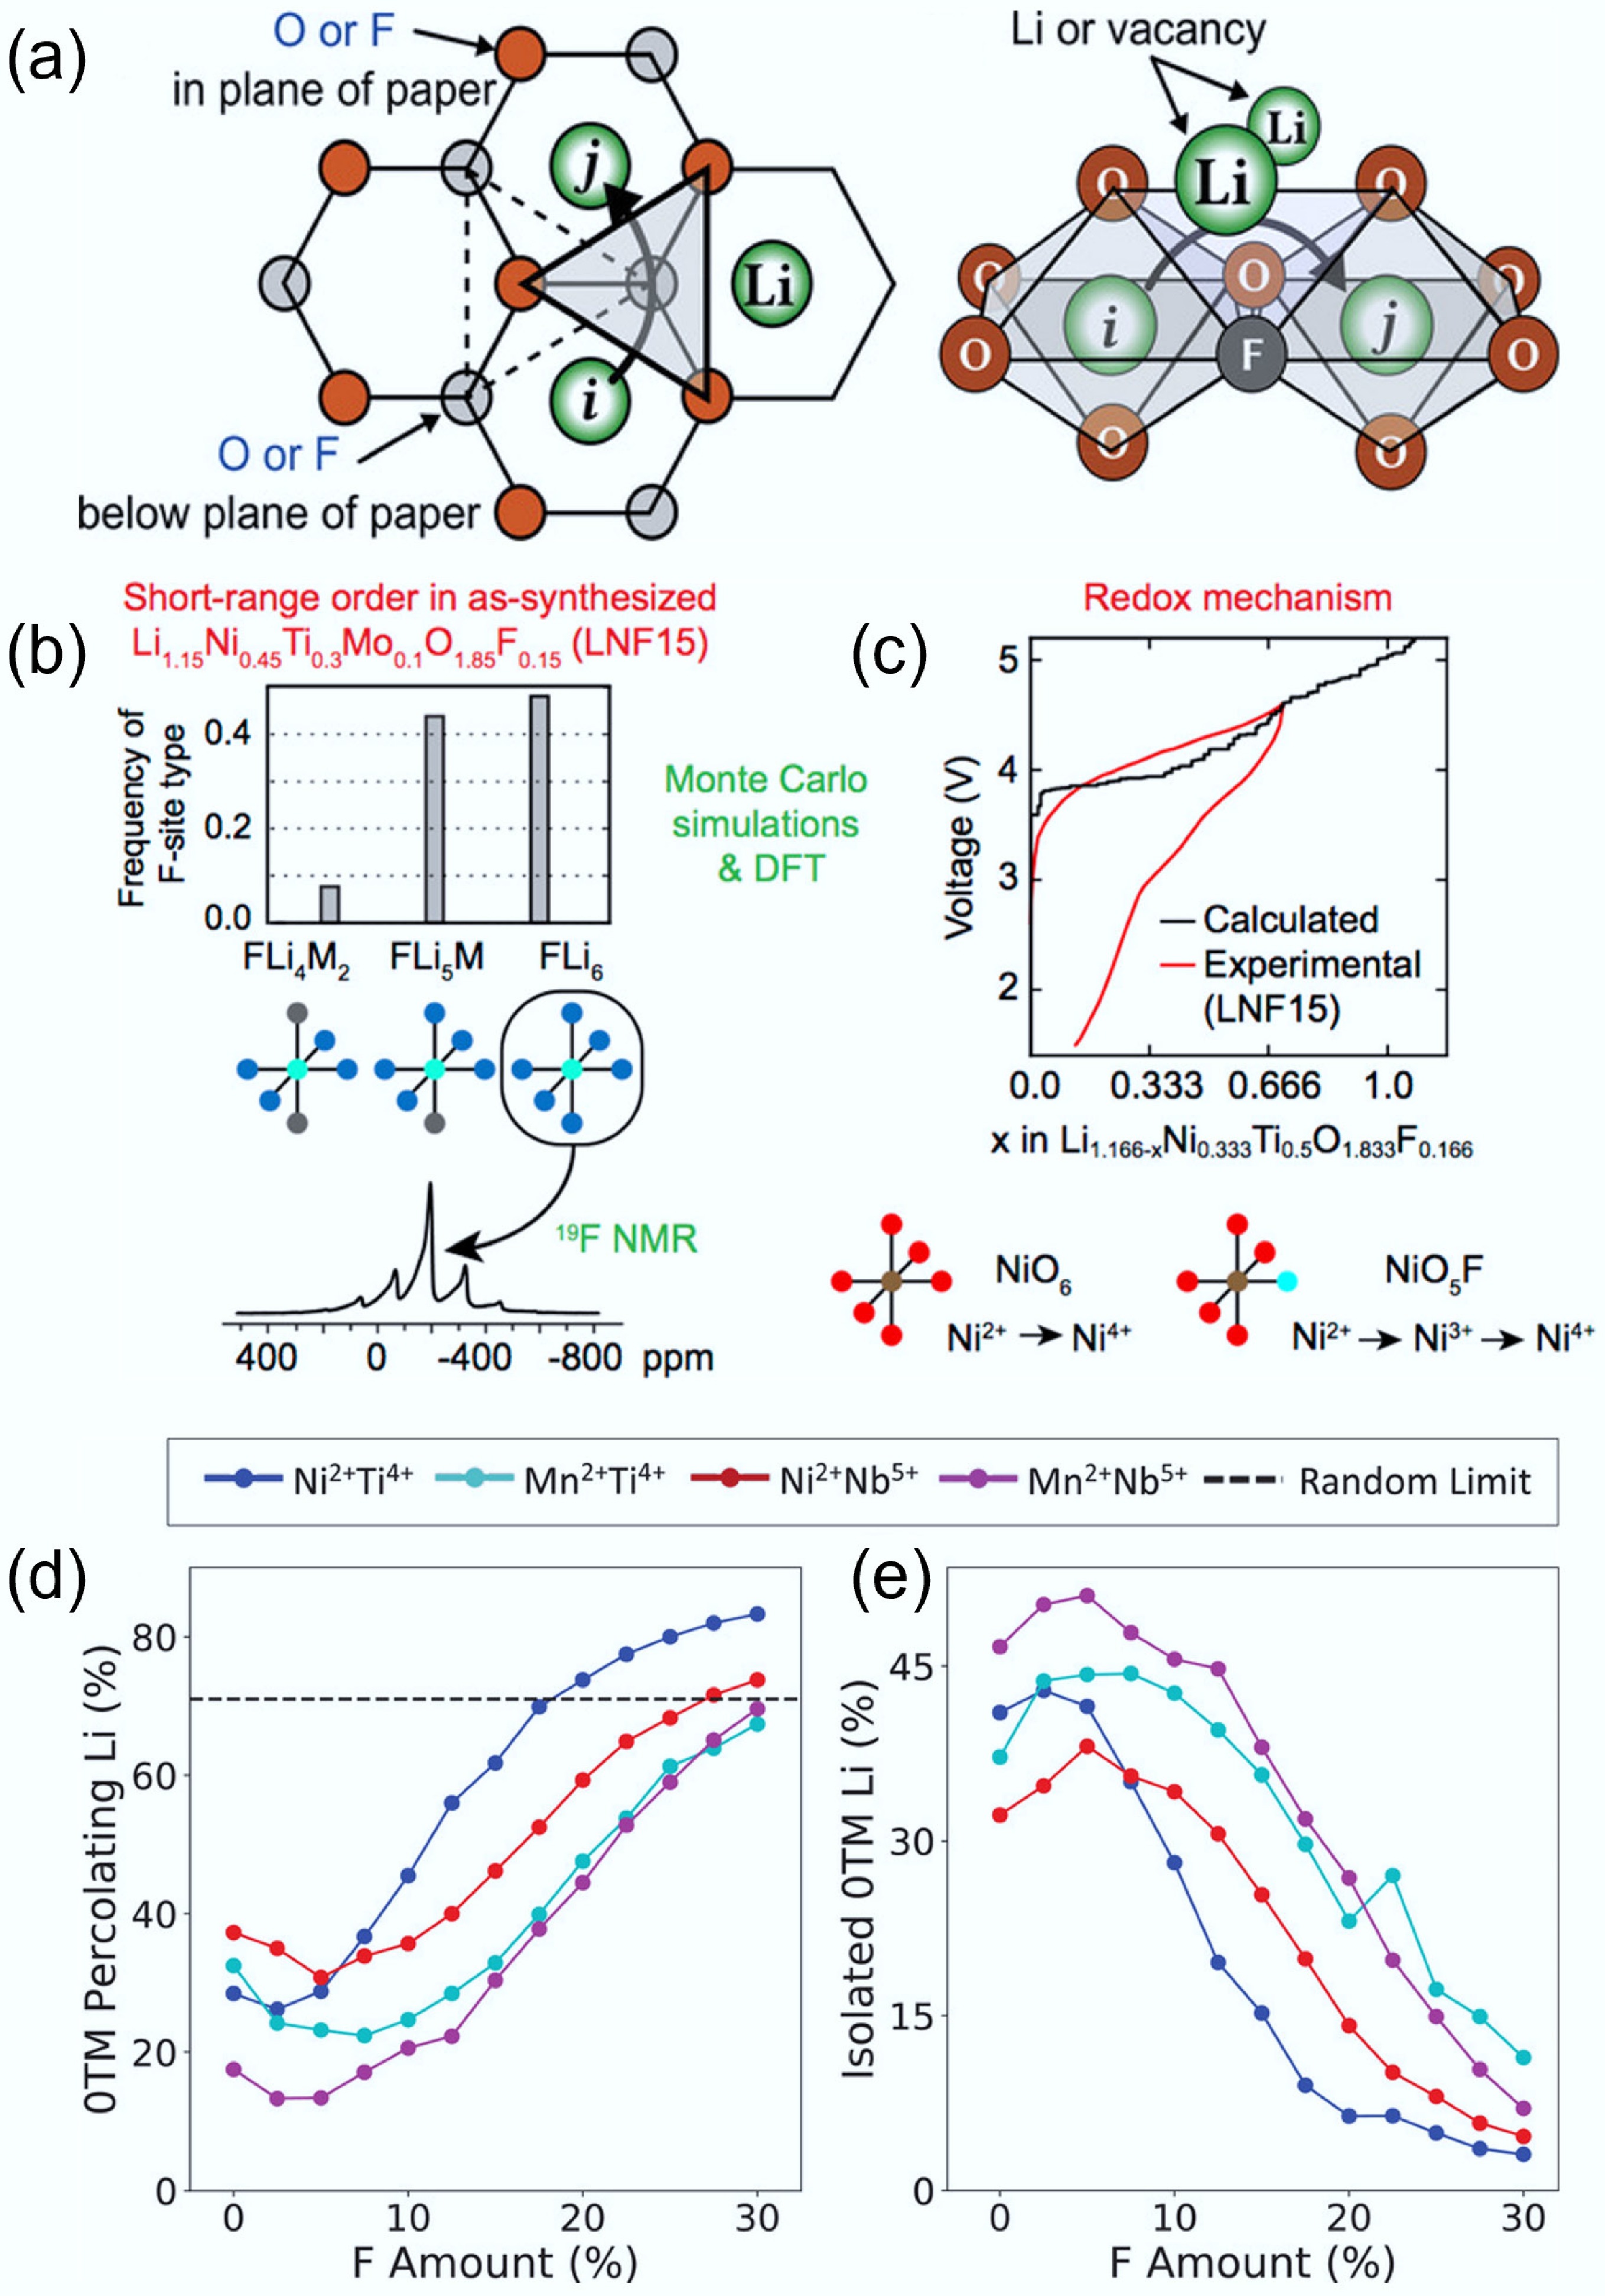
Figure 10.
(a) Influence of F substitution on 0-TM diffusion channel and o-t-o hopping mechanism. Reproduced with permission, Copyright © 2020 WILEY-VCH Verlag GmbH & Co. KGaA, Weinheim[33]. Evolution of local structure around (b) F and (c) Li. Reproduced with permission, Copyright © 2018 American Chemical Society [20]. Evolution of (d) 0-TM Li transport and (e) isolated 0-TM Li with the increasing content of F substitution. Reproduced with permission, Copyright © 2020 WILEY-VCH Verlag GmbH & Co. KGaA, Weinheim[41].
-
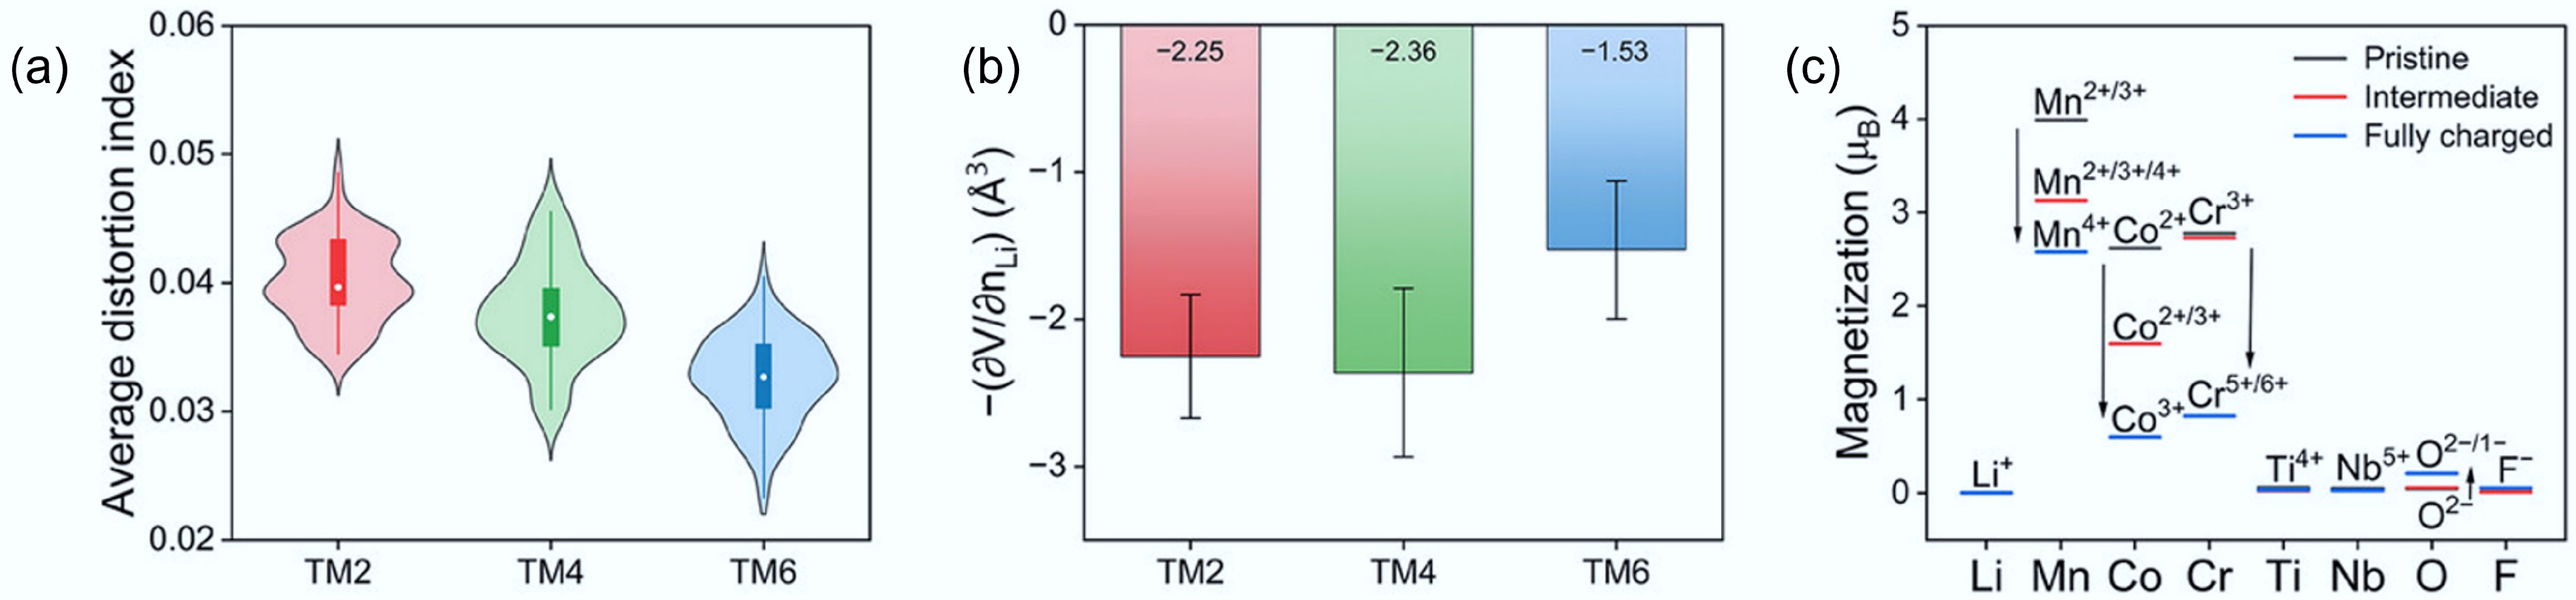
Figure 11.
(a) The average octahedral distortion index for DRXs with different entropy. (b) Partial molar Li-extraction volume during the first charge of these DRXs. (c) Element-resolved average magnetisations of these DRXs. Reproduced with permission, Copyright © 2025 WILEY-VCH Verlag GmbH & Co. KGaA, Weinheim[21].
-
Materials Initial capacity
(mAh g−1)Capacity retention
upon cycling (%)Degradation rate
per cycle (%)Ref. LiCoO2 180 97 (500th) 0.006 [19] LiNi0.8Mn0.1Co0.1O2 202 75.3 (200th) 0.1235 [53] Li1.2Mn0.6Ni0.2O2 257 92 (200th) 0.04 [54] Li1.2Mn0.54Ni0.13Co0.13O2 282.1 97.6 (100th) 0.024 [55] LiFePO4 159.2 97 (100th) 0.03 [56] Li1.2Mn0.4Ti0.4O2 (lower SRO) ~260 ~88.6 (10th) ~1.1 [31] Li1.2Mn0.4Zr0.4O2 (higher SRO) ~170 ~53.8 (10th) ~4.6 [31] Li1.2Mn0.55Ti0.25O1.85F0.15 (lower SRO) 313 ~90 (5th) ~2 [52] Li1.2Mn0.55Ti0.25O1.85F0.15 (higher SRO) 273 ~90 (5th) ~2 [52] Li1.2Ti0.4Mn0.4O2.0 (octahedron-type SRO) ~175 − − [50] Li1.2Ti0.2Mn0.6O1.8F0.2 (cube-type SRO) ~150 − − [50] Li1.3Mn3+0.4Ti0.3O1.7F0.3 (higher SRO) 220 ~90 (5th) ~2 [51] Li1.3Mn2+0.2Mn3+0.2Ti0.1Nb0.2O1.7F0.3 (medium SRO) 269 ~90 (5th) ~2 [51] Li1.3Mn2+0.1Co2+0.1Mn3+0.1Cr3+0.1Ti0.1Nb0.2O1.7F0.3 (lower SRO) 307 ~90 (5th) ~2 [51] Table 1.
Comparison of capacity, capacity retention, and degradation rates over extended cycling between classic LIB materials and typical DRXs with different extents of SRO
-
Materials Capacity
(mAh g−1) (1st cycle charge/
discharge)Retention
compared to
the first
dischargeVoltage
range
(V)Ref. Li1.2Mn0.4Ti0.4O2 ~260/~240 67% (50th) 1.5–4.8 [57] Li1.3Nb0.3Mn0.4O2 350/~300 54% (20th) 1.5–4.8 [15] Li1.3Ta0.3Mn0.4O2 315/250 30% (30th) 1.5–4.8 [62] Li1.2Ti0.4Mo0.4O2 136/275 85% (30th) 1.0–4.0 [63] Li1.08Fe0.76Ti0.16O2 ~60/~35 − 2.2−4.5 [64] Li1.2Cr0.4Mn0.4O2 −/387 − 1.5–4.8 [65] LiNi0.5Ti0.5O2 161.1/118.6 67% (50th) 1.5–4.5 [66] Li1.25Fe0.5Nb0.25O2 ~290/250 [67] Li1.2Nb0.2Mn0.6O2 310/269 84% (30th) 1.5–4.8 [61] LiNi0.5V0.5O2 −/264 57% (50th) 1.3–4.5 [68] Li1.9Mn0.95O2.05F0.95 291/283 57% (50th) 2.0–4.8 [69] Li1.2Mn0.45Ti0.35O1.95F0.05 −/255 75.65% (20th) 1.5–4.8 [70] Li2Ti0.5V0.5O2F −/285 81% (25th) 1.3–4.1 [71] Table 2.
Summary of representative DRXs with various d0 transition metals
Figures
(11)
Tables
(2)