-
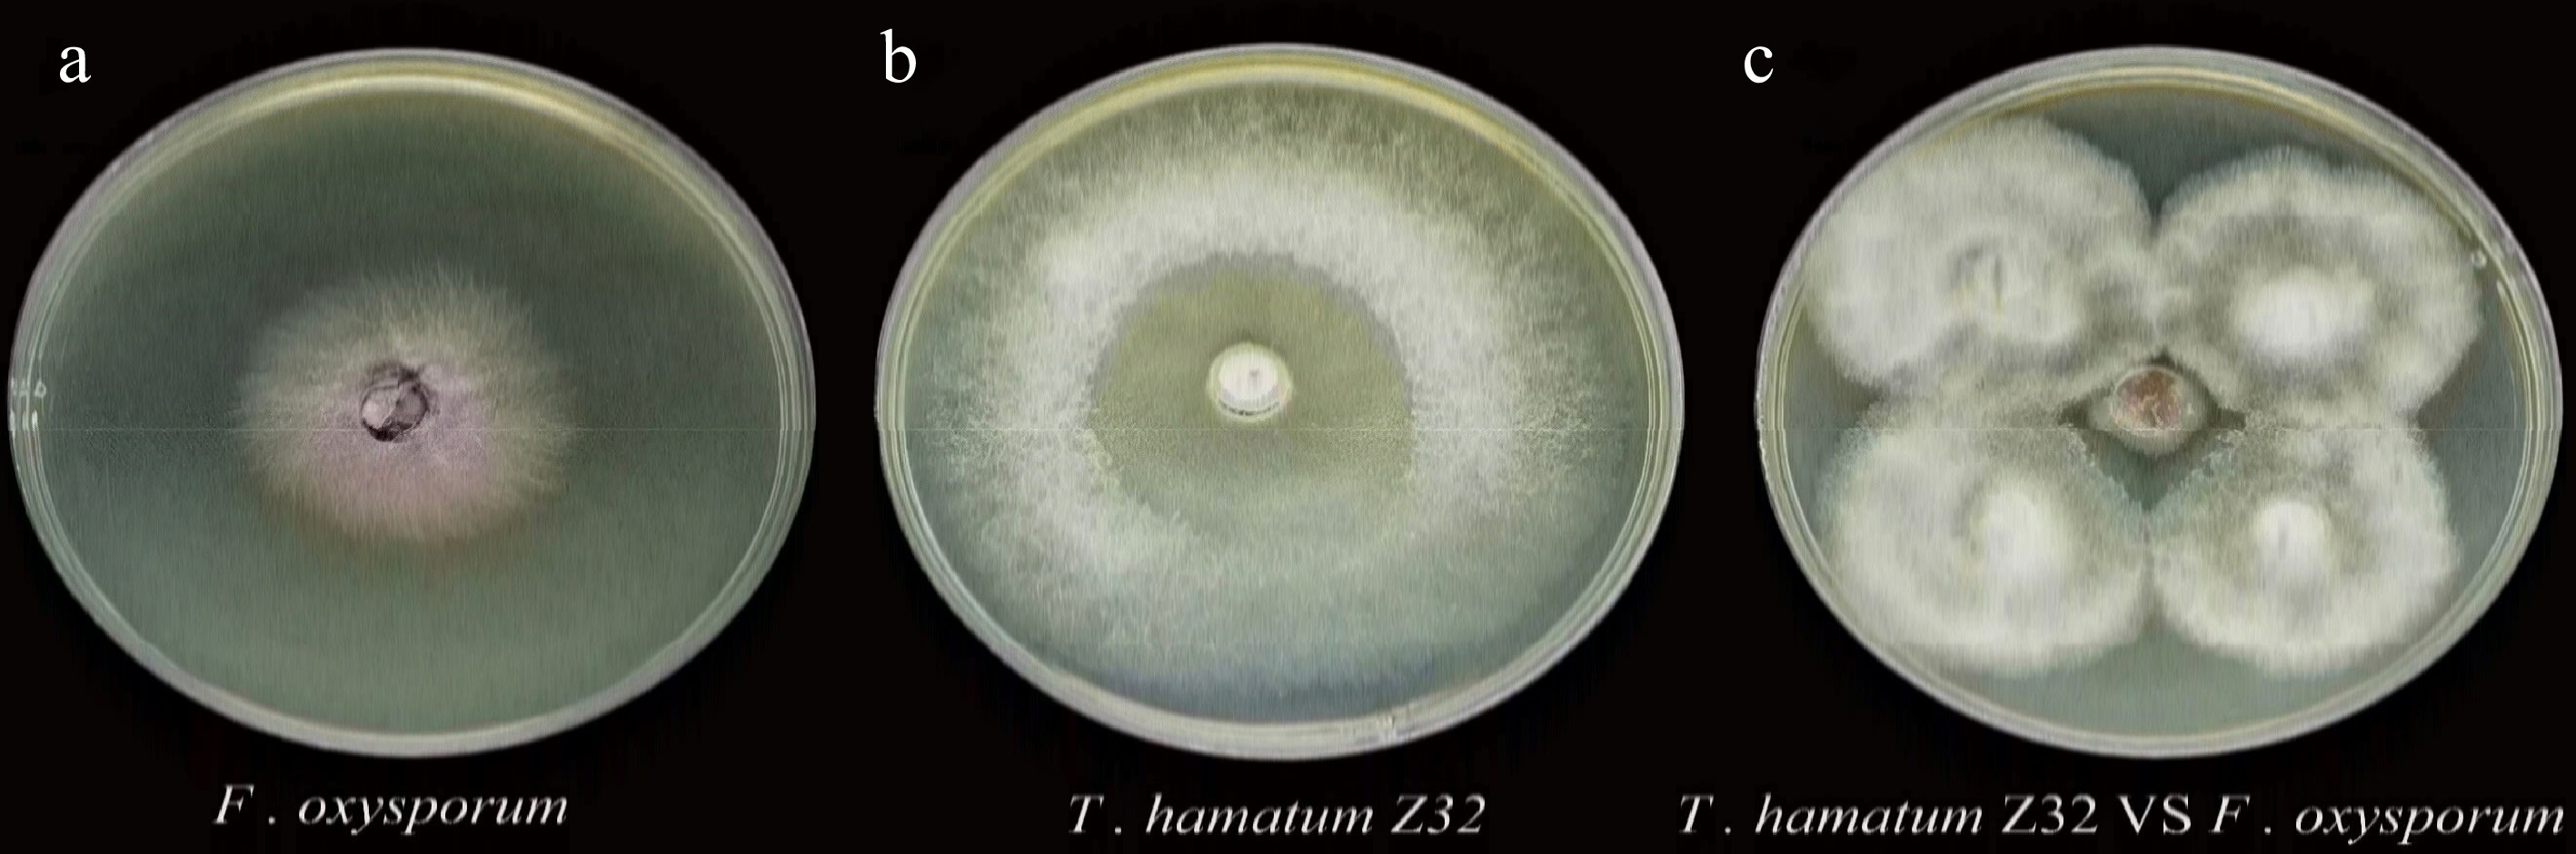
Figure 1.
Individual cultures and dual culture assay of T. hamatum Z32 and F. oxysporum.
-
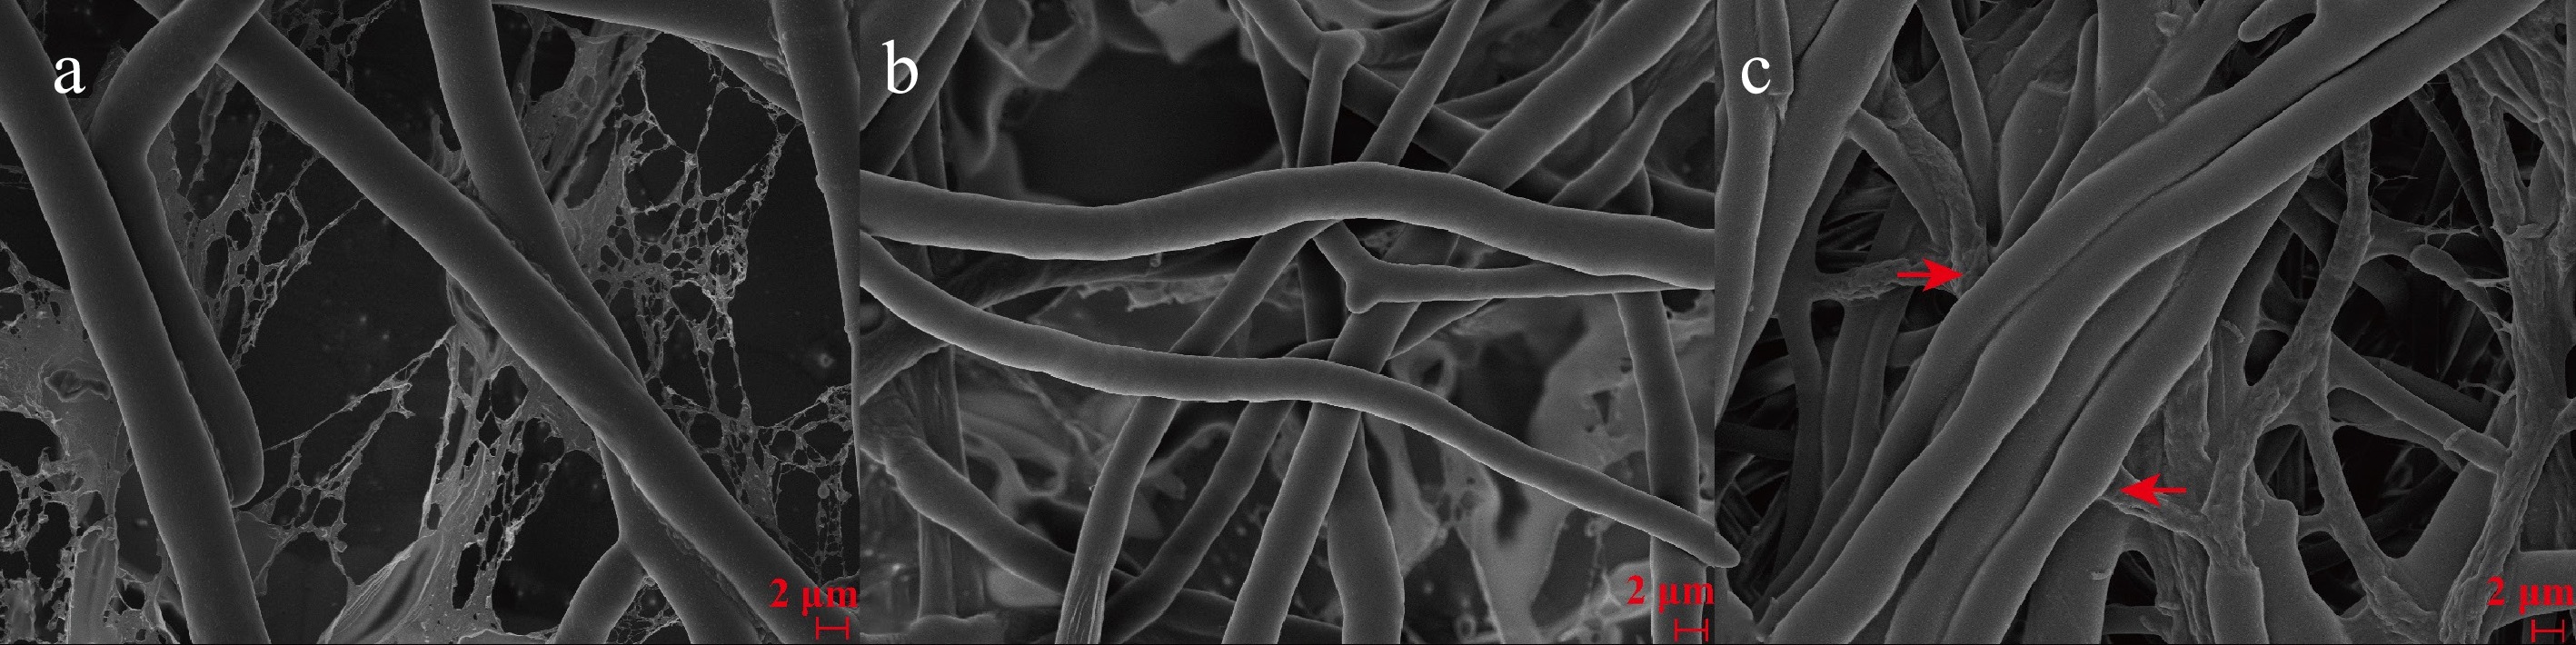
Figure 2.
Electron microscope images taken using scanning technology were recorded and used to show the surface and structural characteristics of the antimicrobial species.
-
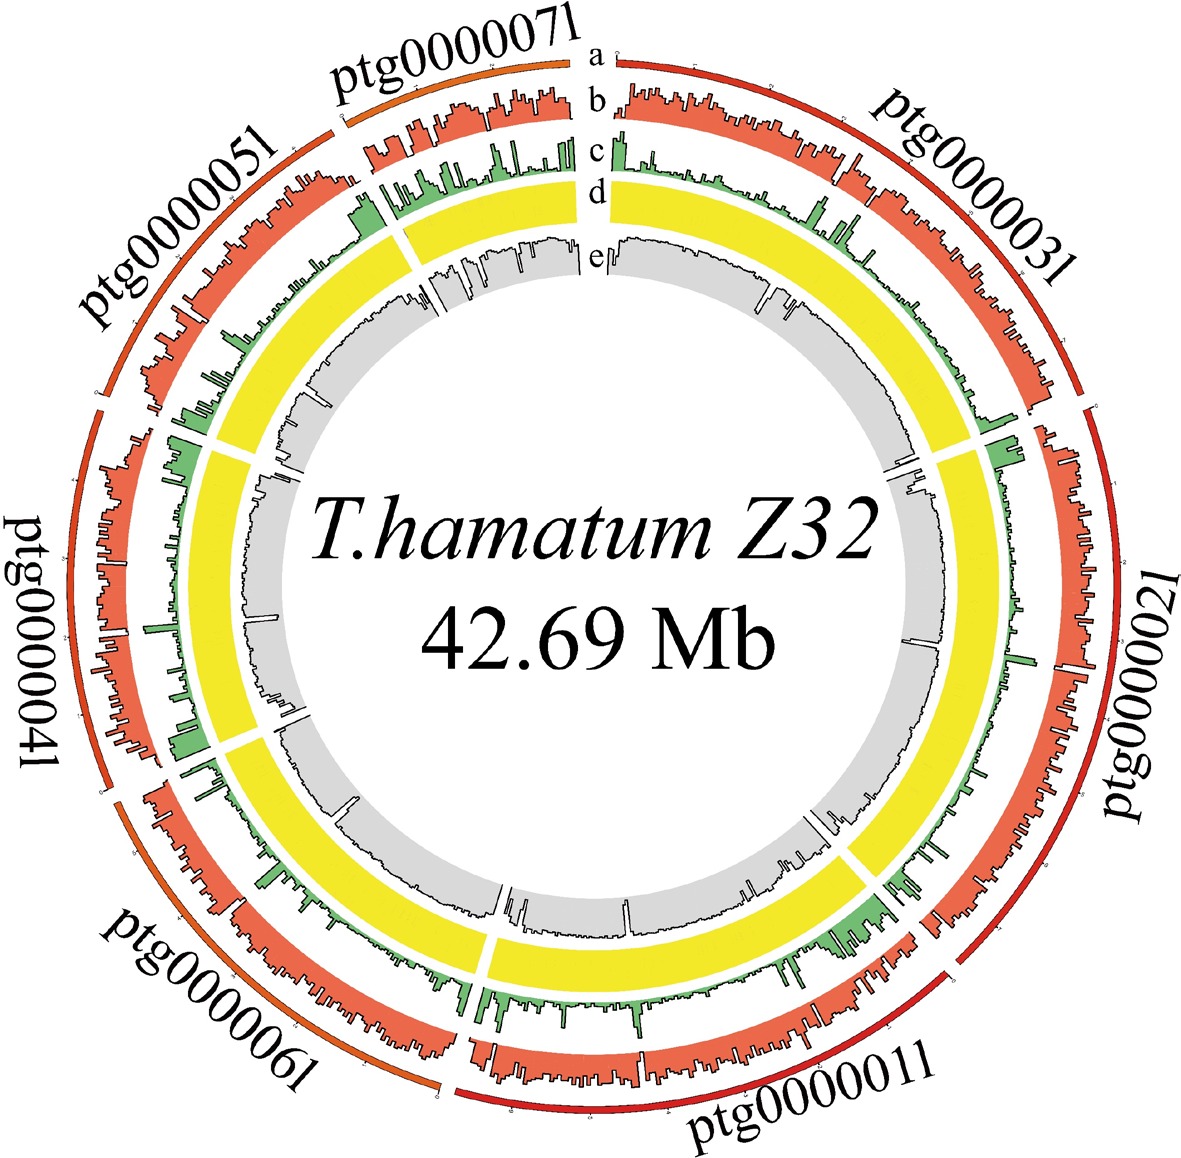
Figure 3.
Circos plot displaying the genome of T. hamatum Z32.
-
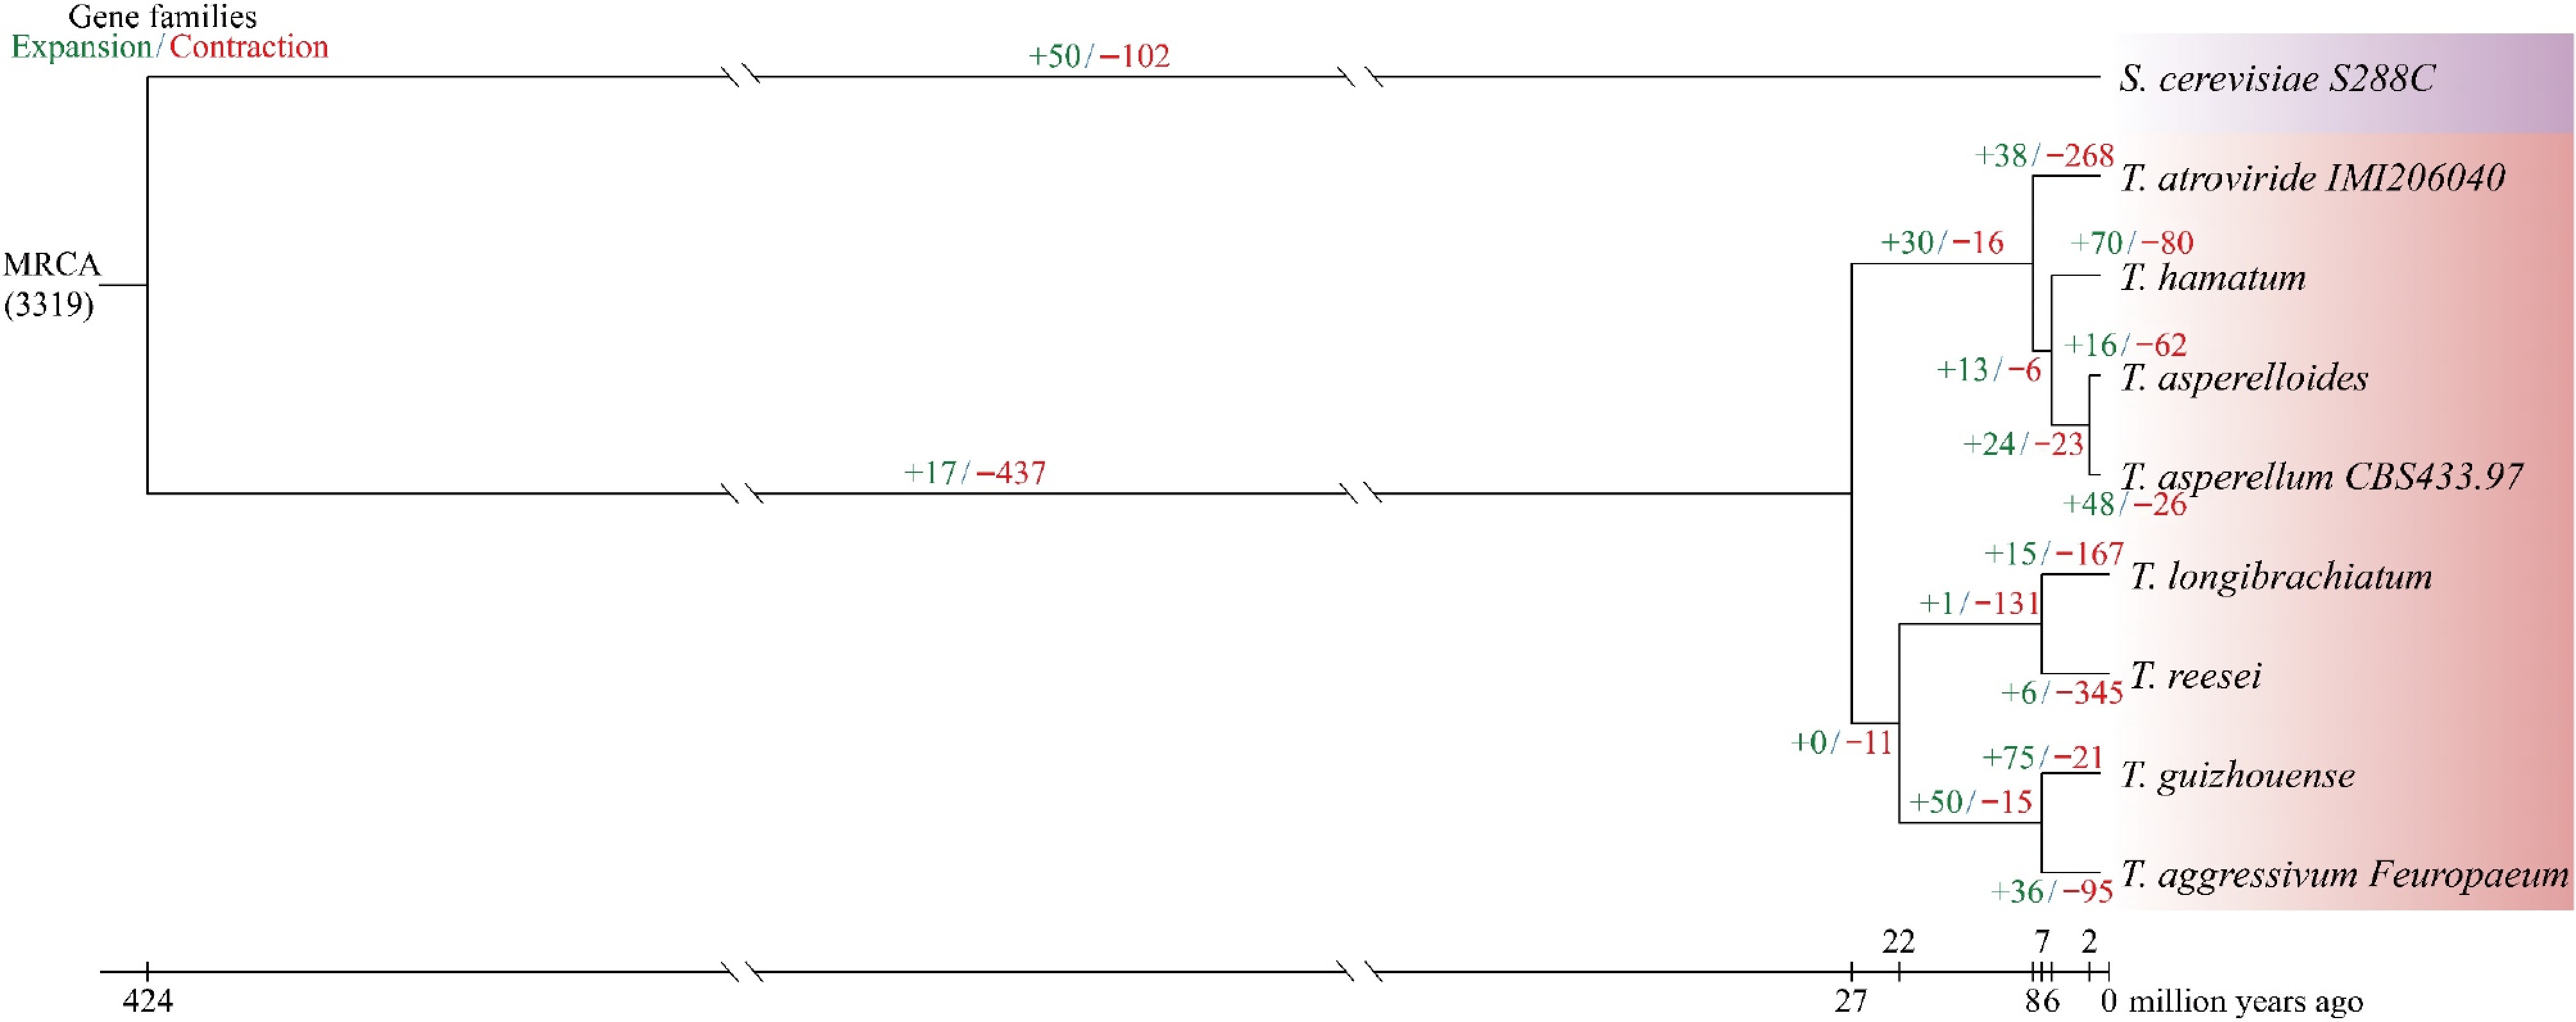
Figure 4.
A maximum likelihood phylogenetic tree was generated using 1,884 single-copy orthologs from eight Trichoderma strains and one outgroup.
-
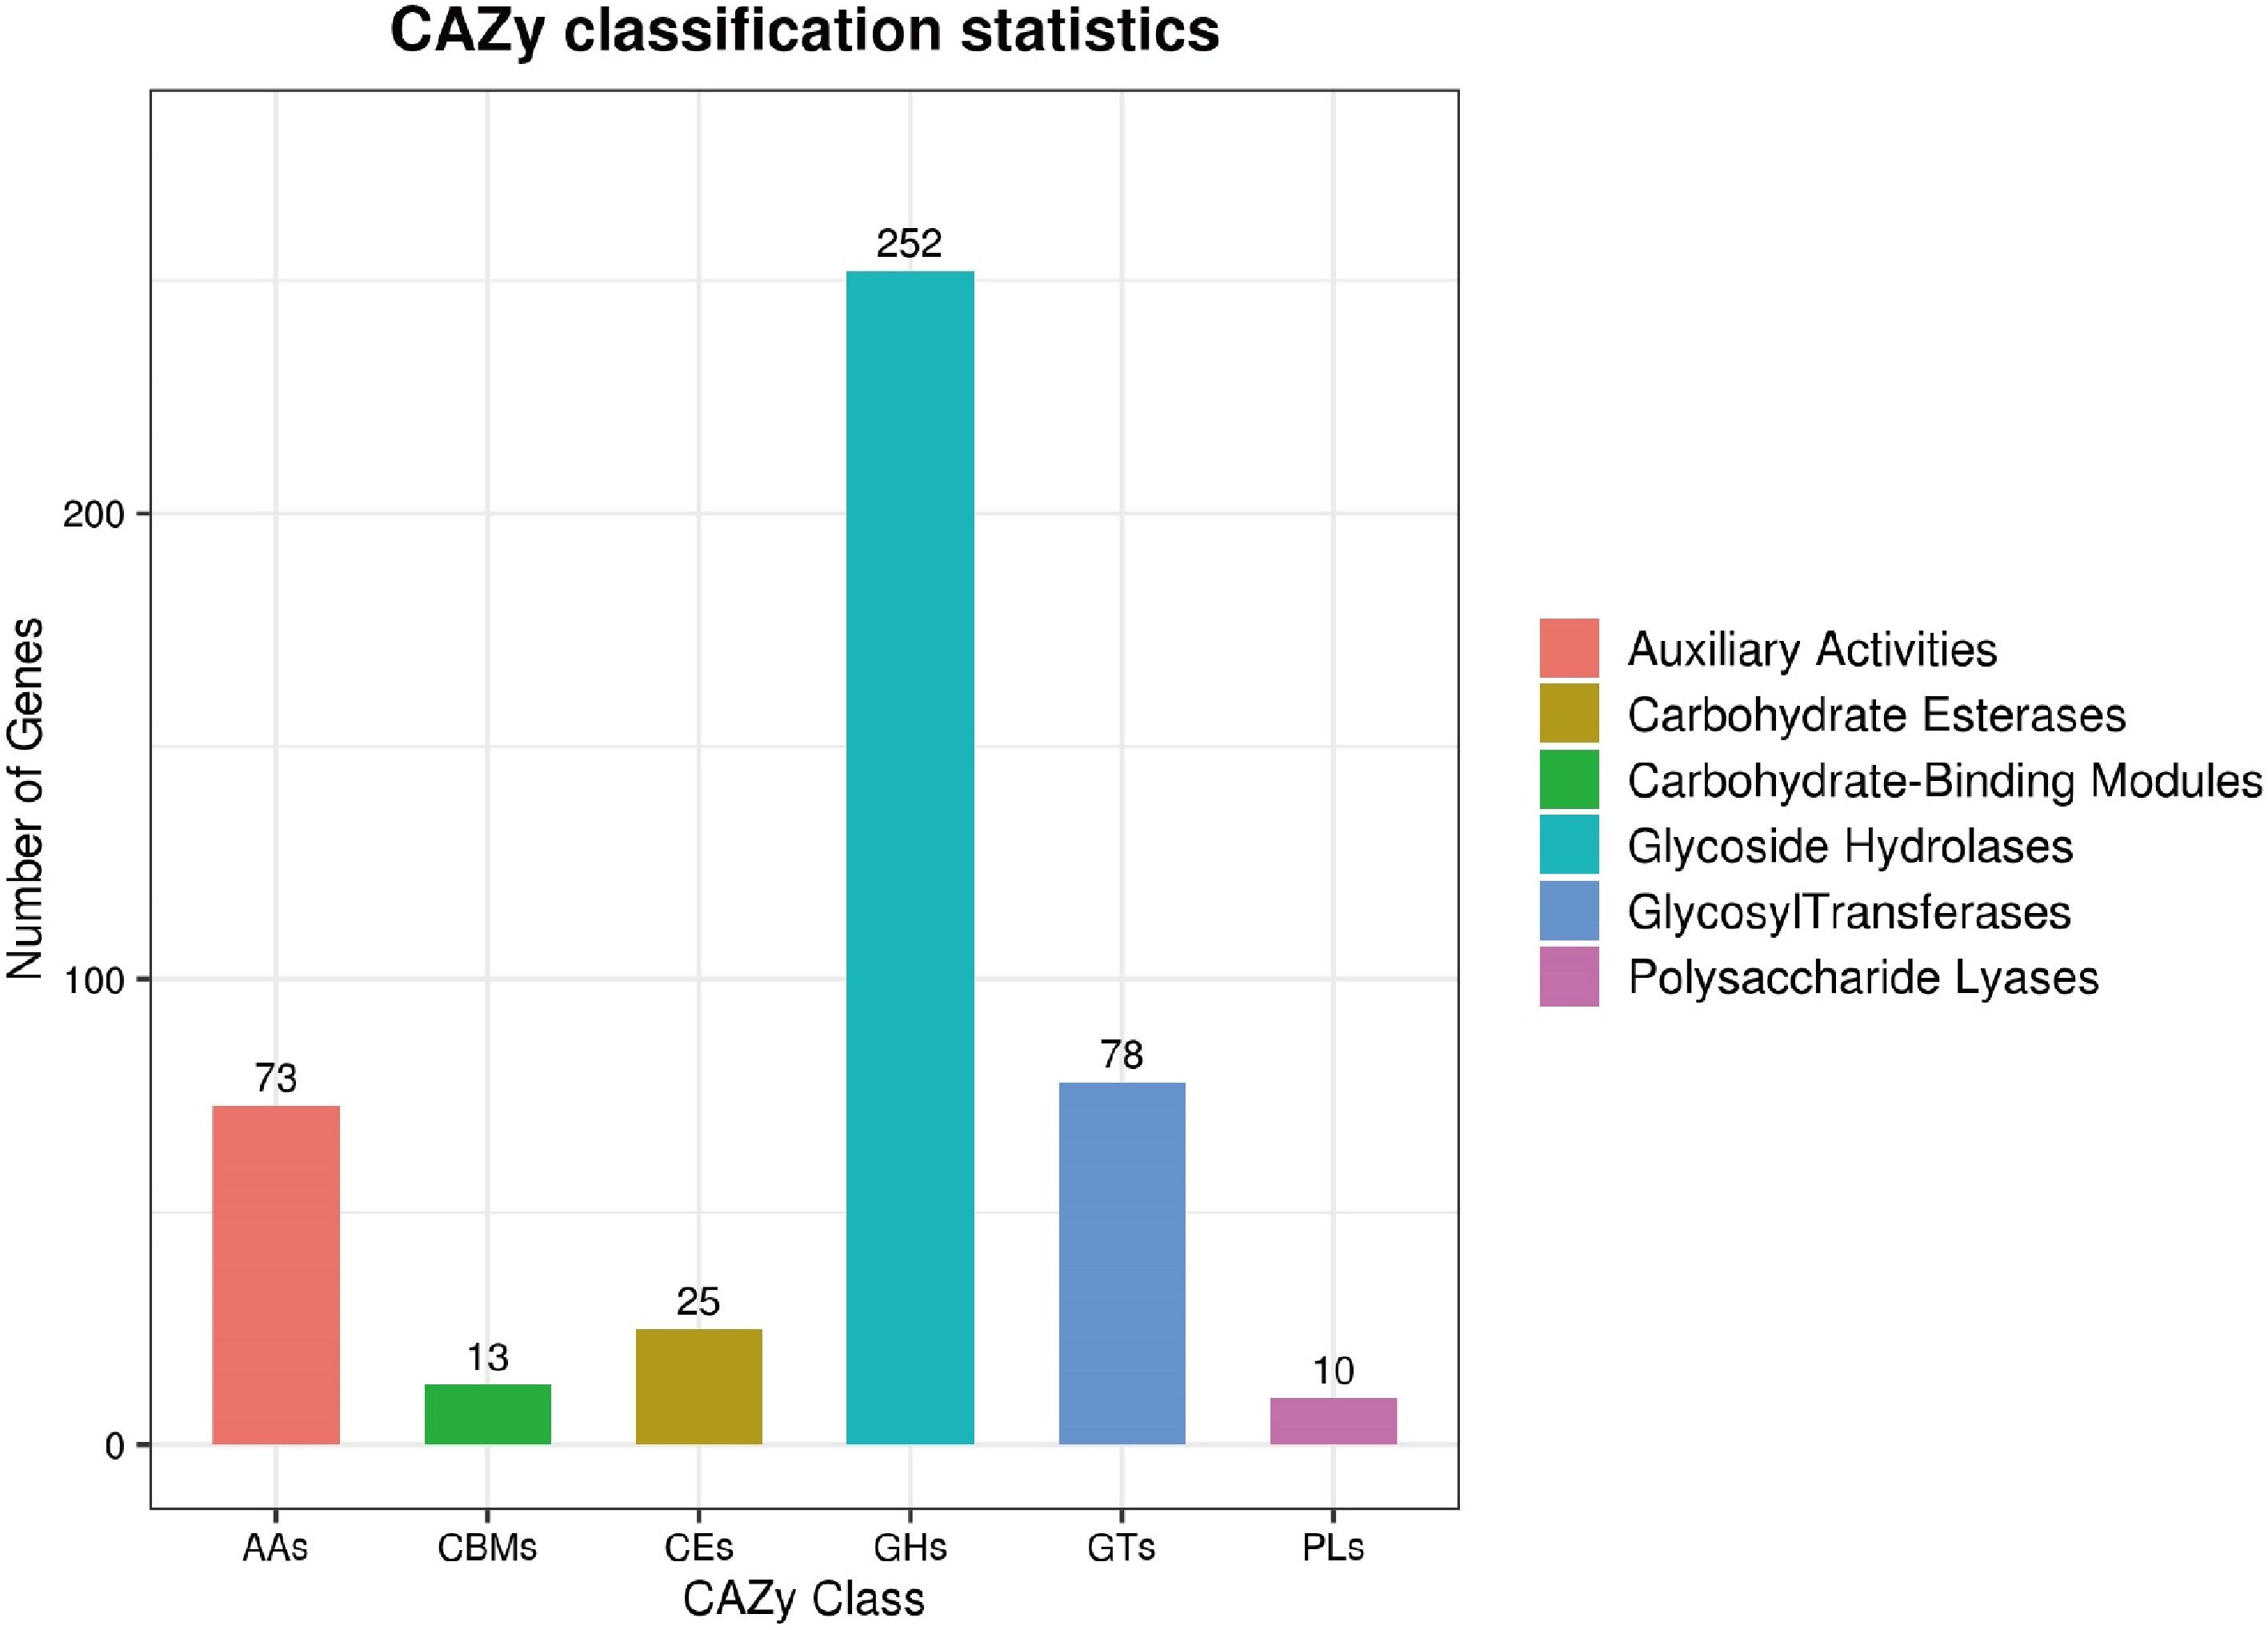
Figure 5.
The predicted CAZyme genes in T. hamatum Z32 were grouped into different families.
-
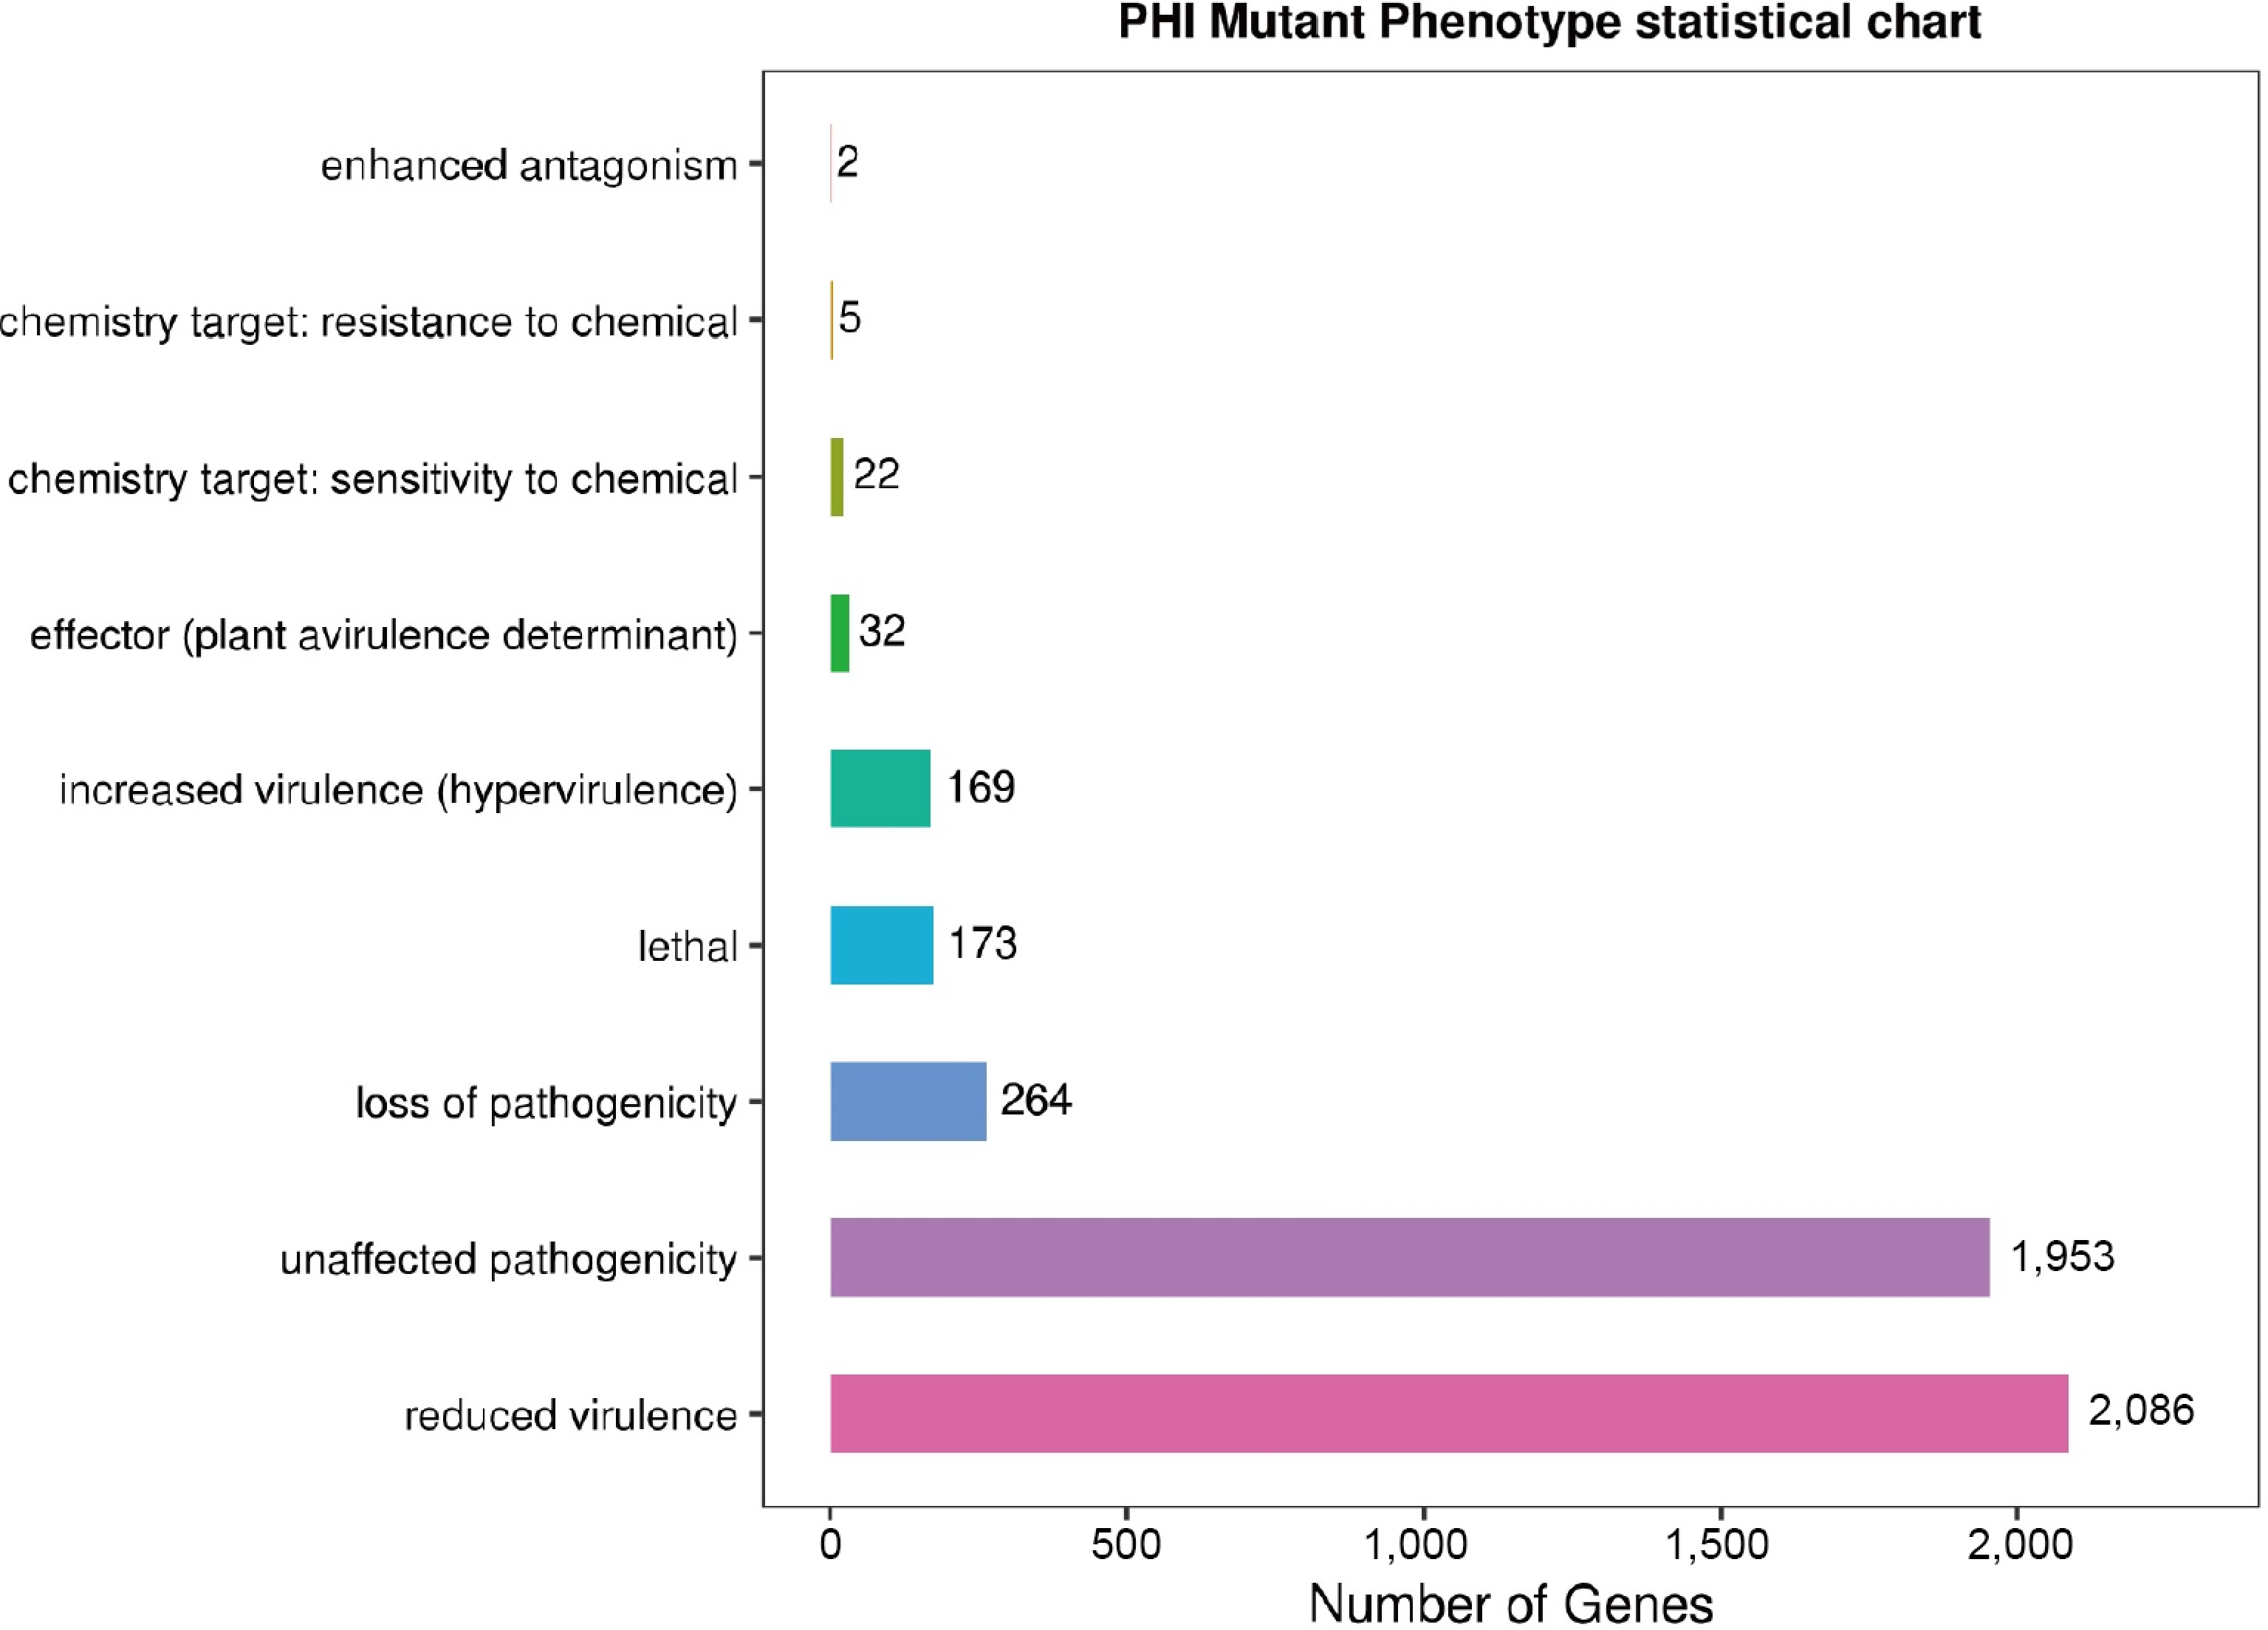
Figure 6.
The figure shows the distribution of pathogen–host interaction (PHI) mutation phenotypes, with nine mutation types along the vertical axis and the corresponding number of annotated genes on the horizontal axis.
-
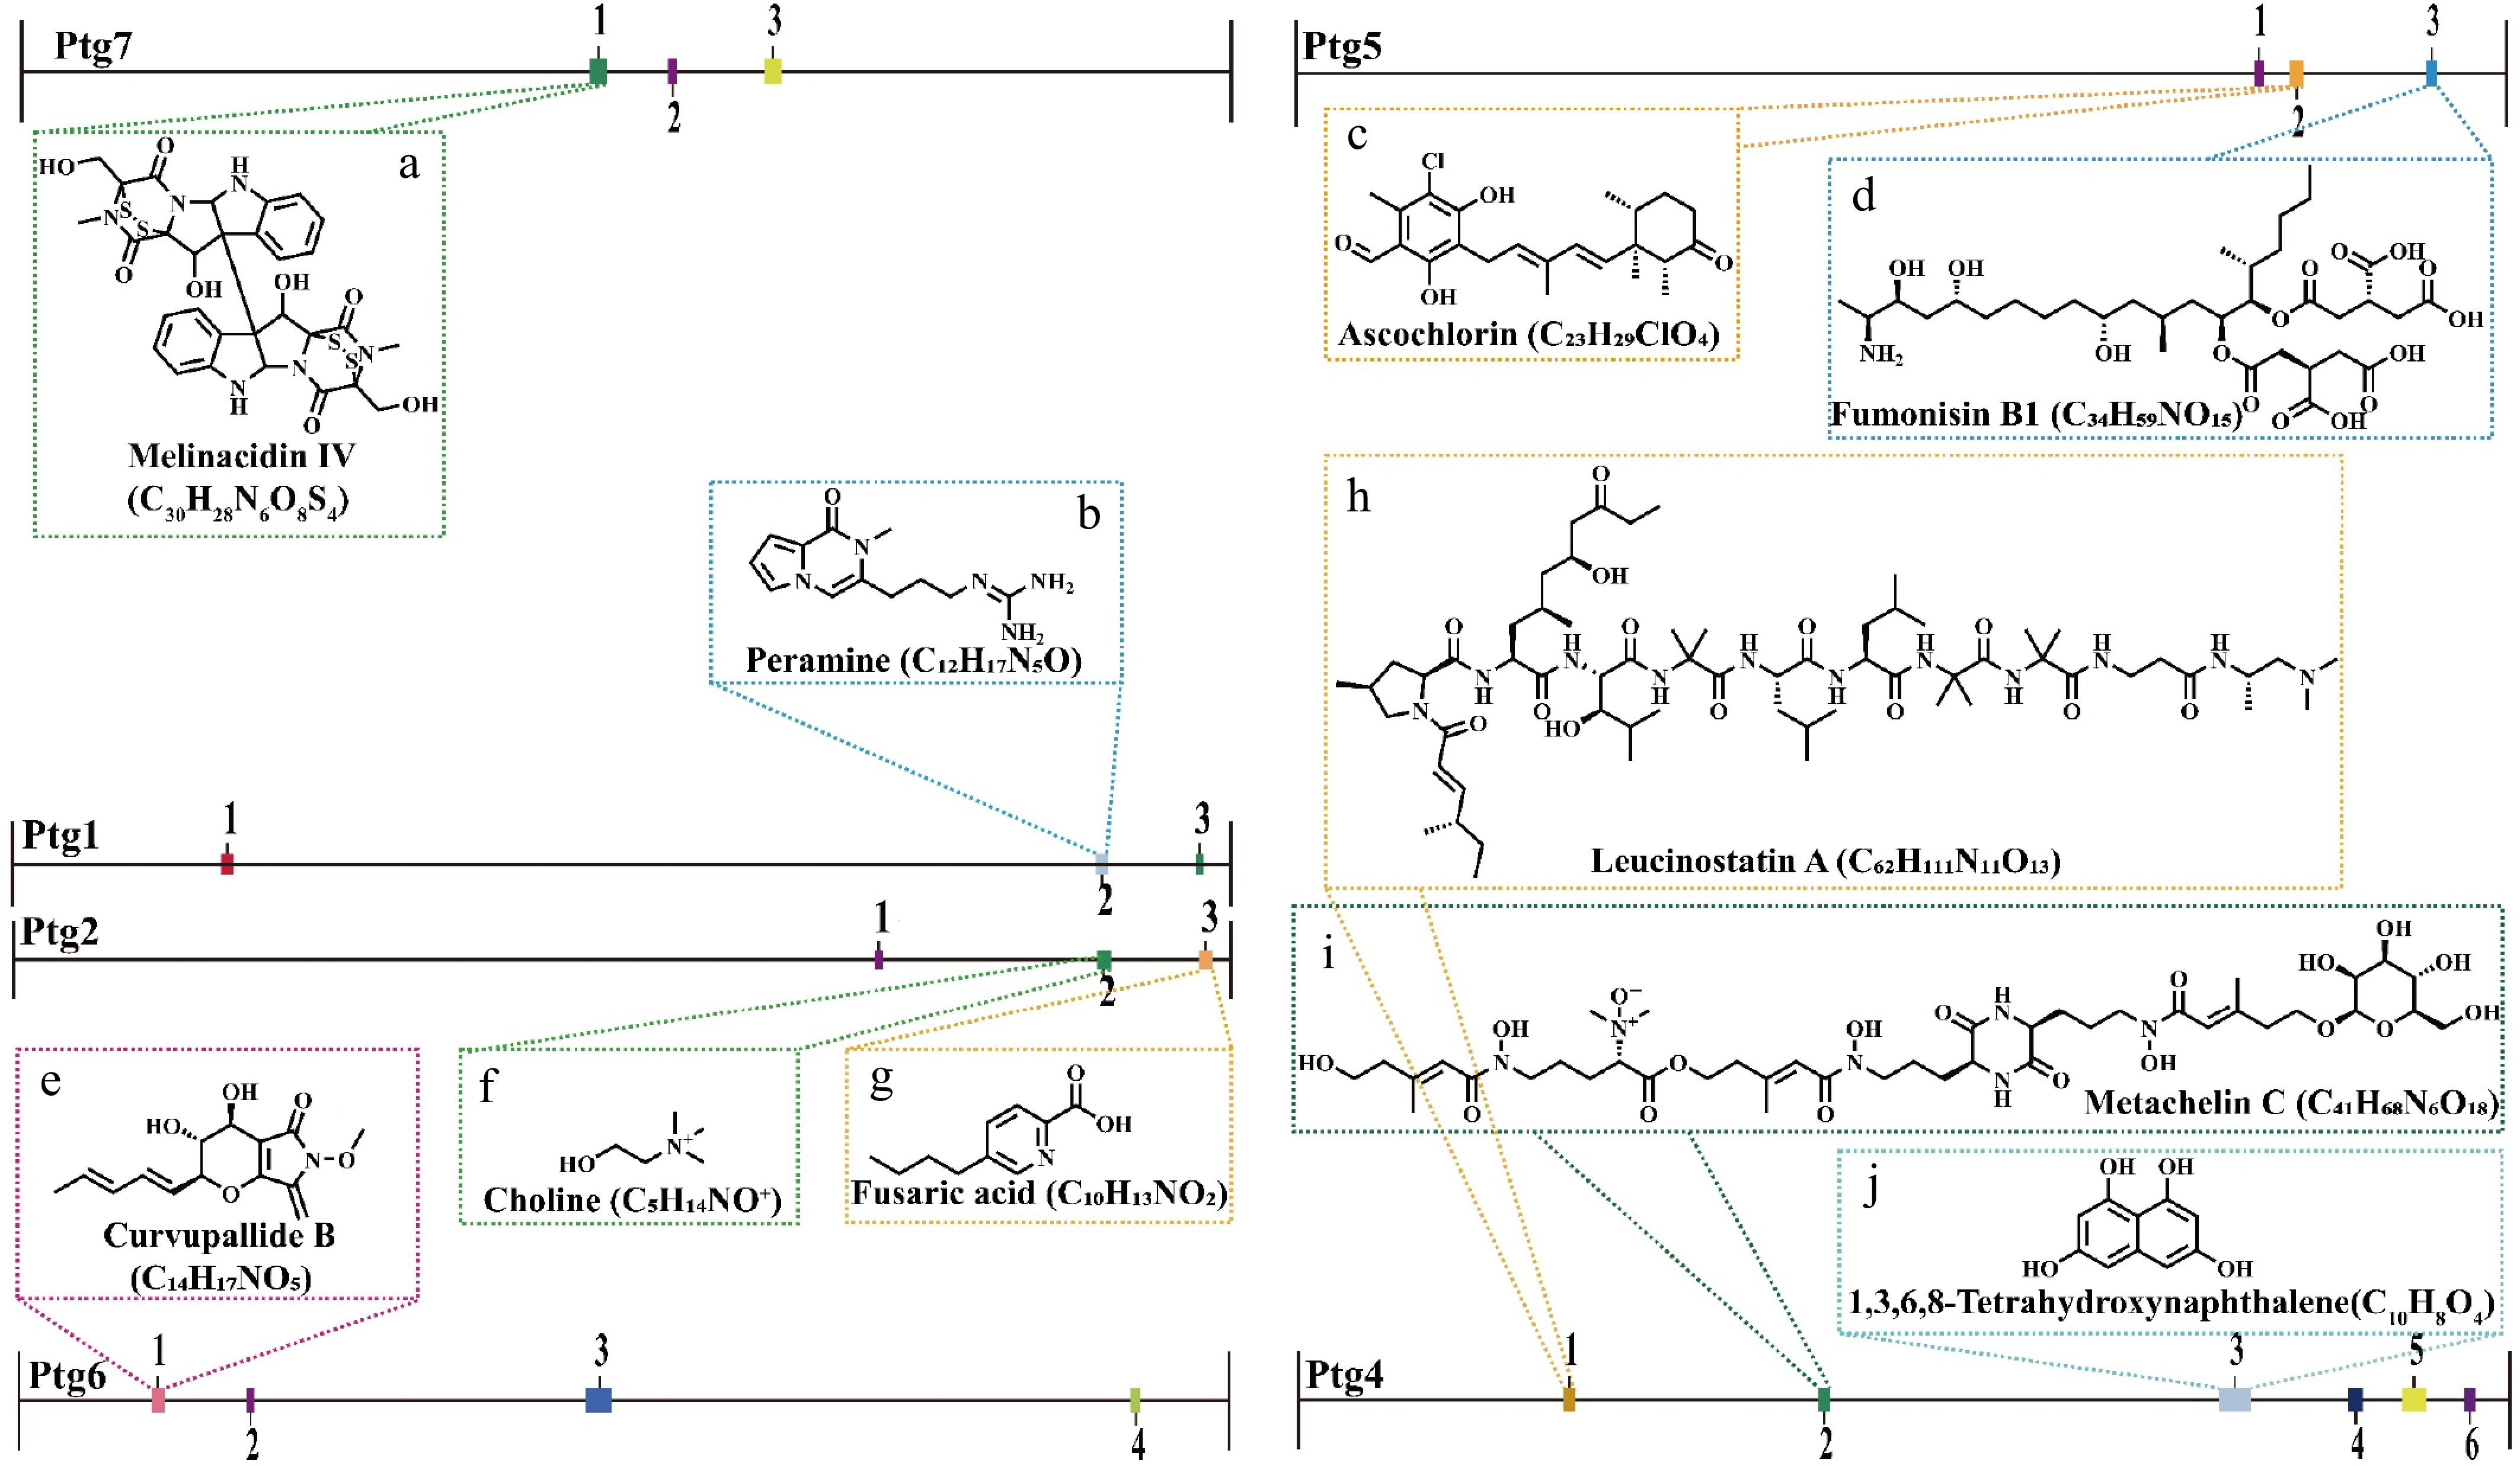
Figure 7.
The secondary metabolite biosynthetic gene clusters identified in the T. hamatum Z32 genome using antiSMASH (version 7.0).
-
Type Copy Average length (bp) Total length (bp) % of genome miRNA 0 0.00 0 0.00 tRNA 221 87.54 19,346 0.05 rRNA 204 2,209.75 450,790 1.06 18S 75 1,794.55 134,591 0.32 28S 79 3,929.13 310,401 0.73 5S 50 115.96 5,798 0.01 snRNA 25 138.20 3,455 0.01 CD-box 14 129.14 1,808 0.00 hypermethylated allele-coxA associated (HACA)-box 3 170.33 511 0.00 splicing 8 142.00 1,136 0.00 scaRNA 0 0.00 0 0.00 Table 1.
ncRNA statistics and composition in T. hamatum Z32.
Figures
(7)
Tables
(1)