-
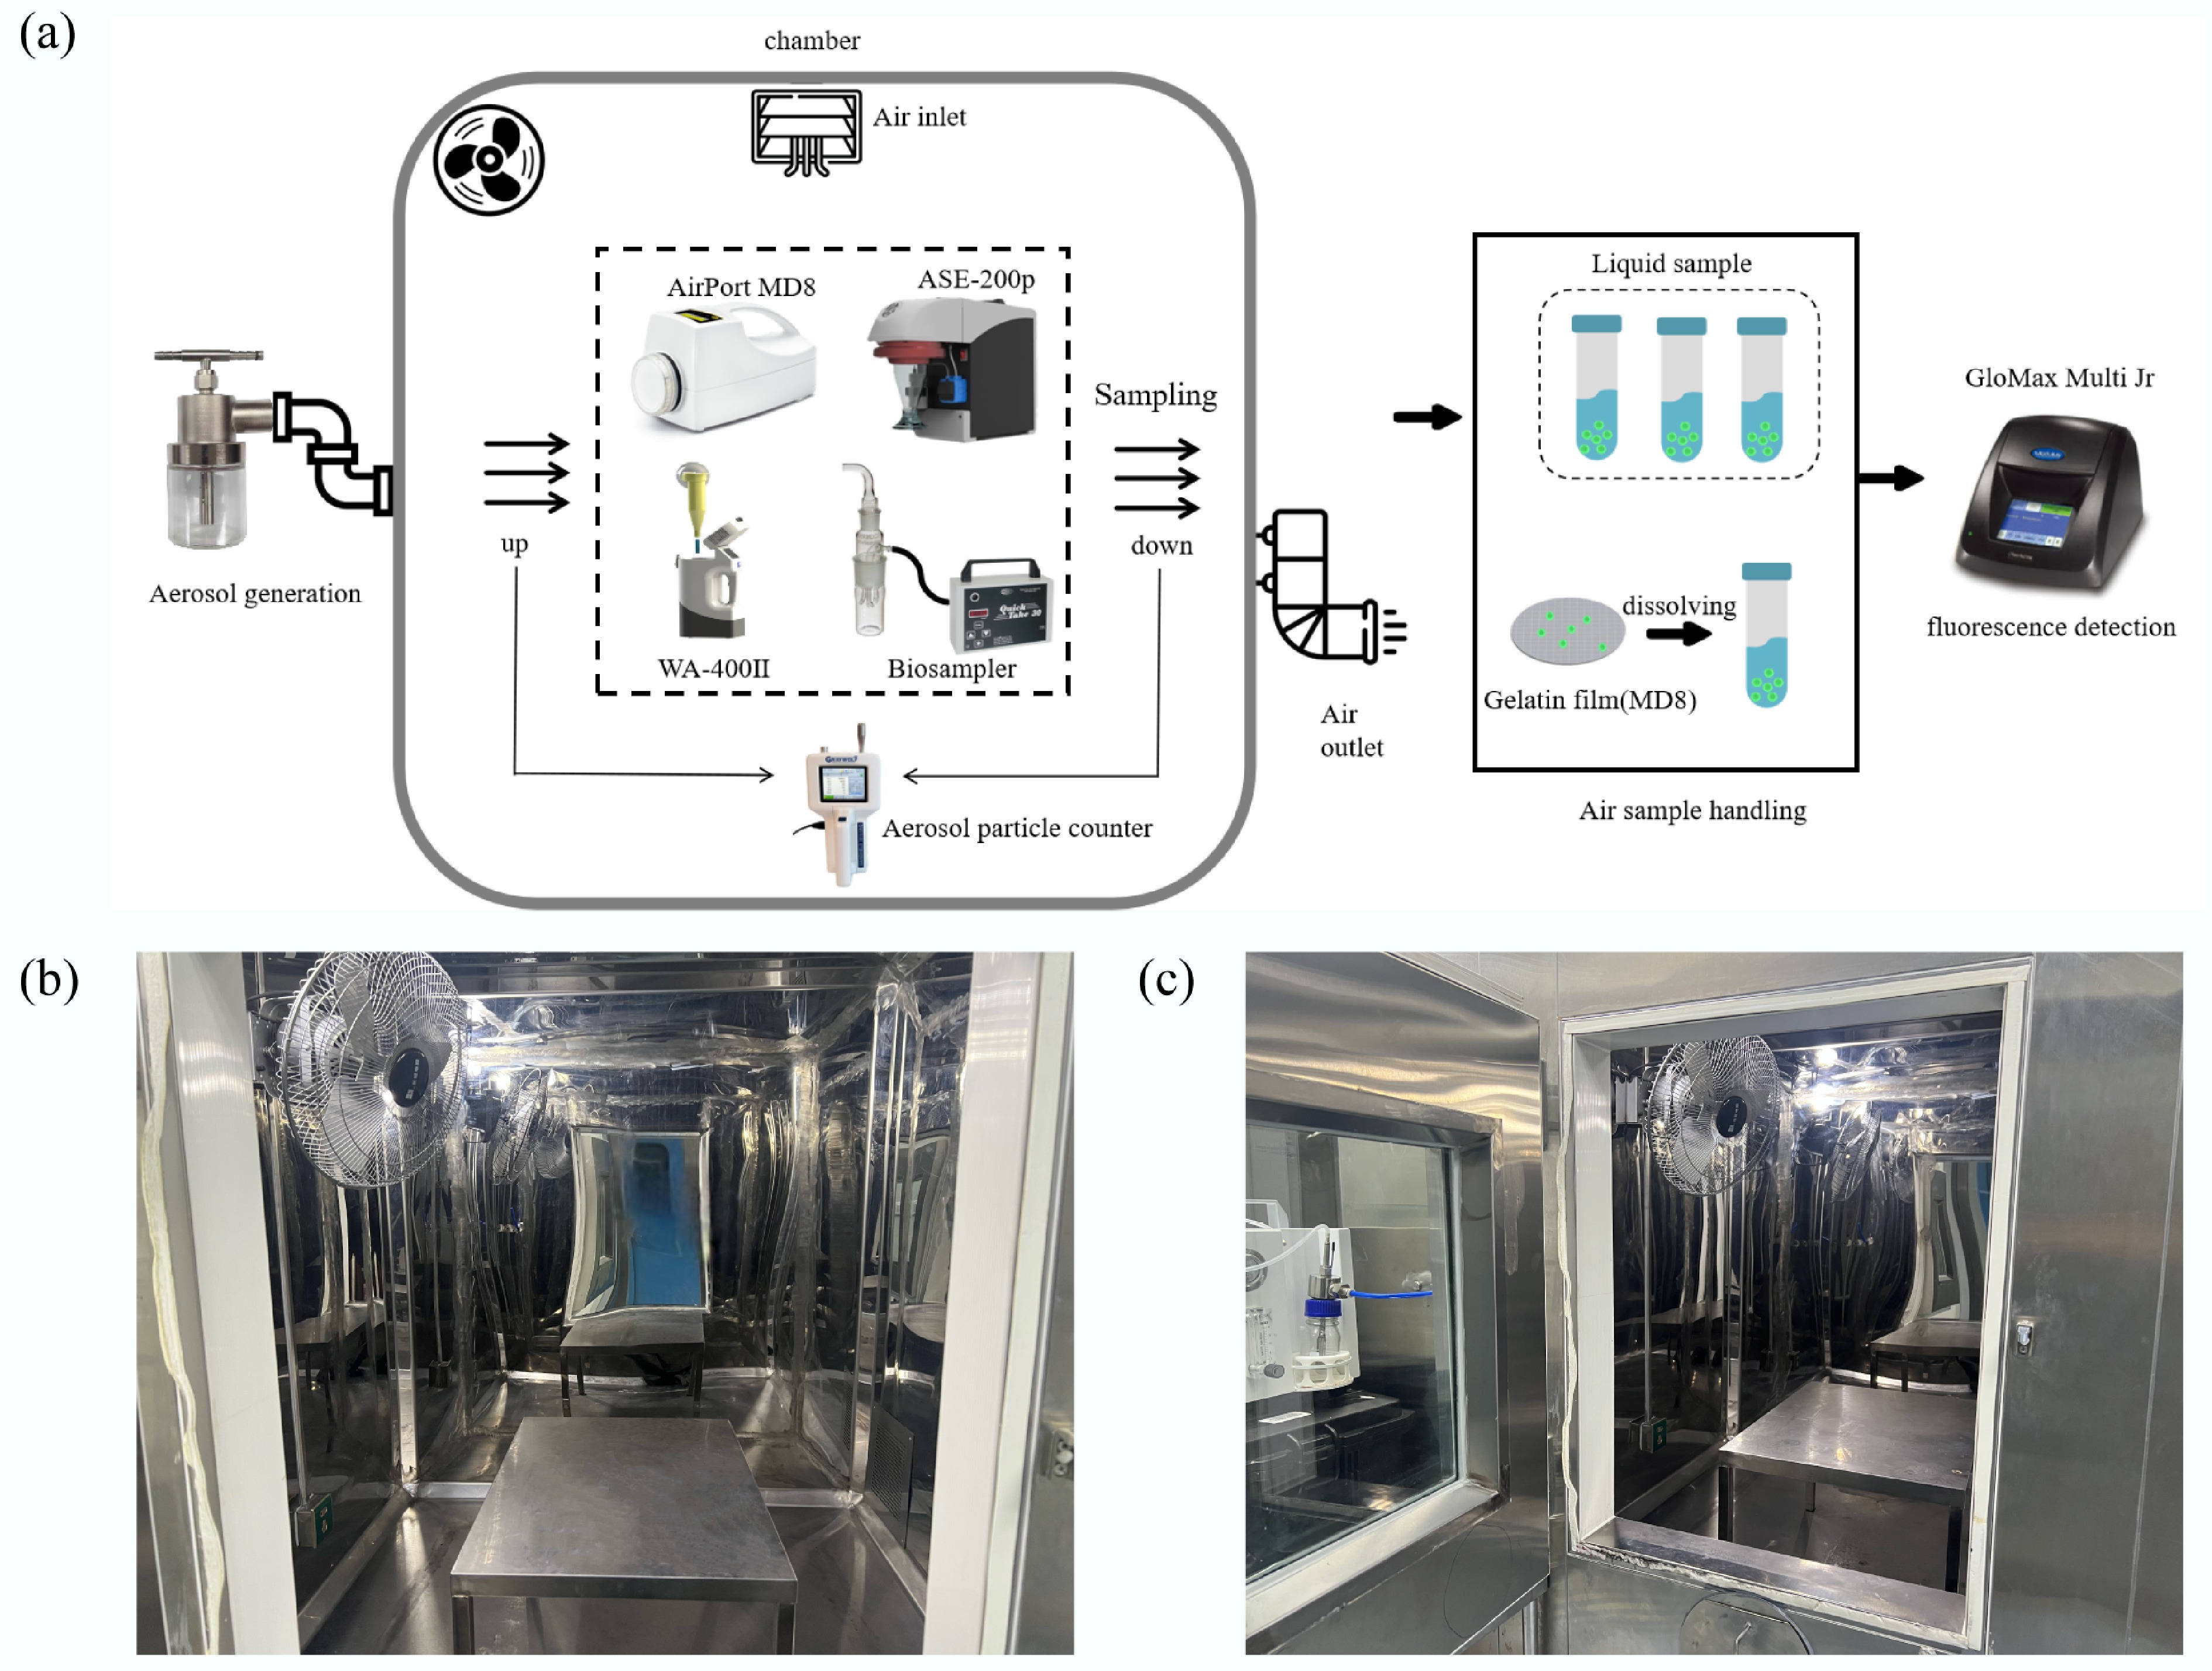
Figure 1.
Flow chart of the study and structural configuration of the environmental chamber. (a) Operational workflow for the experimental chamber and following fluorescence detection. (b) Internal structural layout of the environmental chamber. (c) Connection schematic linking the environmental chamber to the aerosol generator.
-
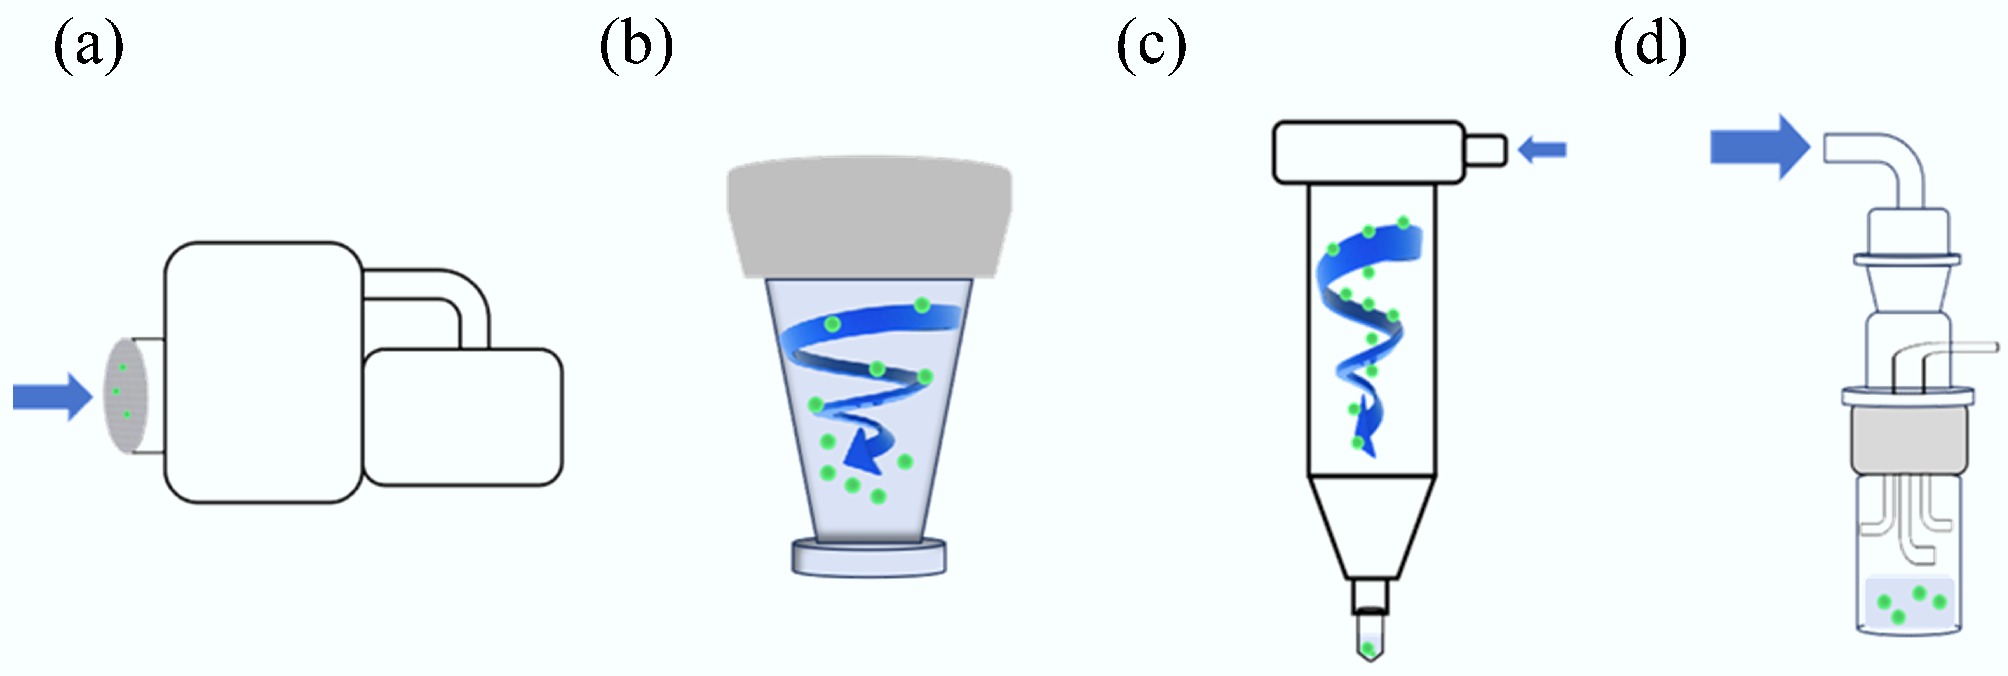
Figure 2.
Particle capture mechanisms for four samplers. (a) Airport MD8. (b) ASE-200p. (c) WA-400II. (d) Biosampler.
-
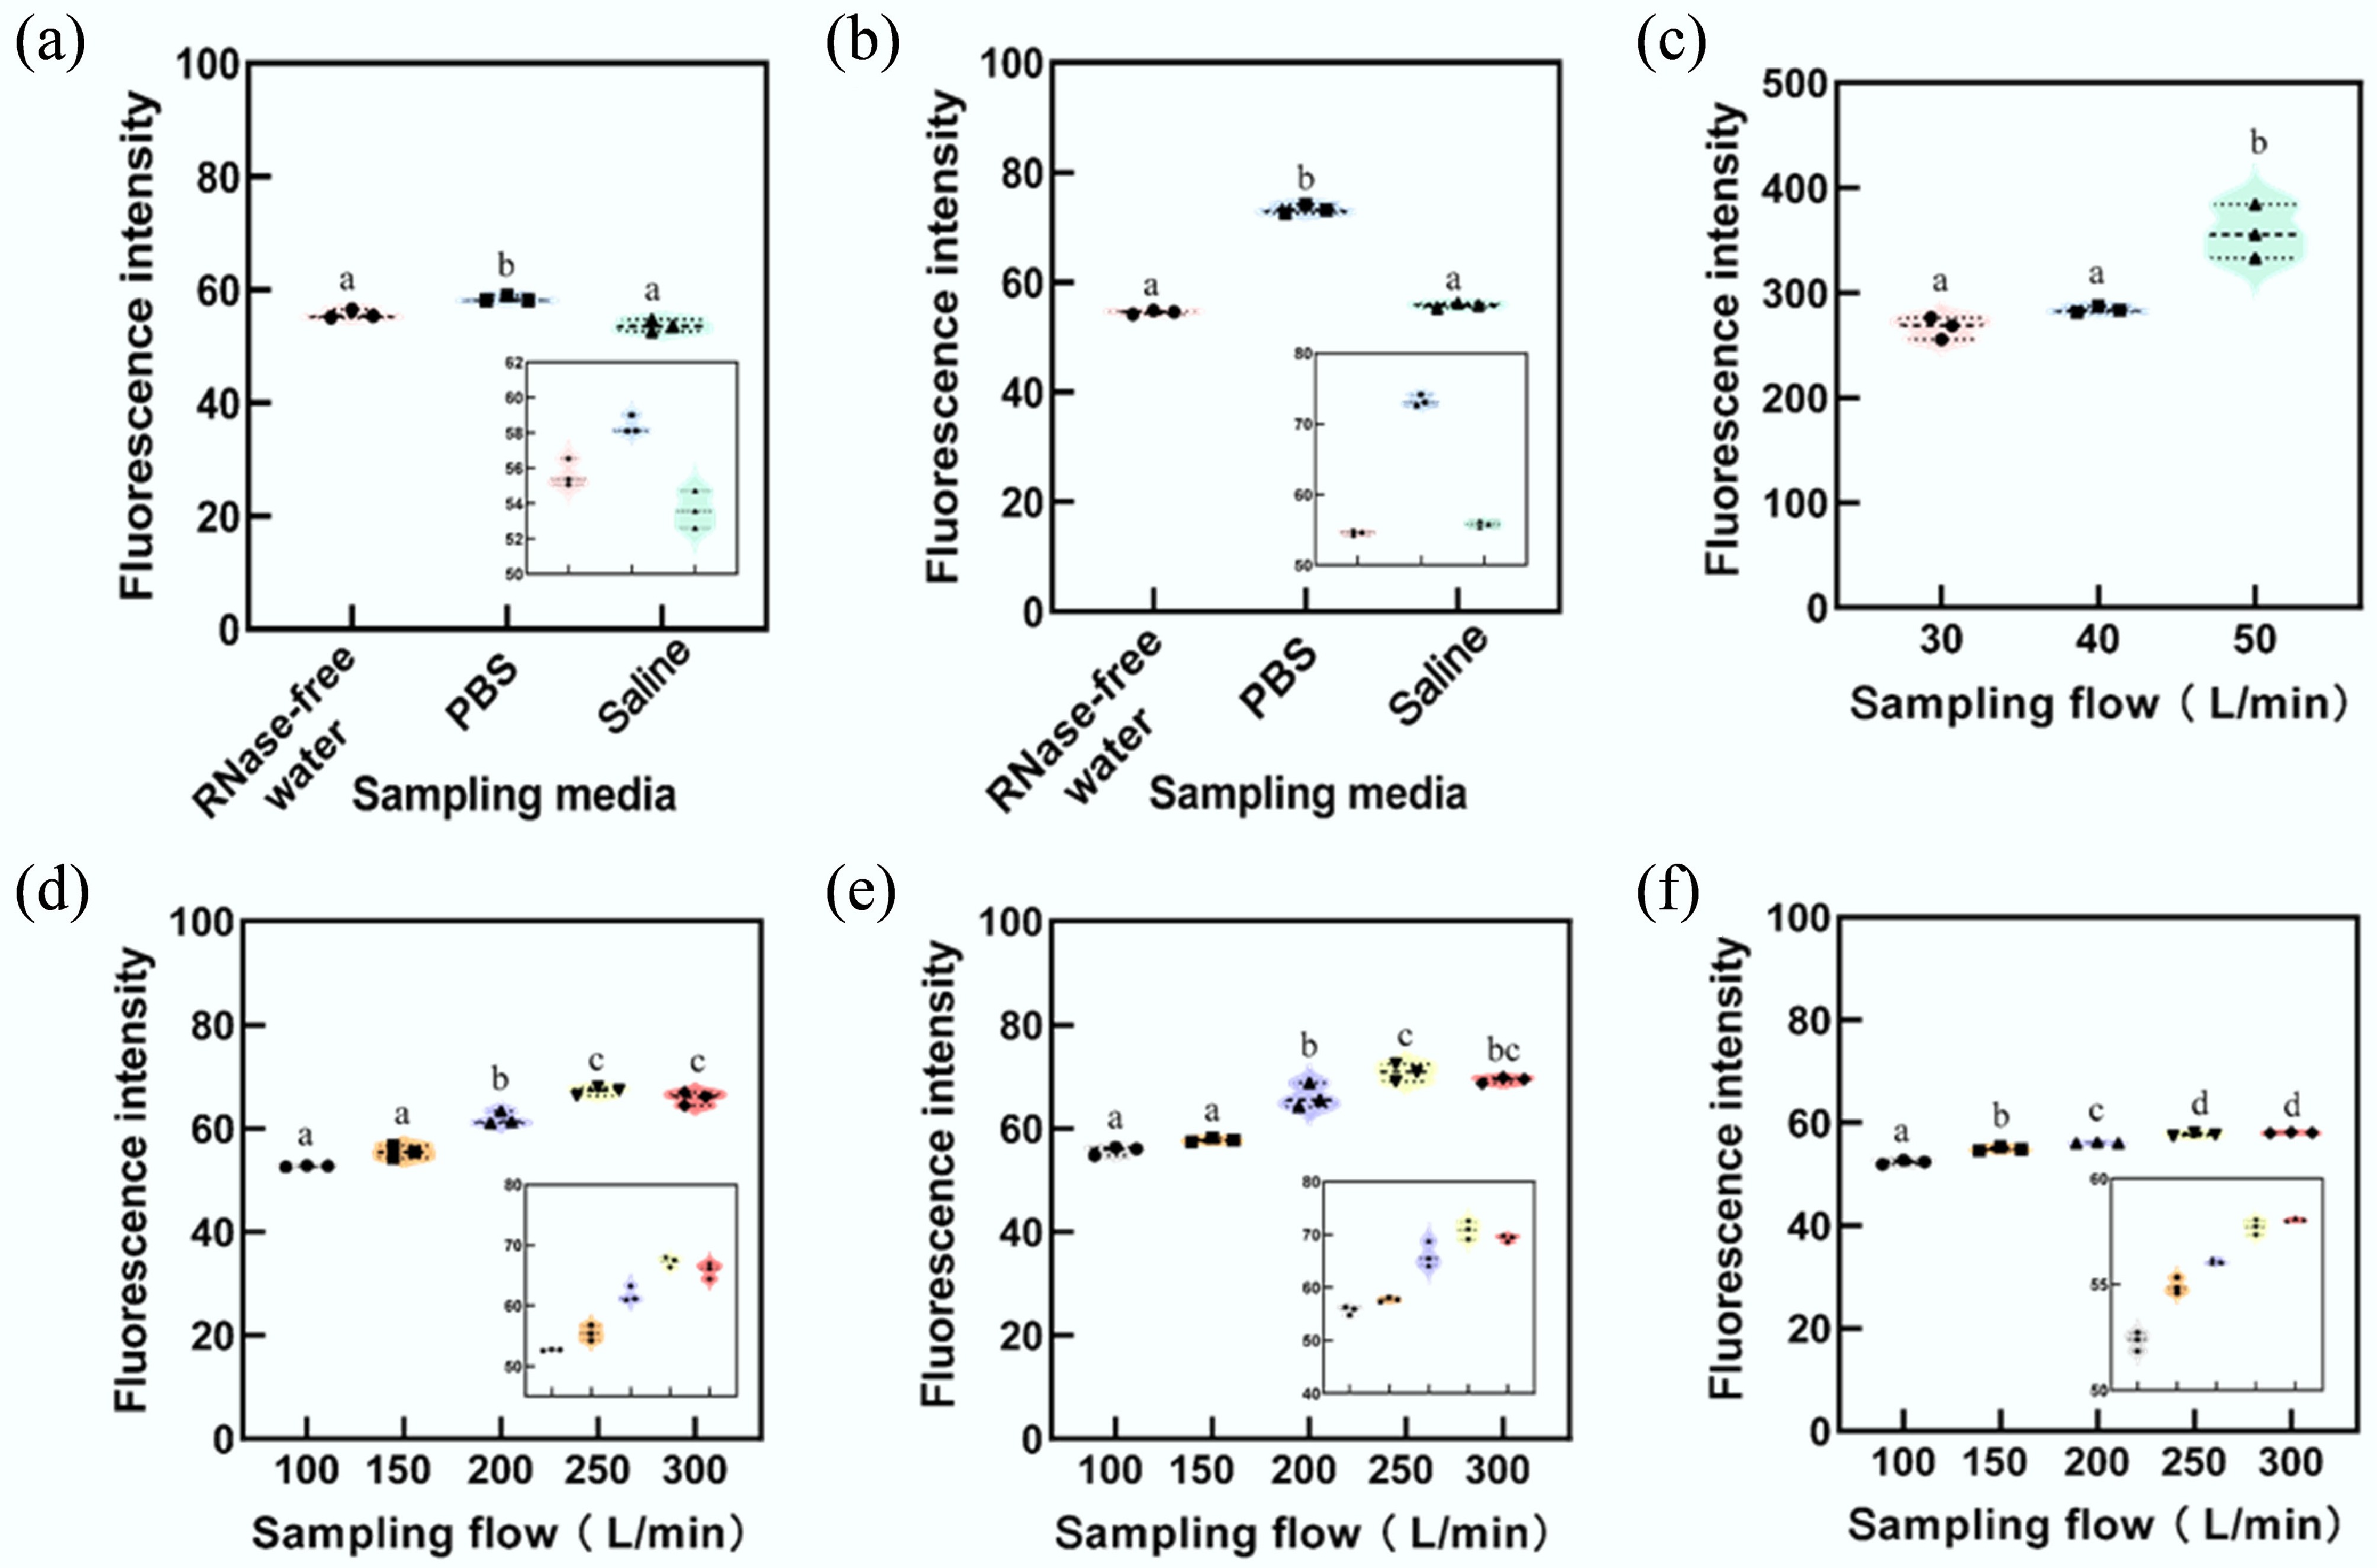
Figure 3.
Fluorescence intensity of sampled microspheres with a diameter of 0.3 μm. The membrane filtration sampler demonstrated superior performance in collecting 0.3 μm particles compared to other samplers. Among the liquid sampling media tested, PBS showed the highest efficiency. To enhance clarity and emphasize the differences in results, specific stacked plots have been enlarged. Subfigures illustrate results for: (a) Liquid impinger sampler. (b) Dry-wall cyclone sampler. (c) Membrane filtration sampler. (d) Wet-wall cyclone sampler using RNase-free water. (e) Wet-wall cyclone sampler using PBS. (f) Wet-wall cyclone sampler using irradiated physiological saline. Statistically significant differences are denoted by lowercase letters (a, b, c, and d), where the same letter indicates no statistical difference, and different letters represent statistically significant differences (ANOVA, p < 0.05).
-
Figure 4.
Fluorescence intensity of sampled microspheres with a diameter of 1 μm. The membrane filtration sampler exhibited the highest performance in collecting 1 μm particles. Among liquid sampling media, PBS proved to be the most effective. For clarity, some stacked plots have been enlarged to emphasize differences in results. (a) Liquid impinger sampler. (b) Dry-wall cyclone sampler. (c) Membrane filtration sampler. (d) Wet-wall cyclone sampler with RNase-free water. (e) Wet-wall cyclone sampler with PBS. (f) Wet-wall cyclone sampler with irradiated physiological saline. Lowercase letters (a, b, c, d, and e) indicate statistically significant differences. Identical letters represent no statistical significance, while different letters denote statistically significant differences (ANOVA, p < 0.05).
-
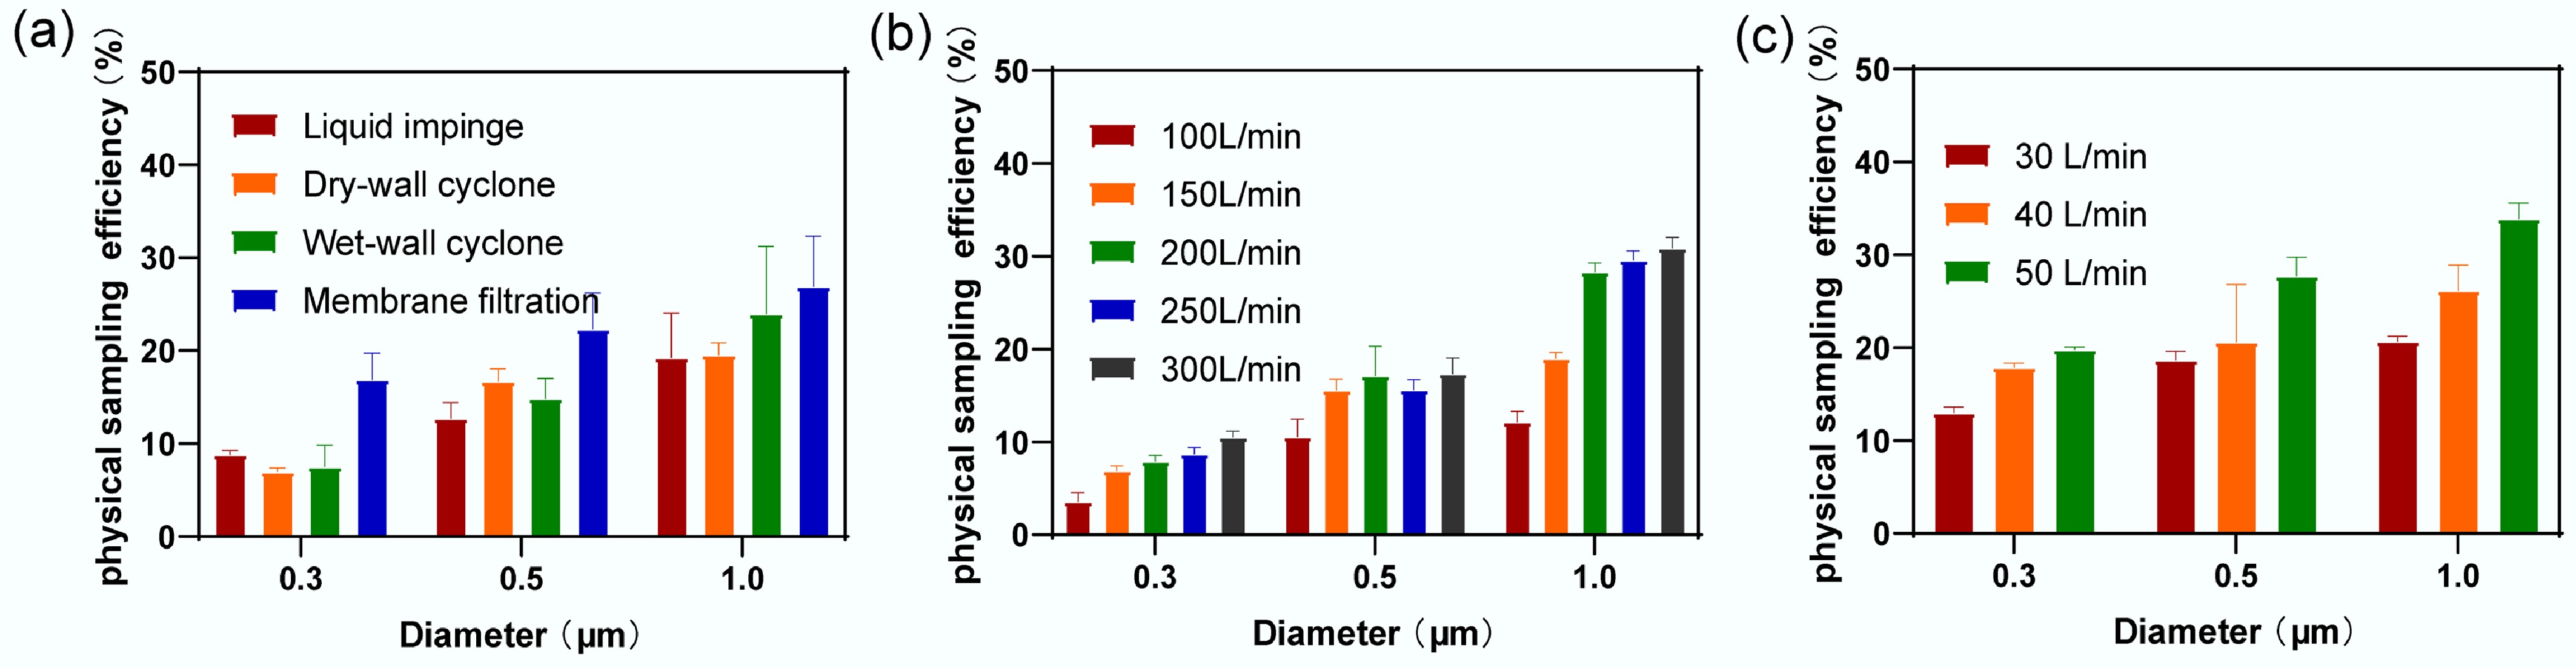
Figure 5.
Sampling efficiency of different principal samplers for three particle sizes of microspheres. (a) Sampling efficiency of four types of samplers. (b) Sampling efficiency of wet-wall cyclone sampler at five different flow rates. (c) Sampling efficiency of membrane filtration sampler at three different flow rates.
-
Sampler type Flow (L/min) Time (min) Medium Membrane filtration 30, 40, 50 66, 50, 40 Sartorius gelatin membrane Liquid impinger 10 200 RNase-free water Wet-wall cyclone 100, 150, 200, 250, 300 20, 13.3, 10, 8, 6.7 Irradiated physiological saline Dry-wall cyclone 400 5 PBS Table 1.
Sampling conditions for four samplers with a sampling volume of 2 m3
Figures
(5)
Tables
(1)