-
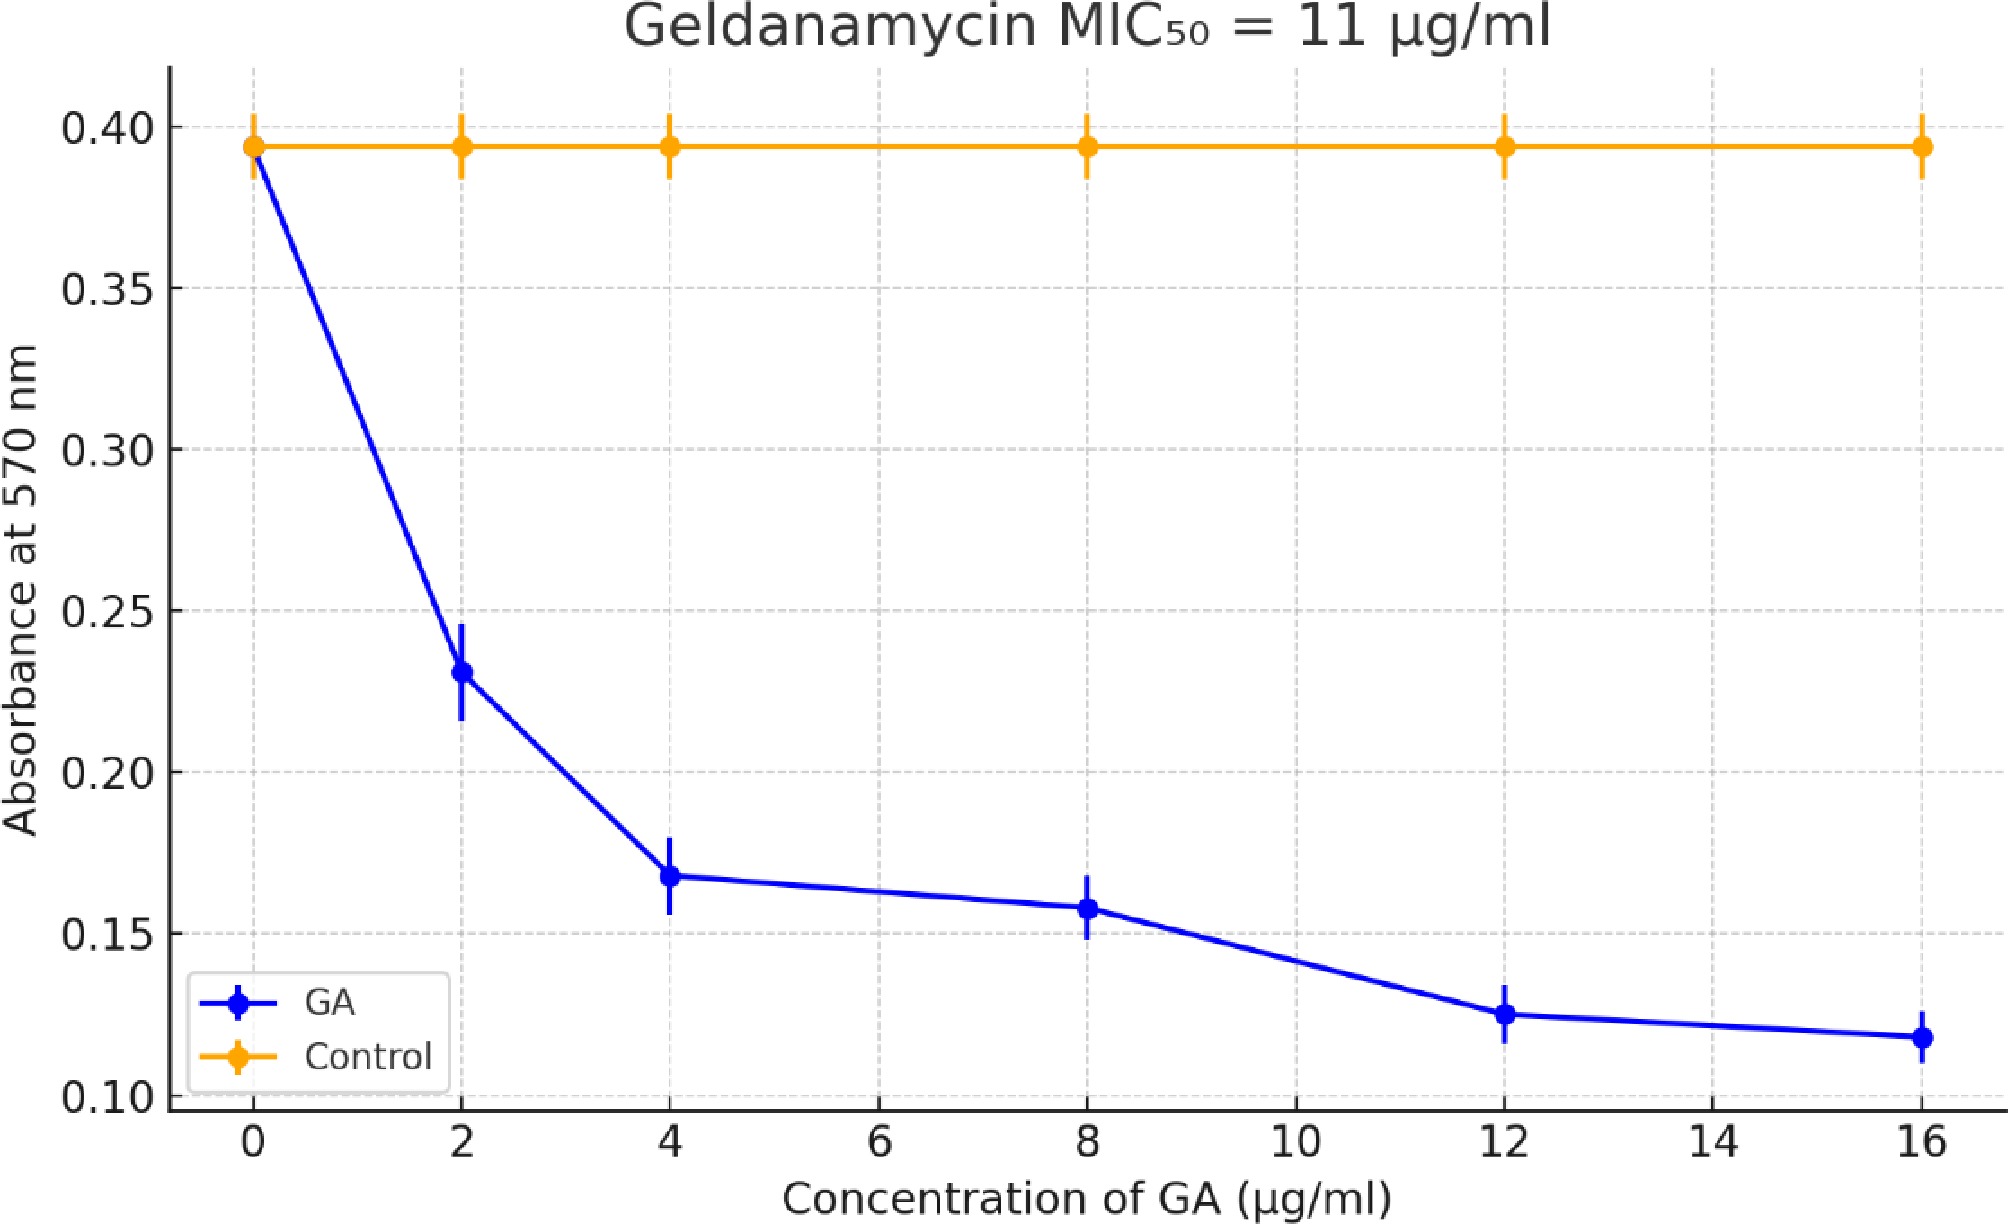
Figure 1.
Determination of MIC50 for GA against A. terreus using the MTT assay. The plot shows absorbance at 570 nm versus the GA concentration (2–16 µg/mL). Each concentration was tested in four replicates. GA treatment led to a dose-dependent reduction in metabolic activity. The MIC50 value was estimated to be ~11 µg/mL. Error bars represent the standard deviation (SD).
-
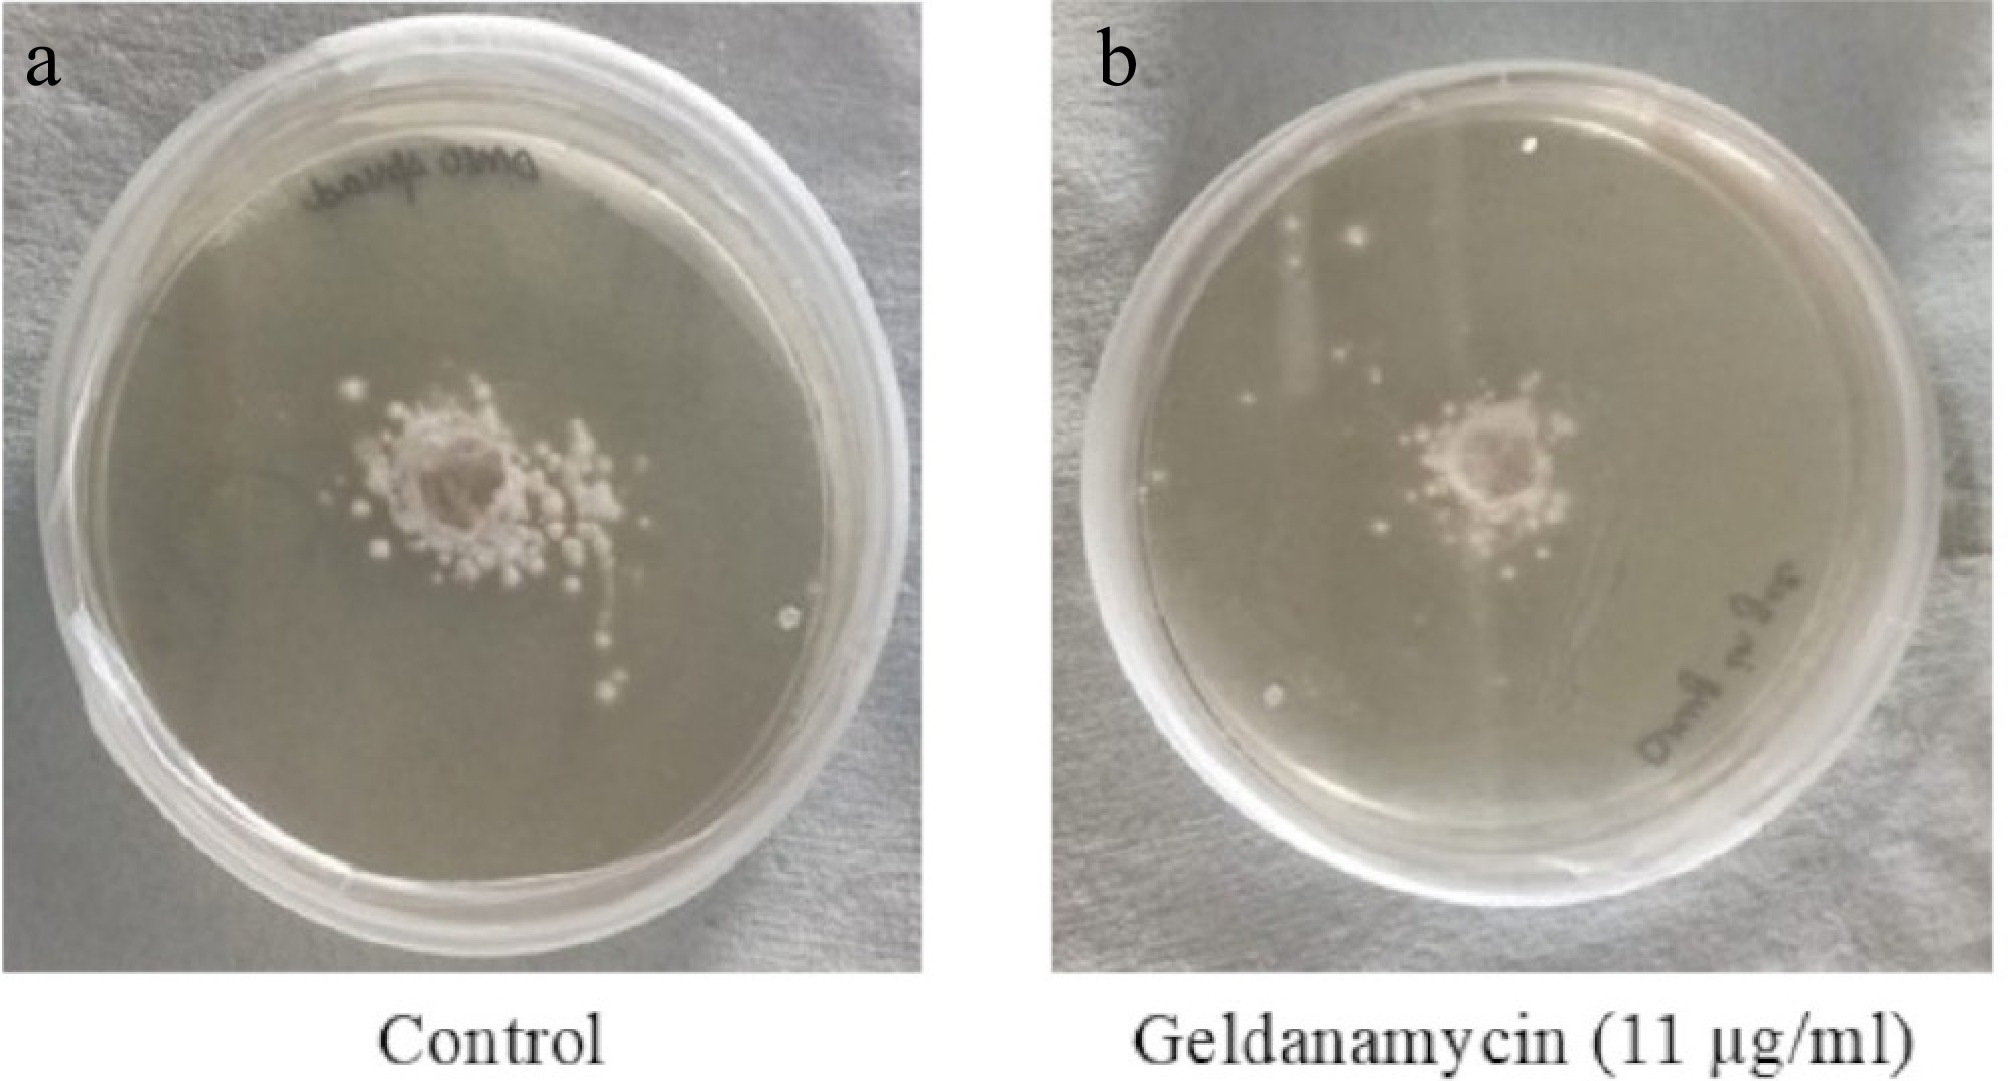
Figure 2.
Mycelial growth of A. terreus on PDA plates after 24 h of incubation. (a) Control (drug-free); (b) treated with GA (11 µg/mL). Images were analyzed using ImageJ to determine colony diameters. Treated cultures showed reduced radial growth compared with the untreated controls.
-
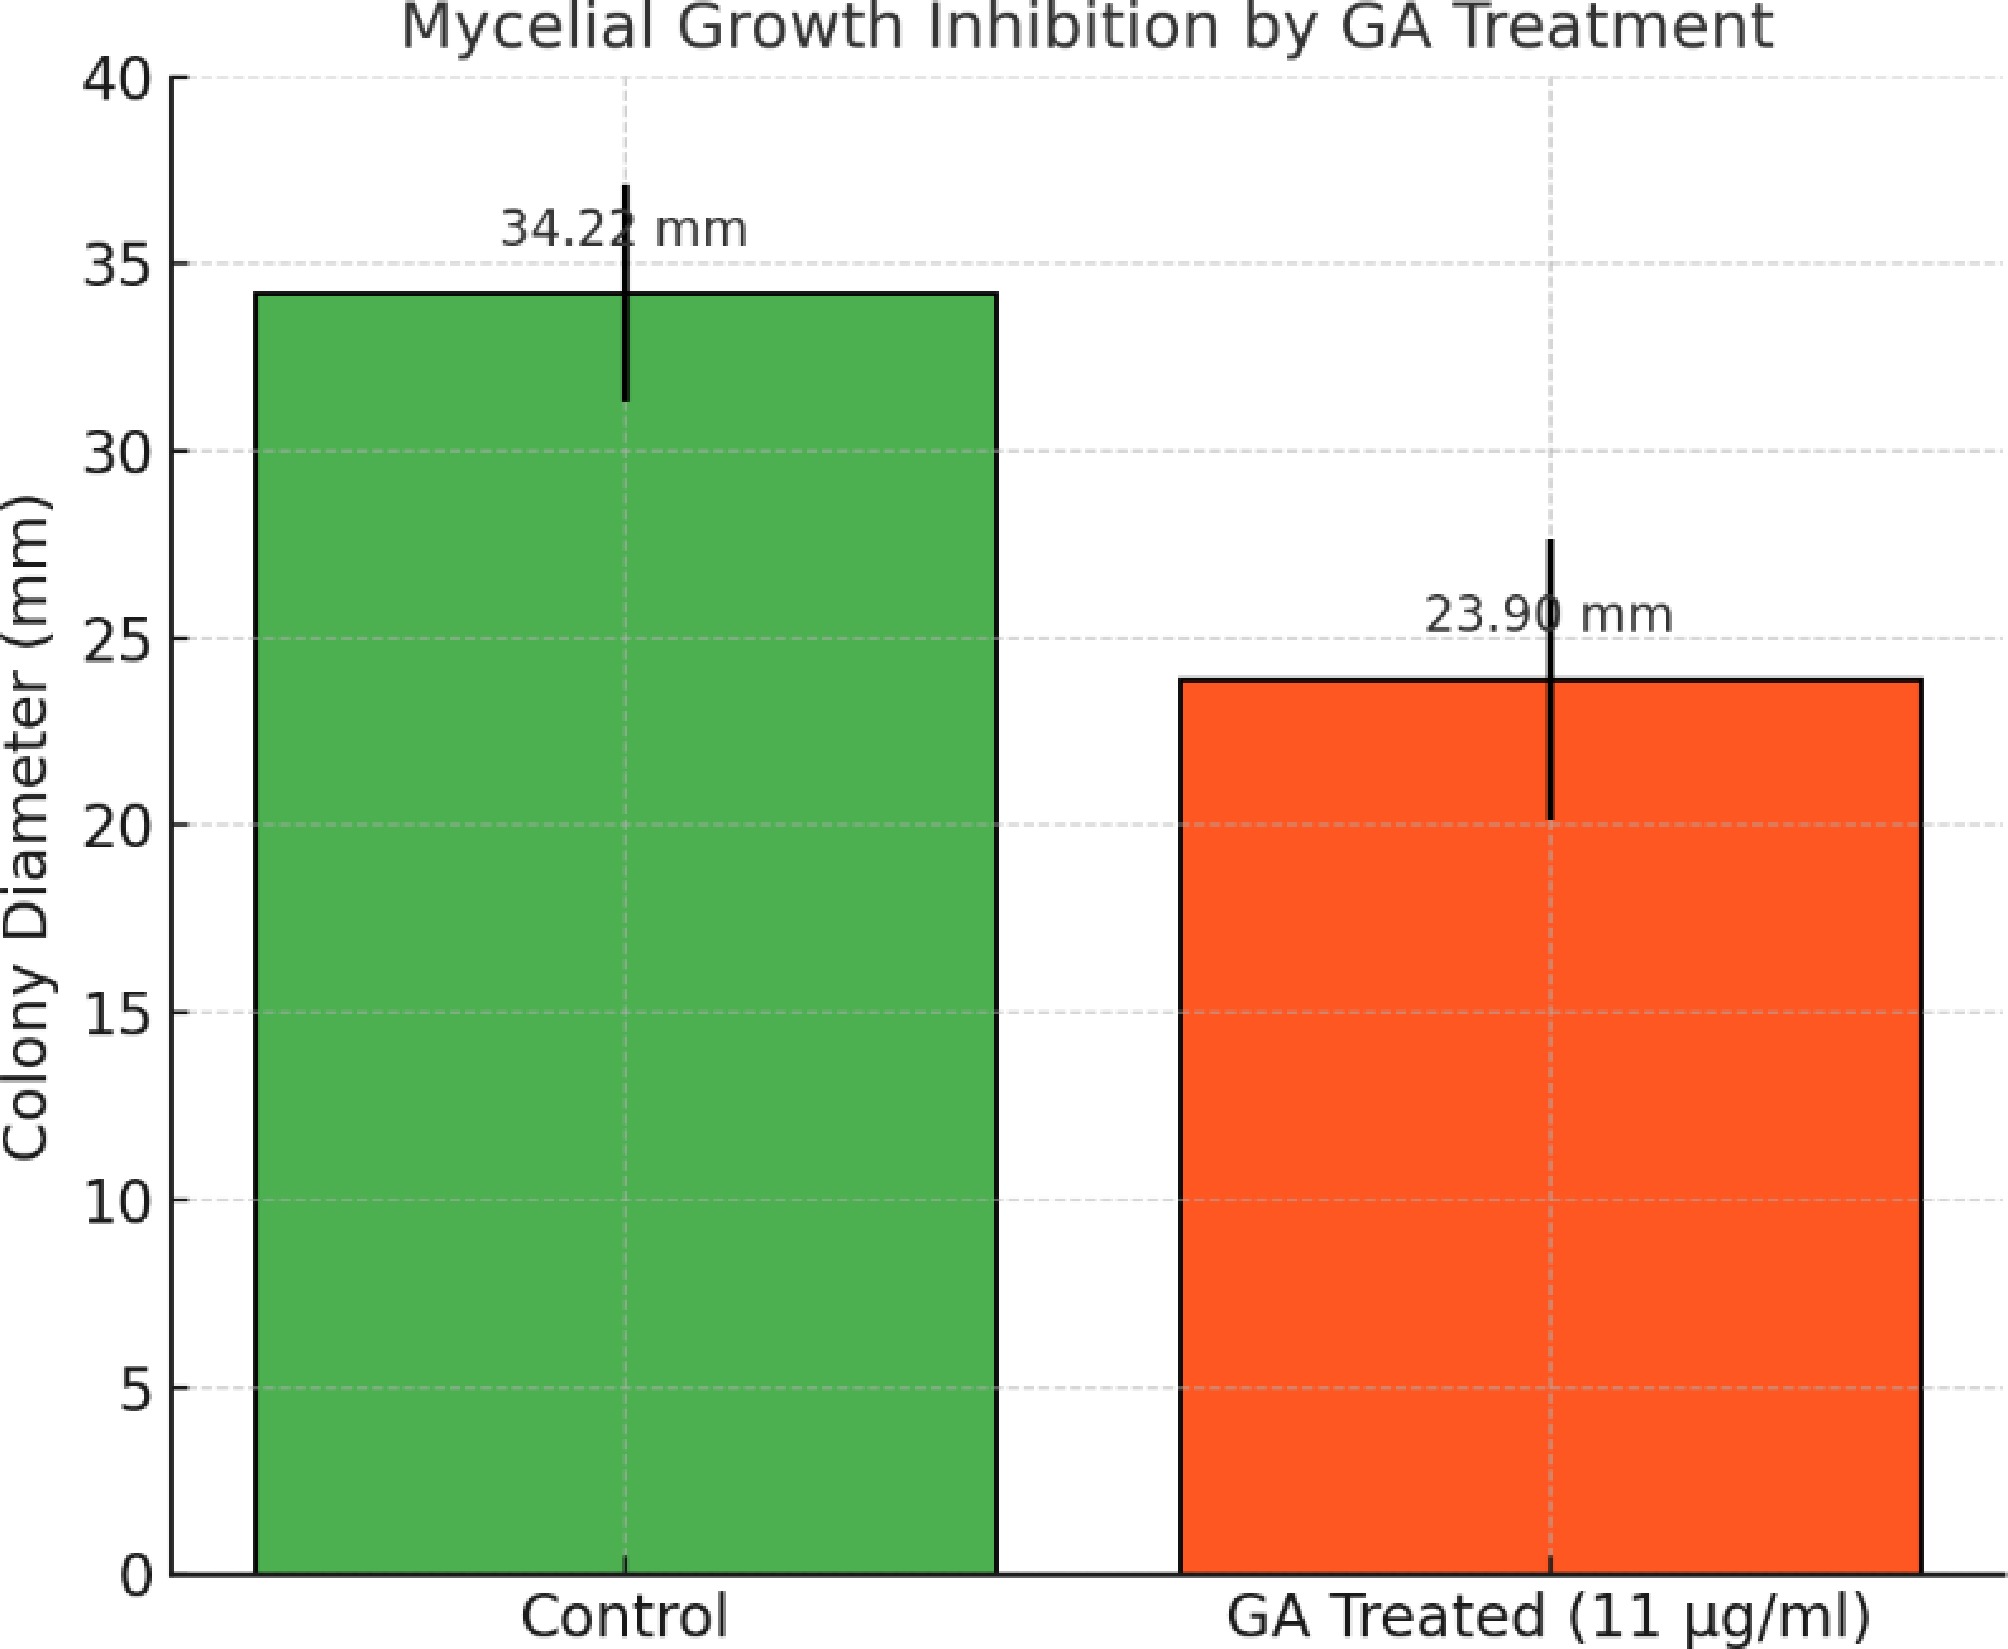
Figure 3.
Quantitative analysis of mycelial growth inhibition in A. terreus upon treatment with GA. Average colony diameters were measured after 24 h of incubation on GA-treated (11 µg/mL) and control PDA plates. Error bars represent the standard deviation (n = 4). GA treatment significantly reduced mycelial growth (p = 0.0048, Student's t-test).
-
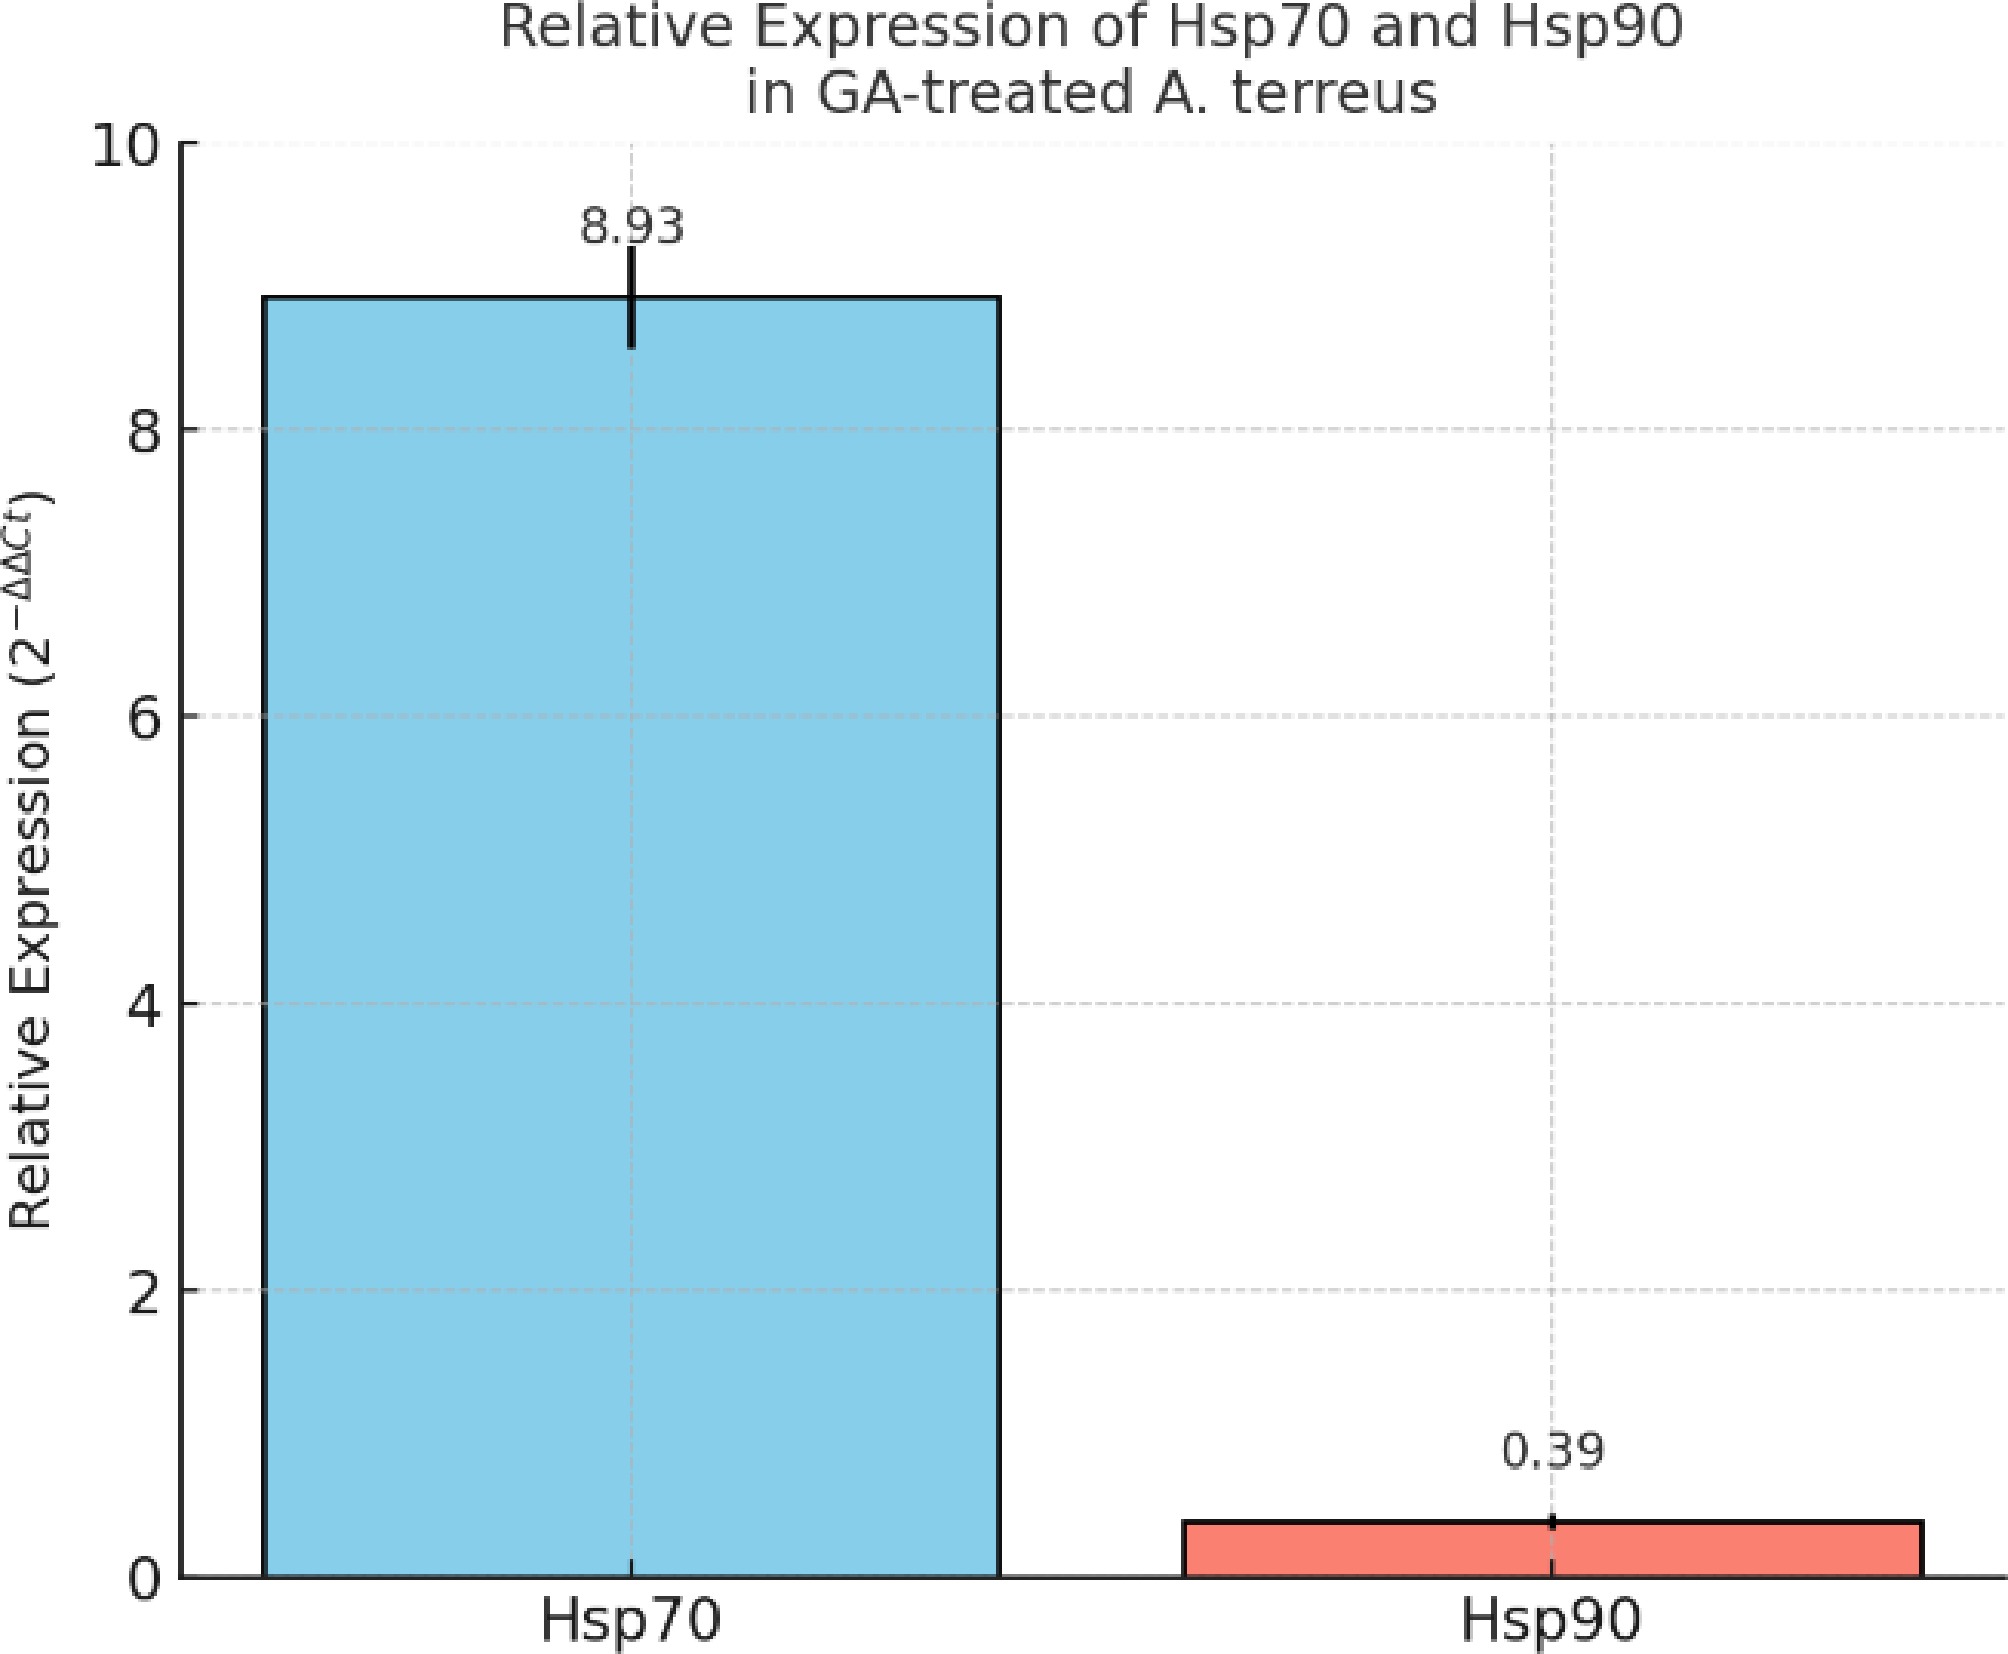
Figure 4.
Relative expression of Hsp70 and Hsp90 genes in GA-treated A. terreus as determined by qRT-PCR. The data were normalized to the 40S ribosomal S1 gene using the 2−ΔΔCᴛ method. Expression of Hsp70 was significantly upregulated (~8.93 ± 0.36), whereas Hsp90 was downregulated (~0.39 ± 0.05) in response to the GA treatment. Bars represent the mean ± standard deviation from three biological replicates.
-
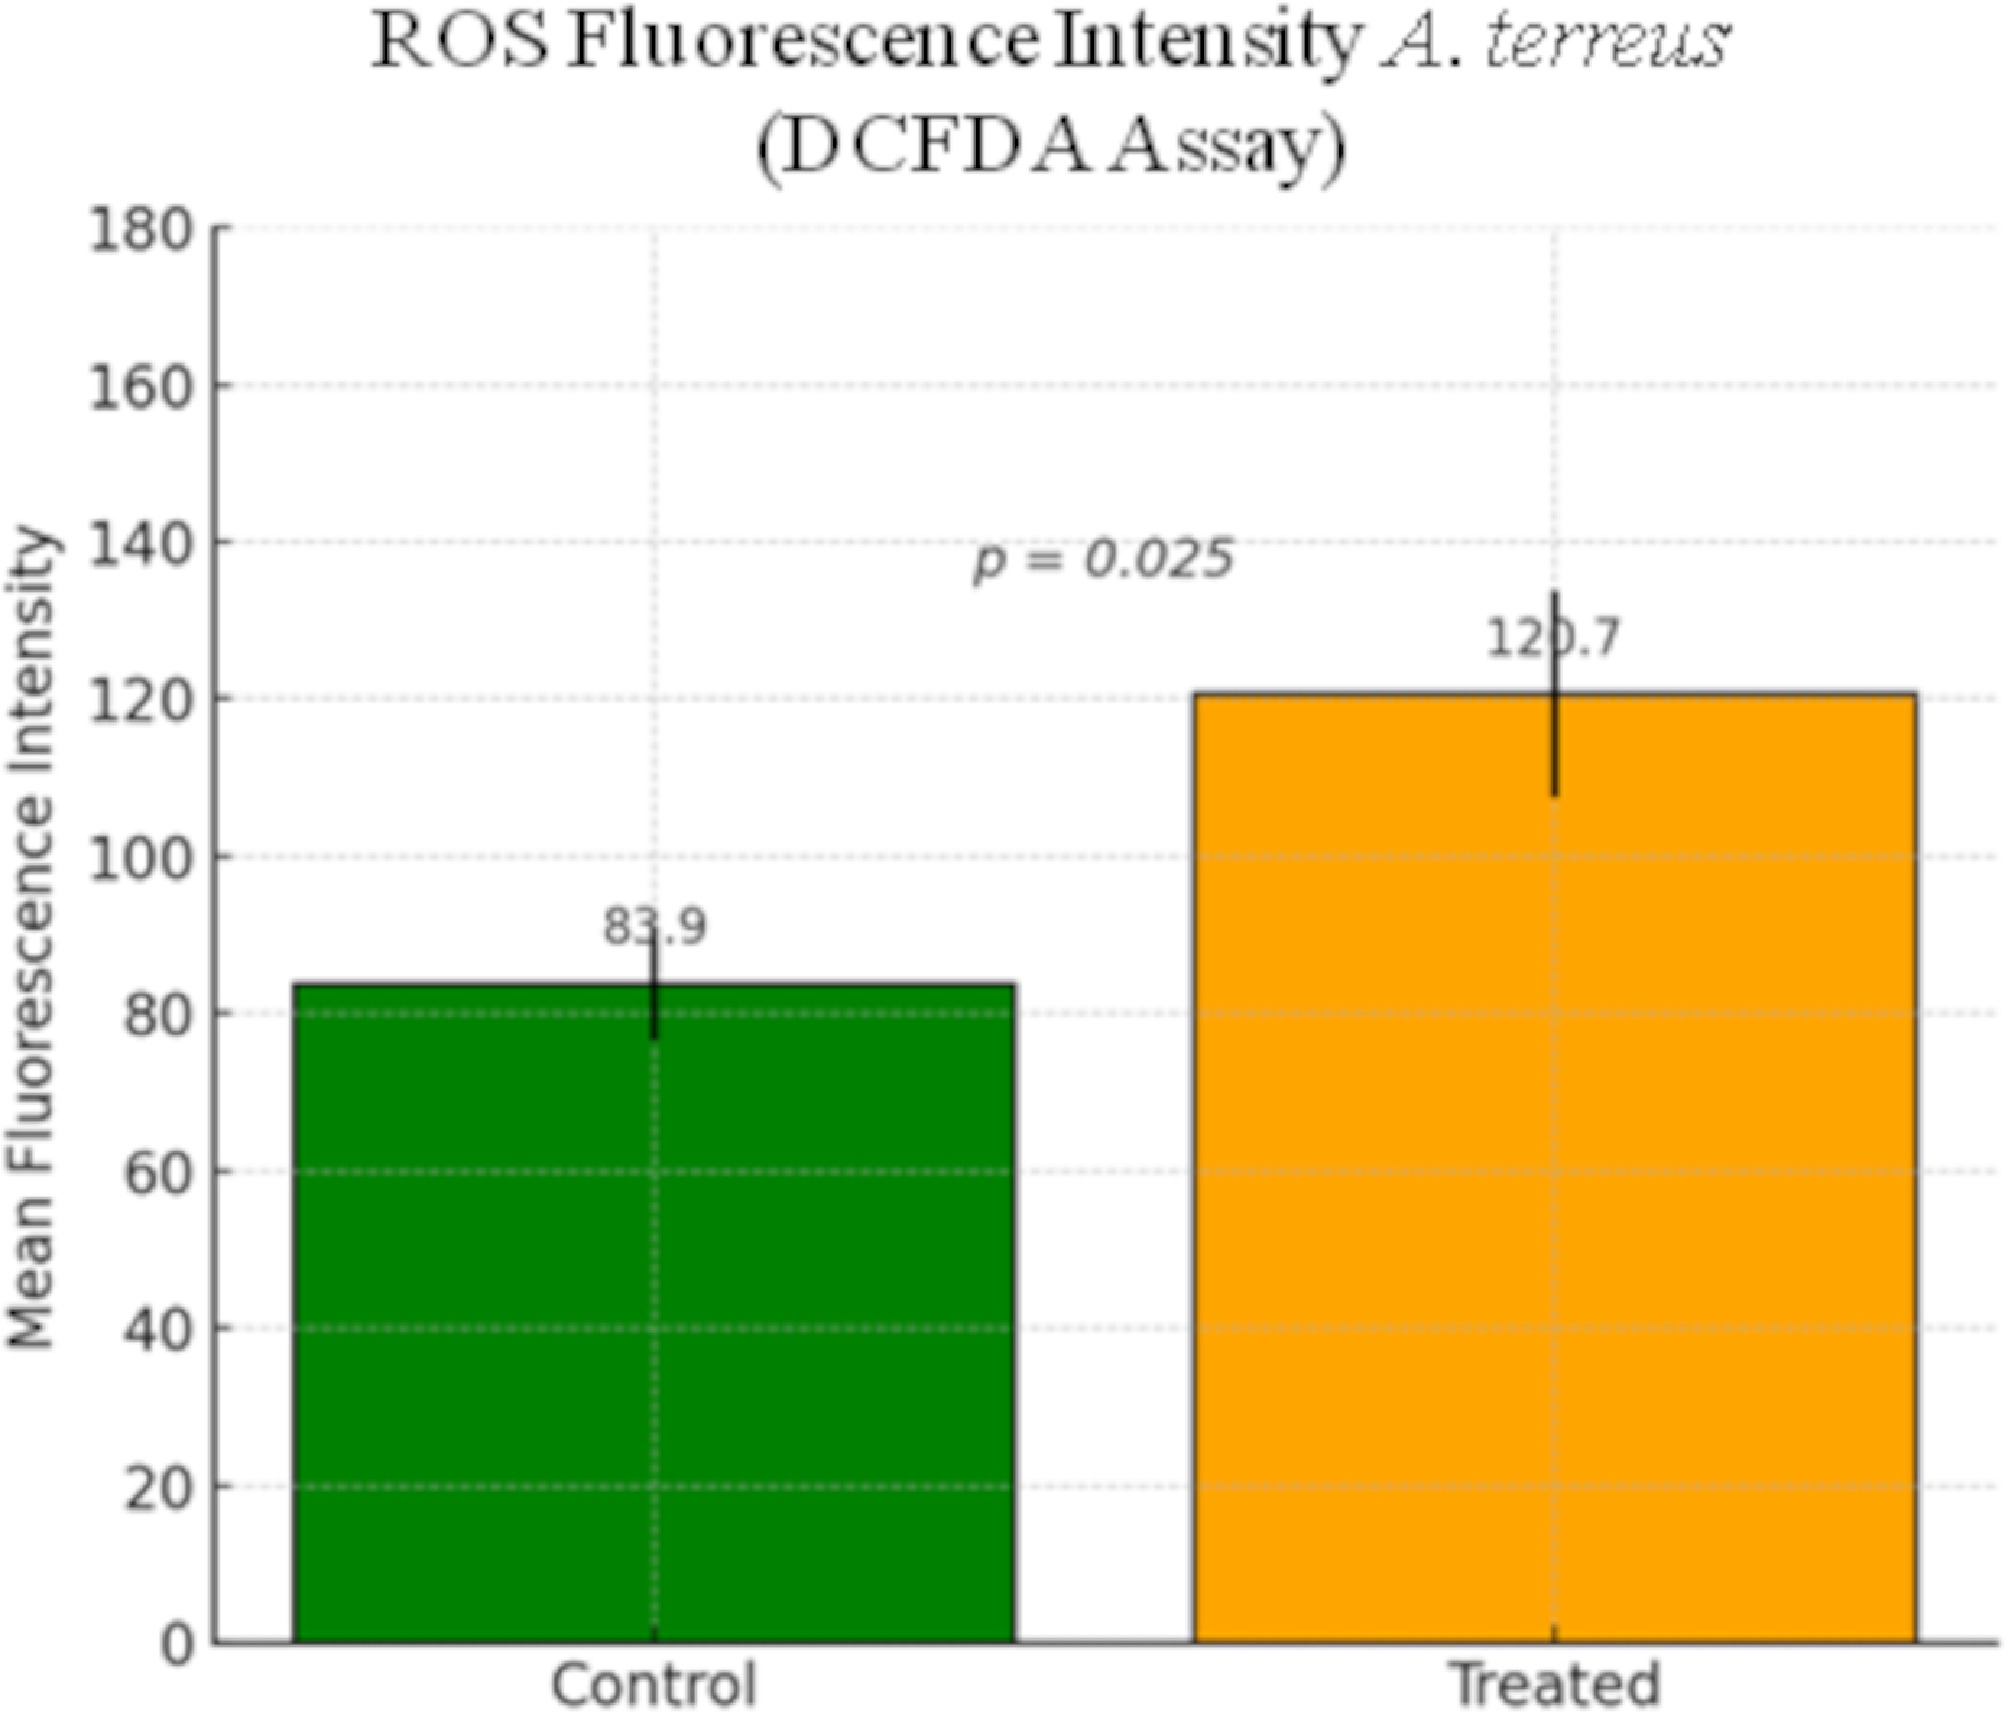
Figure 5.
Quantification of intracellular ROS levels in A. terreus after GA treatment using the DCFDA assay. Mean fluorescence intensity was measured using ImageJ software in the control and treated regions of interest (ROIs). Bars represent the mean ± SEM. ROS levels were significantly elevated in GA-treated cells compared with the untreated controls (p = 0.025).
-
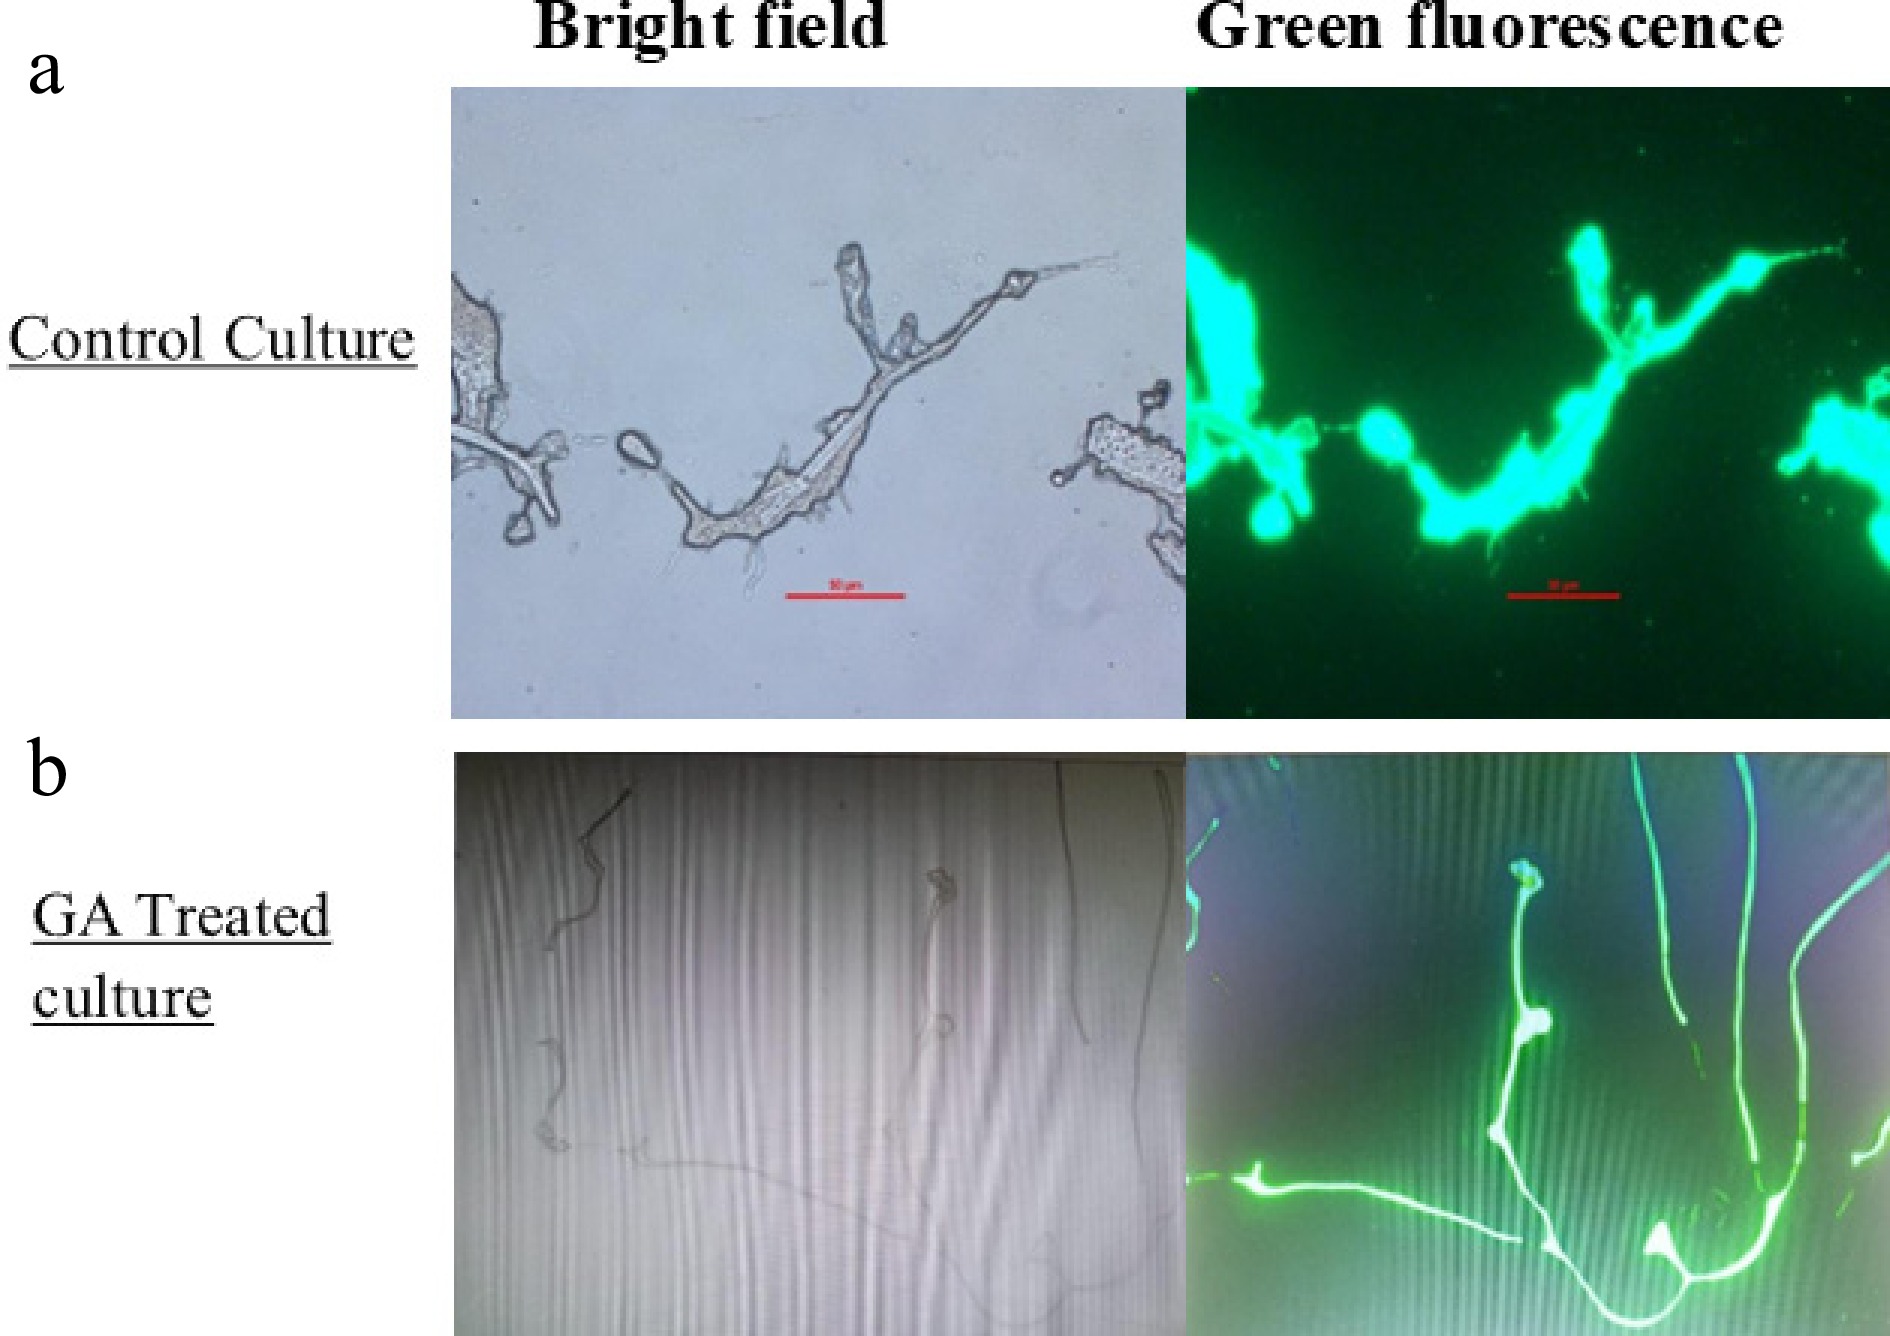
Figure 6.
Bright-field and green fluorescence images depicting intracellular ROS accumulation using the DCFDA assay in A. terreus. (a) Control; (b) treated with GA for 24 h.
-
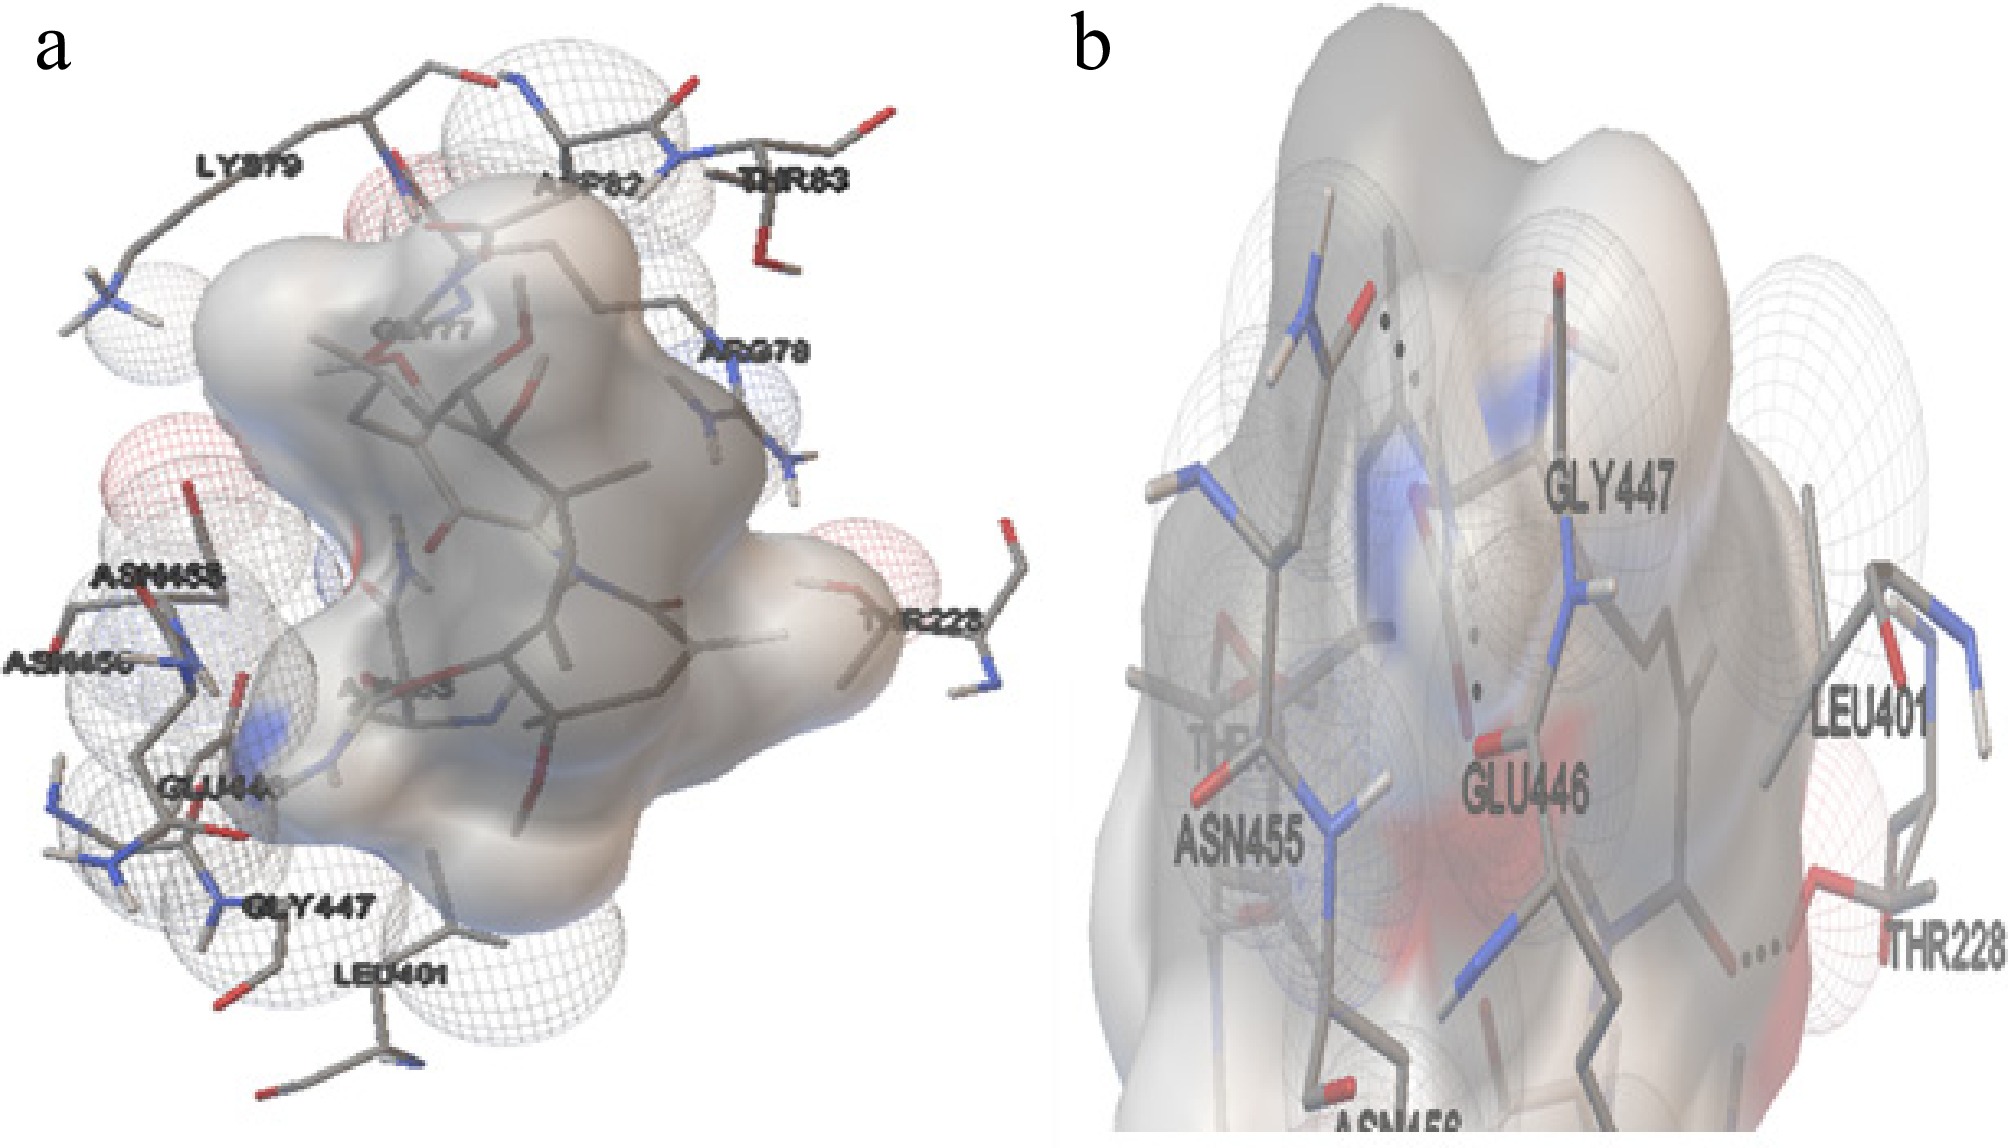
Figure 7.
The interaction of Hsp70 with GA. (a) The amino acids interacting with the ligand molecule (GA) and Hsp70 of H. sapiens. (b) The dashed black line represents the three hydrogen bonds during the interaction.
-
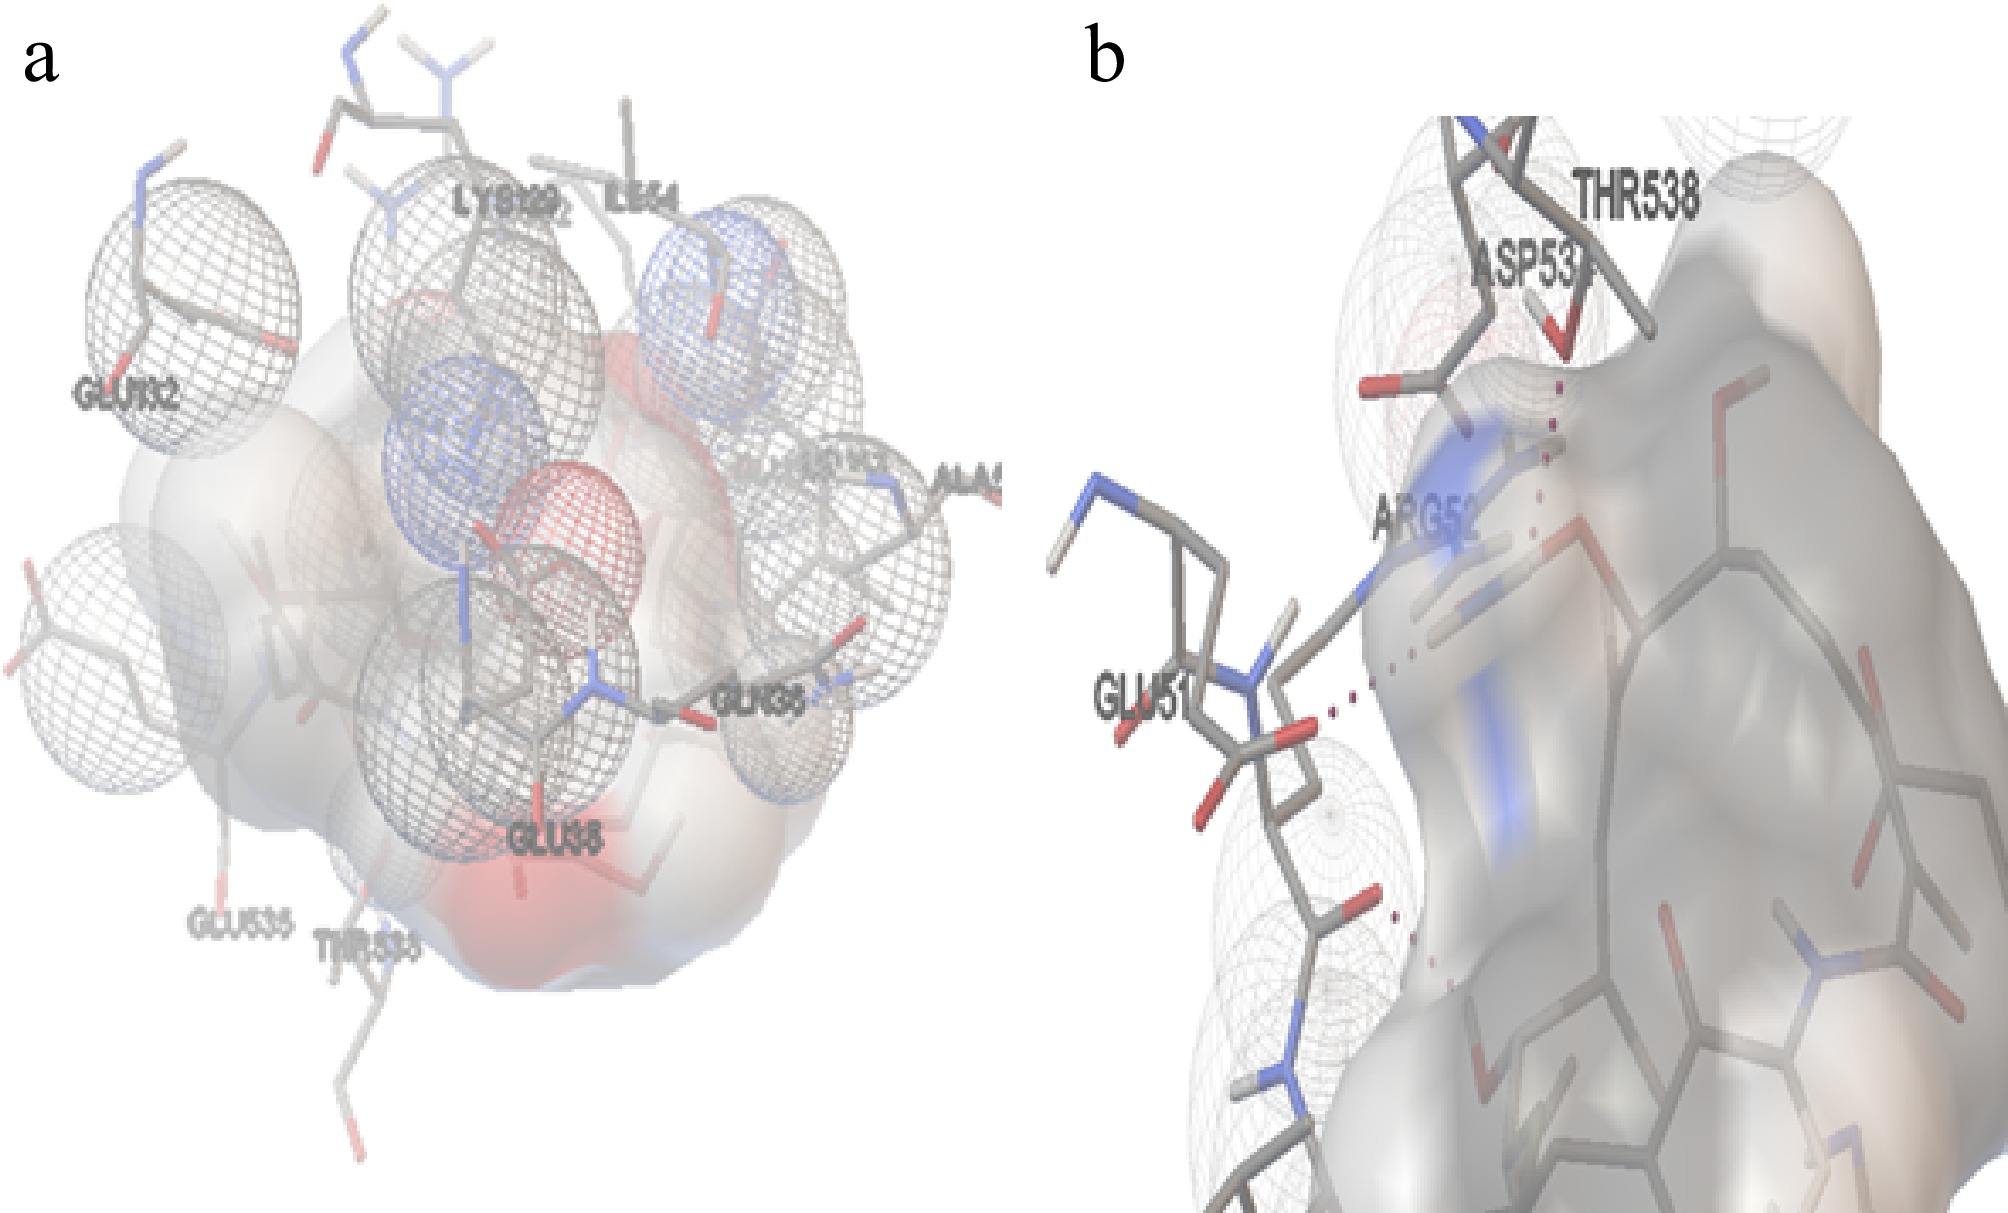
Figure 8.
The interaction of Hsp70 with GA. (a) The amino acids interacting with the ligand molecule (GA) and Hsp70 of A. terreus. (b) The dashed black line represents the three hydrogen bonds during the interactions.
-
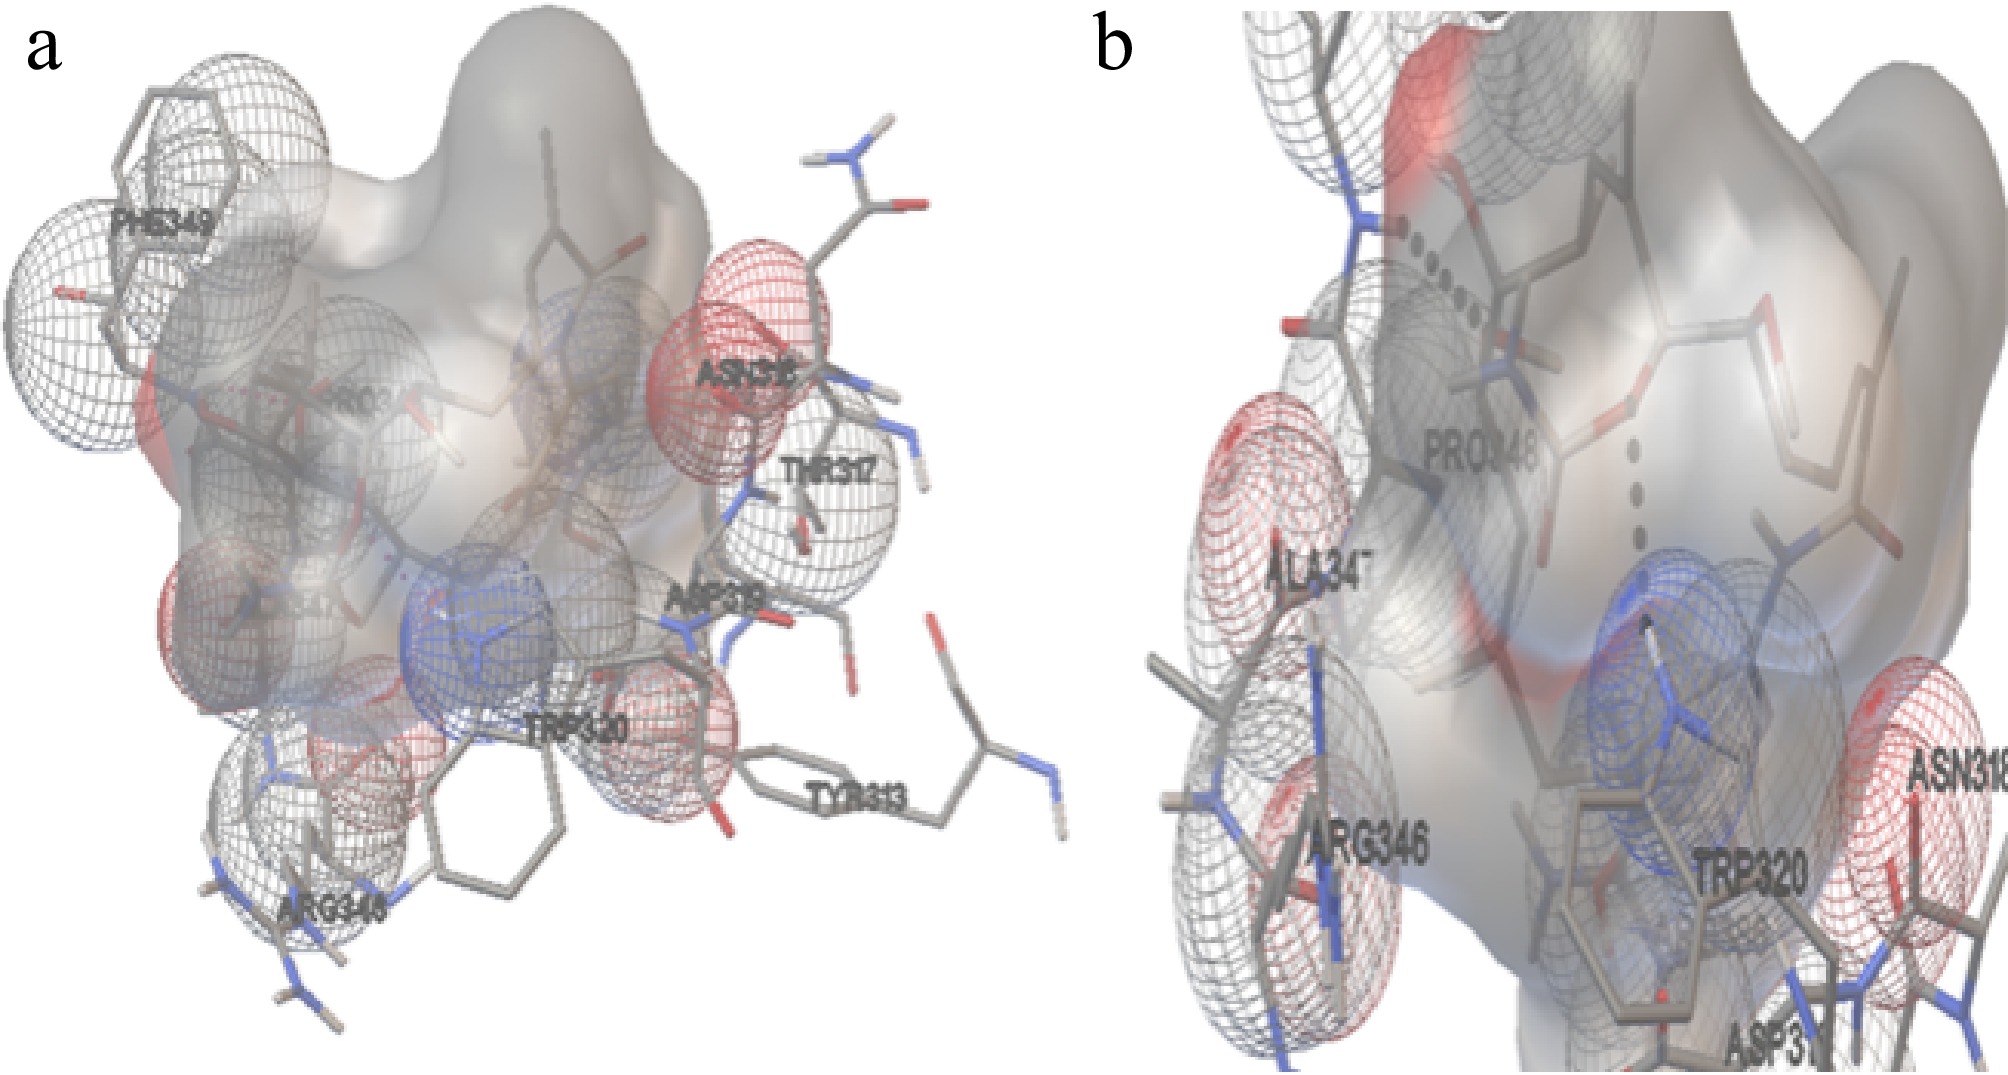
Figure 9.
The interaction of Hsp90 with GA. (a) The amino acids interacting with the ligand molecule (GA) and Hsp90 of H. sapiens. (b) The dashed black line represents the two hydrogen bonds during theinteractions.
-
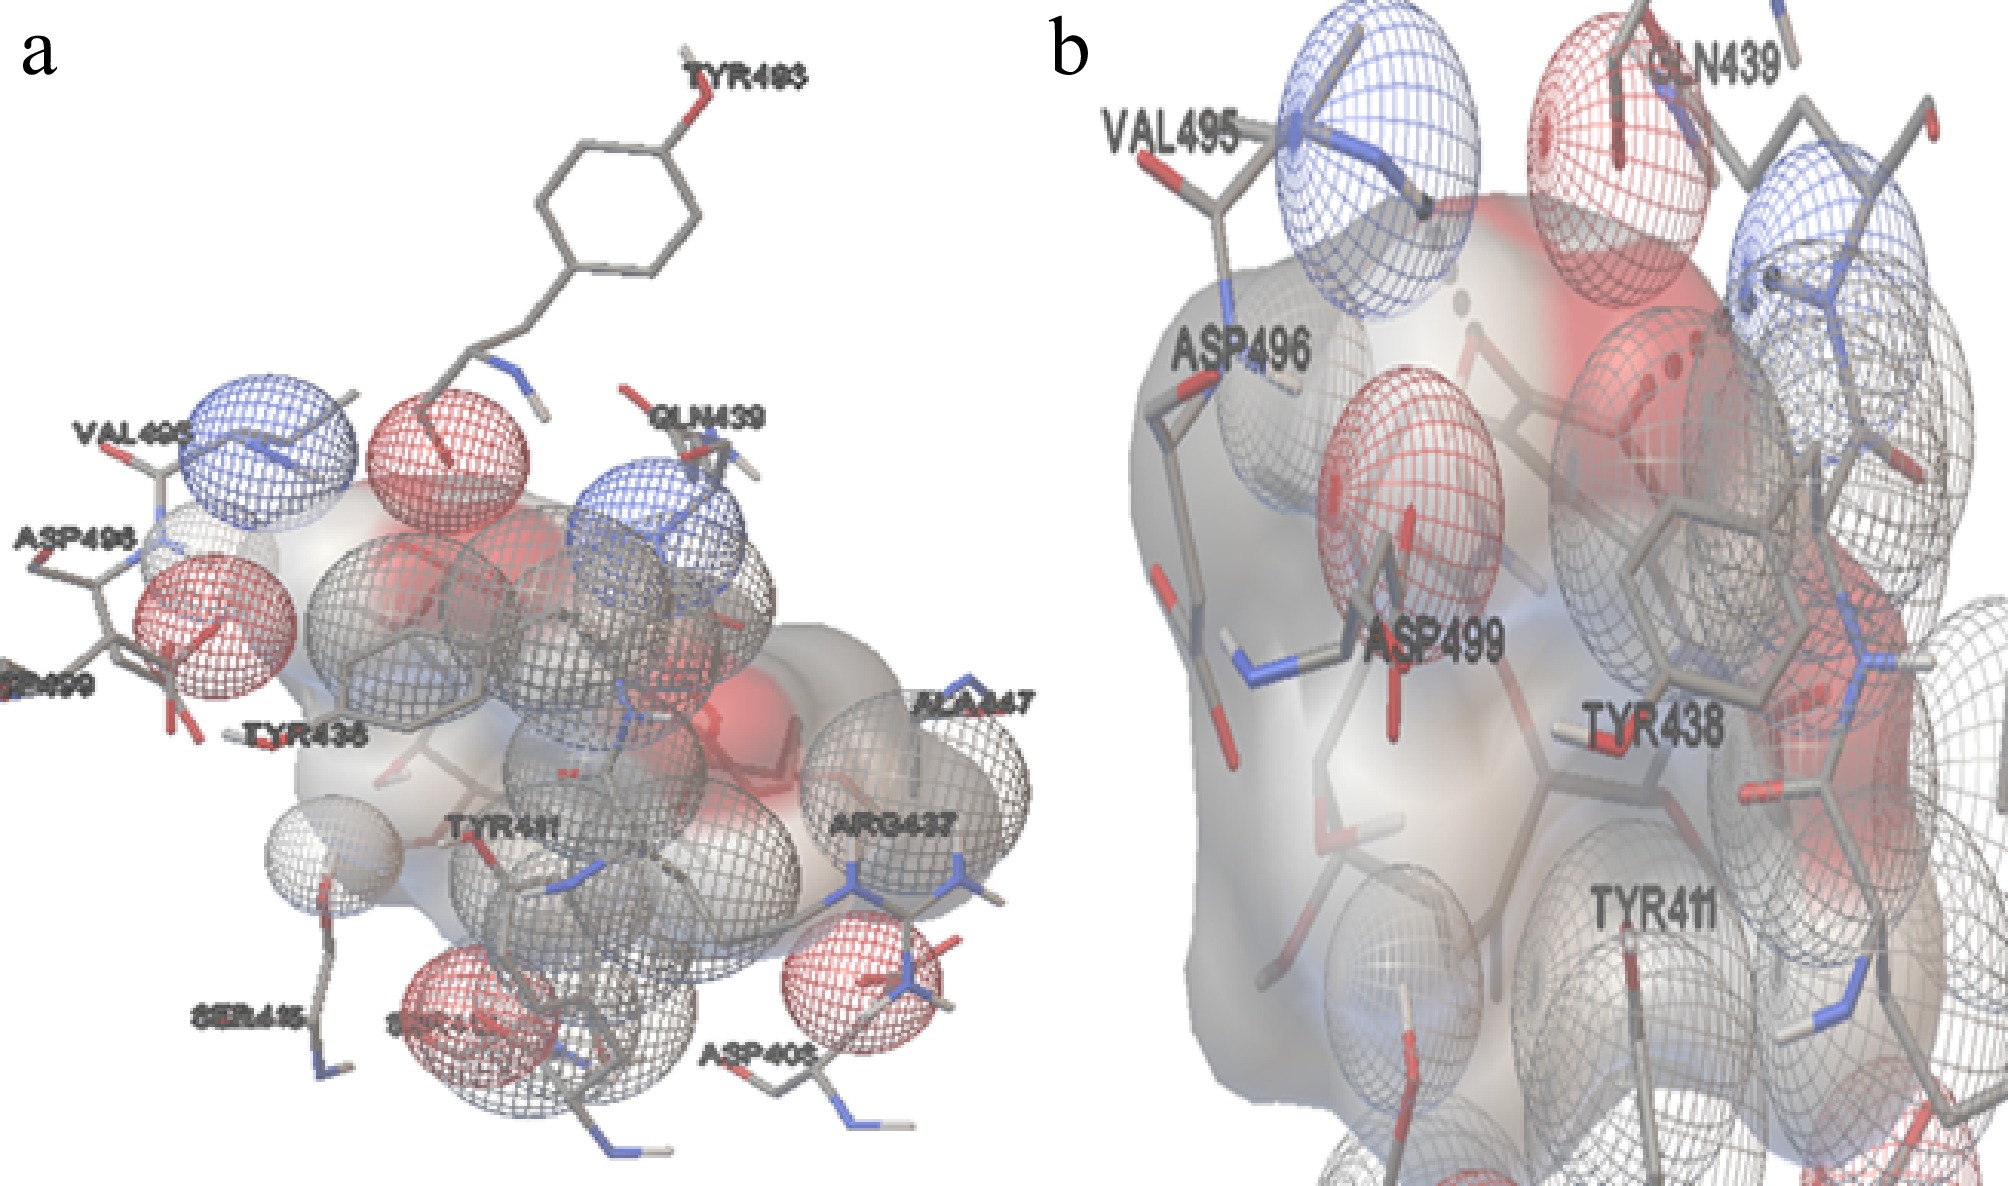
Figure 10.
The interaction of Hsp90 with GA. (a) The amino acids interacting with the ligand molecule (GA) and Hsp90 of A. terreus. (b) The dashed black line represents the two hydrogen bonds during the interactions
-
Gene Primer Type Sequence (5’→3’) Hsp70 Forward GACCACGGAAATCGAGCAGA Reverse CATGGTGGGGTCGGAAATGA Hsp90 Forward CTCGCCAAGAGCCTCAAGAA Reverse GCTCCTTGATGATGGGGGAC 40S S1 Forward CATTGGCCGTGAGATCGAG Reverse CCCTTGTCATCGGTGGTAGA Table 1.
The primers used in this study.
-
No. Energies Hsp70 Protein 6 Homo sapiens Hsp70
A. terreusHsp90α Homo sapiens Hsp90
A. terreus1 Lowest binding energy (kcal/mol) −6.75 −6.83 −7.37 −7.17 2 Estimated Ki (µM) ~11.9 ~9.90 ~3.84 ~5.43 3 Most populated cluster Cluster 9 (13) Cluster 2 (68) Cluster 23 (18) Cluster 5 (21) 4 Mean binding energy of best cluster –5.74 –6.43 –6.81 –6.64 5 Ligand efficiency −0.17 −0.17 −0.18 −0.18 6 Inter mol energy −8.54 −8.62 −9.16 −8.96 7 Torsional energy 1.79 1.79 1.79 1.79 8 RMSD to reference position (Å) ~0.20–1.4 ~0.24–1.3 ~0.26–1.1 ~0.27–1.2 Table 2.
Summary of molecular docking parameters for GA with Hsp proteins.
Figures
(10)
Tables
(2)