-
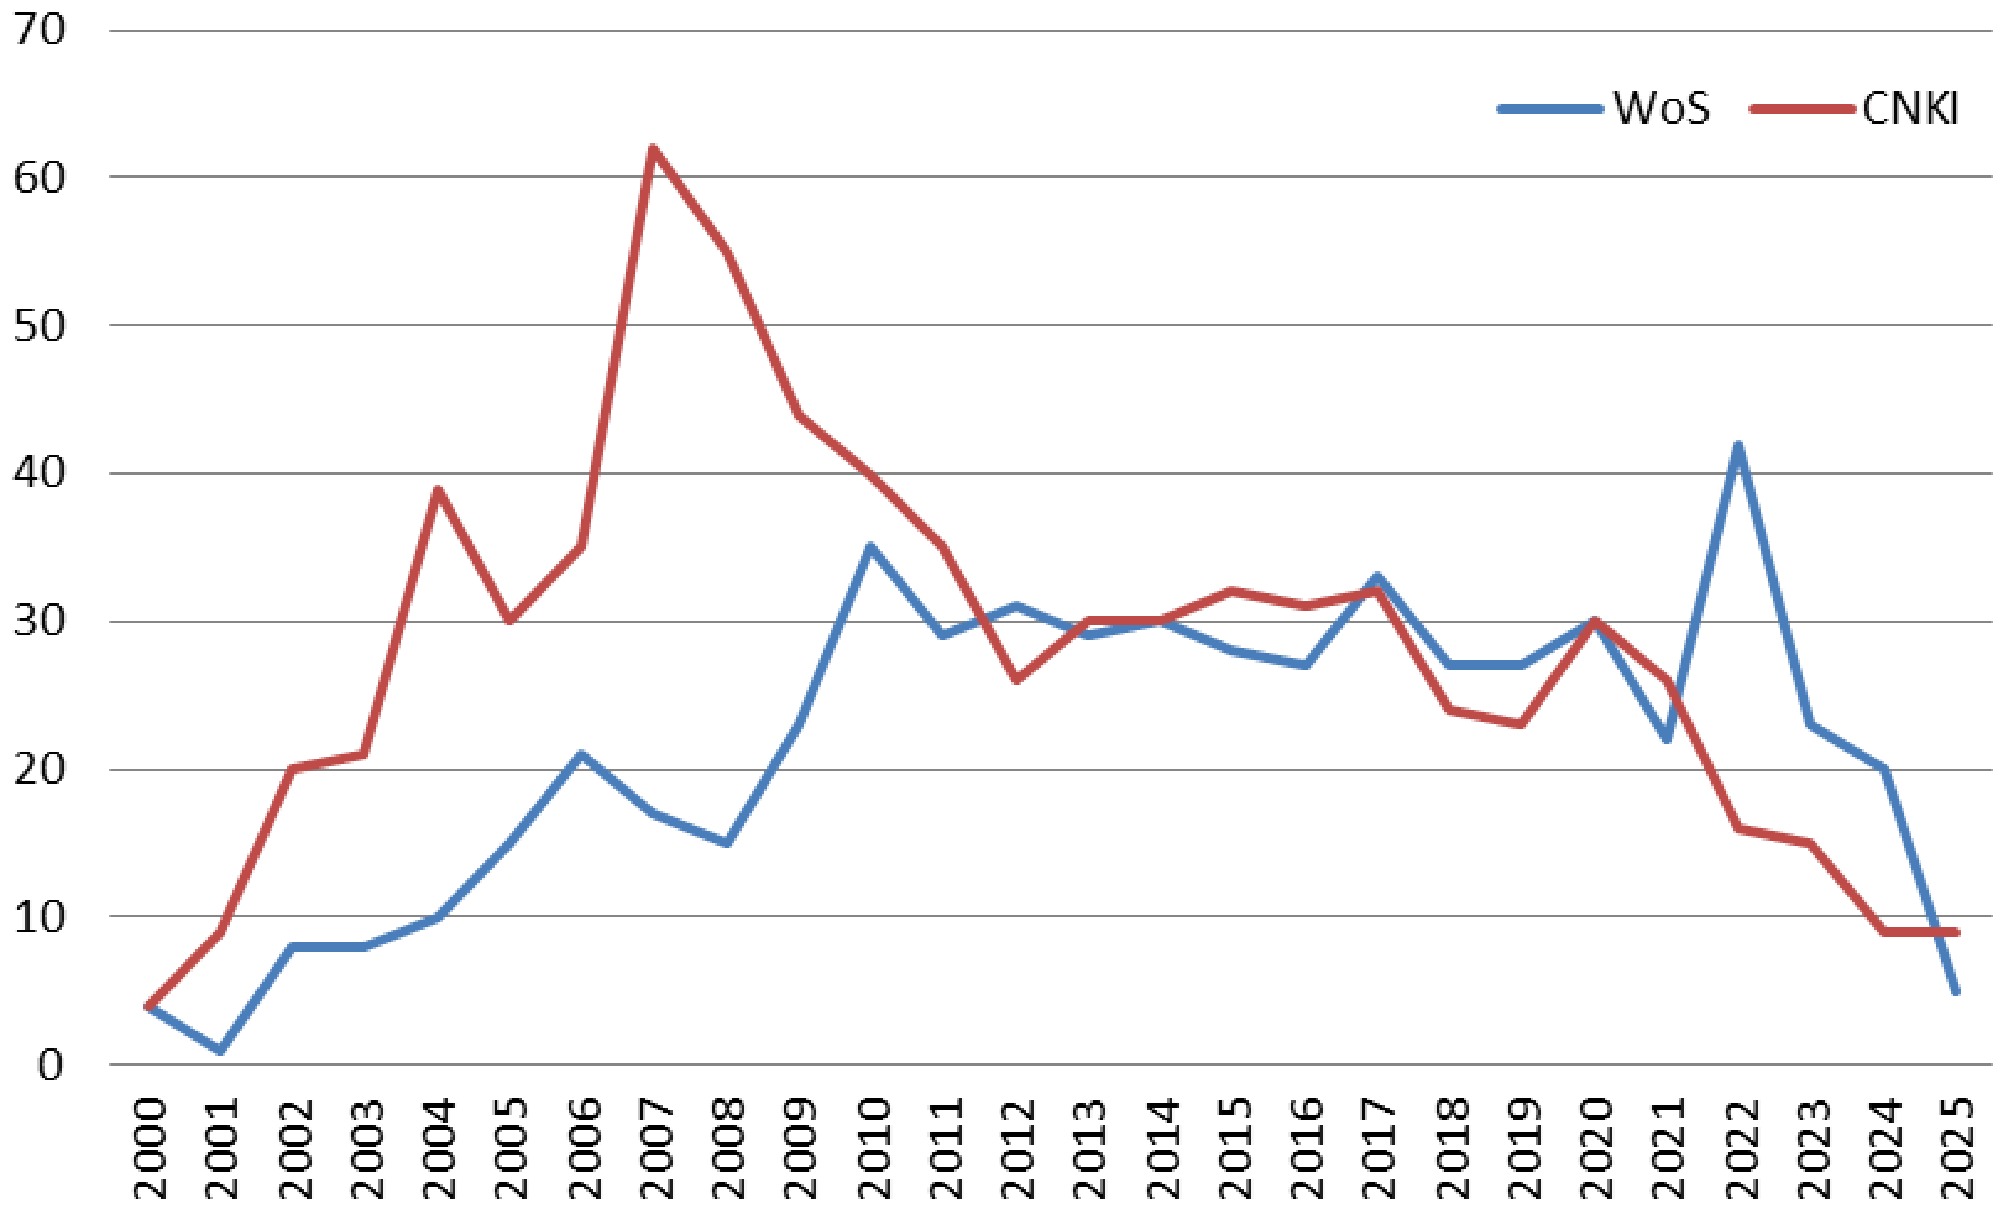
Figure 1.
Publication volume of CNKI and WoS.
-
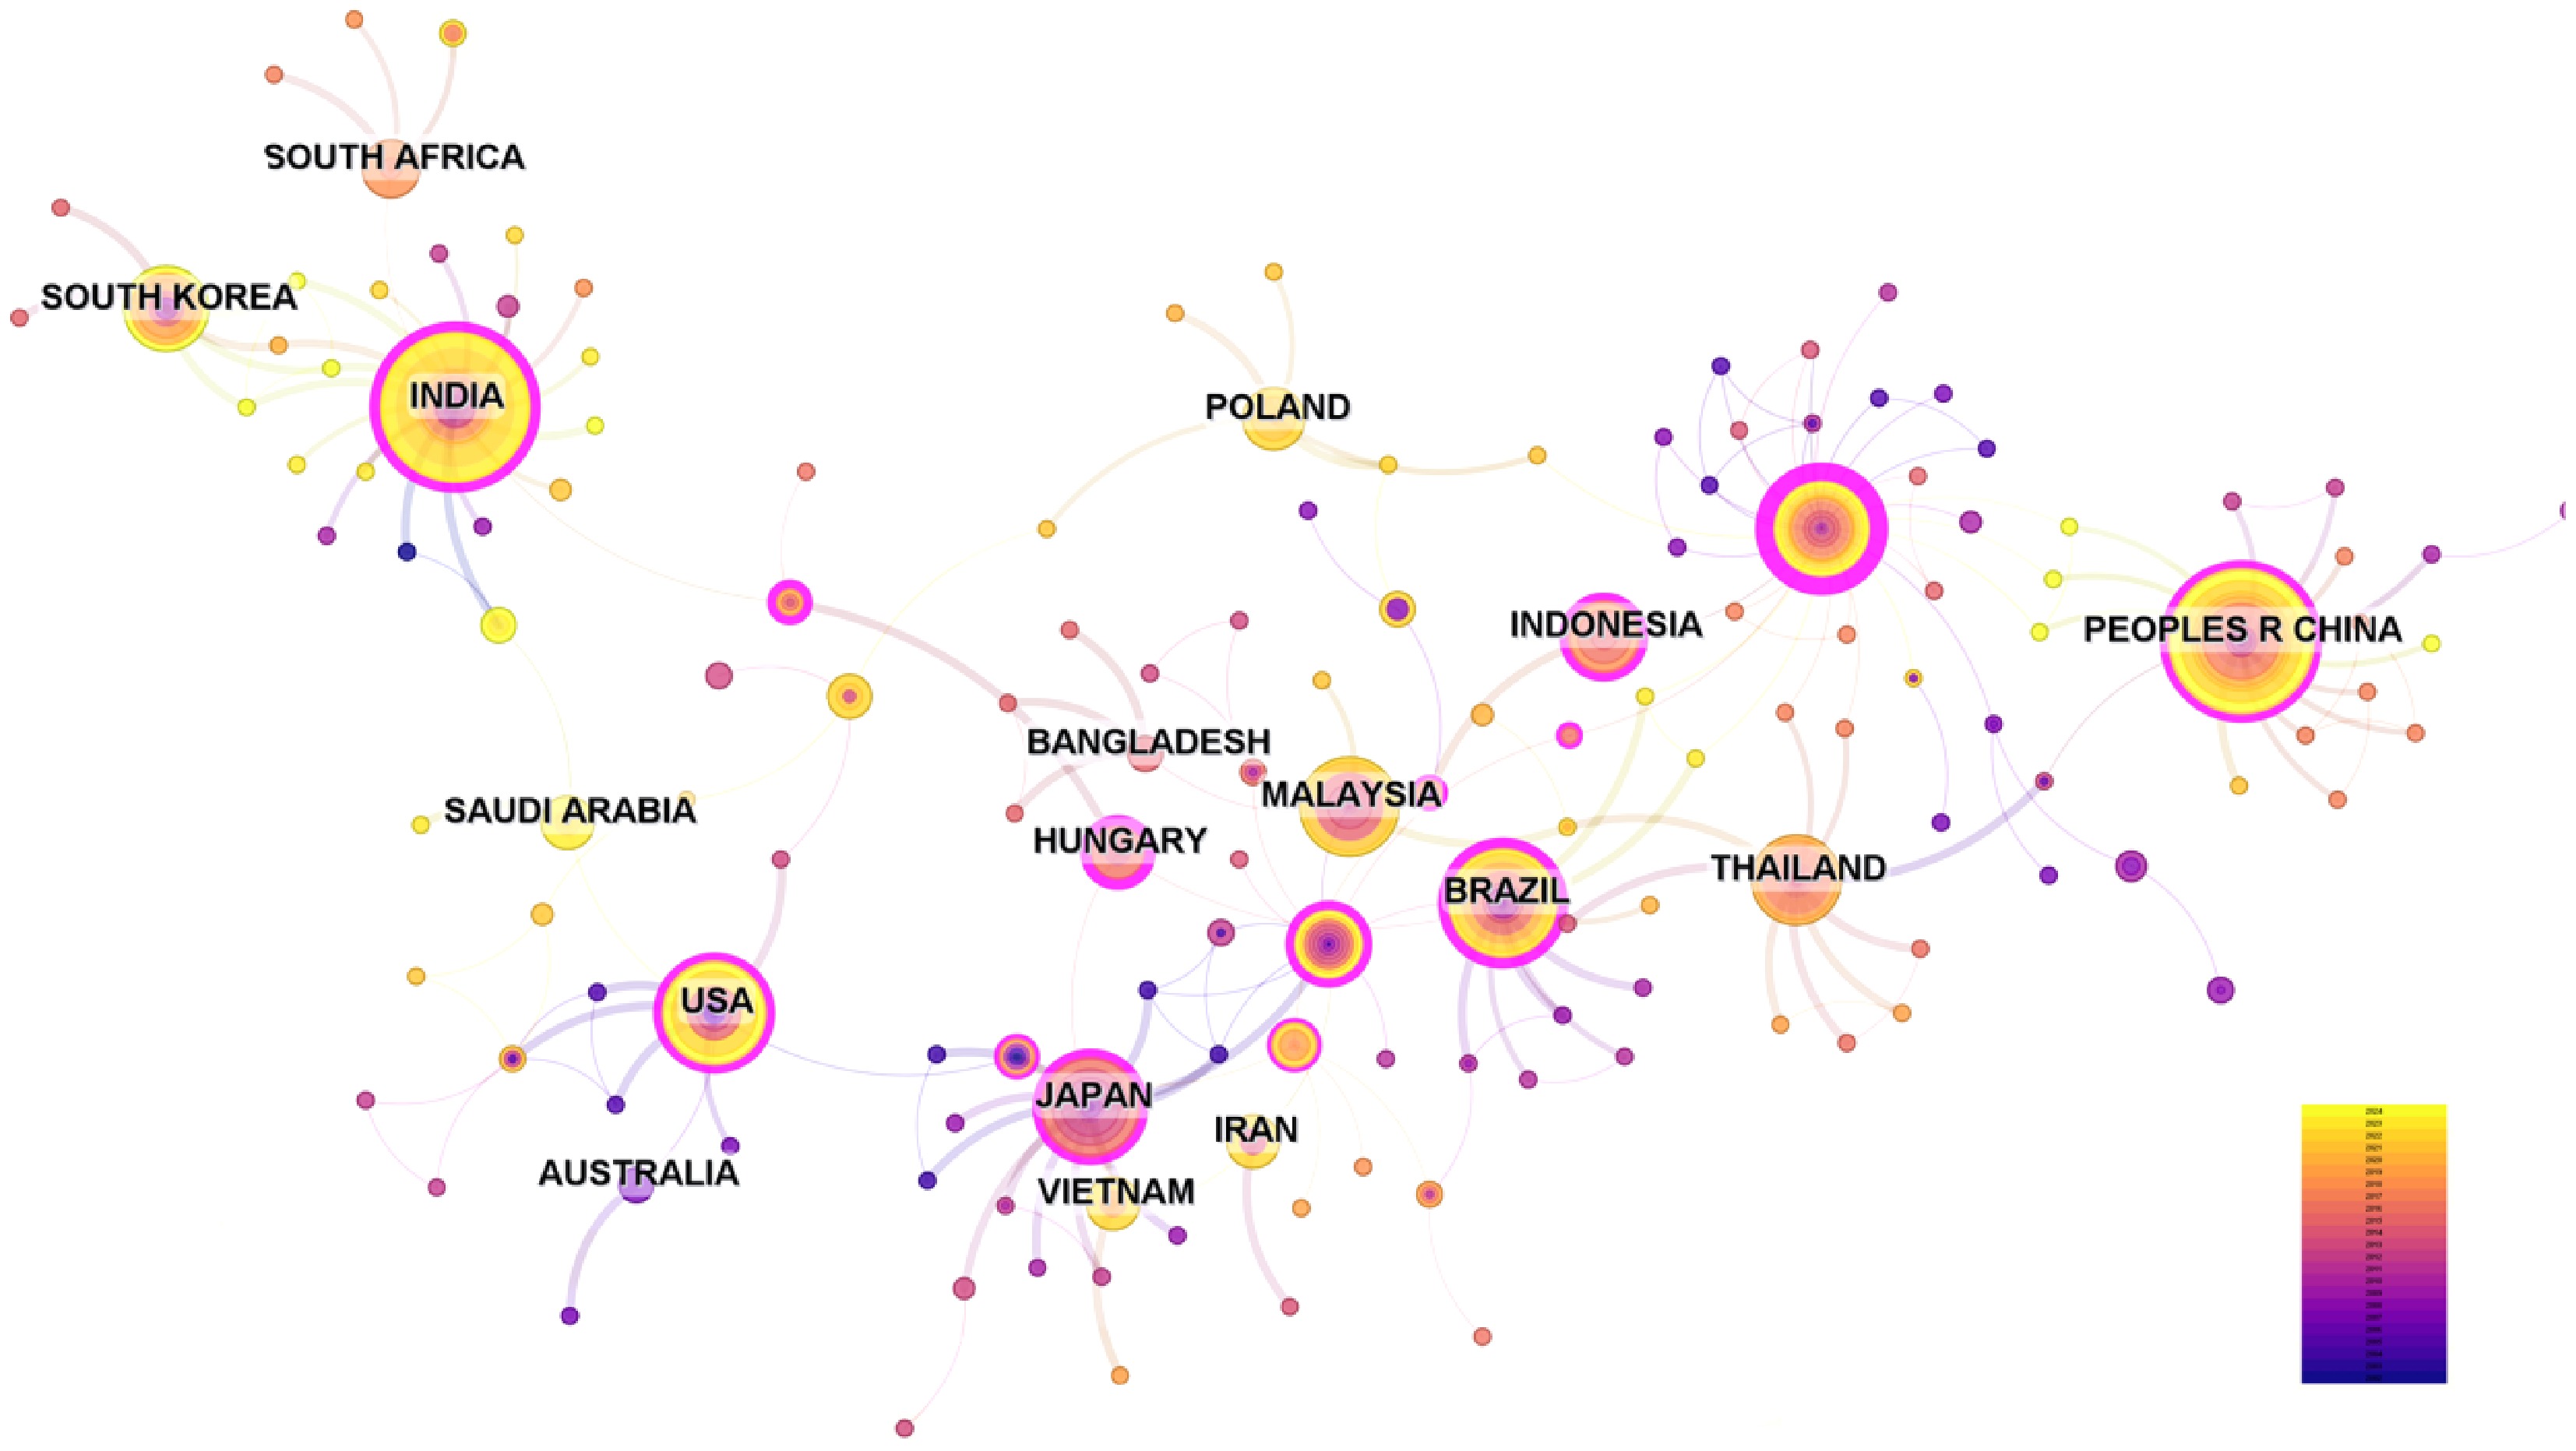
Figure 2.
Country co-occurrence network of publications.
-
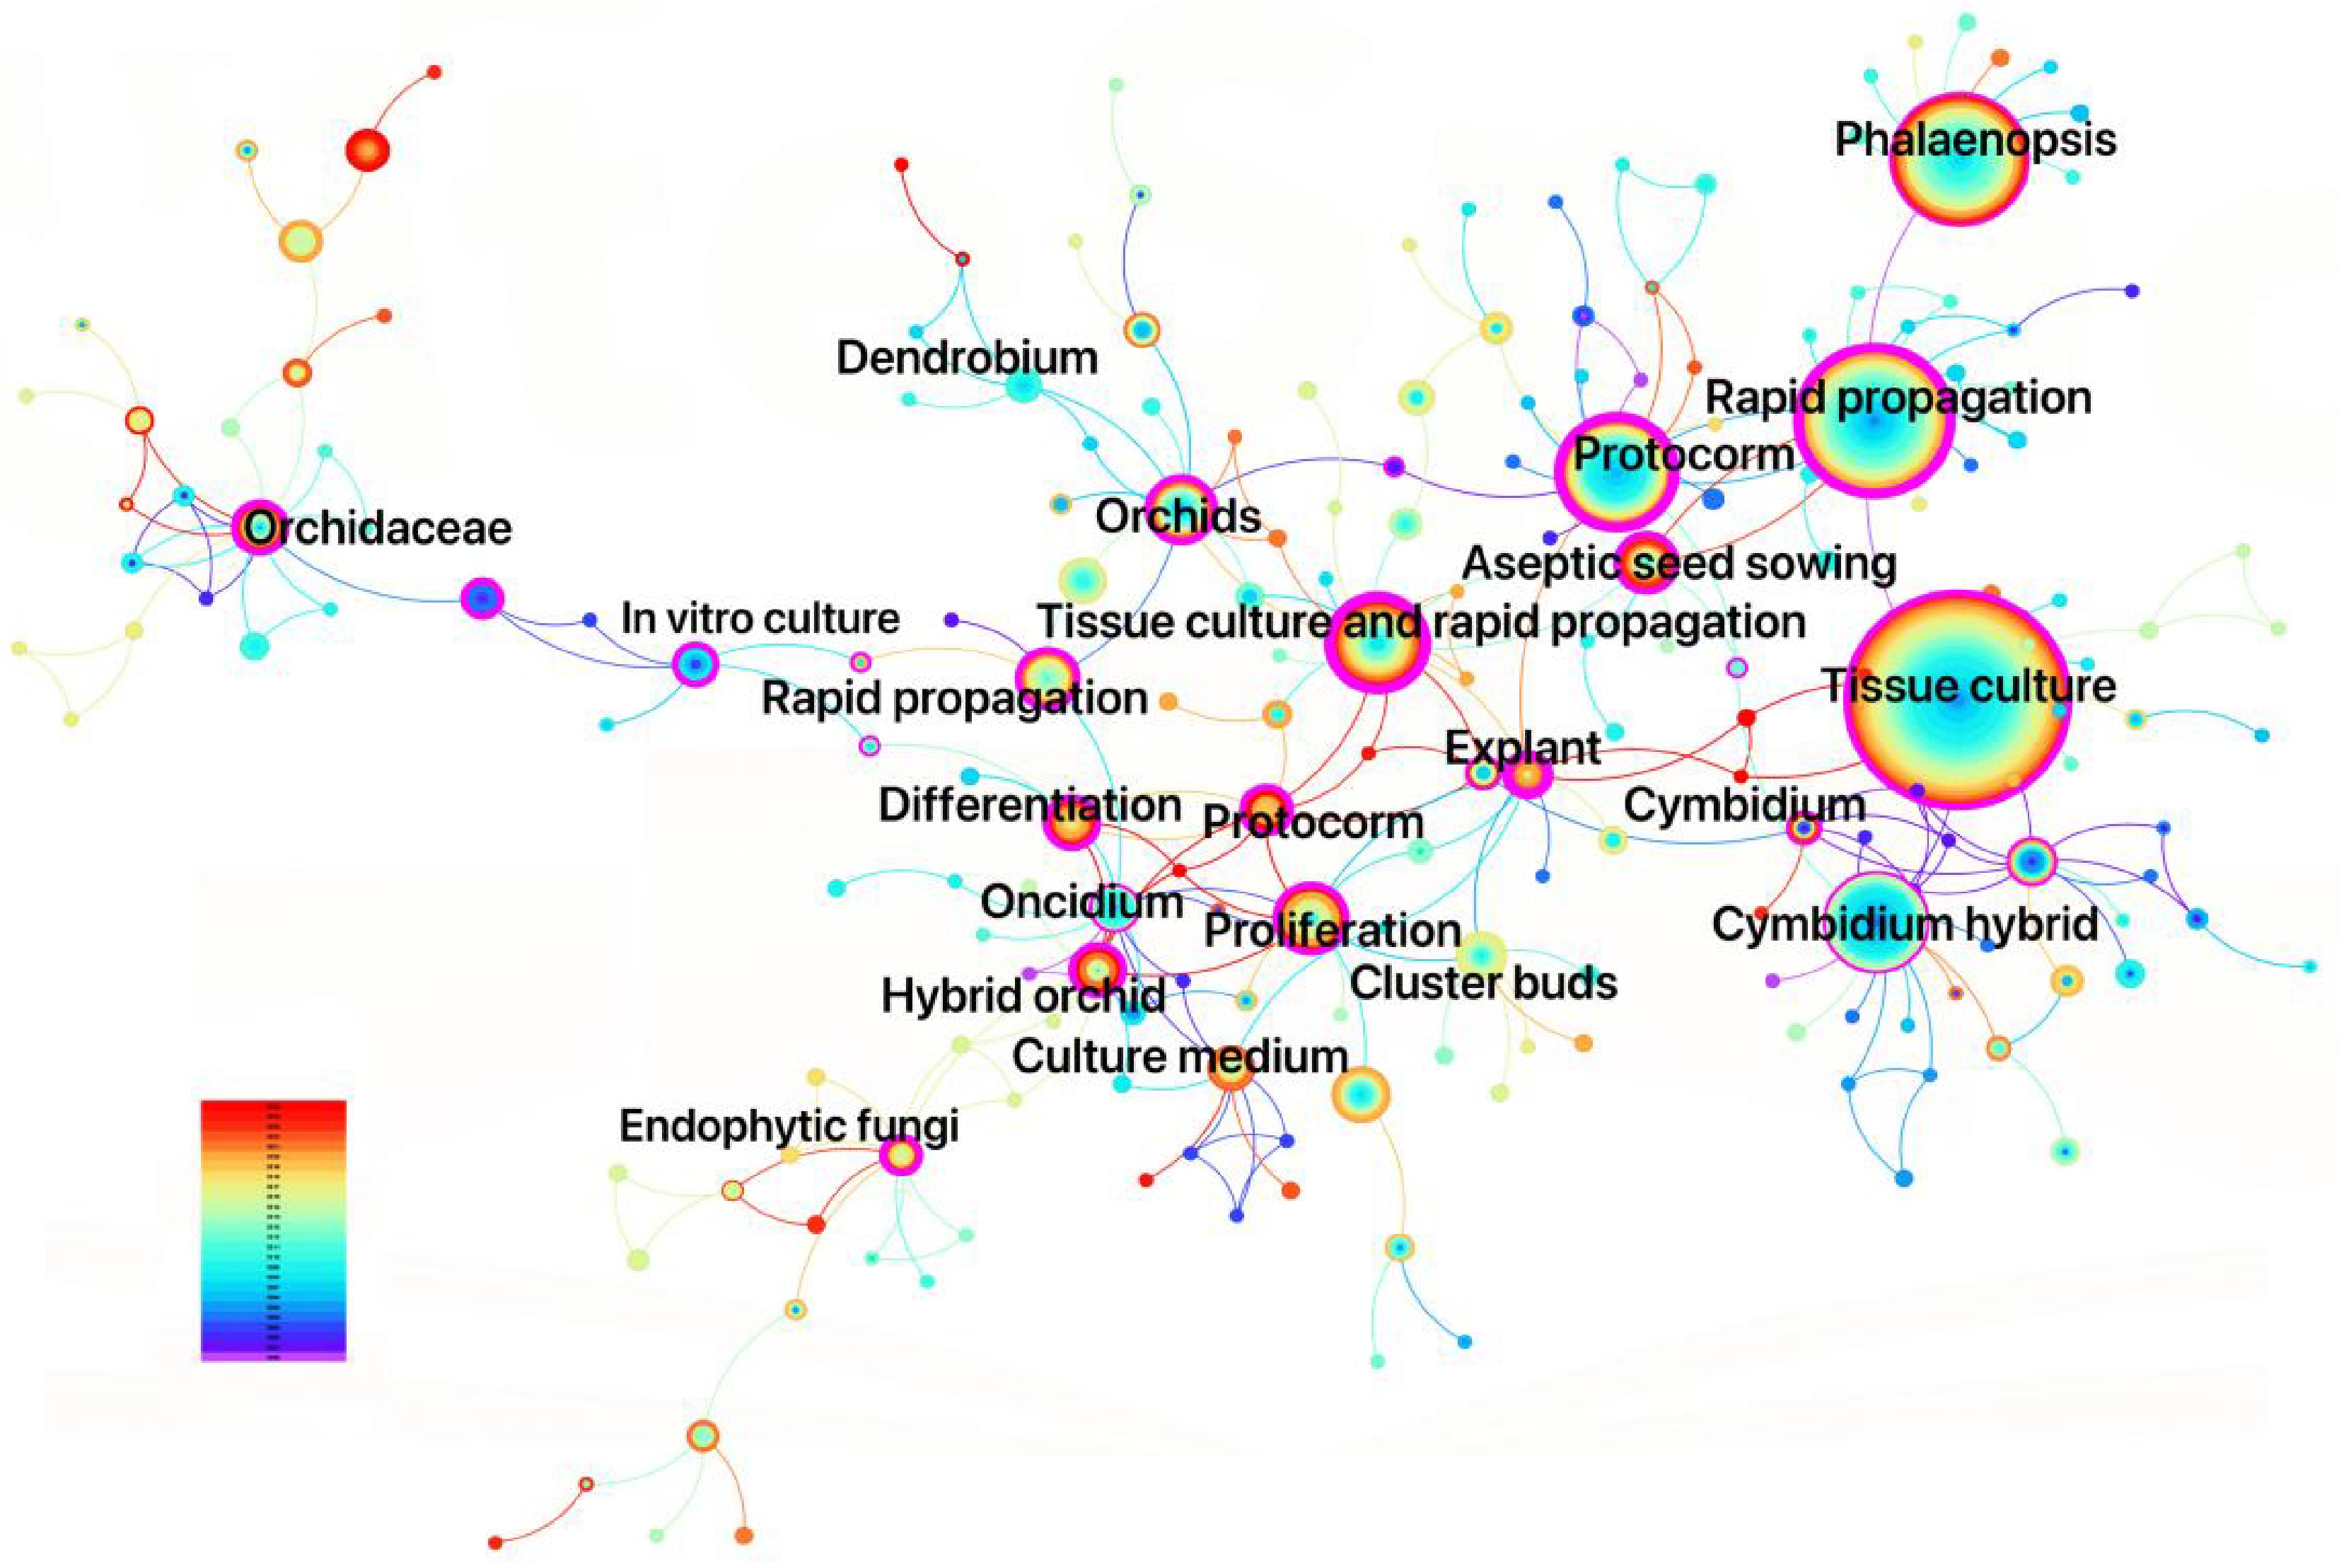
Figure 3.
Keyword co-occurrence network map of CNKI journals.
-
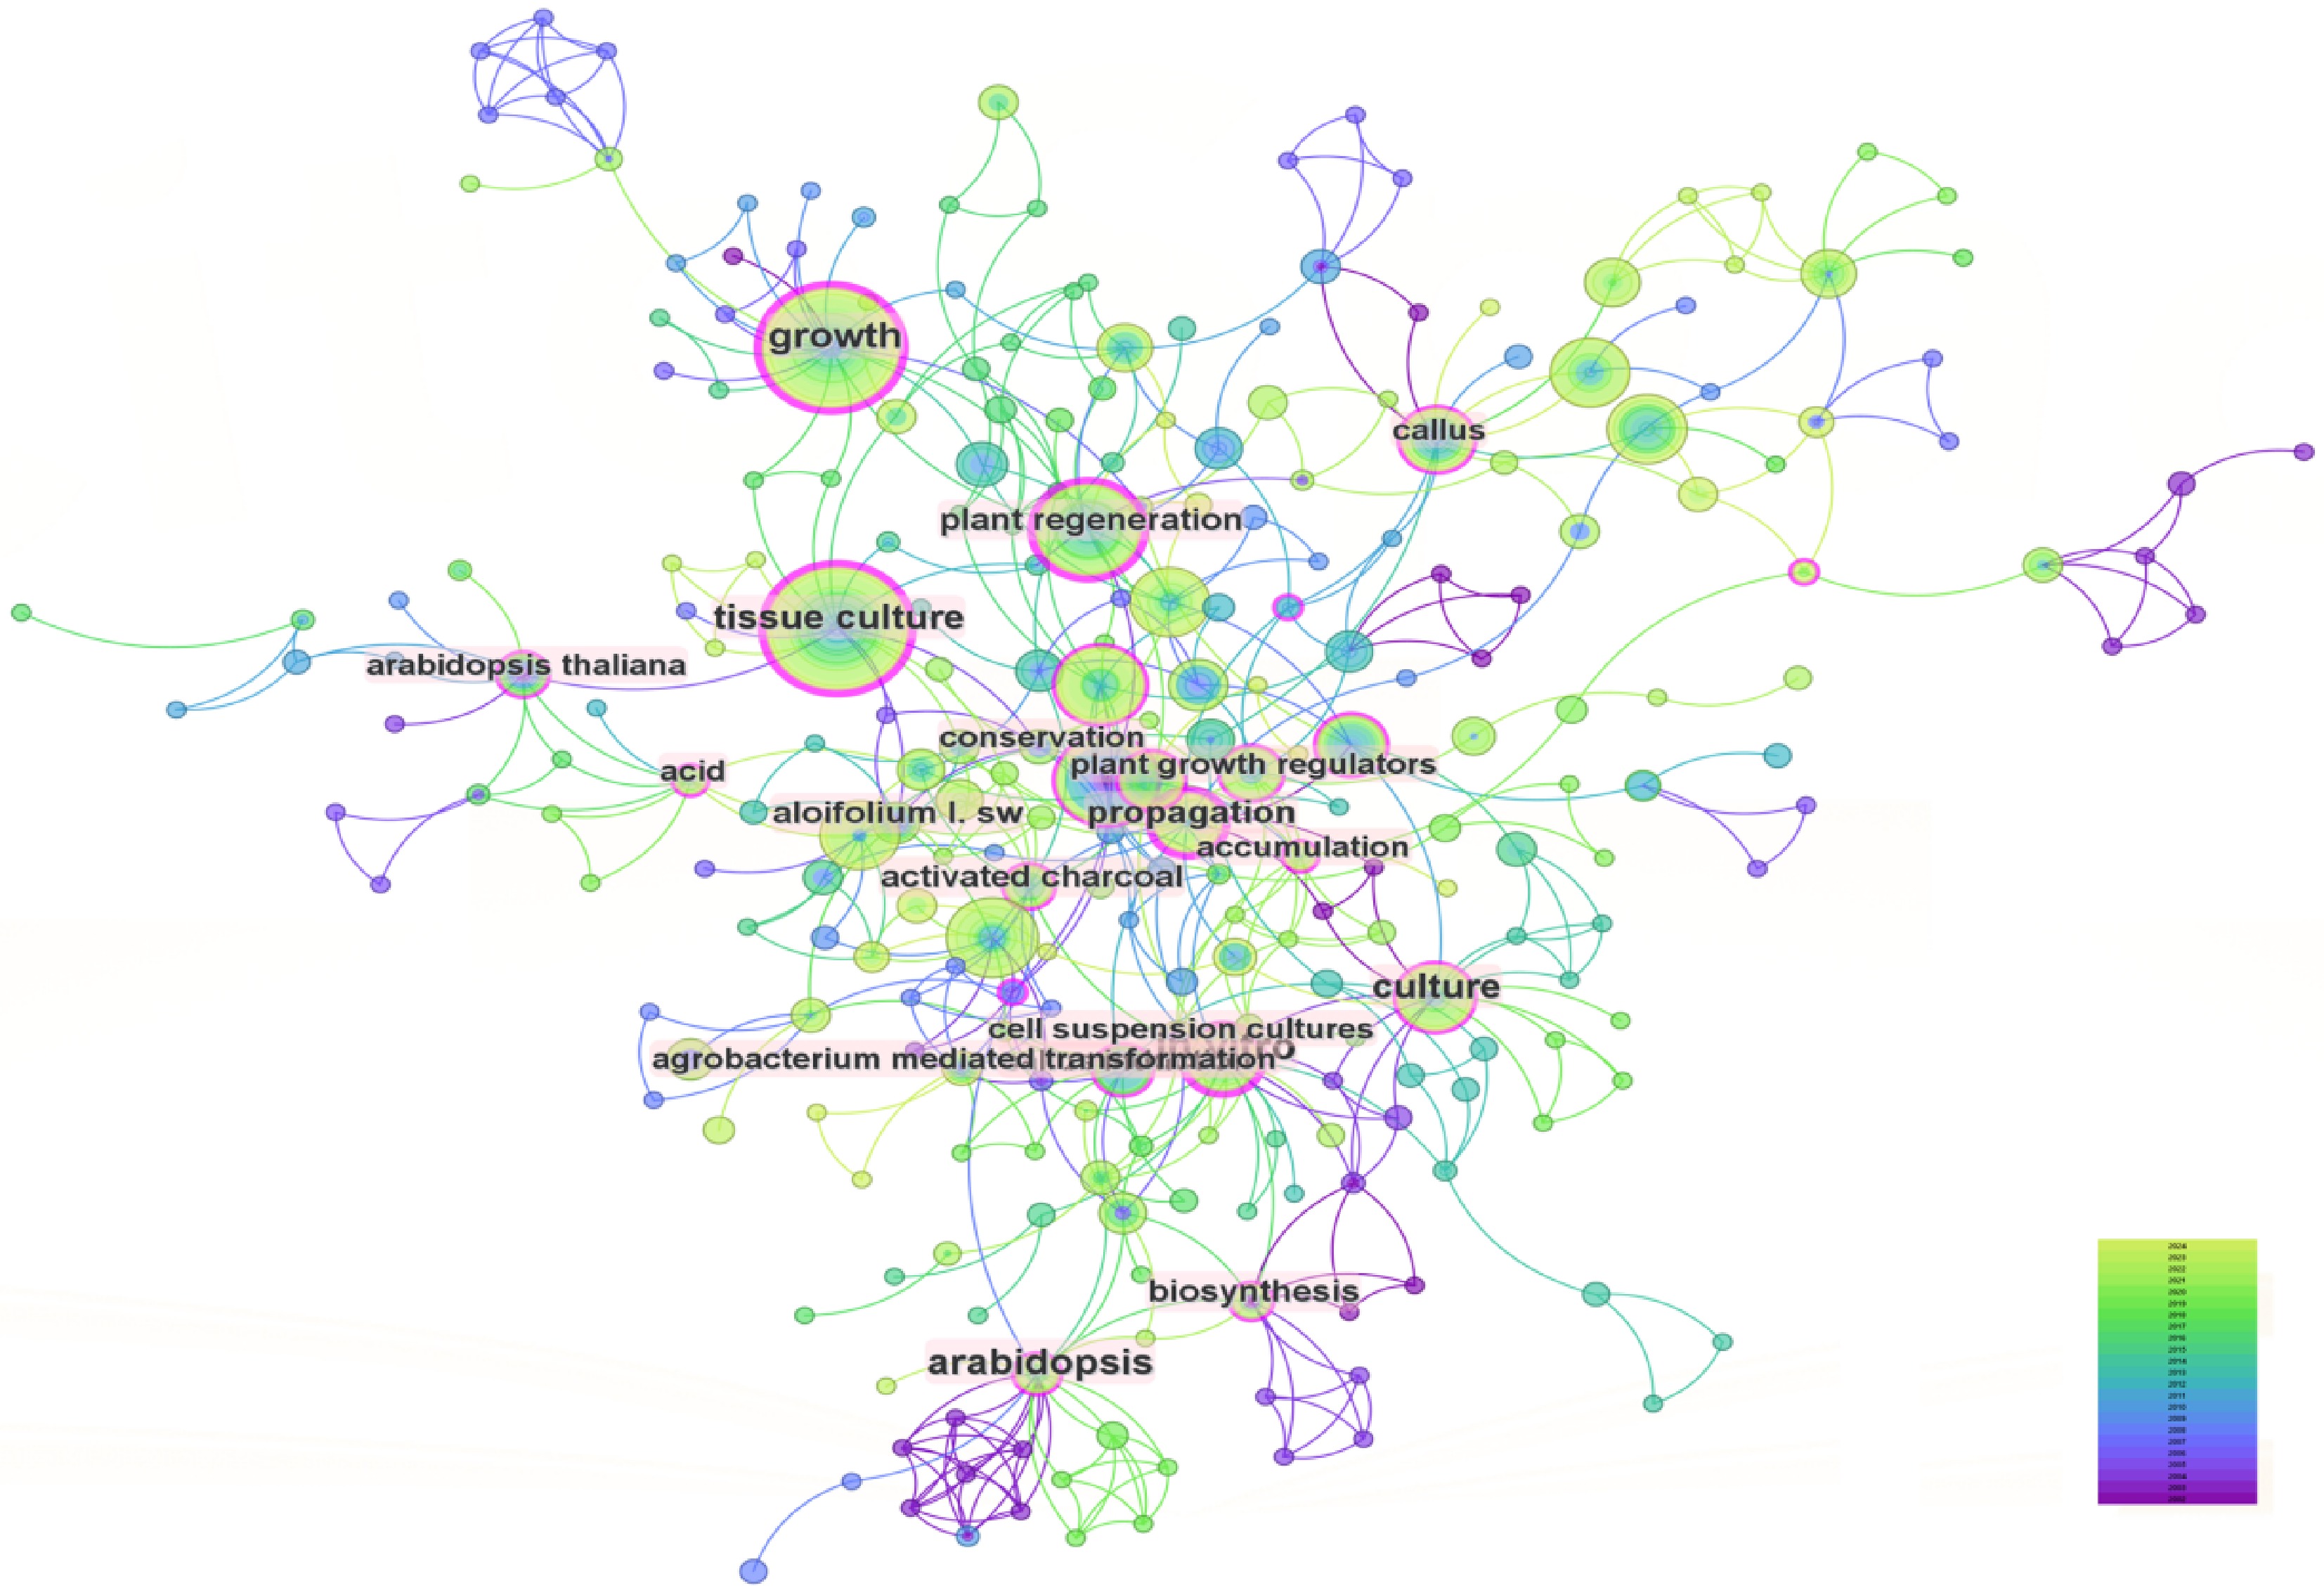
Figure 4.
Keyword co-occurrence network map of WoS journals.
-
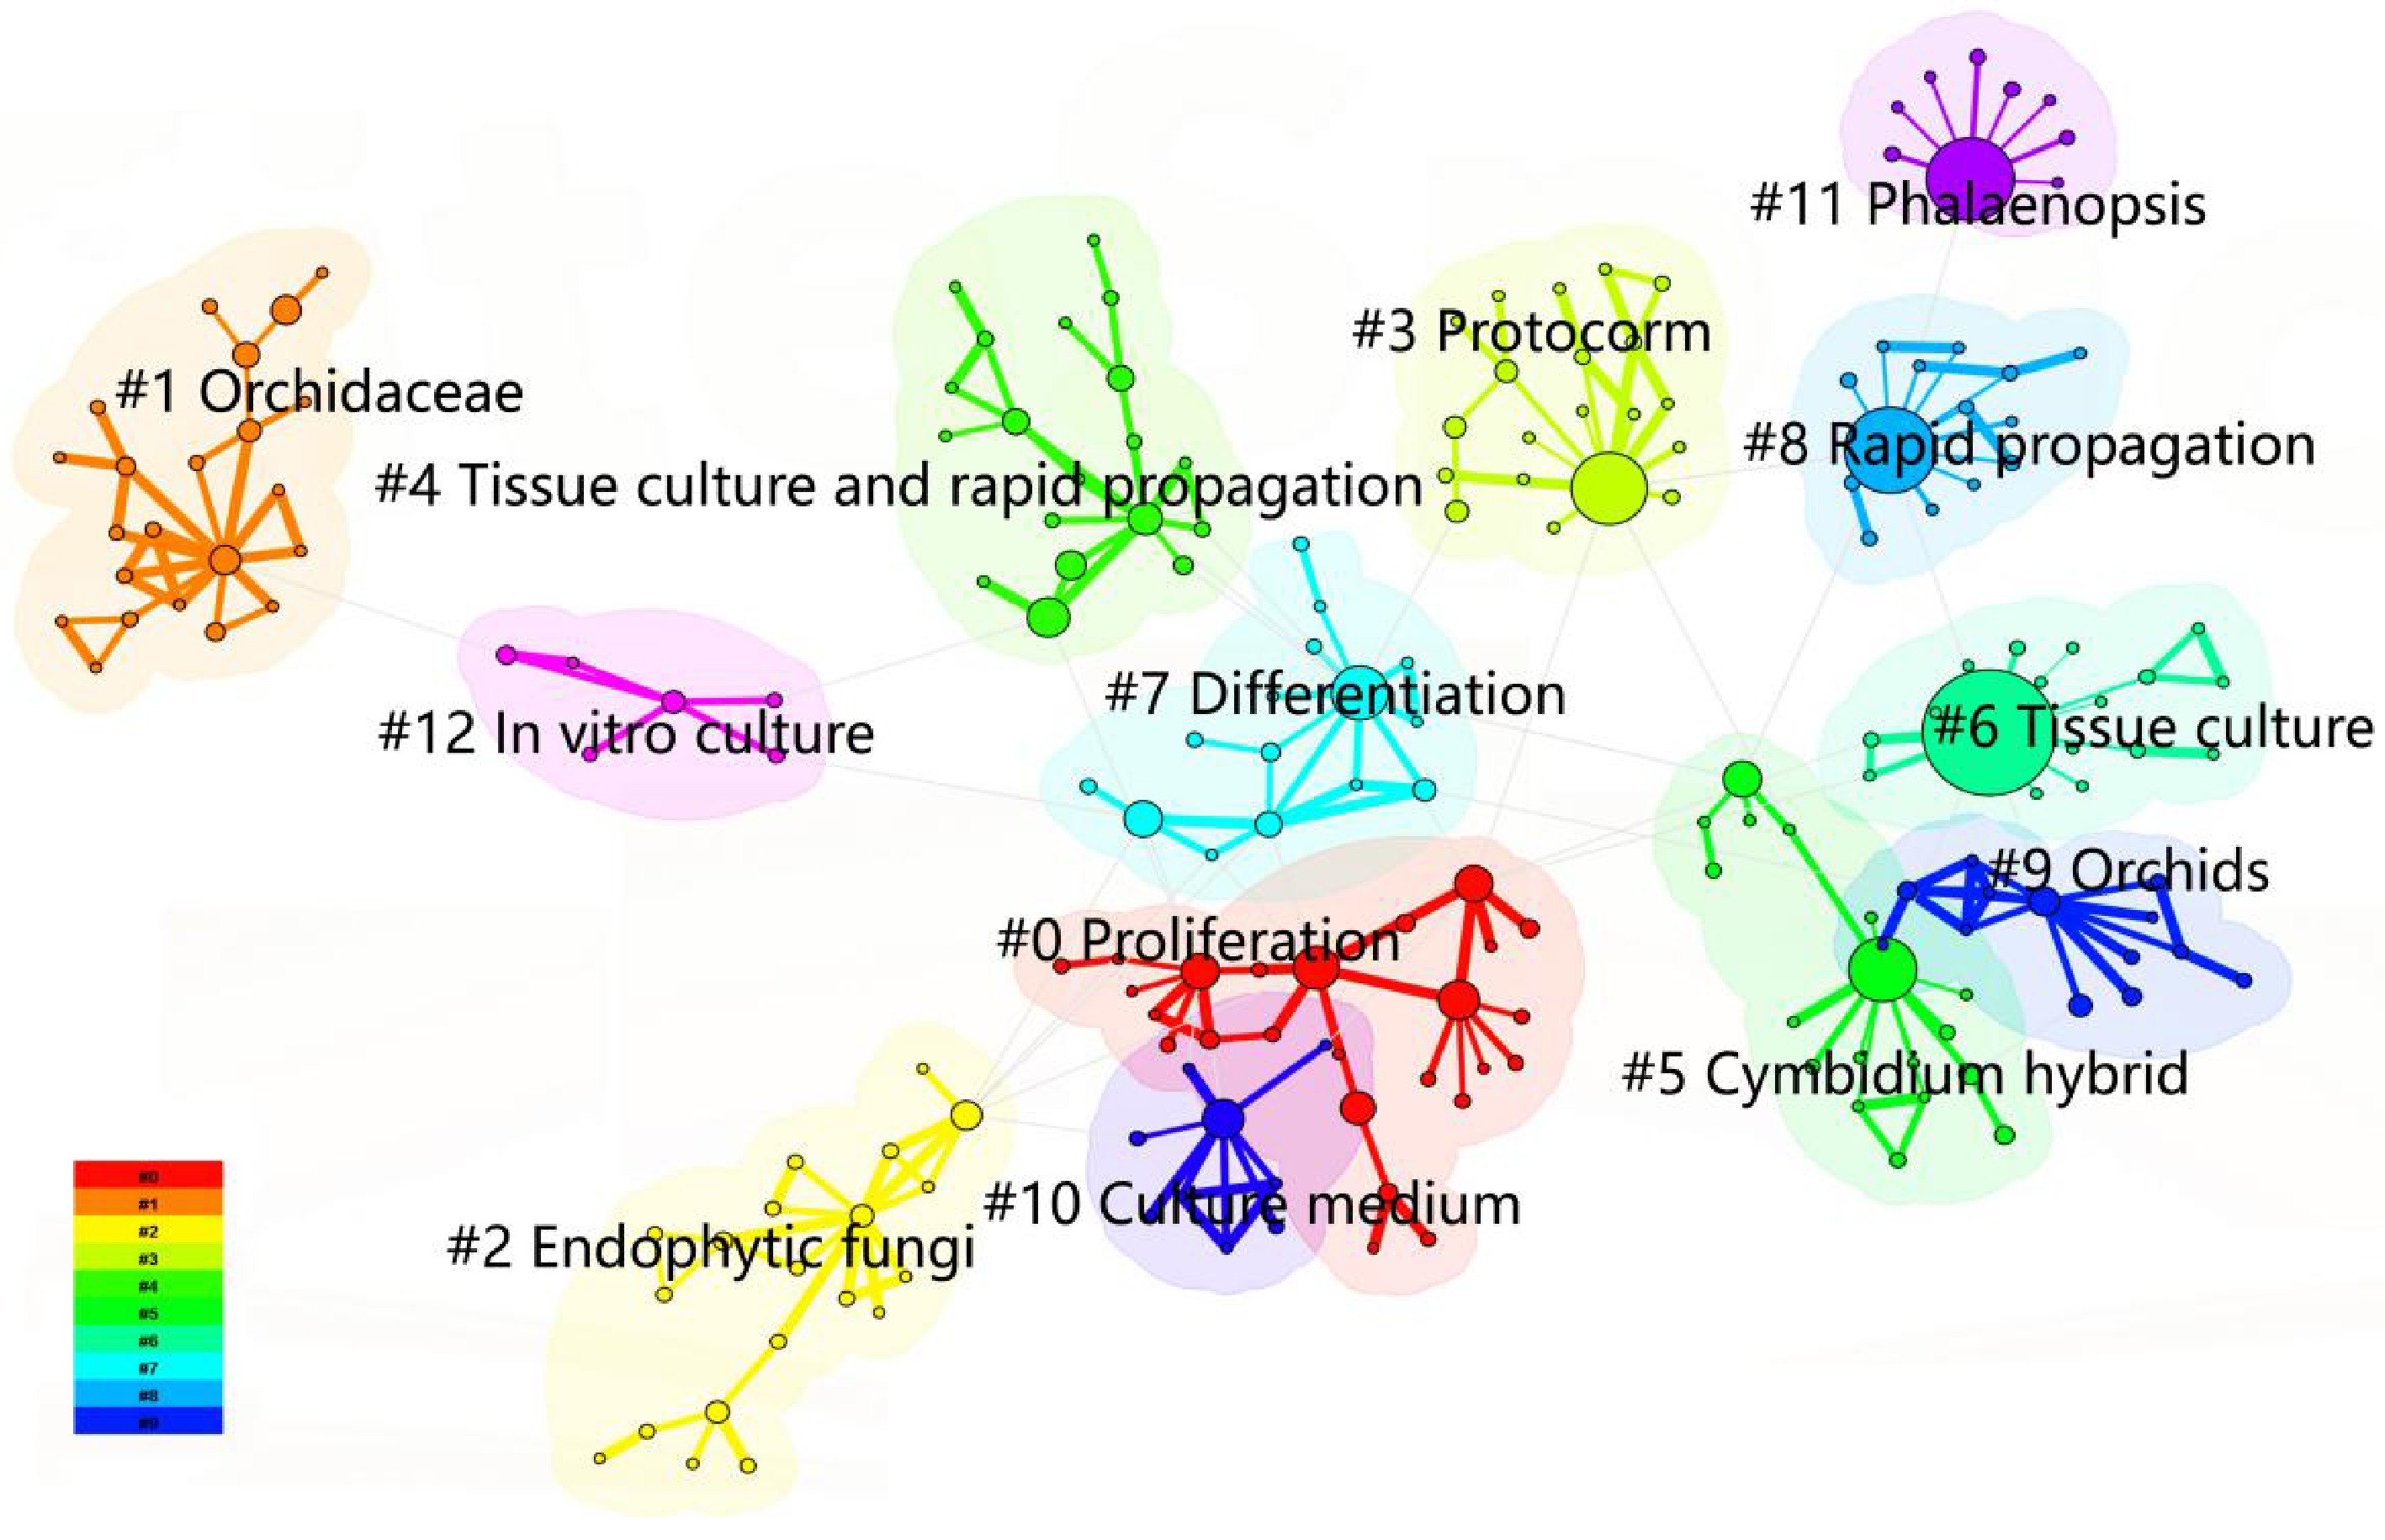
Figure 5.
Keyword clustering network map of CNKI journals.
-
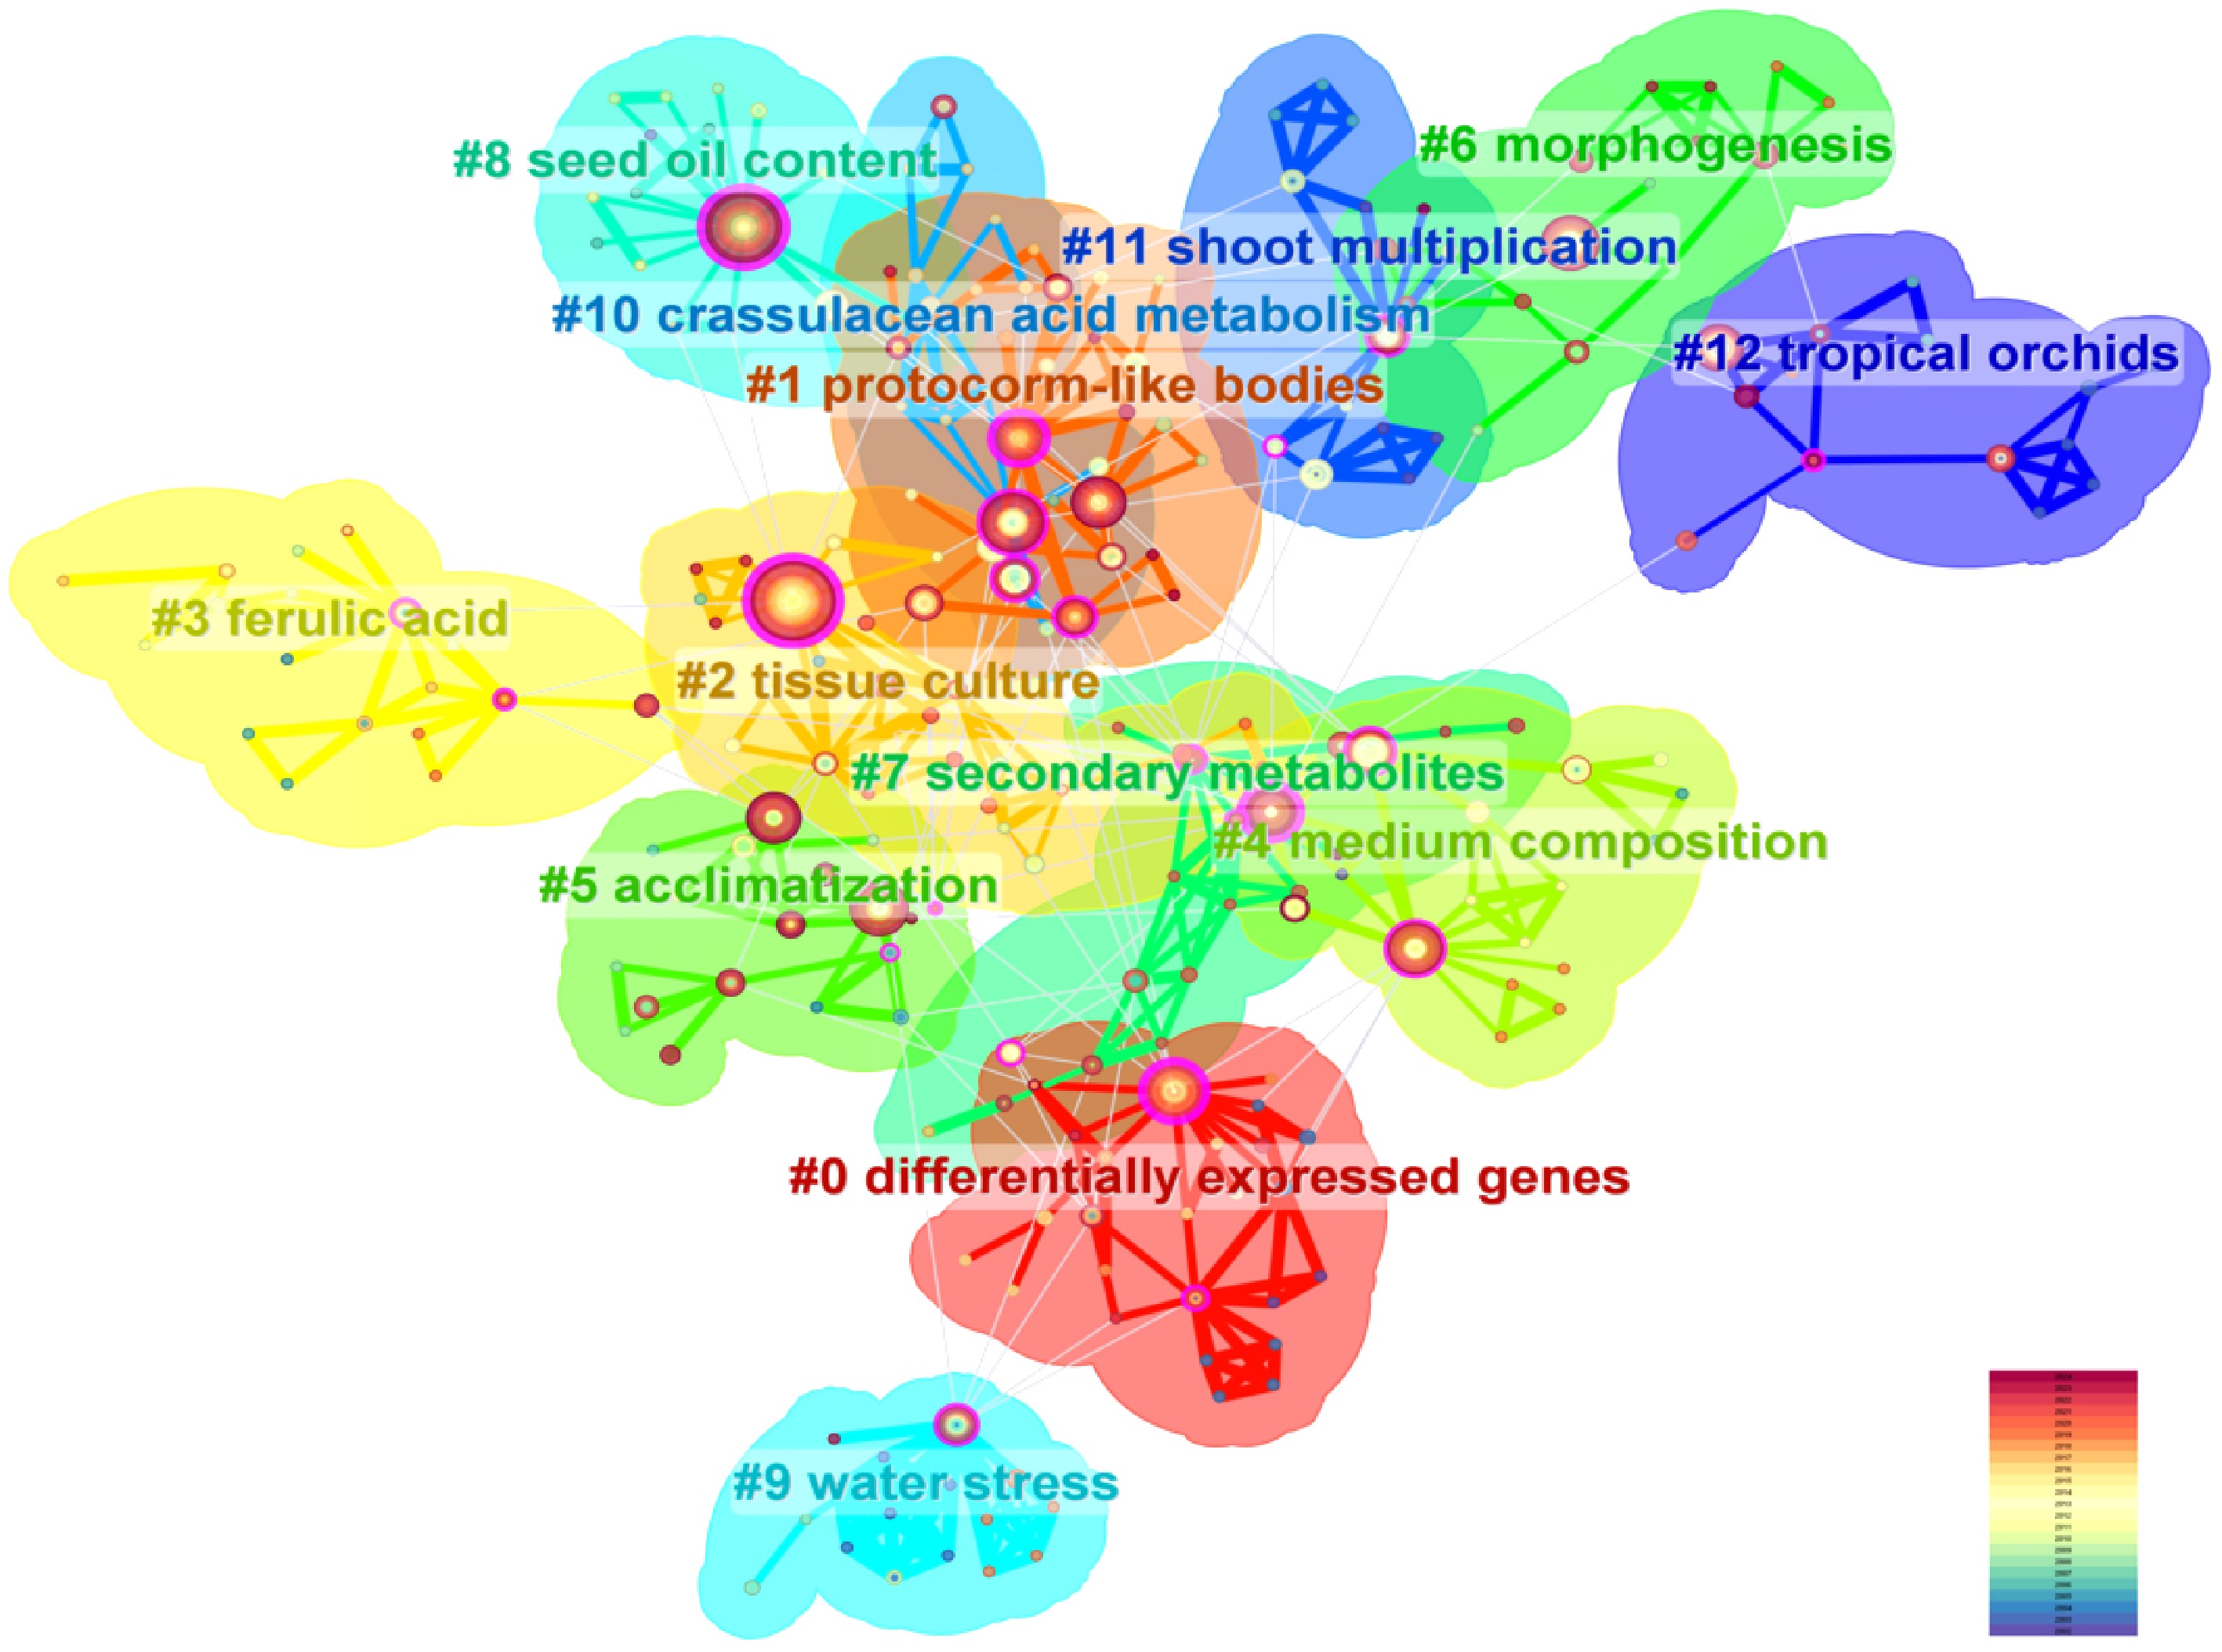
Figure 6.
Keyword clustering network map of WoS journals.
-
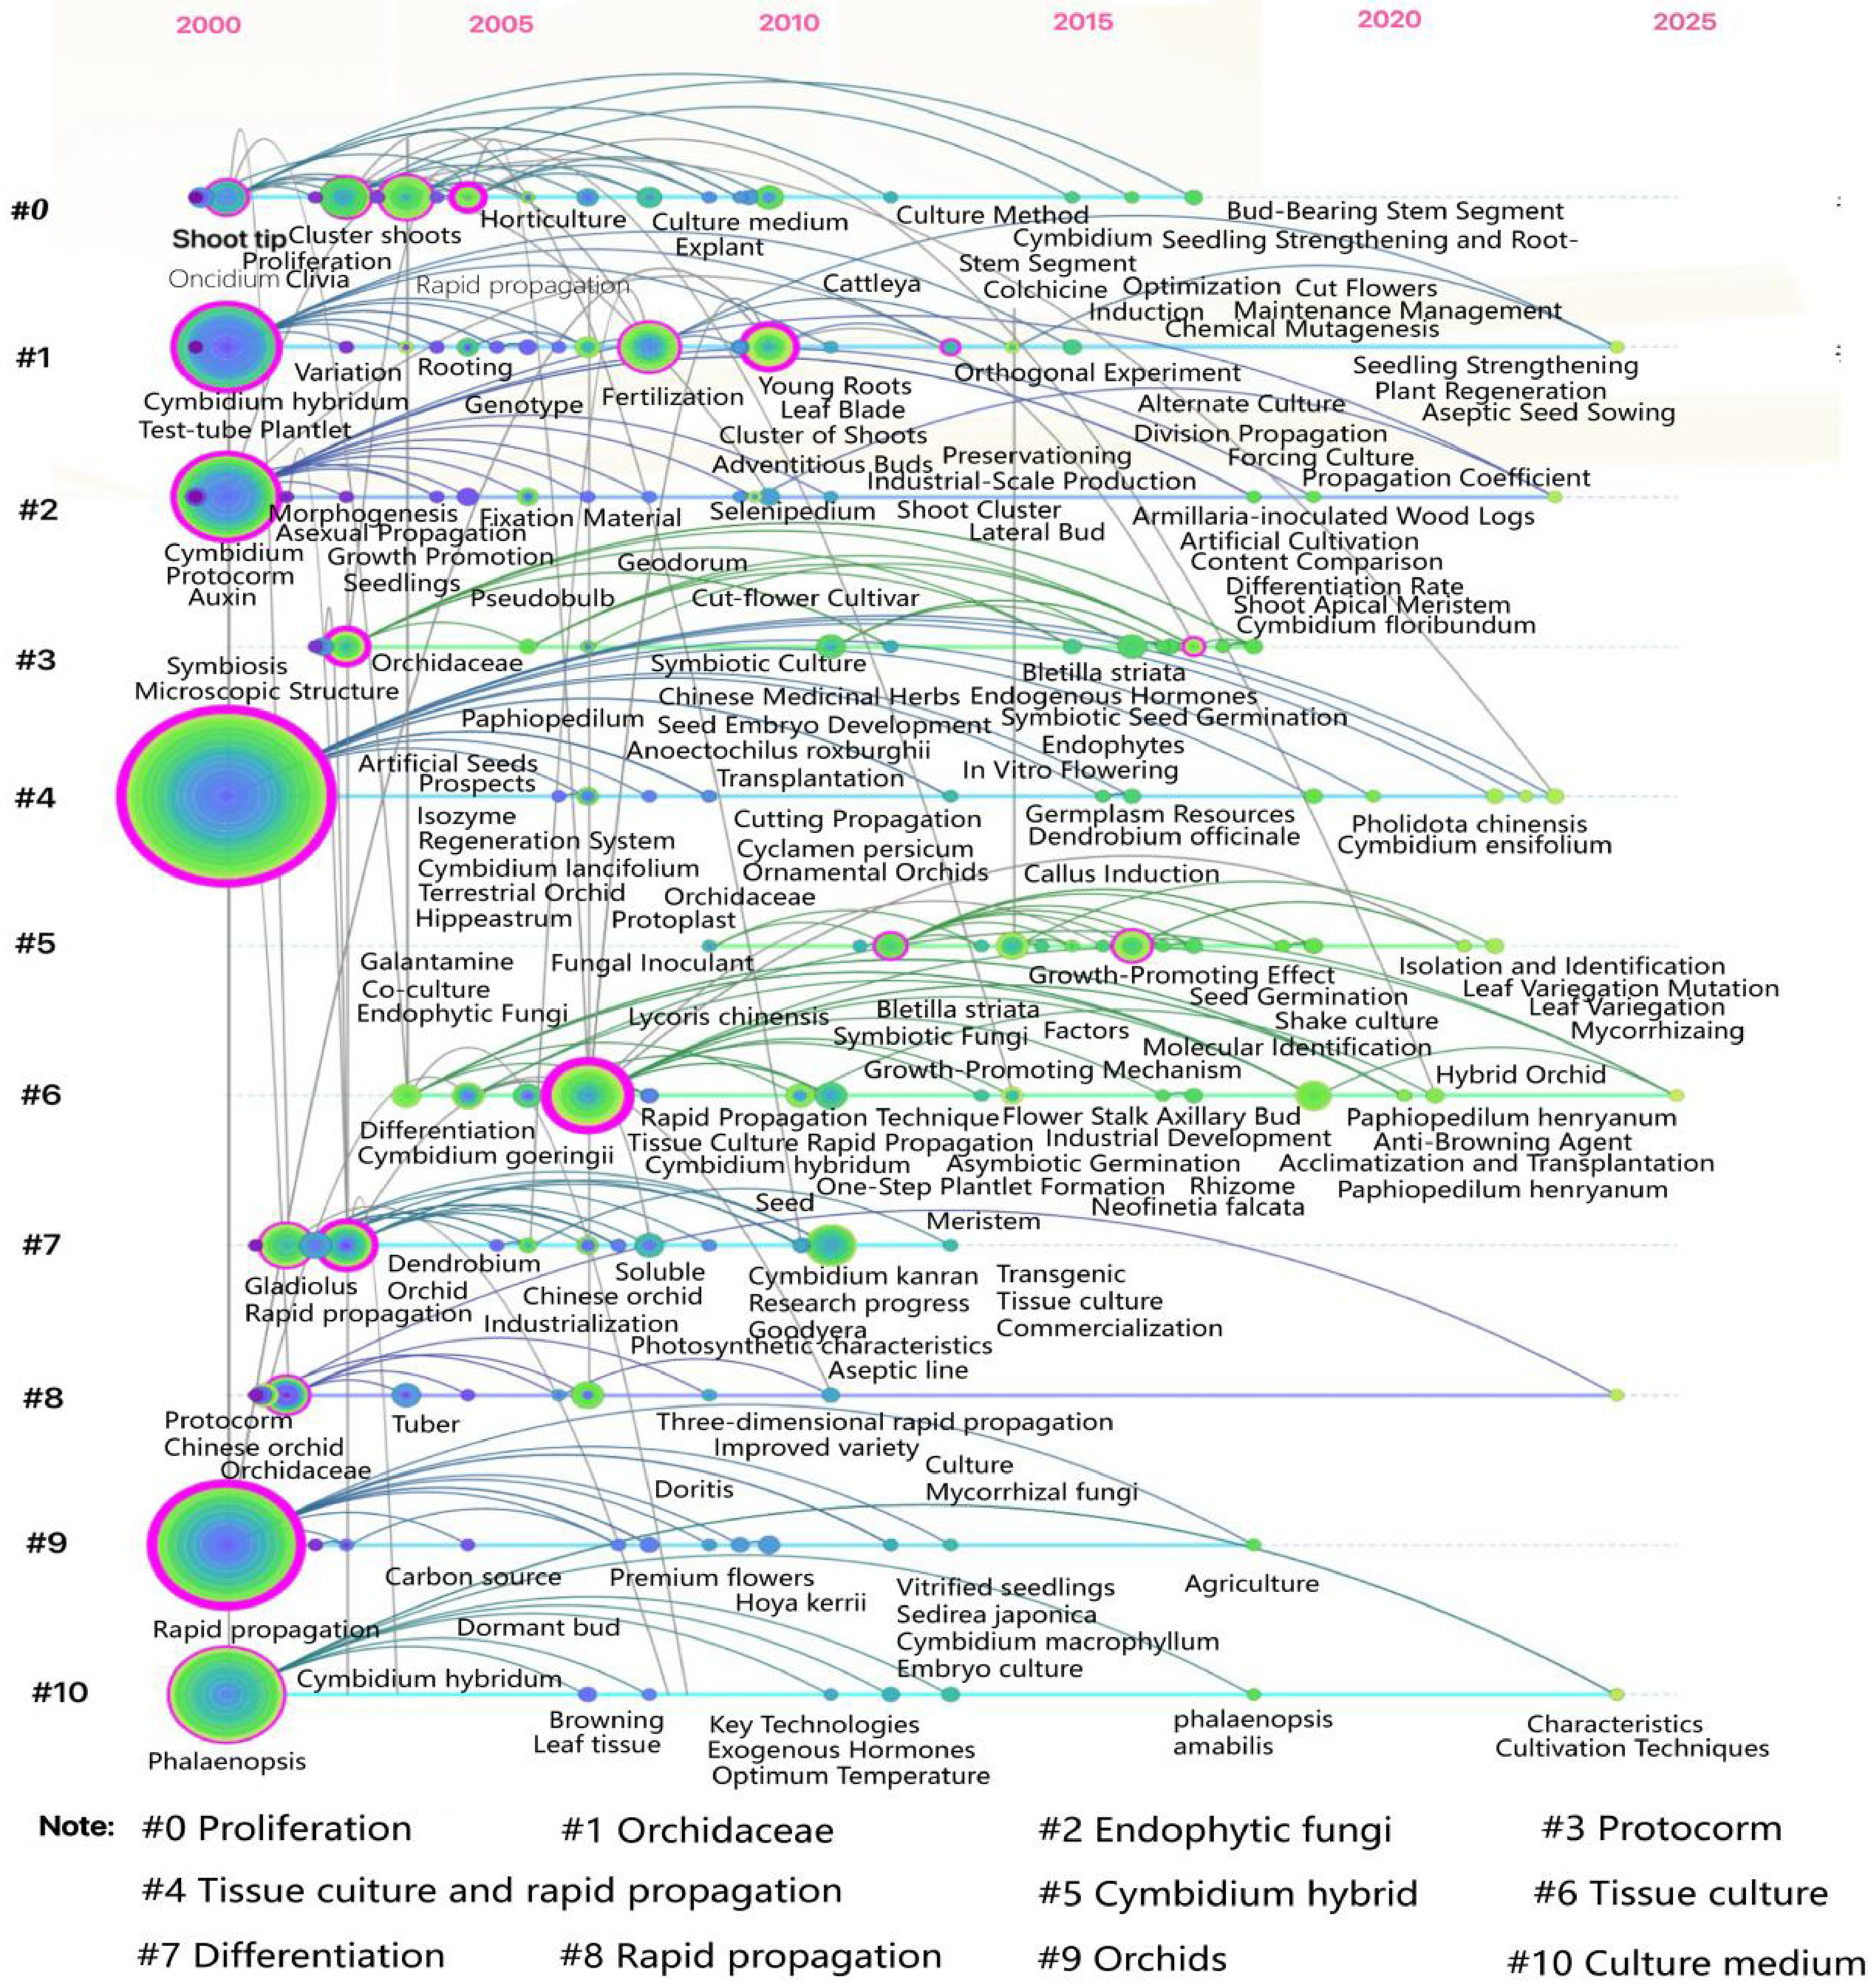
Figure 7.
Keyword time-zone clustering network map of CNKI journals.
-
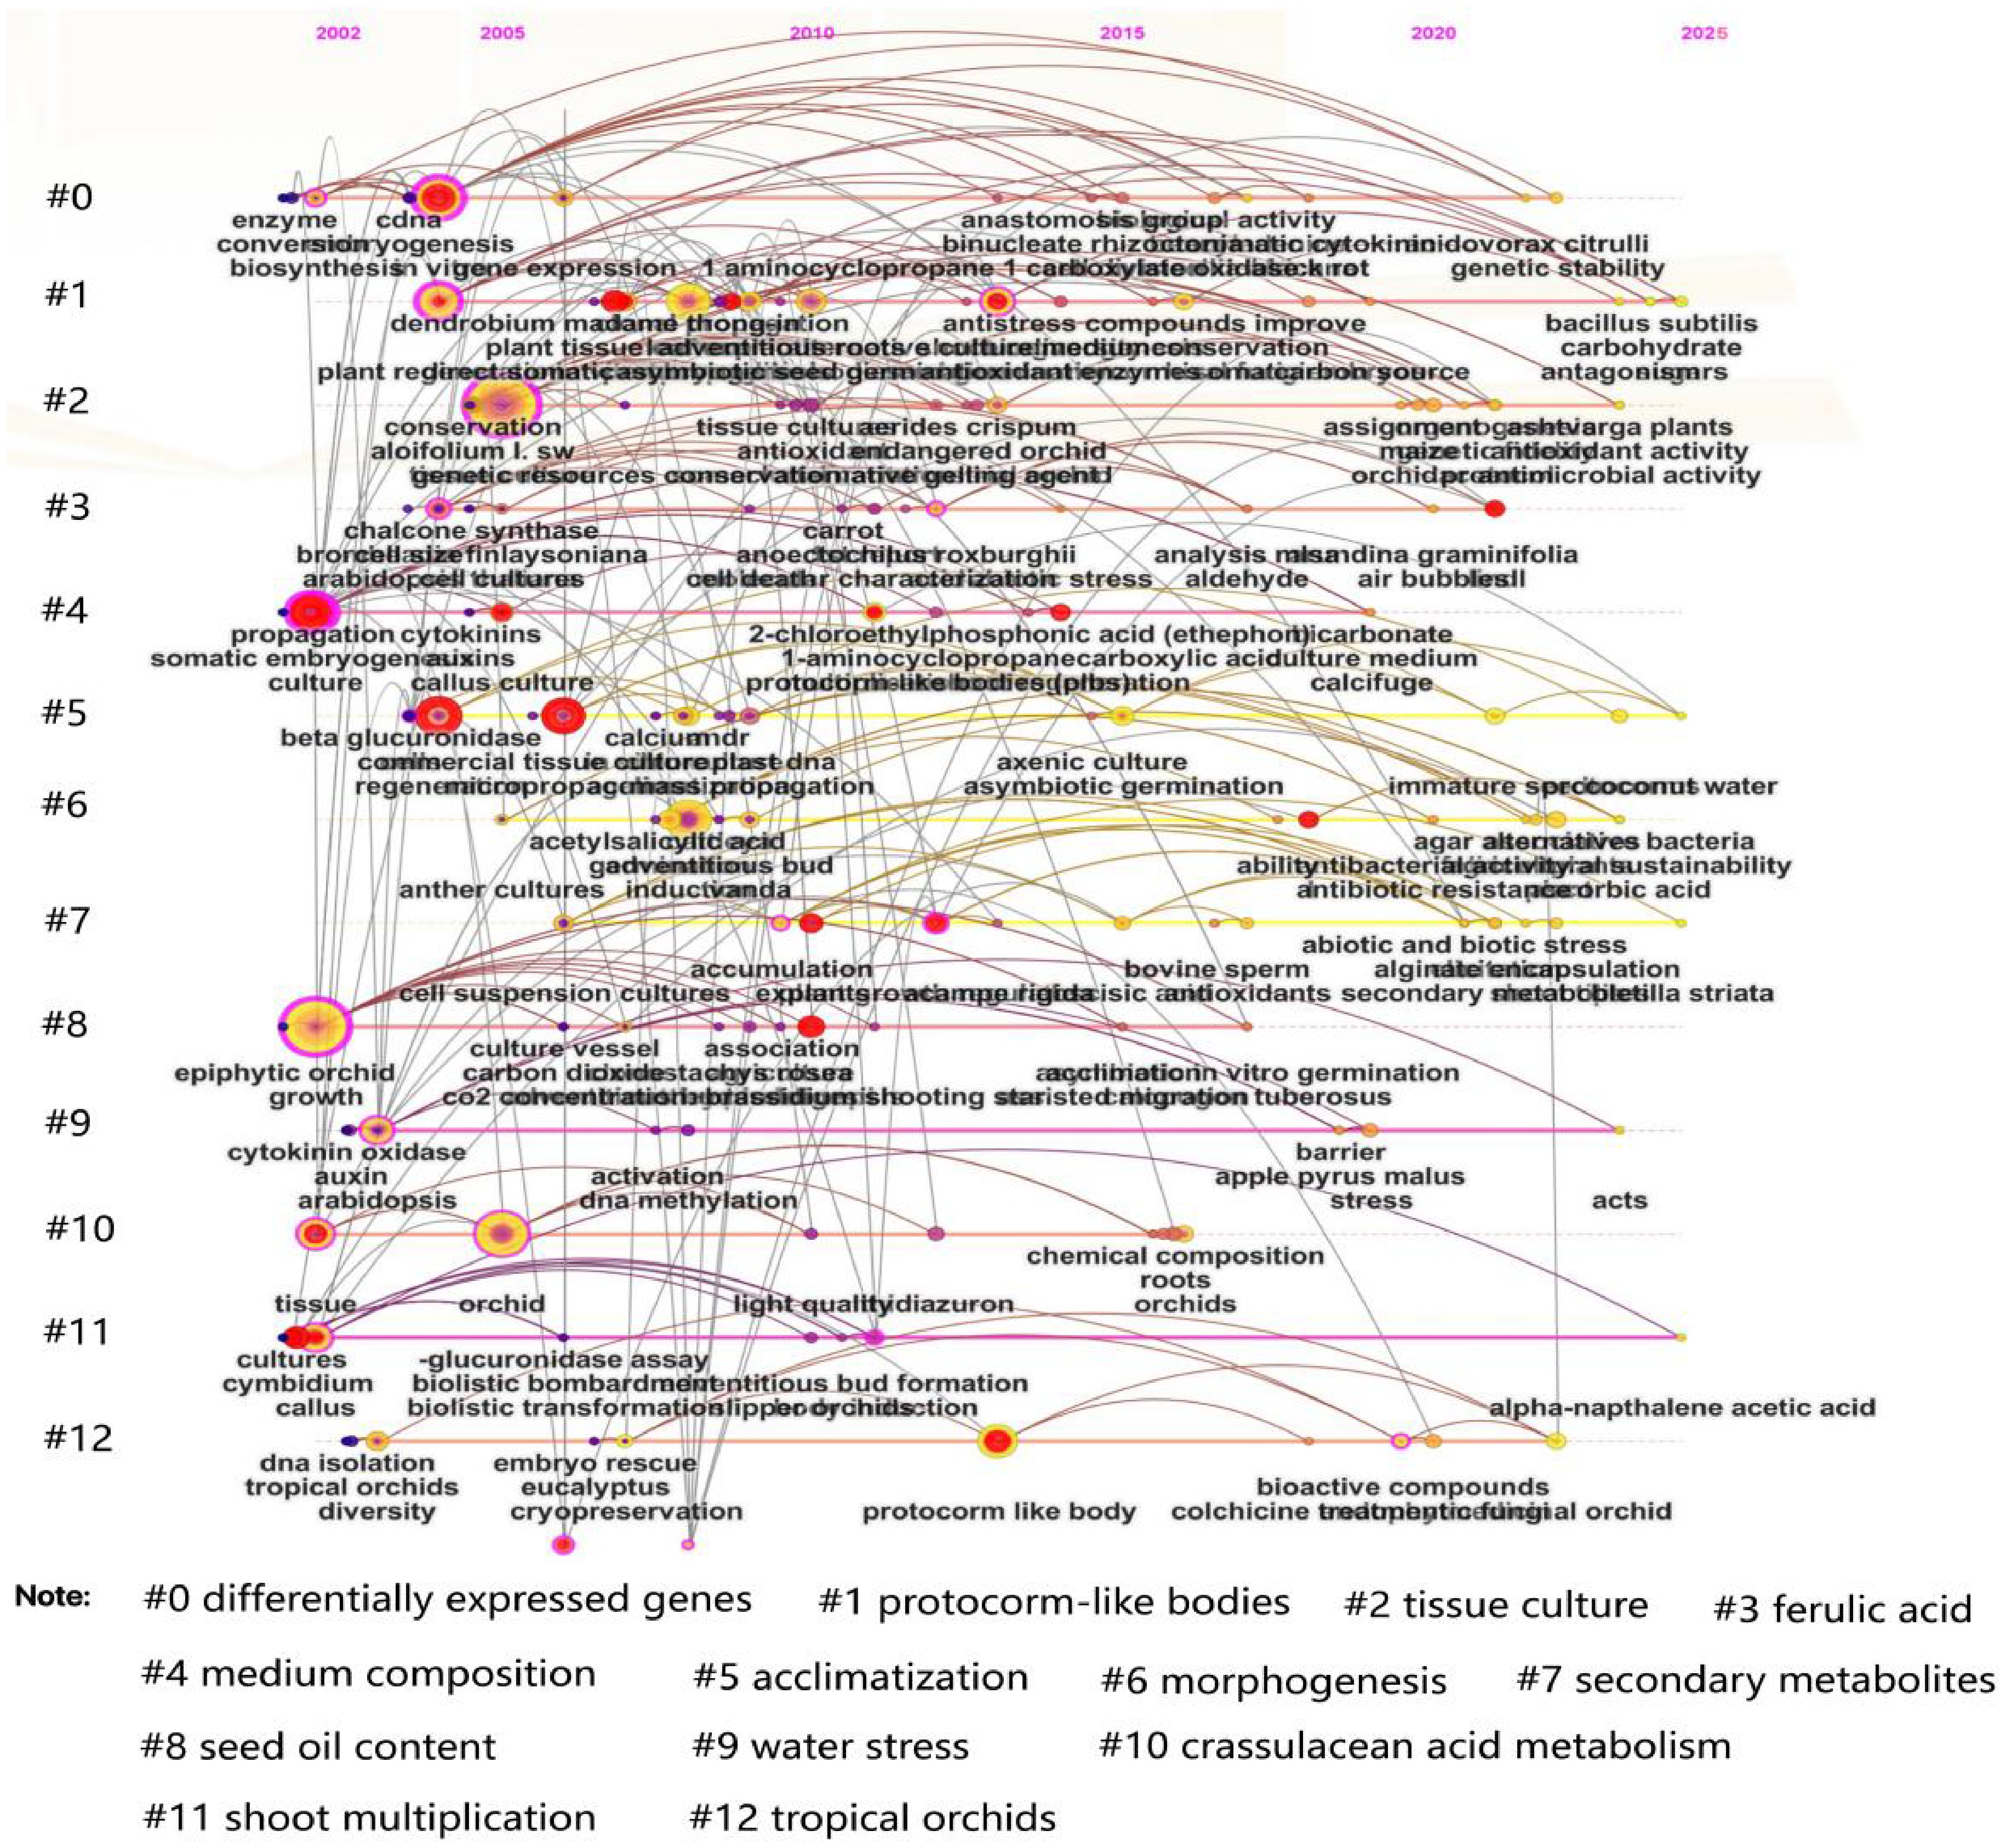
Figure 8.
Keyword time-zone clustering network map of WoS journals.
-
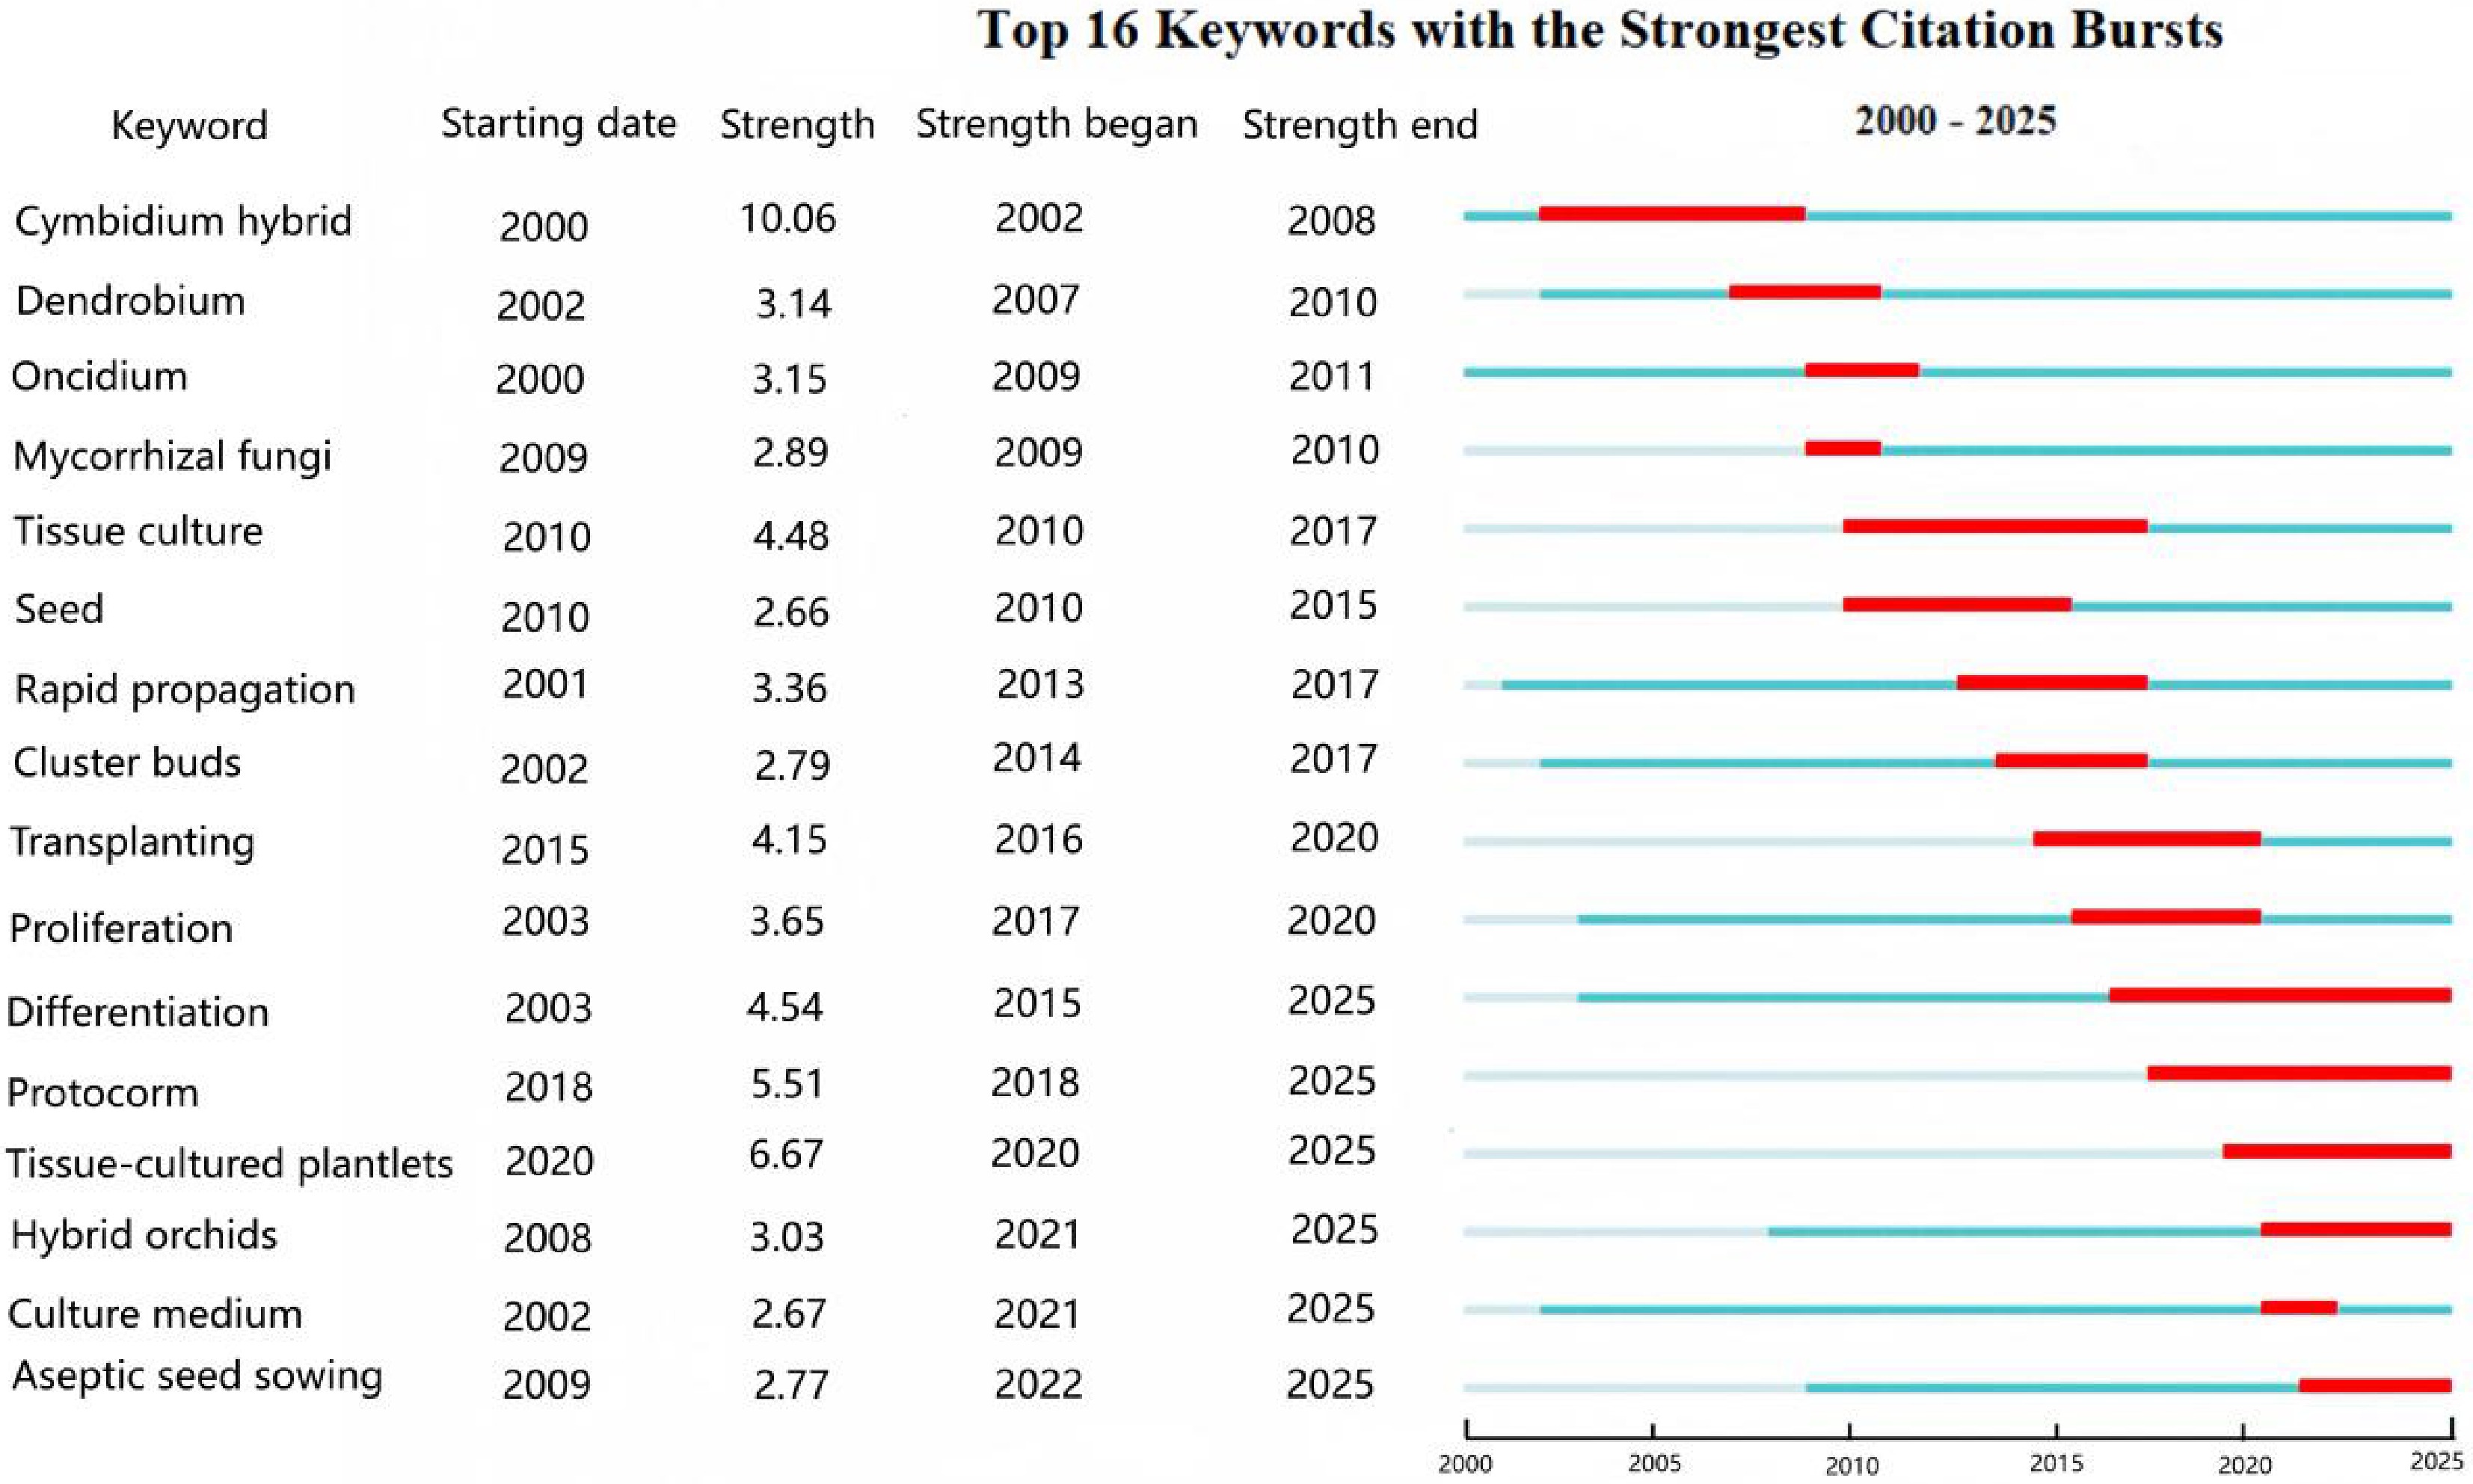
Figure 9.
Keyword burst detection map of CNKI journals. A higher strength value correspond to greater magnitude of citation growth during the burst period (> 3.0 indicates strong bursts).
-
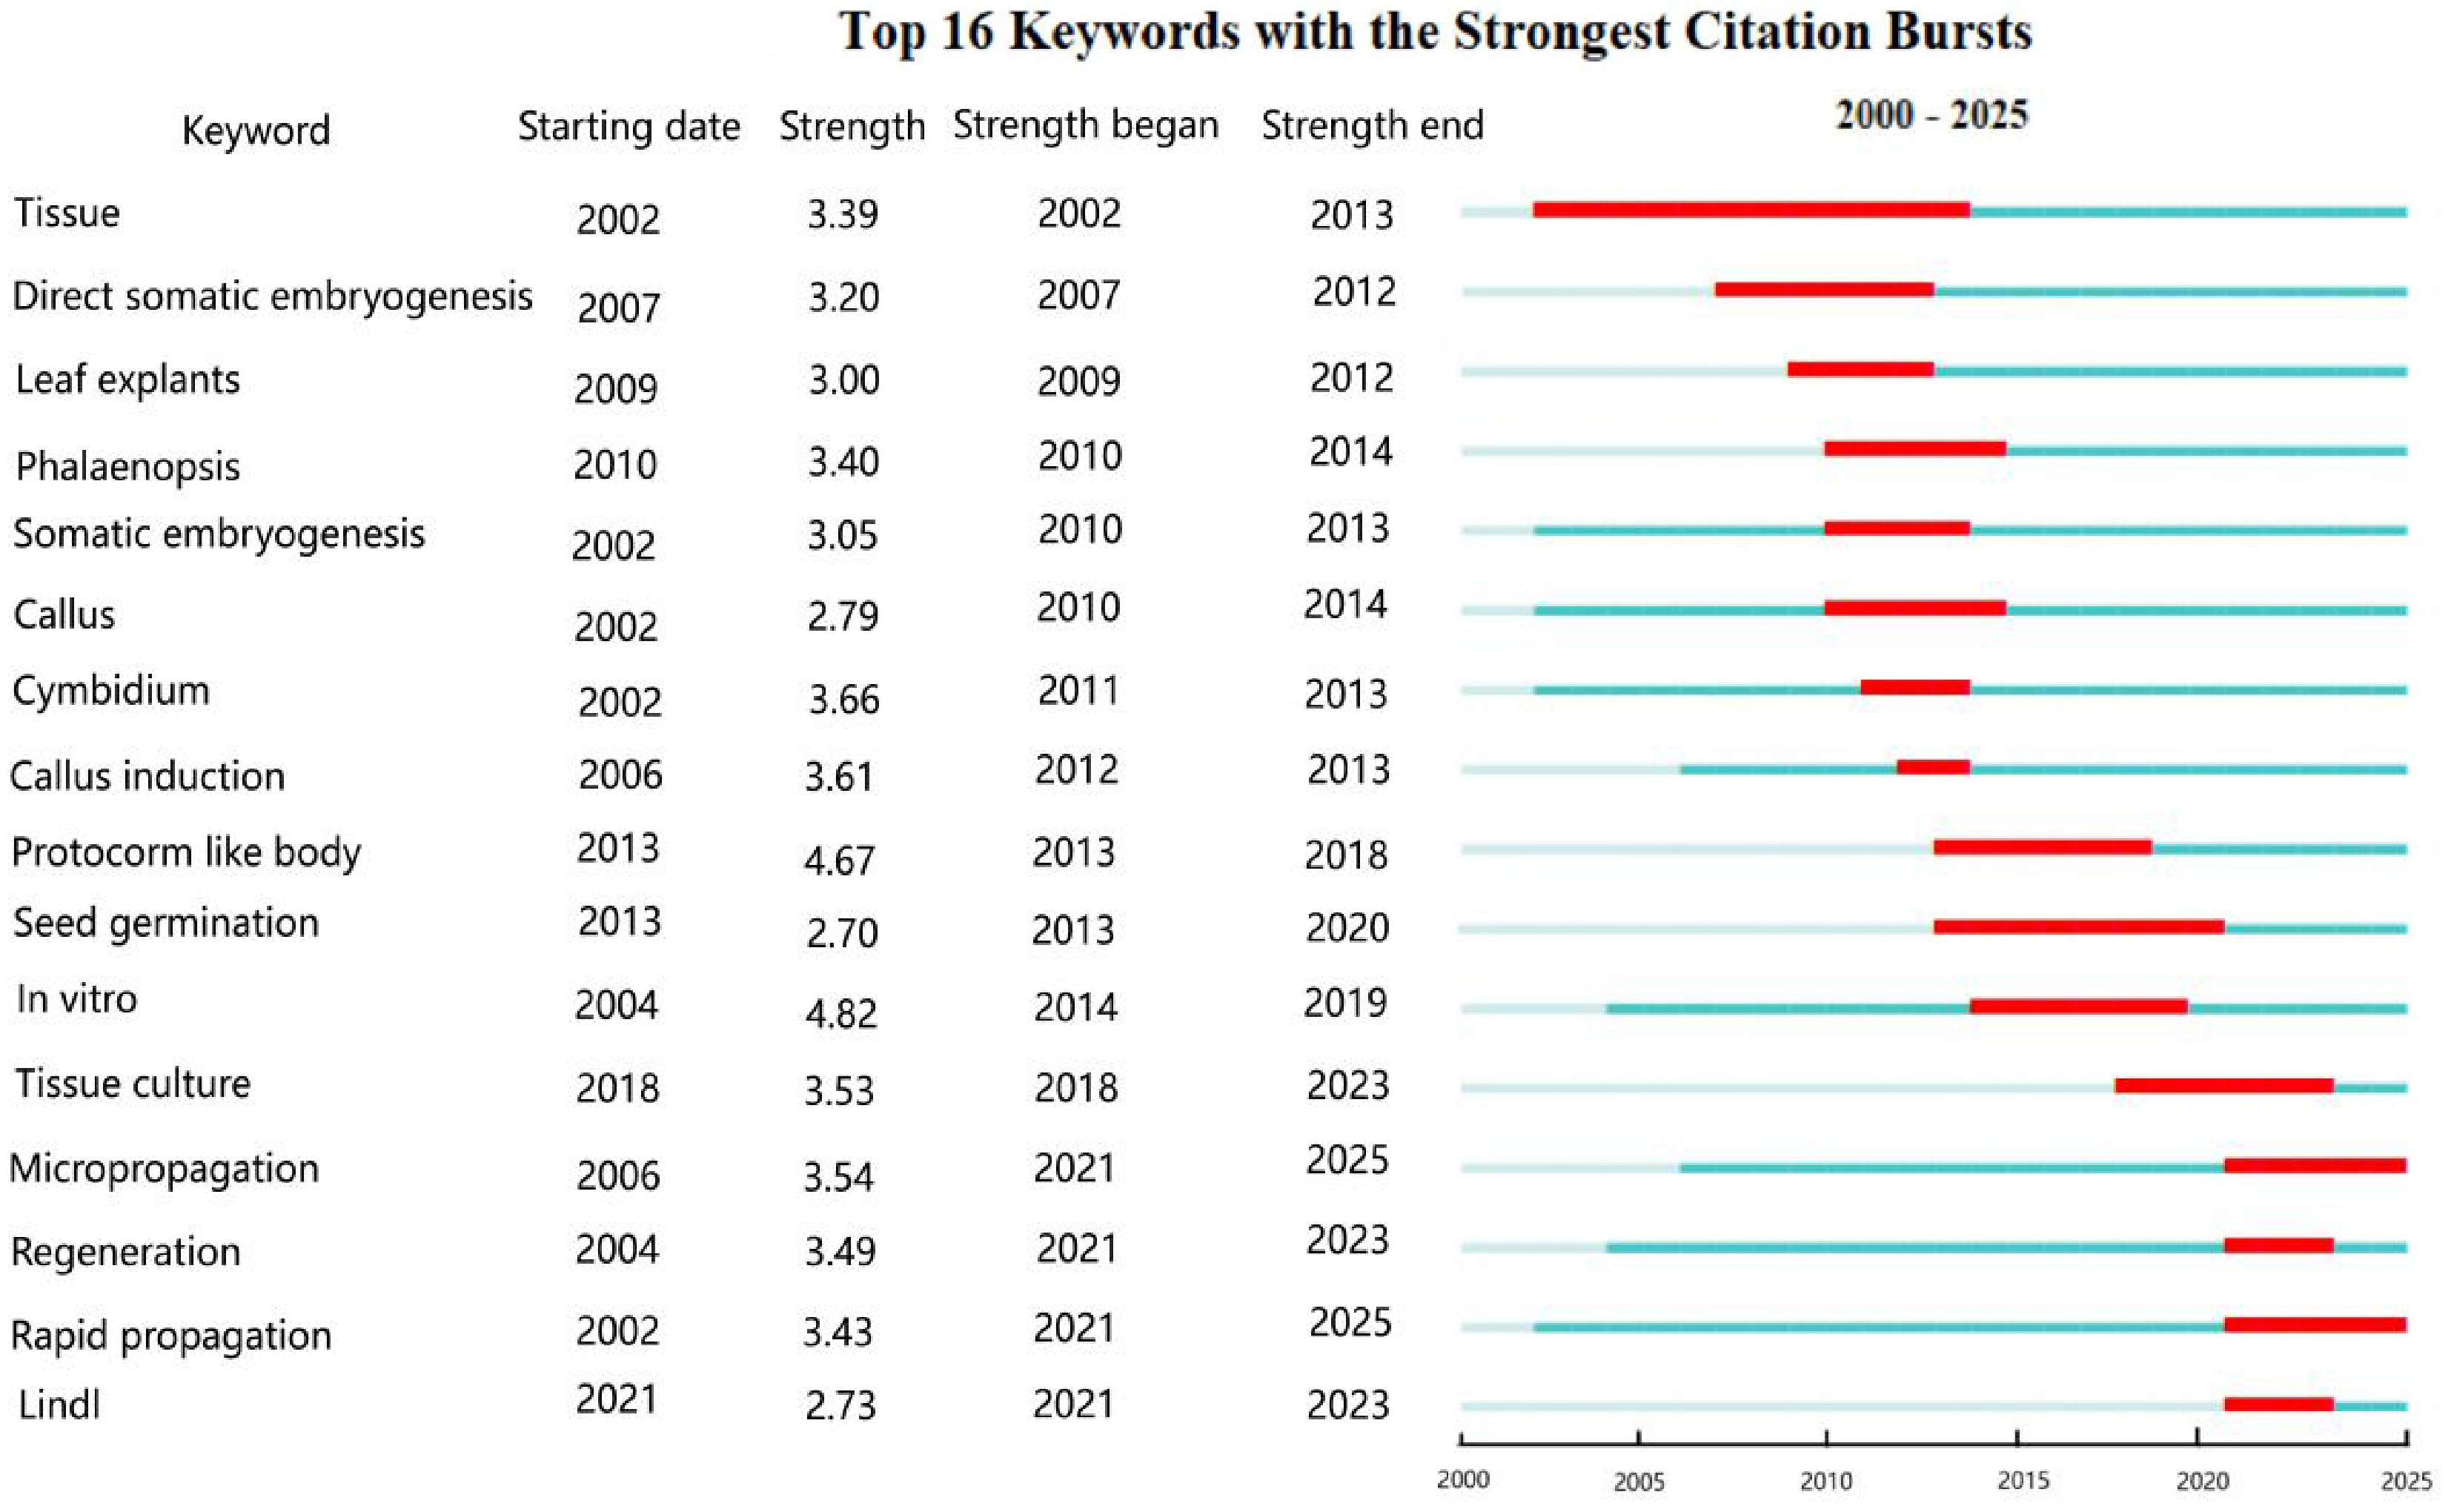
Figure 10.
Keyword burst detection map of WoS journals. A higher strength value correspond to greater magnitude of citation growth during the burst period (> 3.0 indicates strong bursts).
Figures
(10)
Tables
(0)