-
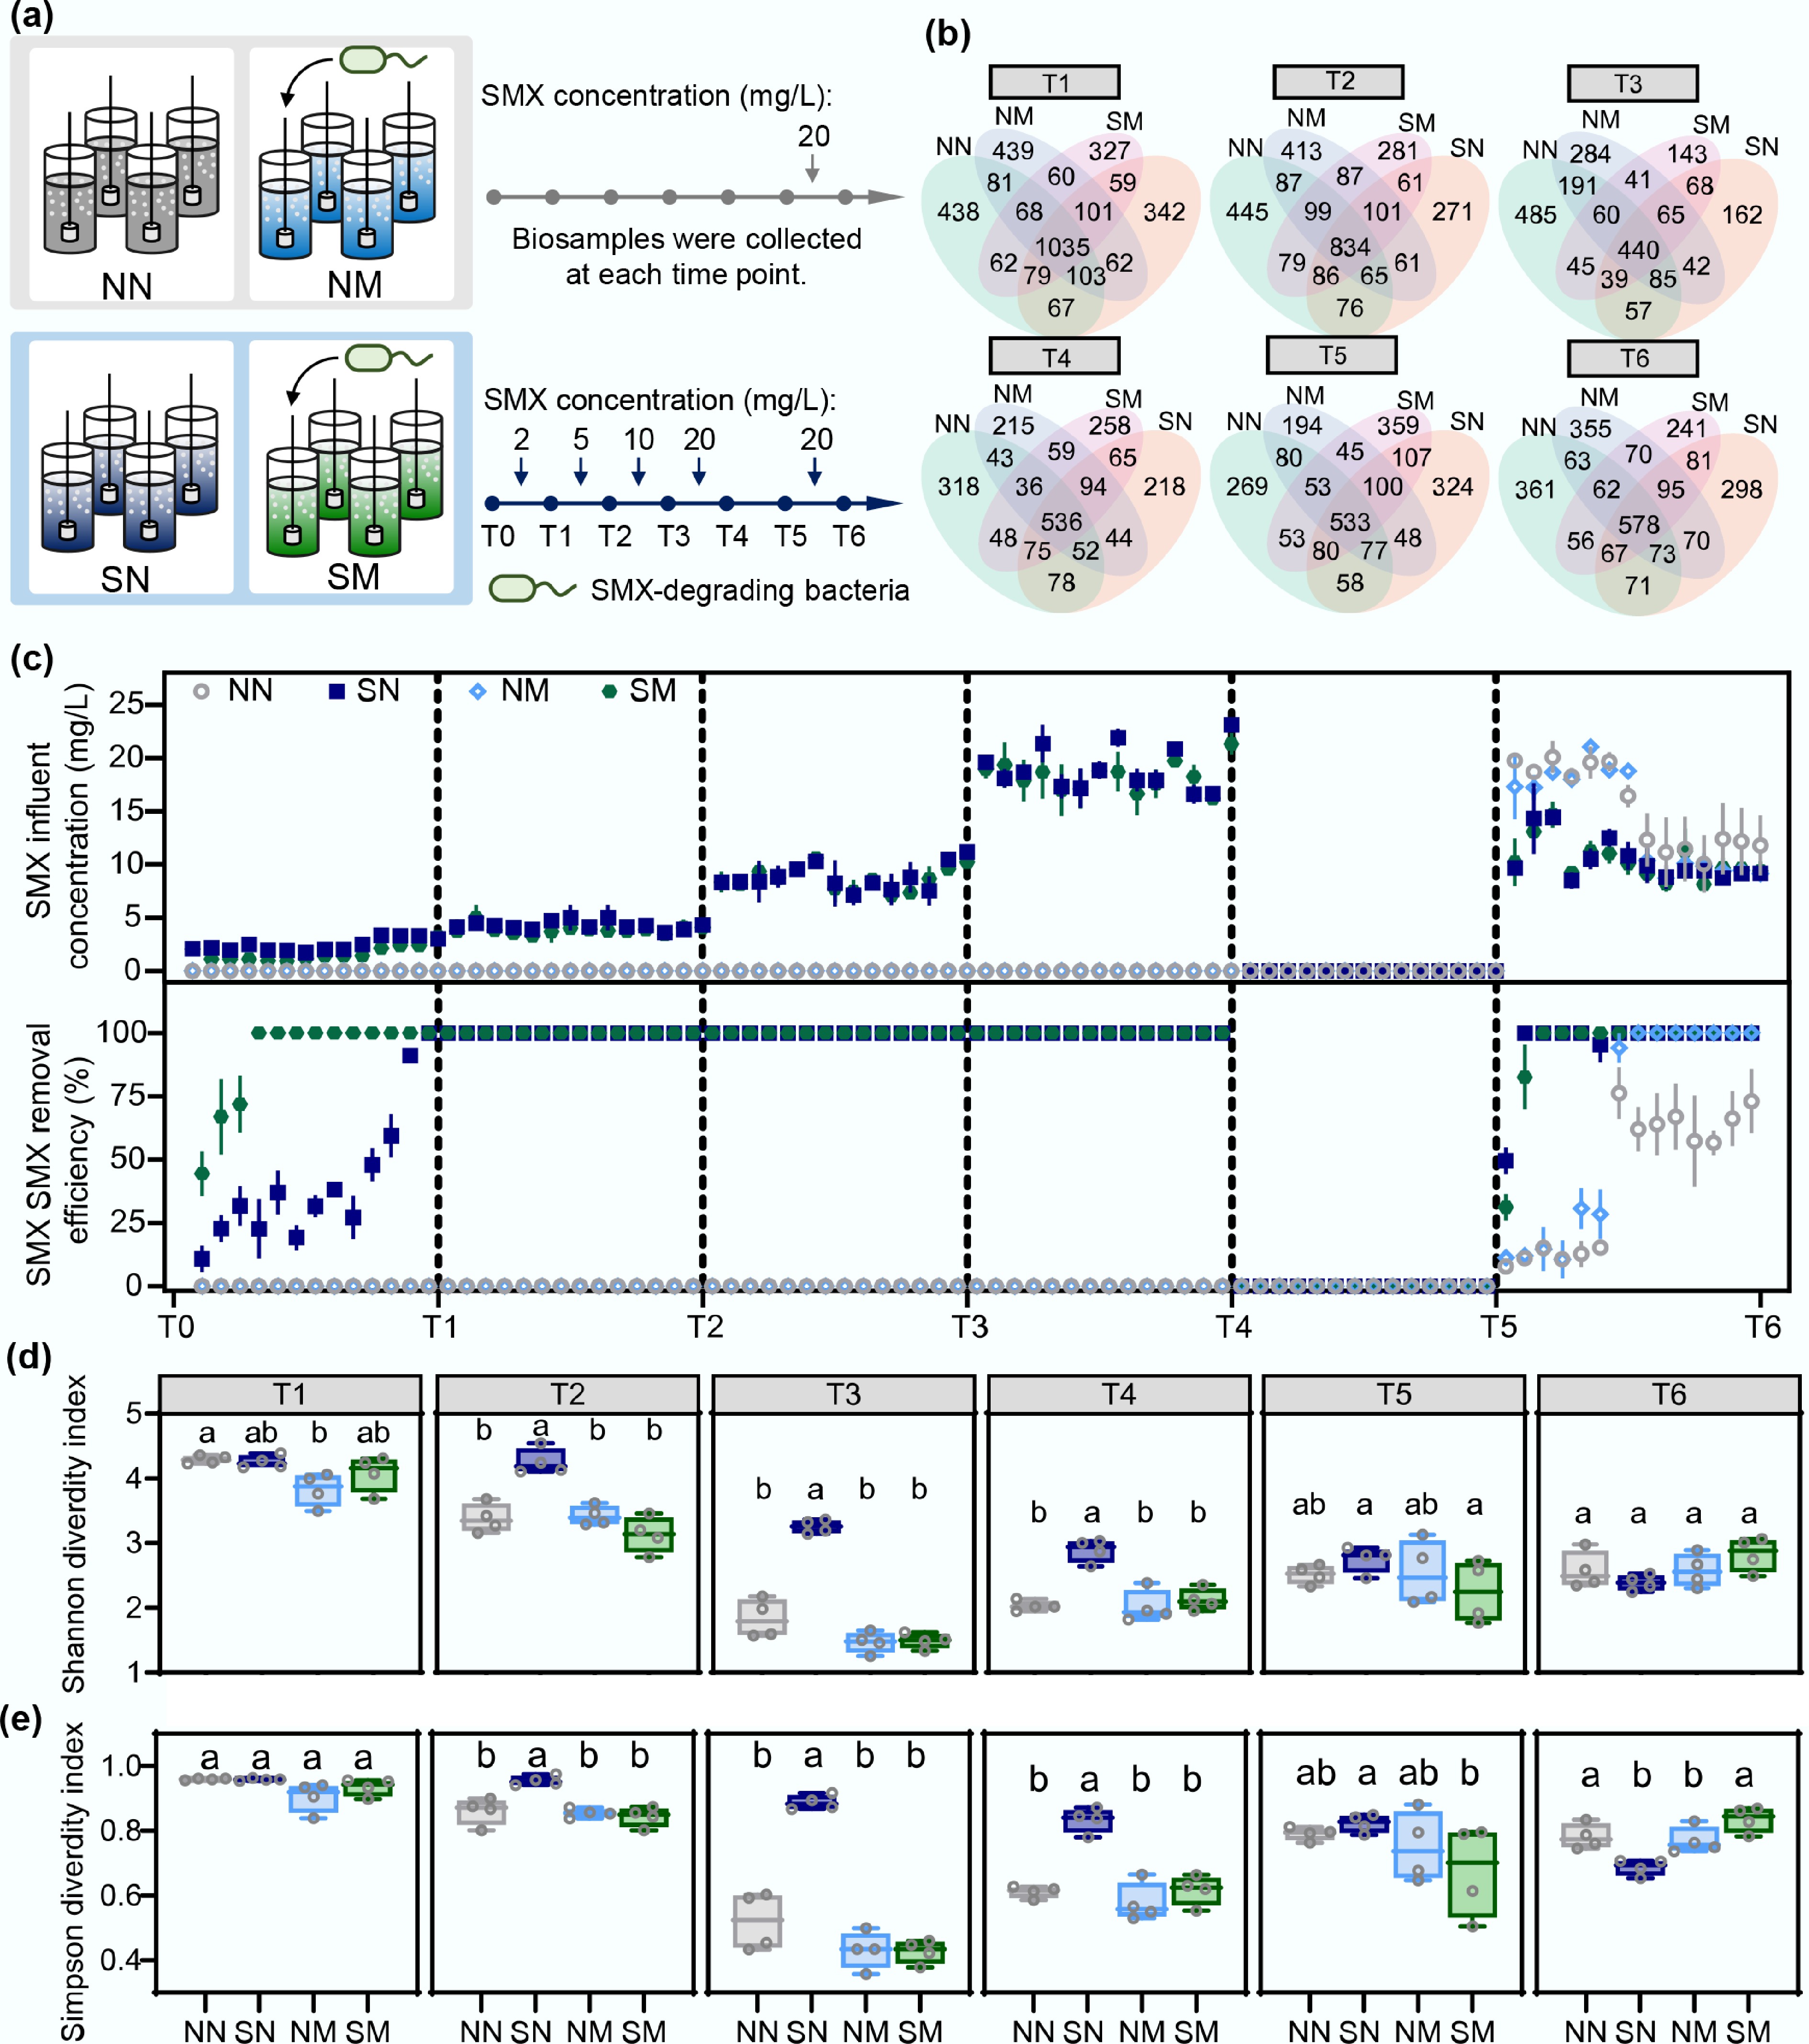
Figure 1.
SMX stress and degradation capacity jointly drive community α diversity change dynamics. (a) Experimental design: Two treatment strategies were established to compare community responses to SMX stress. Natural adaptation groups: no degrading bacteria added, observing autonomous evolution (NN: control without SMX; SN: SMX treatment); Pre-adaptation groups: degrading bacteria pre-inoculated, exploring effects of initial degradation capacity (NM: control without SMX; SM: SMX treatment). (b) Shared and unique OTU distribution among treatment groups. (c) SMX concentrations in influent and removal efficiencies during operation period. (d) Shannon and (e) Simpson diversity index variations and statistical differences between groups. Different letters indicate statistically significant differences (p < 0.05).
-

Figure 2.
Dynamic changes in species composition during different microbial community succession processes. (a) Temporal changes in relative abundance of microbial communities at genus level across different treatment groups. (b) Abundance changes of key degrader genera during SMX degradation. 'P-Unassigned' and 'M-Unassigned' represent unassigned genera within the families Micrococcaceae and Microbacteriaceae, respectively. (c) Importance analysis of key genera in microbial communities based on random forest algorithm.
-
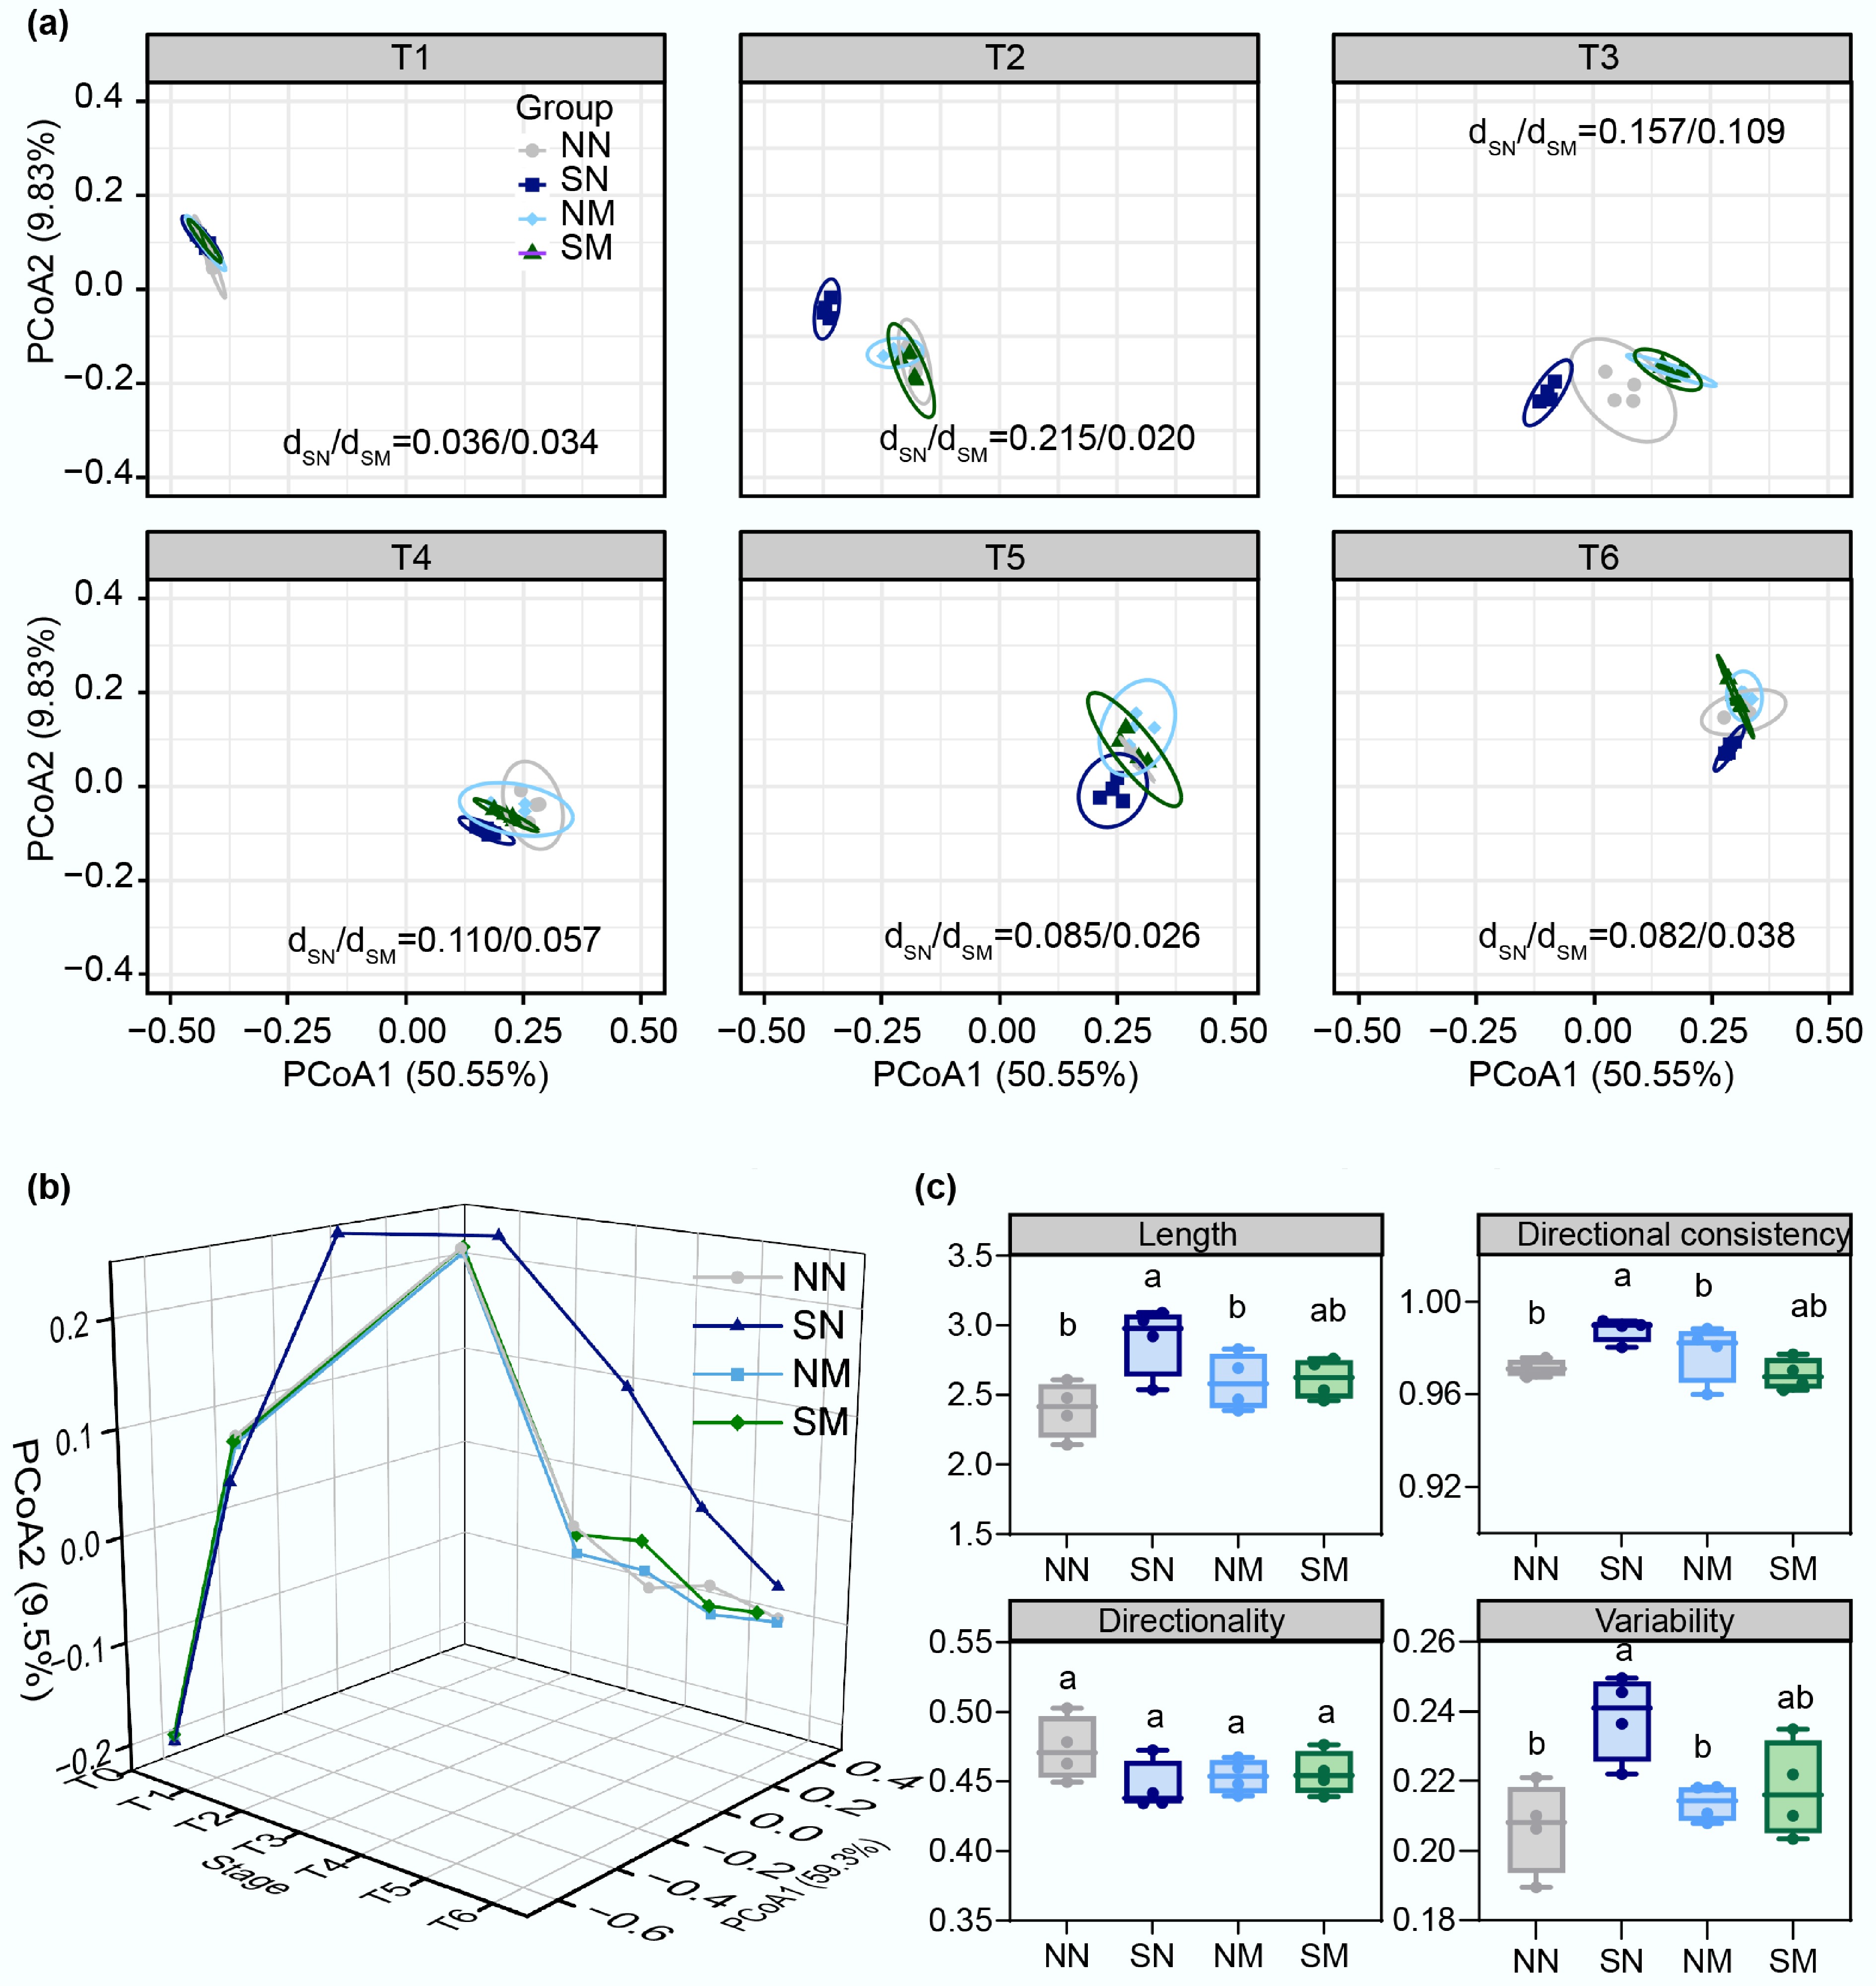
Figure 3.
Changes in structural composition and trajectory analysis during microbial community succession. (a) Temporal variation of microbial community structure across treatment groups (analyzed at OTU level using Bray-Curtis distance). Ellipses represent 95% confidence intervals, with dSN/dSM values indicating the ratio of distances between SN and SM group centroids relative to the control (NN) group centroid, quantifying their respective divergence from the control. (b) Community evolution trajectories, and (c) index analysis based on Bray-Curtis distance.
-
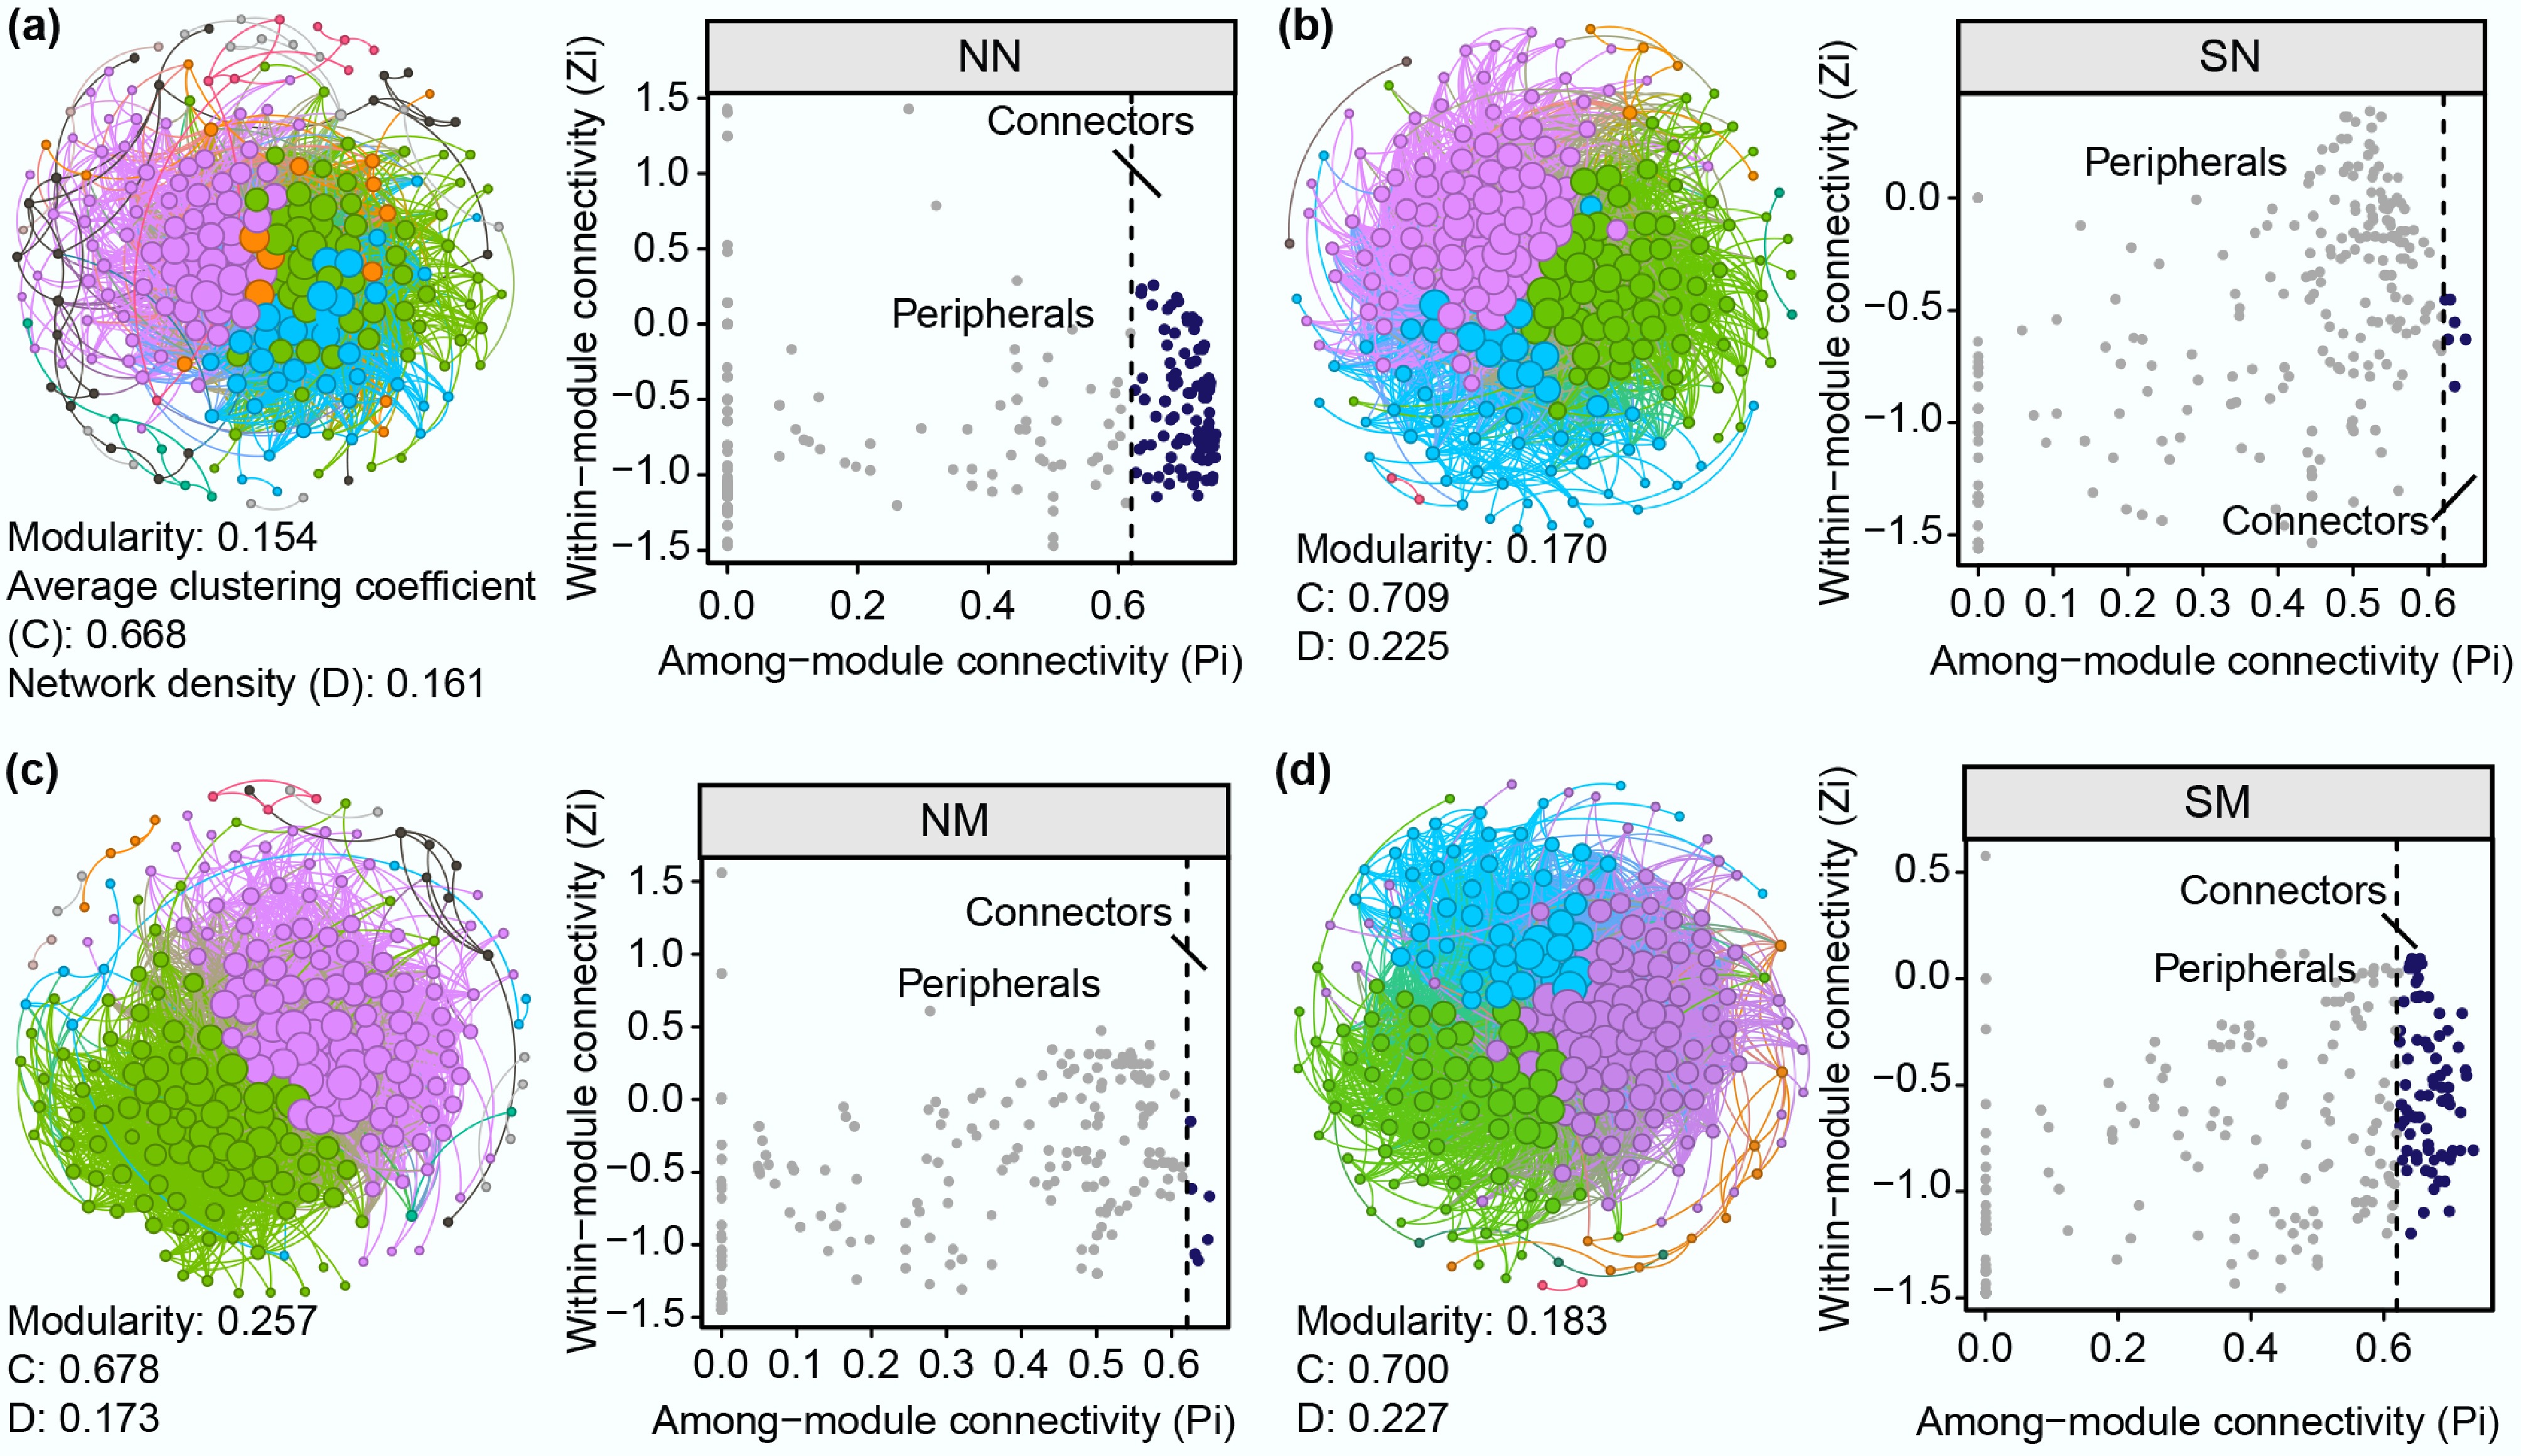
Figure 4.
Microbial community co-occurrence networks and distribution of topological roles of network nodes across different treatment groups during succession. (a) NN, (b) SN, (c) NM, (d) SM group. Spearman correlation among species with |r| > 0.8 and p < 0.001. Topological role analysis, based on within-module connectivity (Zi), and among-module connectivity (Pi) parameters, classified nodes as peripheral (Pi < 0.60), or connector (Pi ≥ 0.60) nodes.
-
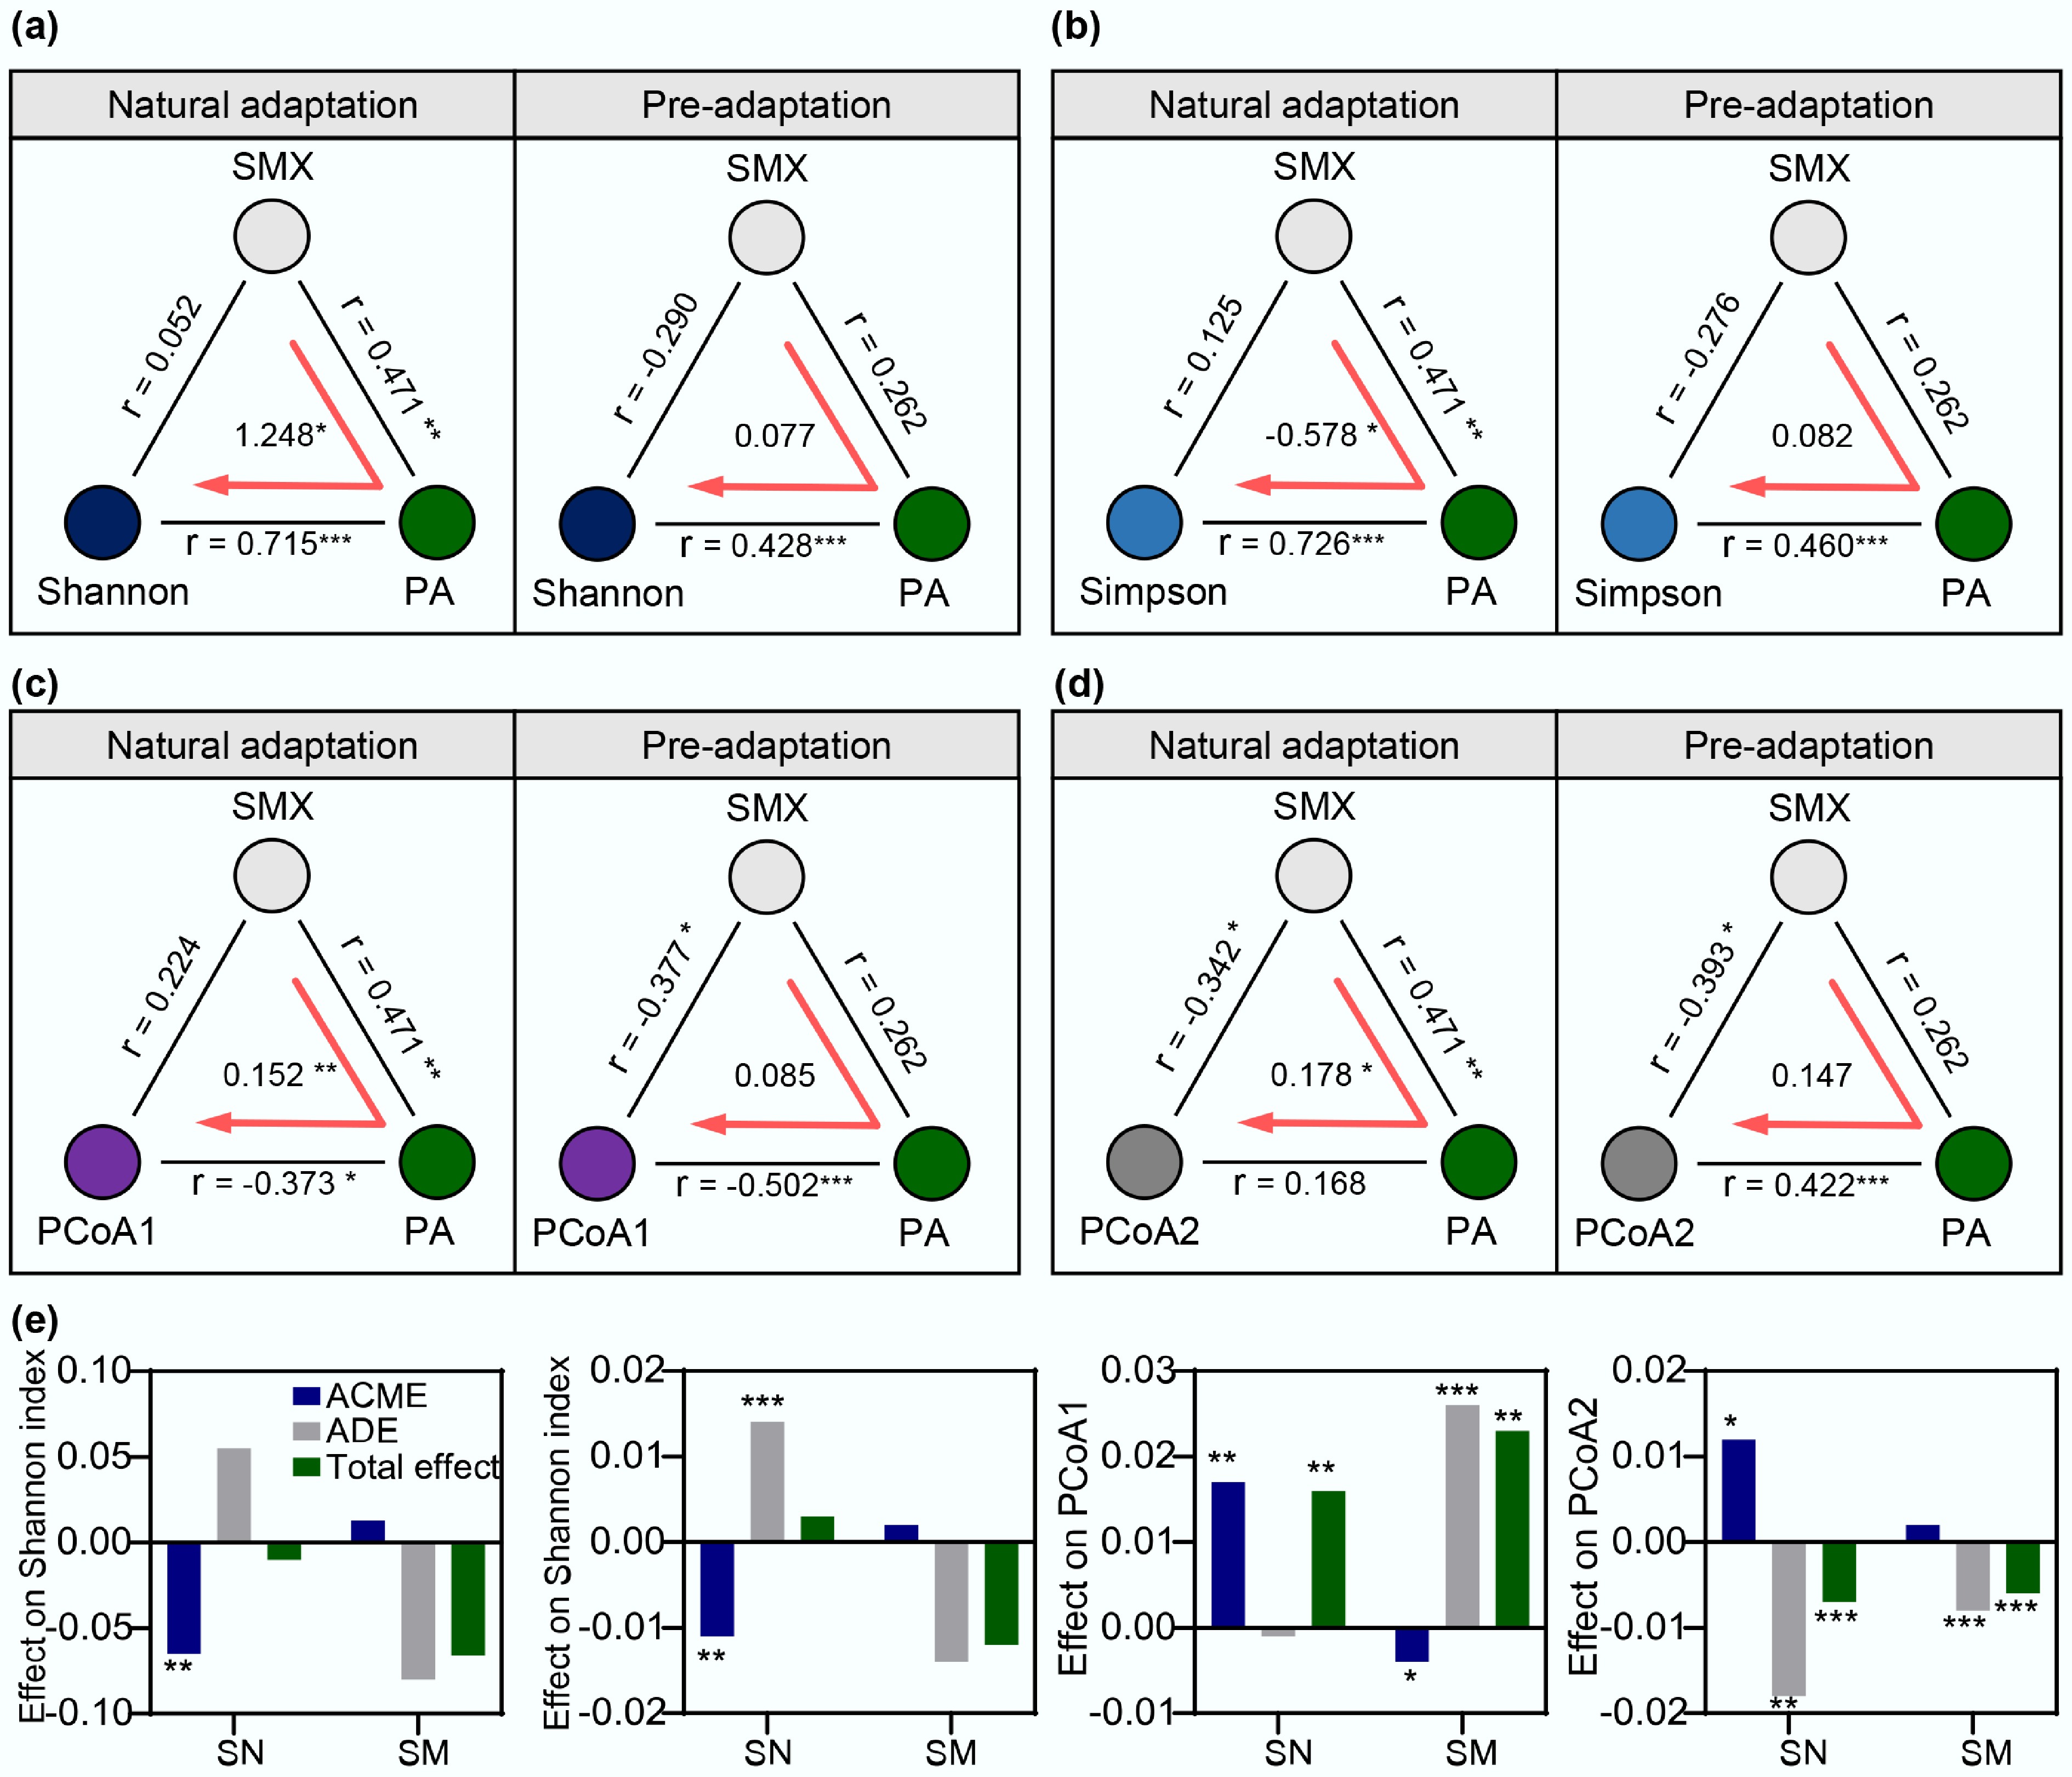
Figure 5.
Mediation effect analysis of degrading bacteria on SMX-induced changes in community structure under two evolutionary modes. Causal mediation effects of SMX concentration and degraders on (a) Shannon diversity index, (b) Simpson diversity index, (c) PCoA1, and (d) PCoA2. r represents the Spearman correlation coefficient. (e) Analysis of ACME, ADE, and total effect of SMX degrader Paenarthrobacter (PA) on each variable. Significance levels are indicated by asterisks: * p < 0.05, ** p < 0.01, and *** p < 0.001.
Figures
(5)
Tables
(0)