-
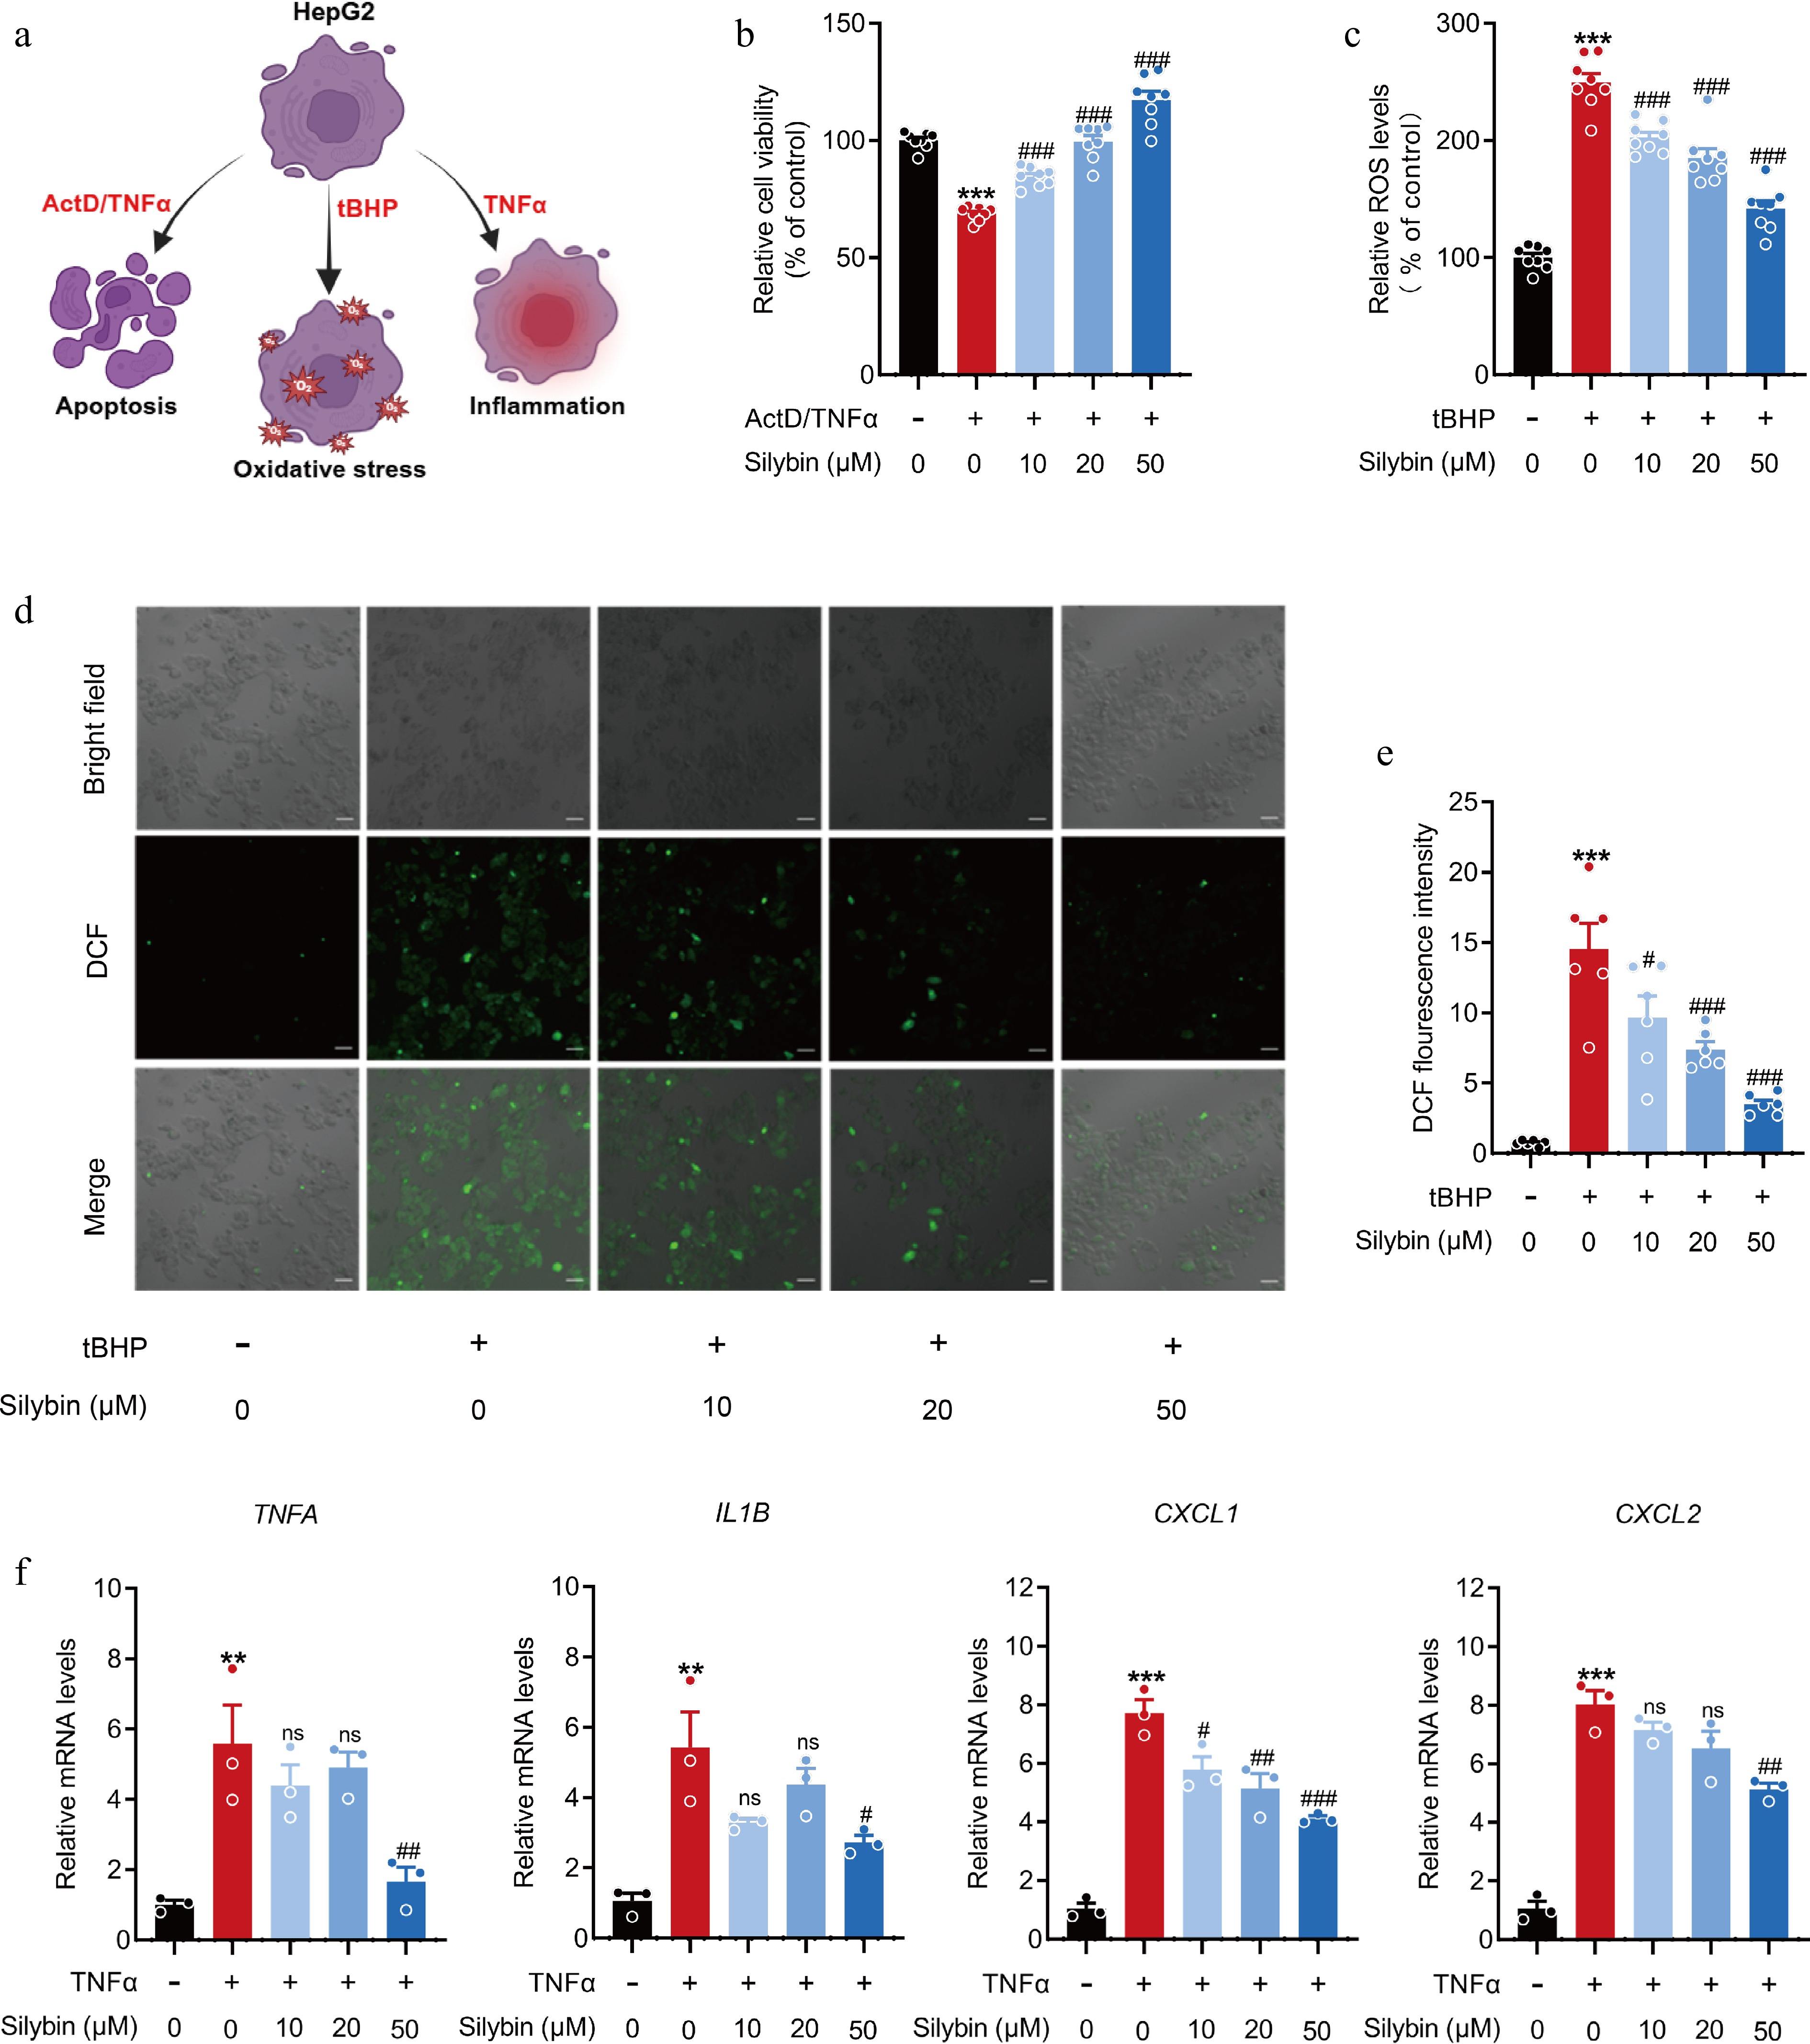
Figure 1.
Effects of silybin on hepatocellular apoptosis, inflammation, and oxidation. (a) Scheme on the characterization about the hepatoprotective effect of silybin. (b) Relative cell viability detected by MTT (n = 8). (c) Relative ROS levels (n = 8). (d), (e) Representative immunofluorescence images of ROS (d, scale bar, 50 μm) and average fluorescence intensity (e, n = 6). (f) Relative mRNA levels of TNFA, IL1B, CXCL1, CXCL2 in HepG2 cells (n = 3). Results are present as Mean ± SEM, ** p < 0.01, *** p < 0.001 vs control, and # p < 0.05, ## p < 0.01, ### p < 0.001, and ns, no significance, vs model, as assessed with ANOVA.
-
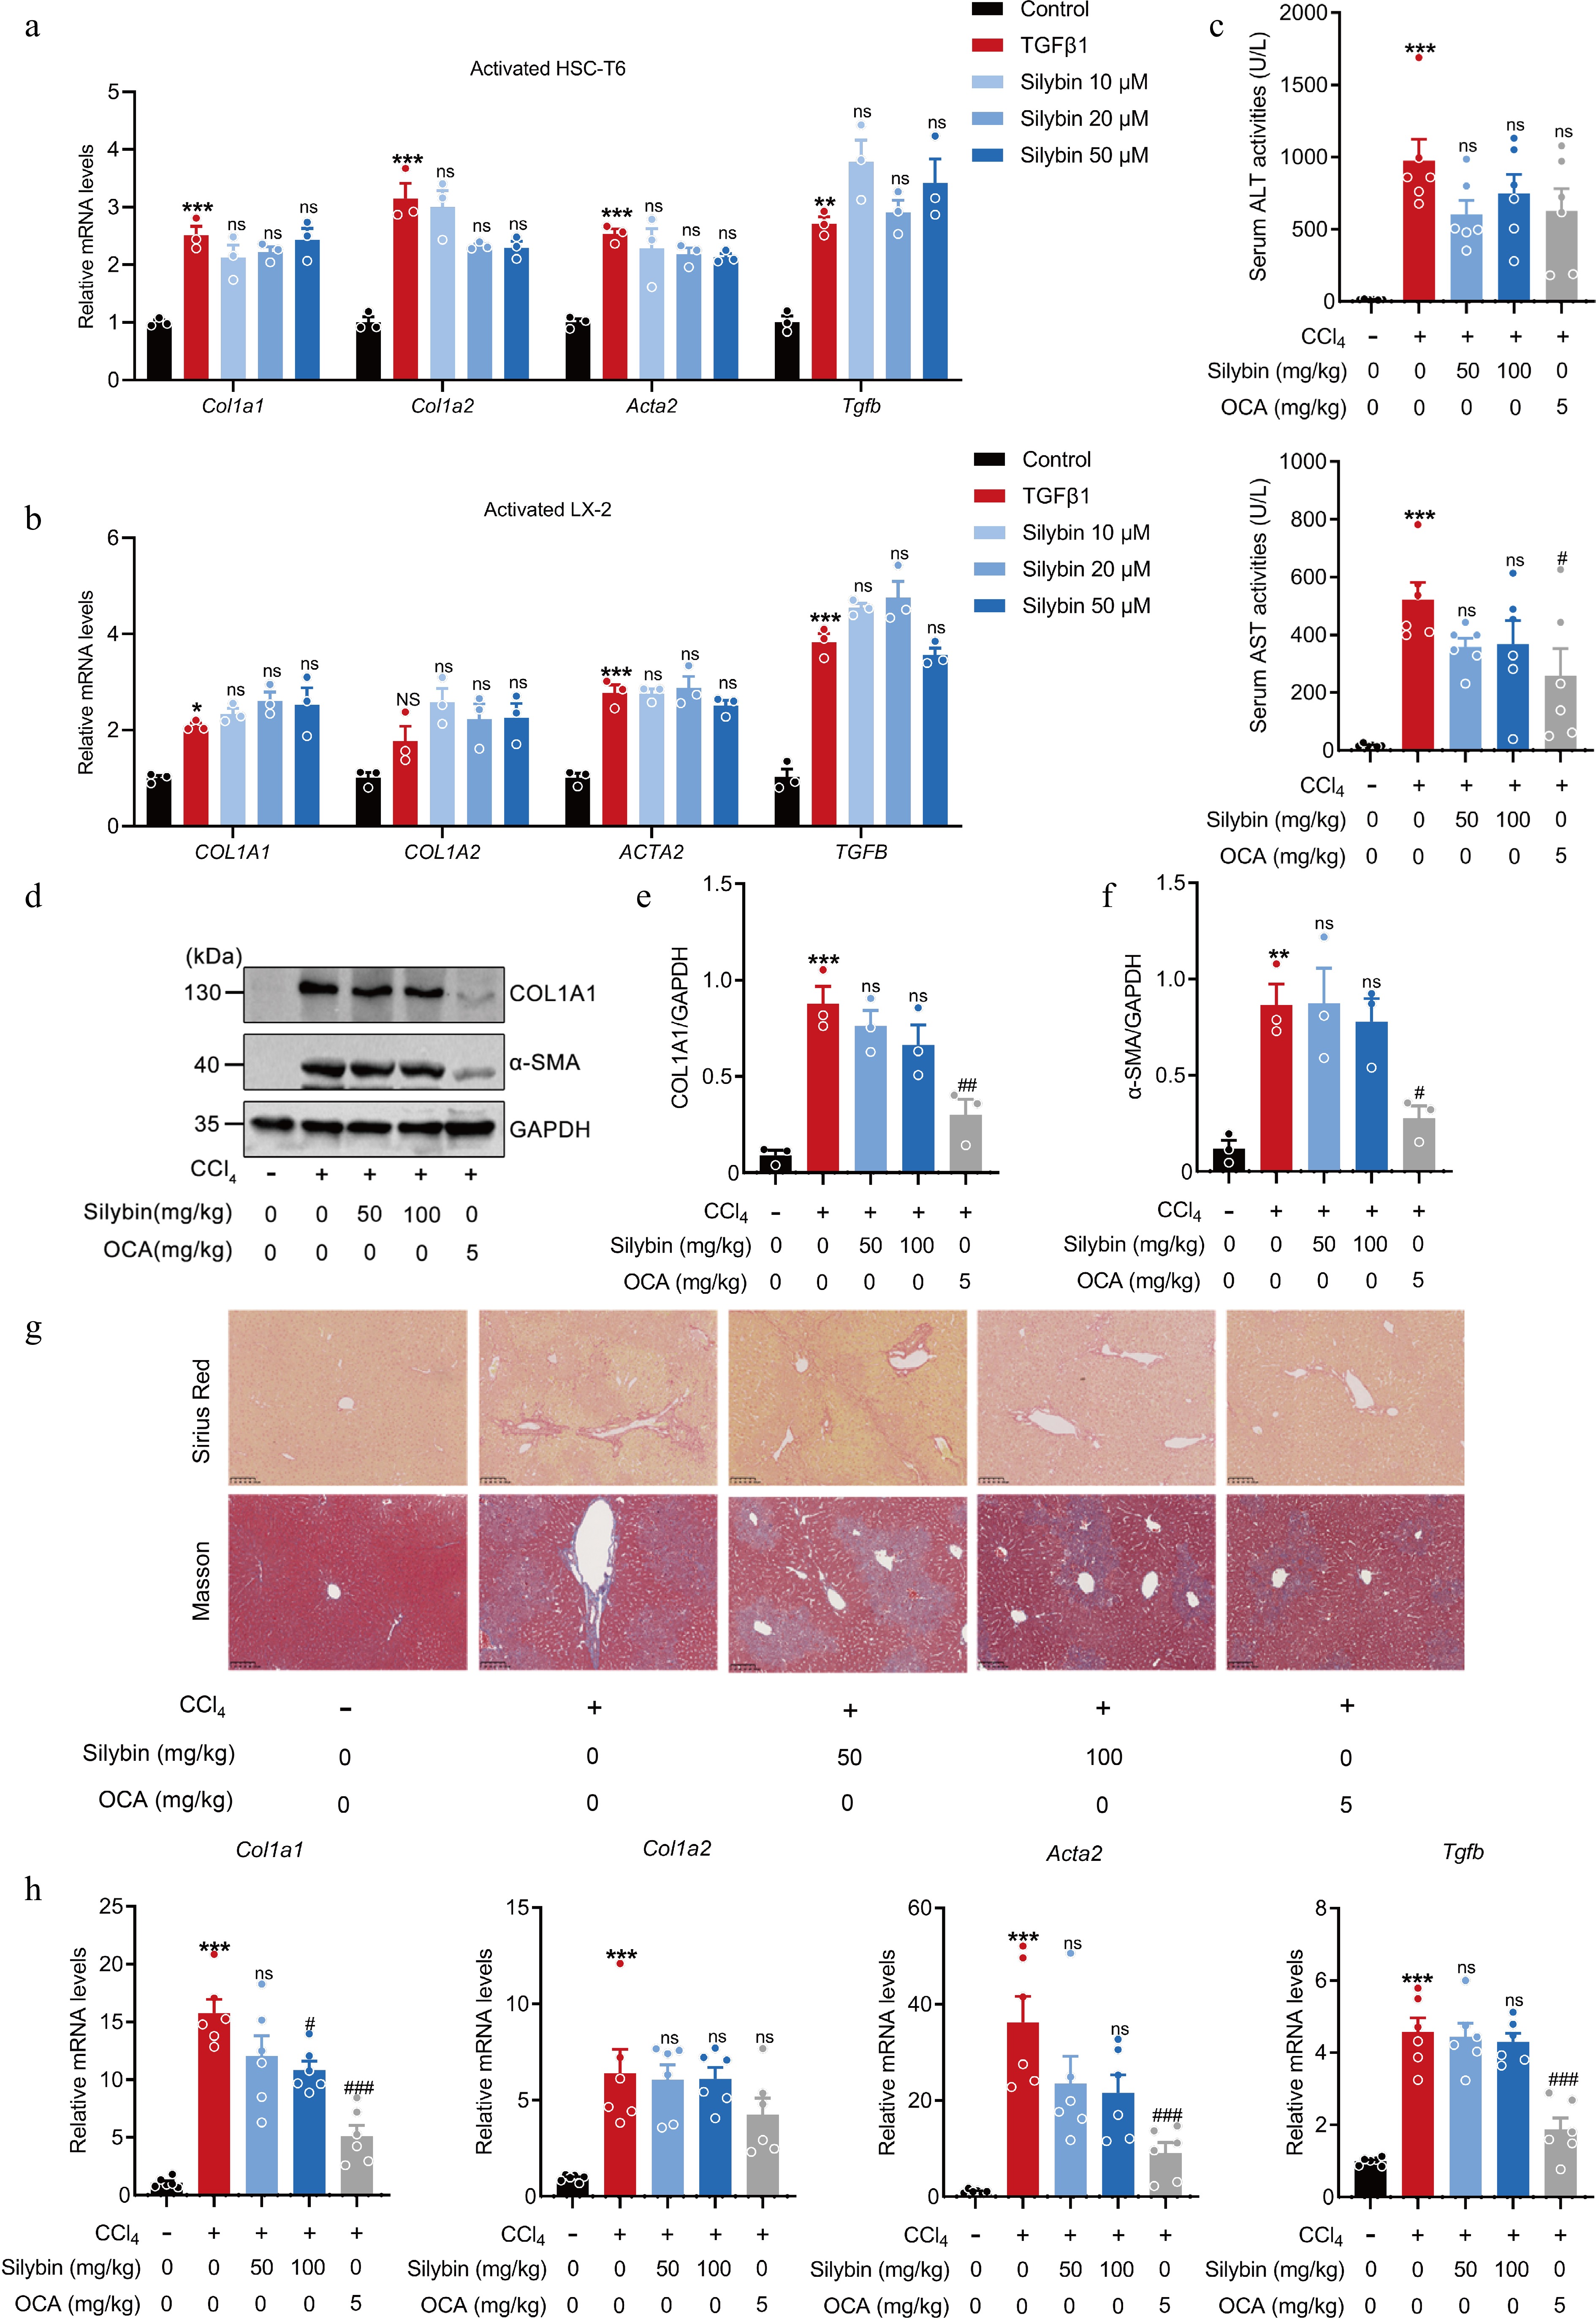
Figure 2.
Effect of silybin on HSC activation and hepatic collagen deposition. (a), (b) Relative mRNA expressions of COL1A1, COL1A2, ACTA2, and TGFB in HSC-T6 cells (a, n = 3), and LX2 cells (b, n = 3) treated with TGFβ1. (c) Serum ALT and AST levels (n = 6). (d) Representative Western blot images, and (e), (f) semi-quantification of COL1A1 and α-SMA proteins in liver tissues (n = 3). (g) Representative Sirius Red and Masson staining of liver tissues (n = 6, scale bar, 100 μm). (h) Relative mRNA levels of Col1a1, Col1a2, Acta2, and Tgfb in liver (n = 6). Results are present as Mean ± SEM, * p < 0.05, ** p < 0.01, *** p < 0.001 vs control, # p < 0.05, ## p < 0.01, ### p < 0.001, and ns, no significance, vs model, as assessed with ANOVA.
-
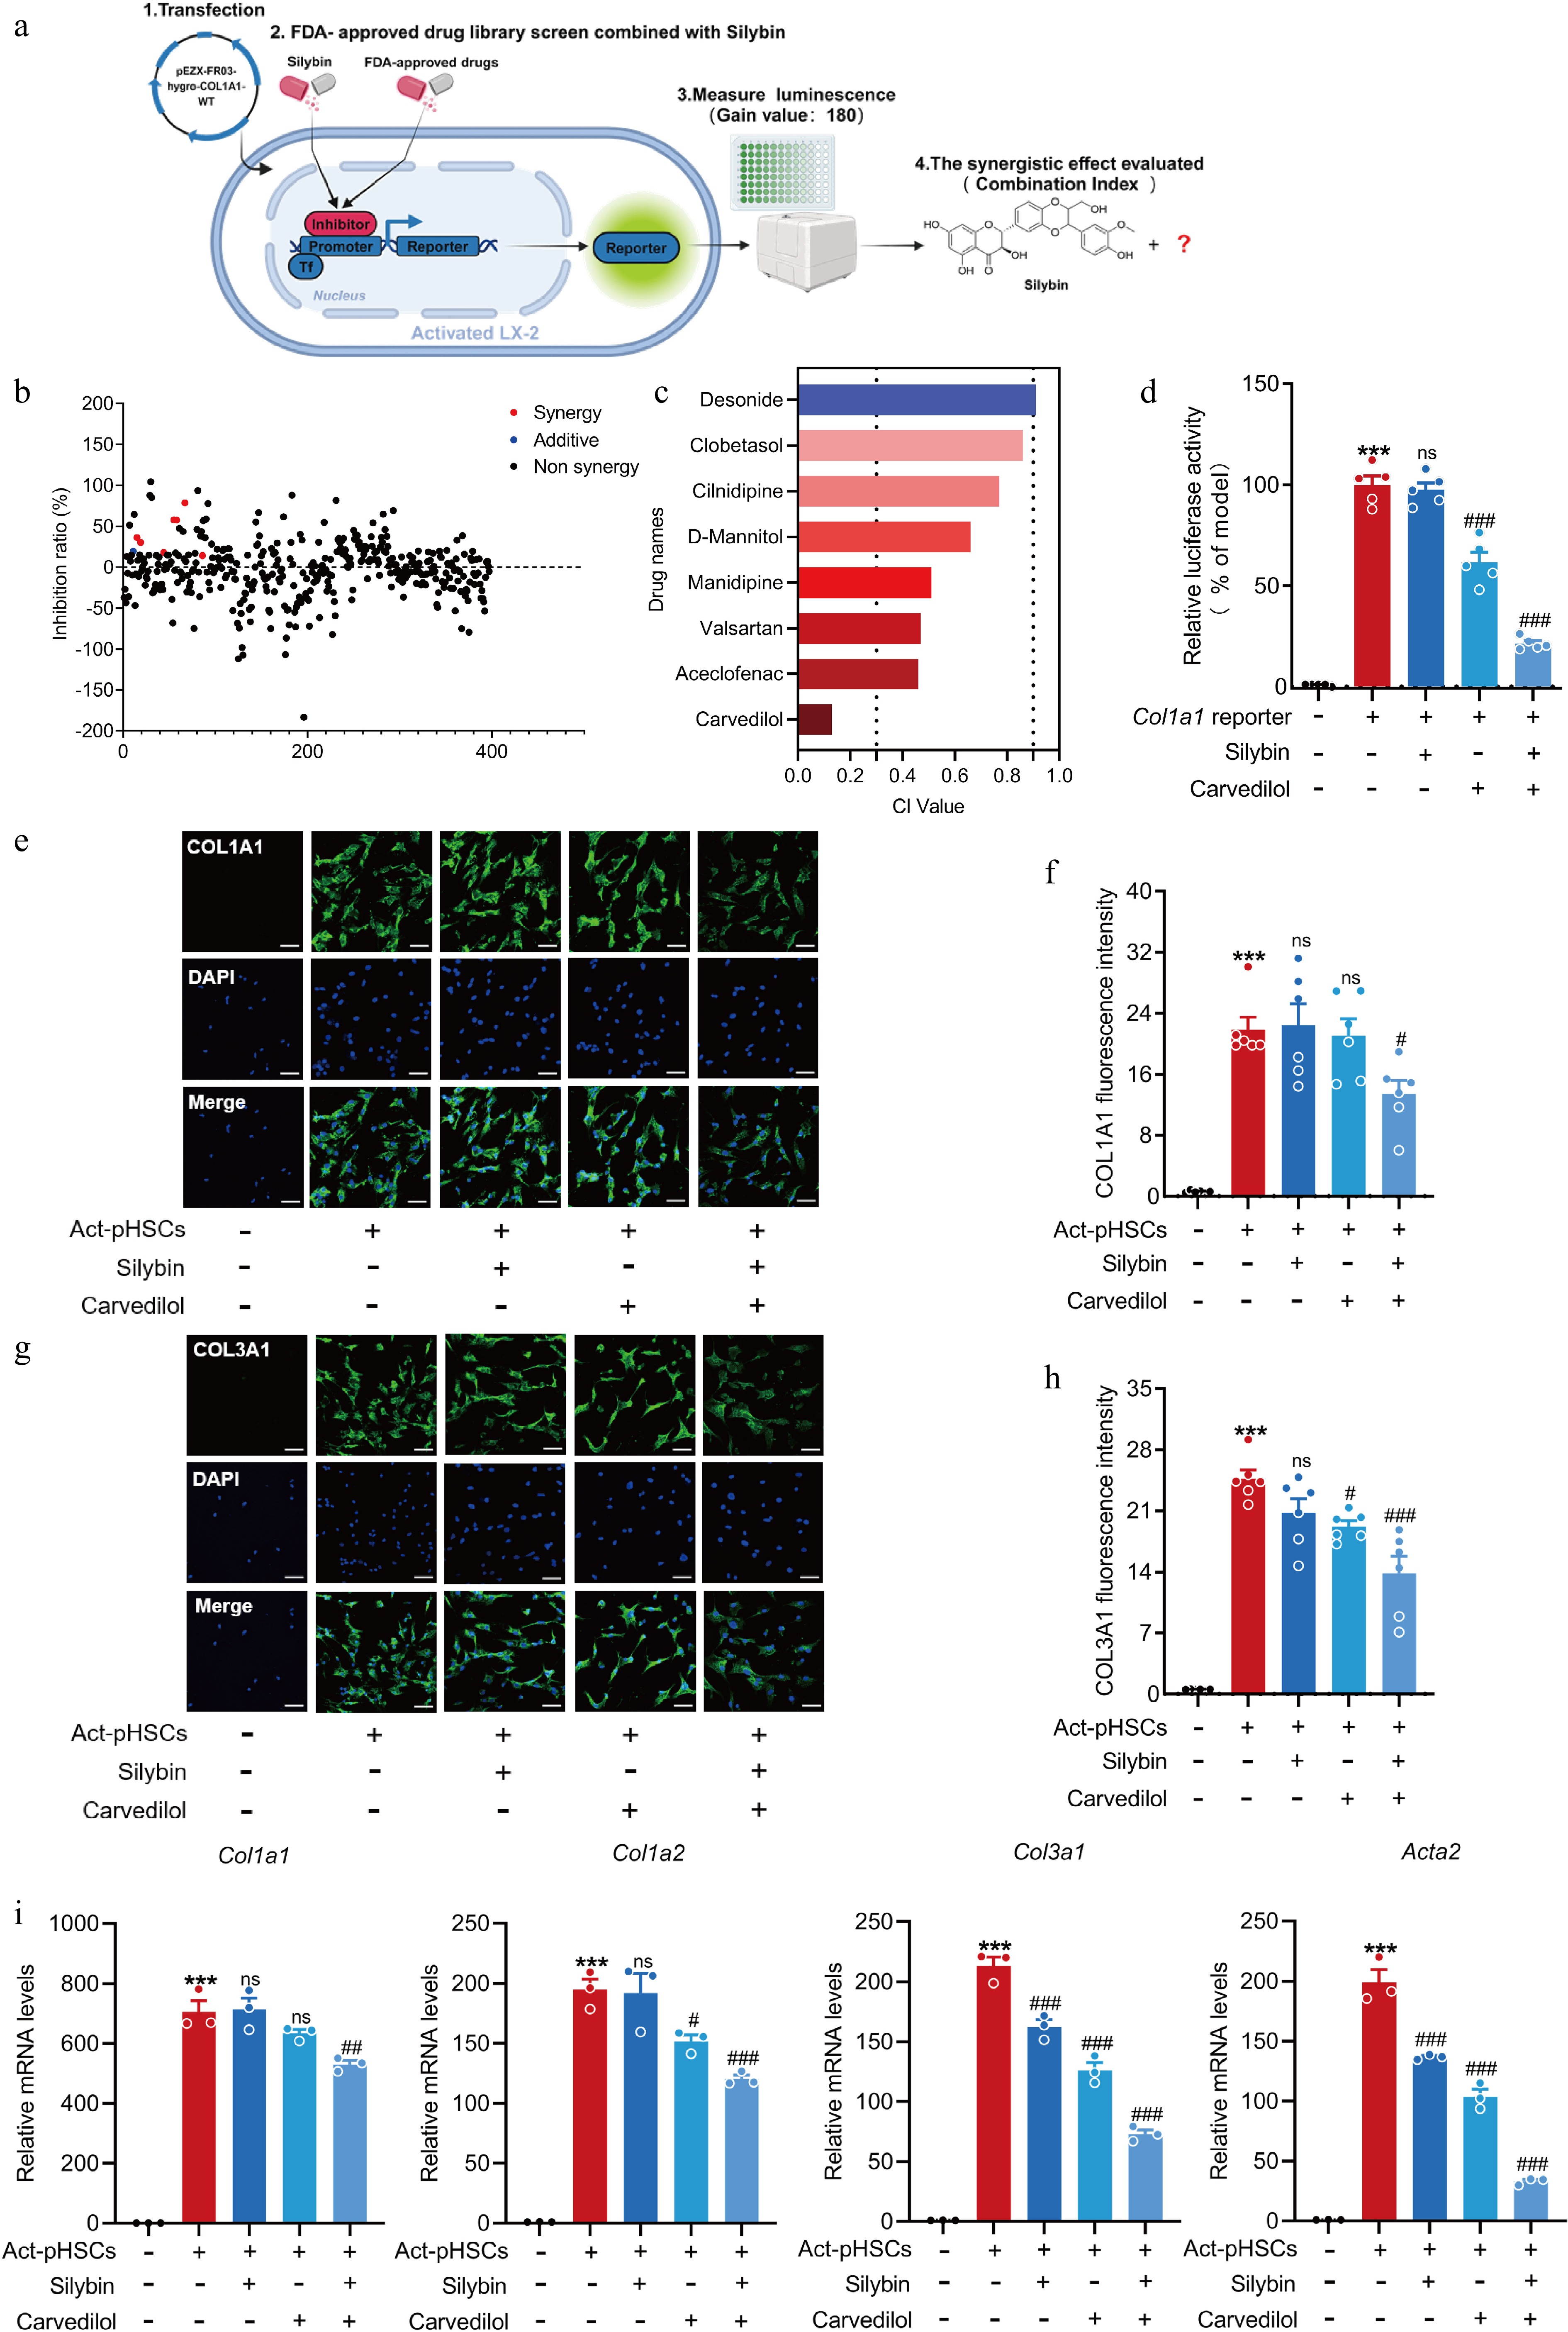
Figure 3.
Silybin and carvedilol synergistically inhibit HSC activation. (a) Scheme about the screening system of drug combinations based on COL1A1 luciferase reporter. (b) Inhibition ration of COL1A1 luciferase by combined silybin and FDA-approved drugs. Red dots represent synergistic drugs, blue dots represent additive drugs, black dots represent non-synergistic drugs. (c) CI values by representative drugs and silybin on COL1A1 luciferase activity. (d) Relative COL1A1 luciferase activity by carvedilol and silybin in LX-2 (n = 5). (e)−(h) Representative images of immunofluorescent staining and semi-quantitative analysis of COL1A1 (e), (f) and COL3A1 (g), (h) in pHSCs (n = 6, scale bar, 50 μm). (i) Relative mRNA levels of Col1a1, Col1a2, Col3a1, Acta2 in pHSCs (n = 3). Results are present as Mean ± SEM, *** p < 0.001 vs control, # p < 0.05, ## p < 0.01, ### p < 0.001, and ns, no significance, vs model, as assessed with ANOVA.
-
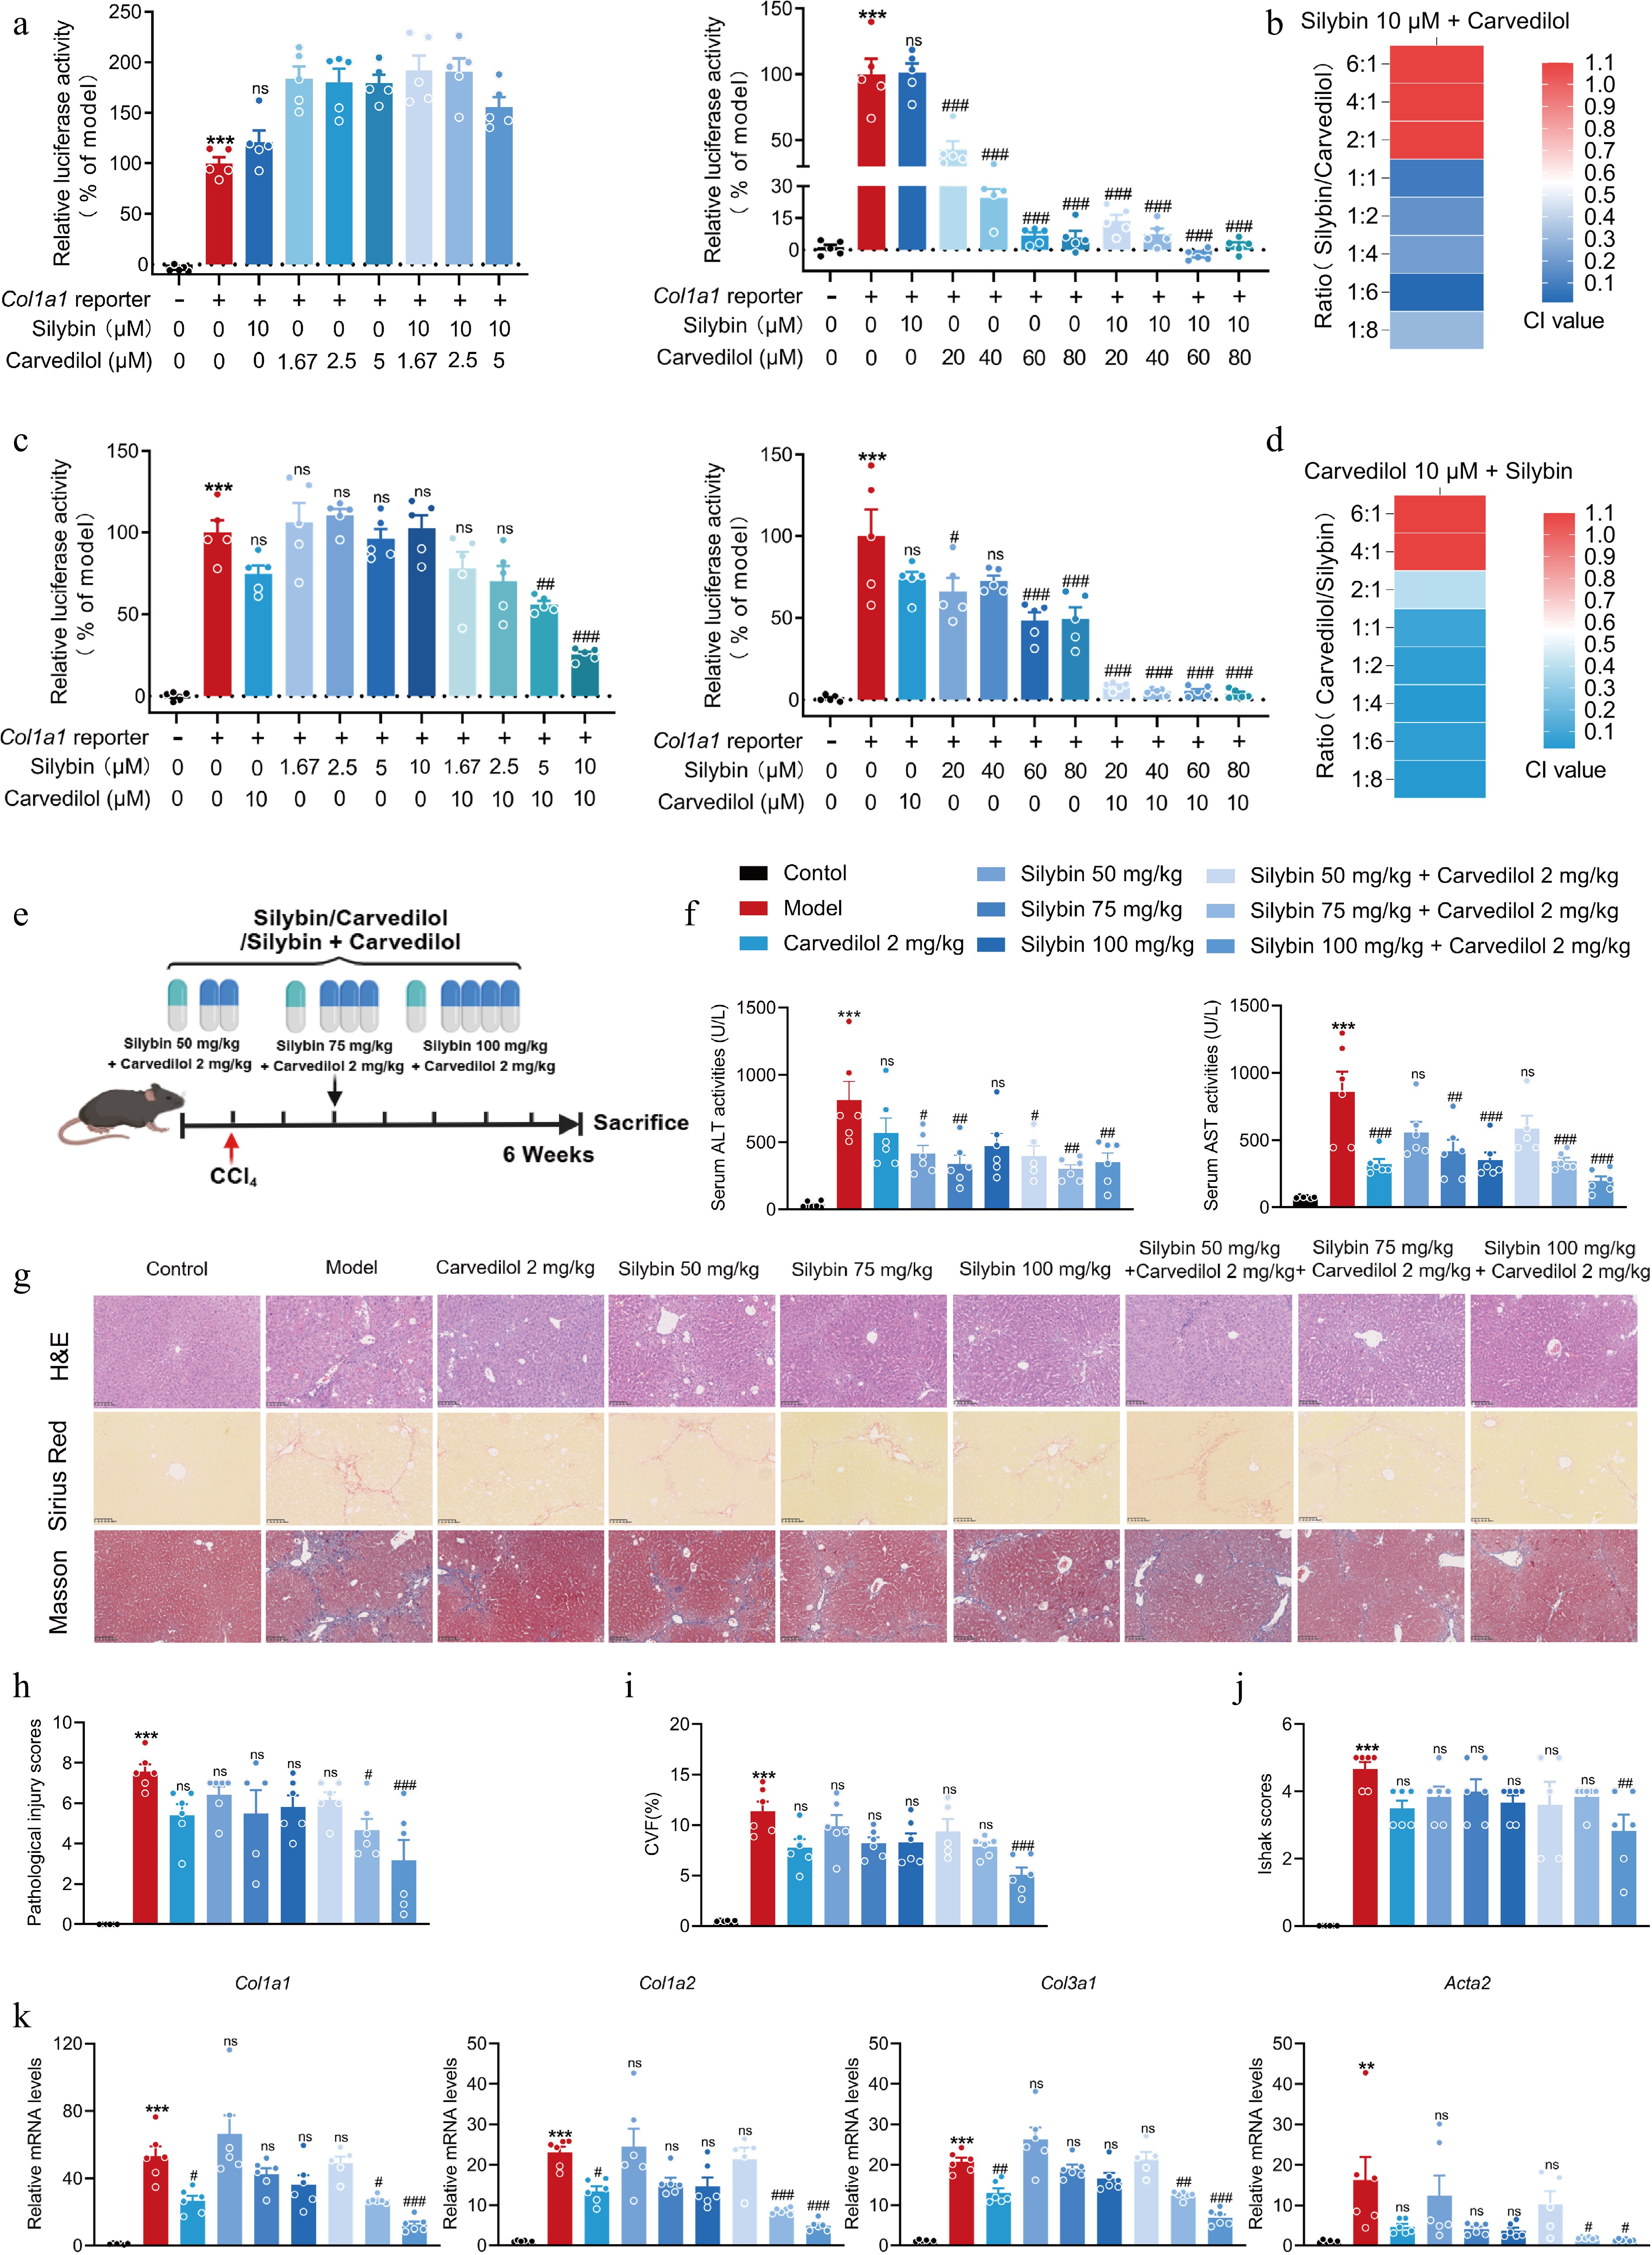
Figure 4.
Evaluation on the dosage ratio between silybin and carvedilol to significantly synergistically inhibit HSC activation and fibrosis development. (a) Relative COL1A1 reporter luciferase activities, and (b) the CI values by combined silybin (10 μM) and carvedilol (1.67−80 μM) (n = 5). (c) Relative COL1A1 reporter luciferase activities, and (d) the CI values by combined carvedilol (10 μM) and silybin (1.67−80 μM) (n = 5). (e) Mouse experiment procedure scheme. (f) Serum ALT and AST levels (n = 6). (g) Representative images of H&E, Sirius Red, and Masson staining of liver sections (n = 6, scale bar, 100 μm). (h) Pathological injury scores on H&E staining of liver sections (n = 6). Liver fibrosis analysis by (i) CVF, and (j) Ishak scores of the Masson staining of liver sections (n = 6). (k) mRNA levels of fibrotic genes (n = 6). Results are present as Mean ± SEM, ** p < 0.01, *** p < 0.001 vs control, # p < 0.05, ##p < 0.01,### p < 0.001, and ns, no significance, vs model, as assessed with ANOVA.
-
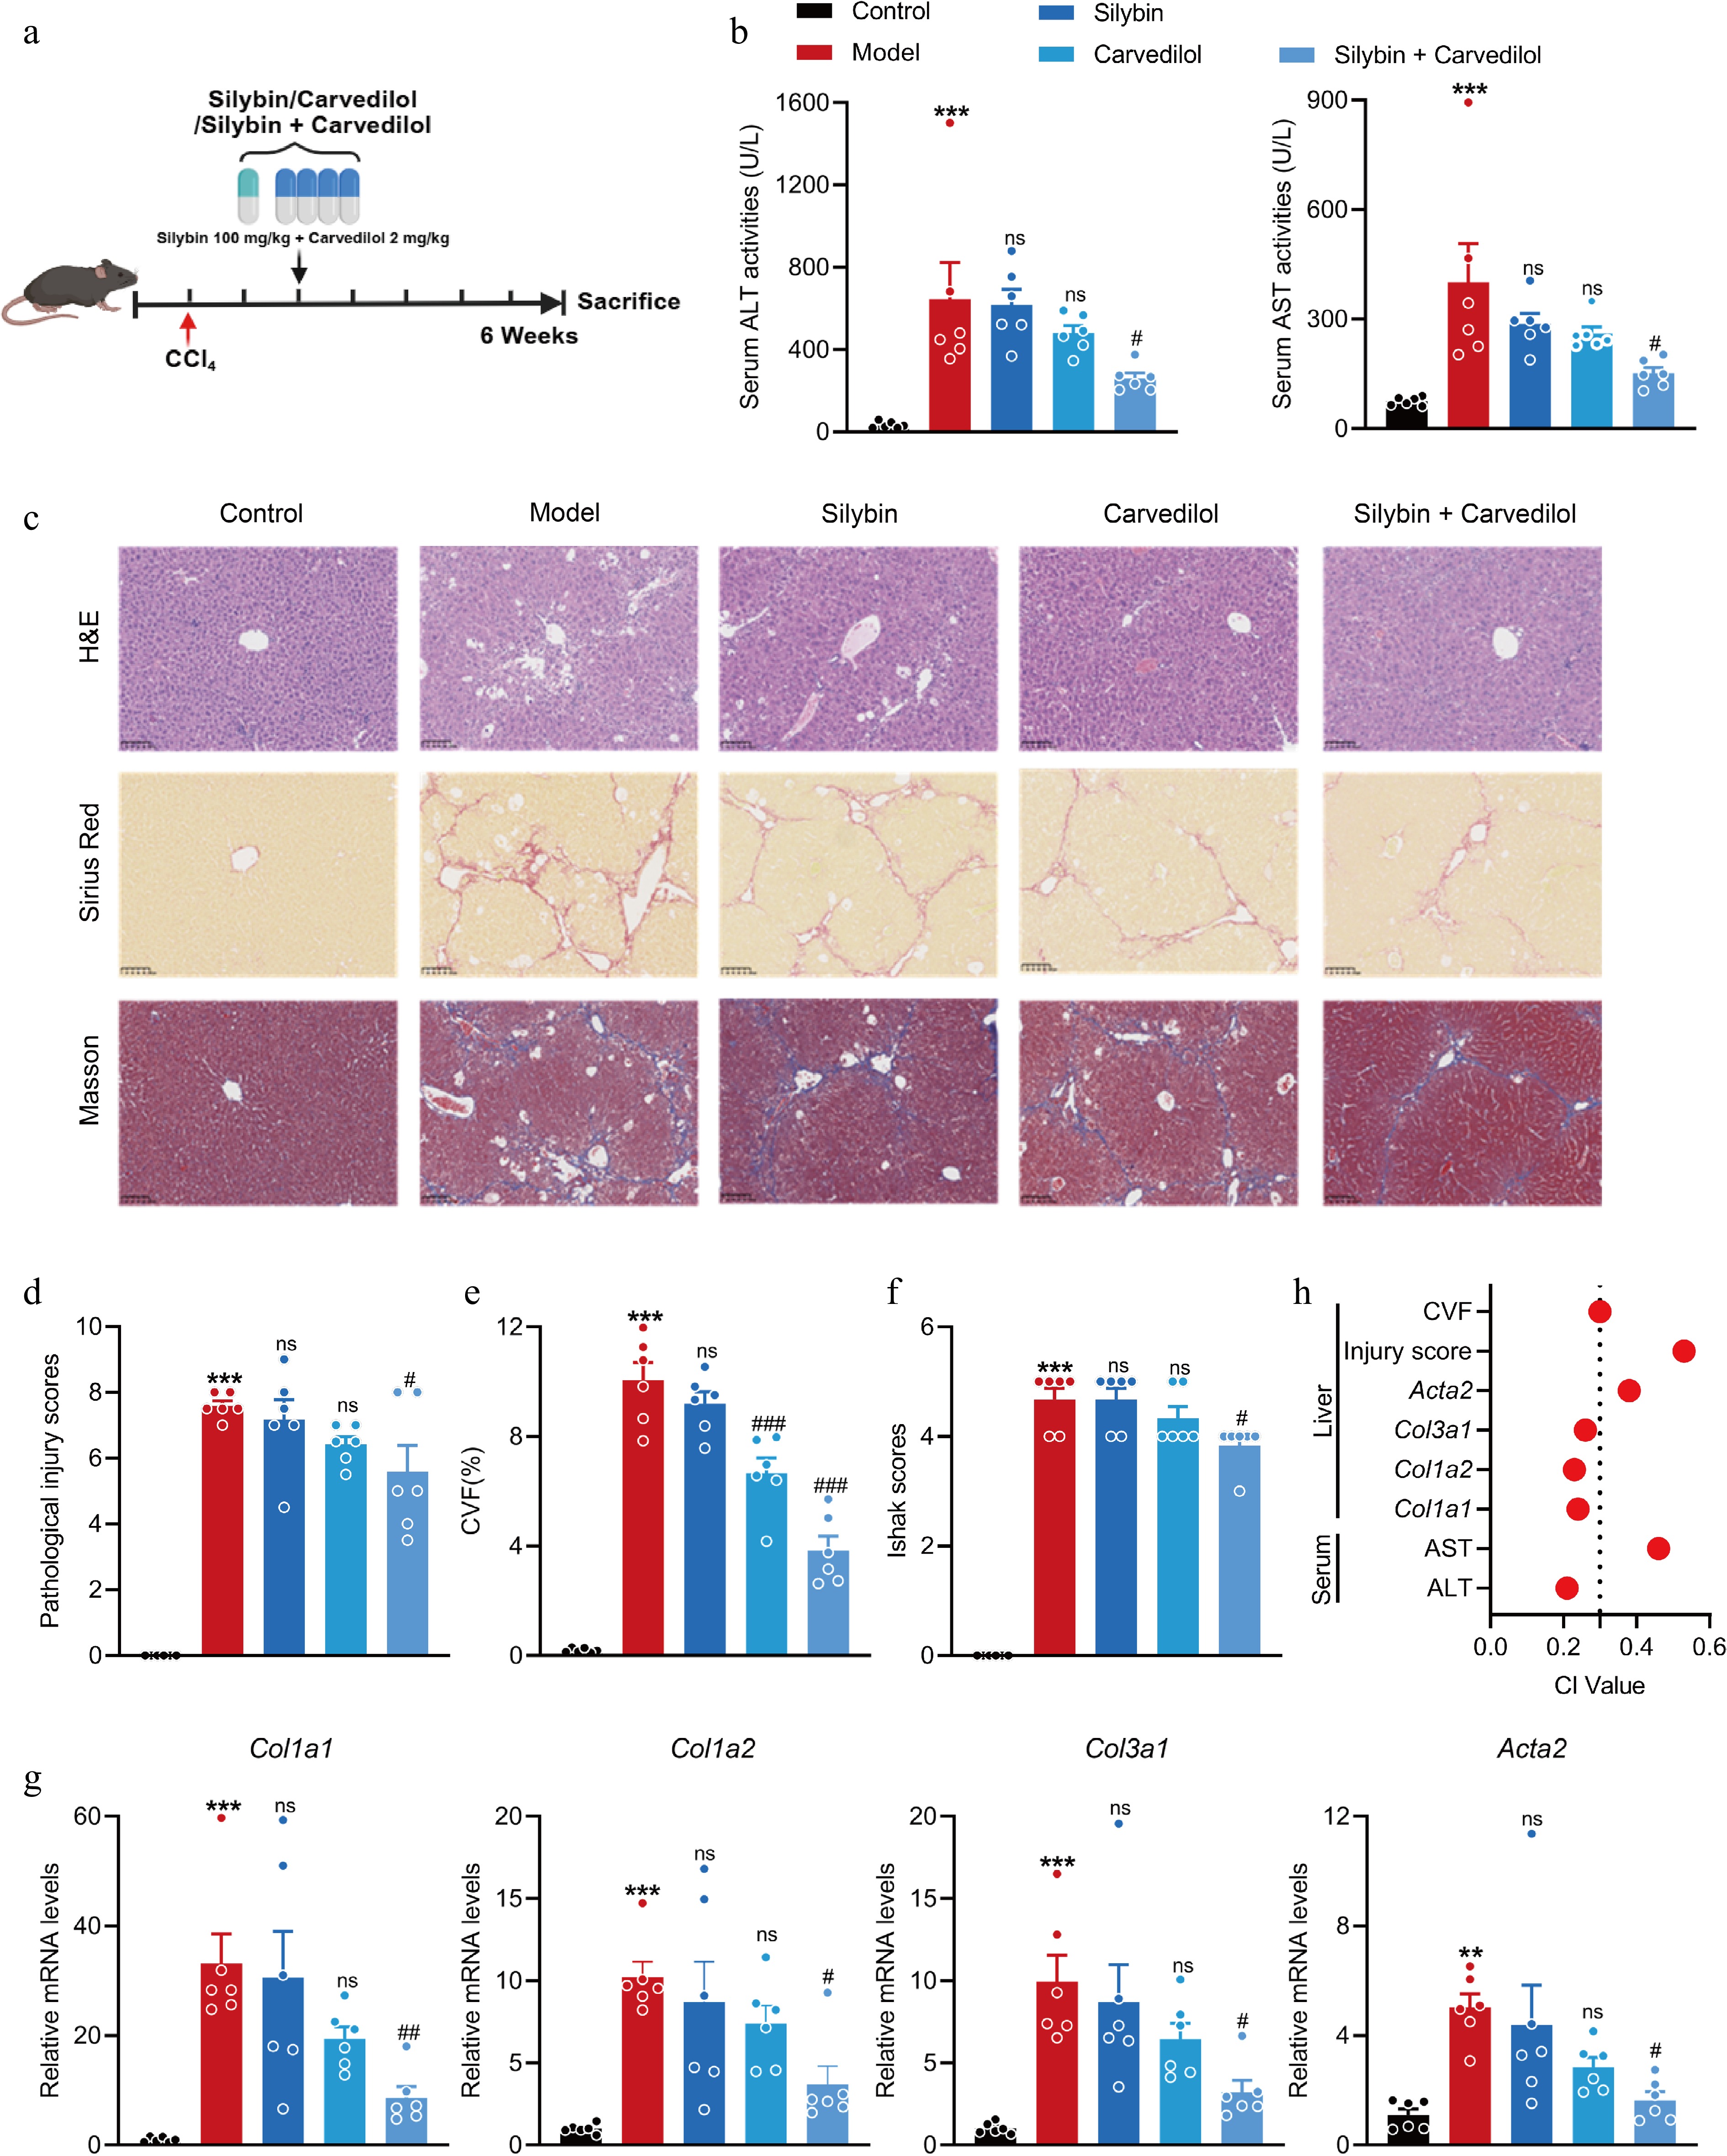
Figure 5.
Combined silybin and carvedilol significantly attenuates CCl4-induced liver fibrosis. (a) Mouse experiment procedure scheme. (b) Serum ALT and AST levels (n = 6). (c) Representative images of H&E, Sirius Red, and Masson staining of liver sections (n = 6, scale bar, 100 μm). (d) Pathological injury scores on H&E staining of liver sections (n = 6). Liver fibrosis analysis by (e) CVF, and (f) Ishak scores on Masson staining of liver sections (n = 6). (g) The mRNA levels of fibrotic genes (n = 6). (h) CI values of above indicators. Results are present as Mean ± SEM, ** p < 0.01, *** p < 0.001 vs control, # p < 0.05, ## p < 0.01, ### p < 0.001, and ns, no significance, vs model, as assessed with ANOVA.
-
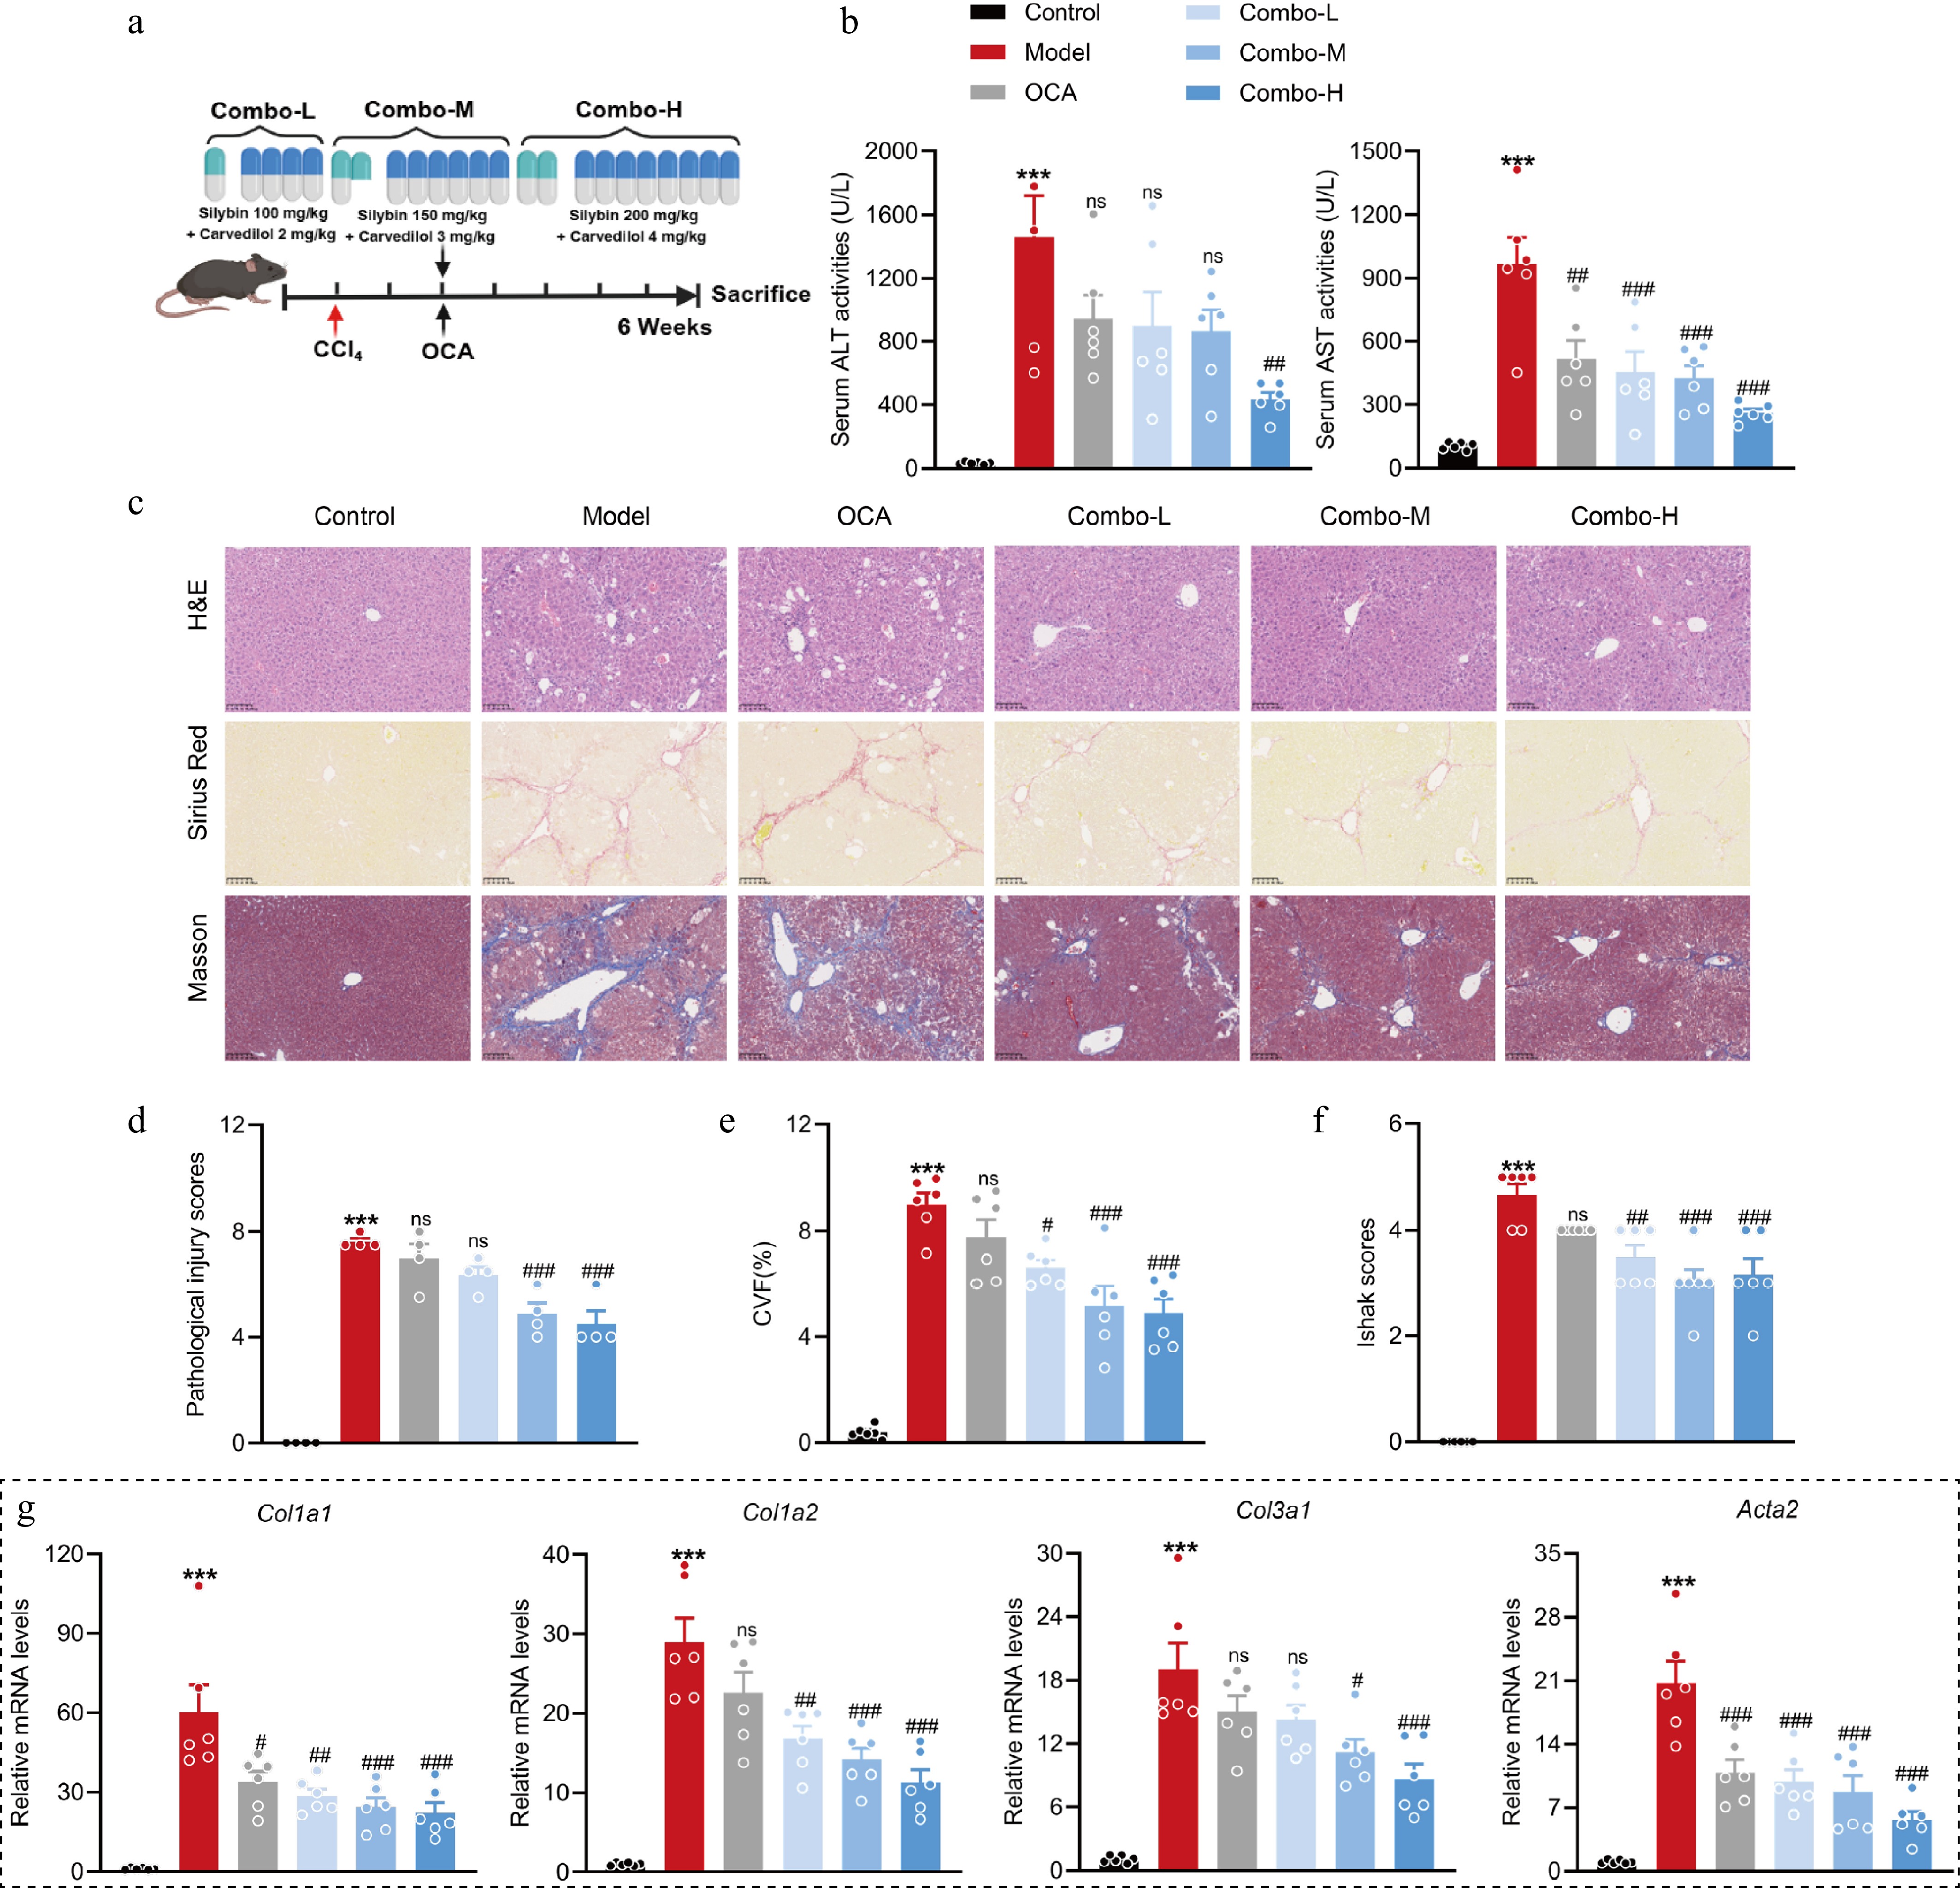
Figure 6.
A fixed-dose combination of silybin and carvedilol attenuates liver fibrosis in a dose-dependent manner. (a) Mouse experiment procedure scheme. (b) Serum ALT and AST levels (n = 6). (c) Representative images of H&E, Sirius Red, and Masson staining of liver tissues (n = 6, scale bar, 100 μm). (d) Pathological injury scores on H&E staining of liver tissues (n = 6). Liver fibrosis analysis by (e) CVF, and (f) Ishak scores on Masson staining of liver sections (n = 6). (g) The mRNA levels of fibrotic genes (n = 6). Results are present as Mean ± SEM, *** p < 0.001 vs control, # p < 0.05, ## p < 0.01, ### p < 0.001, and ns, no significance, vs model, as assessed with ANOVA.
-
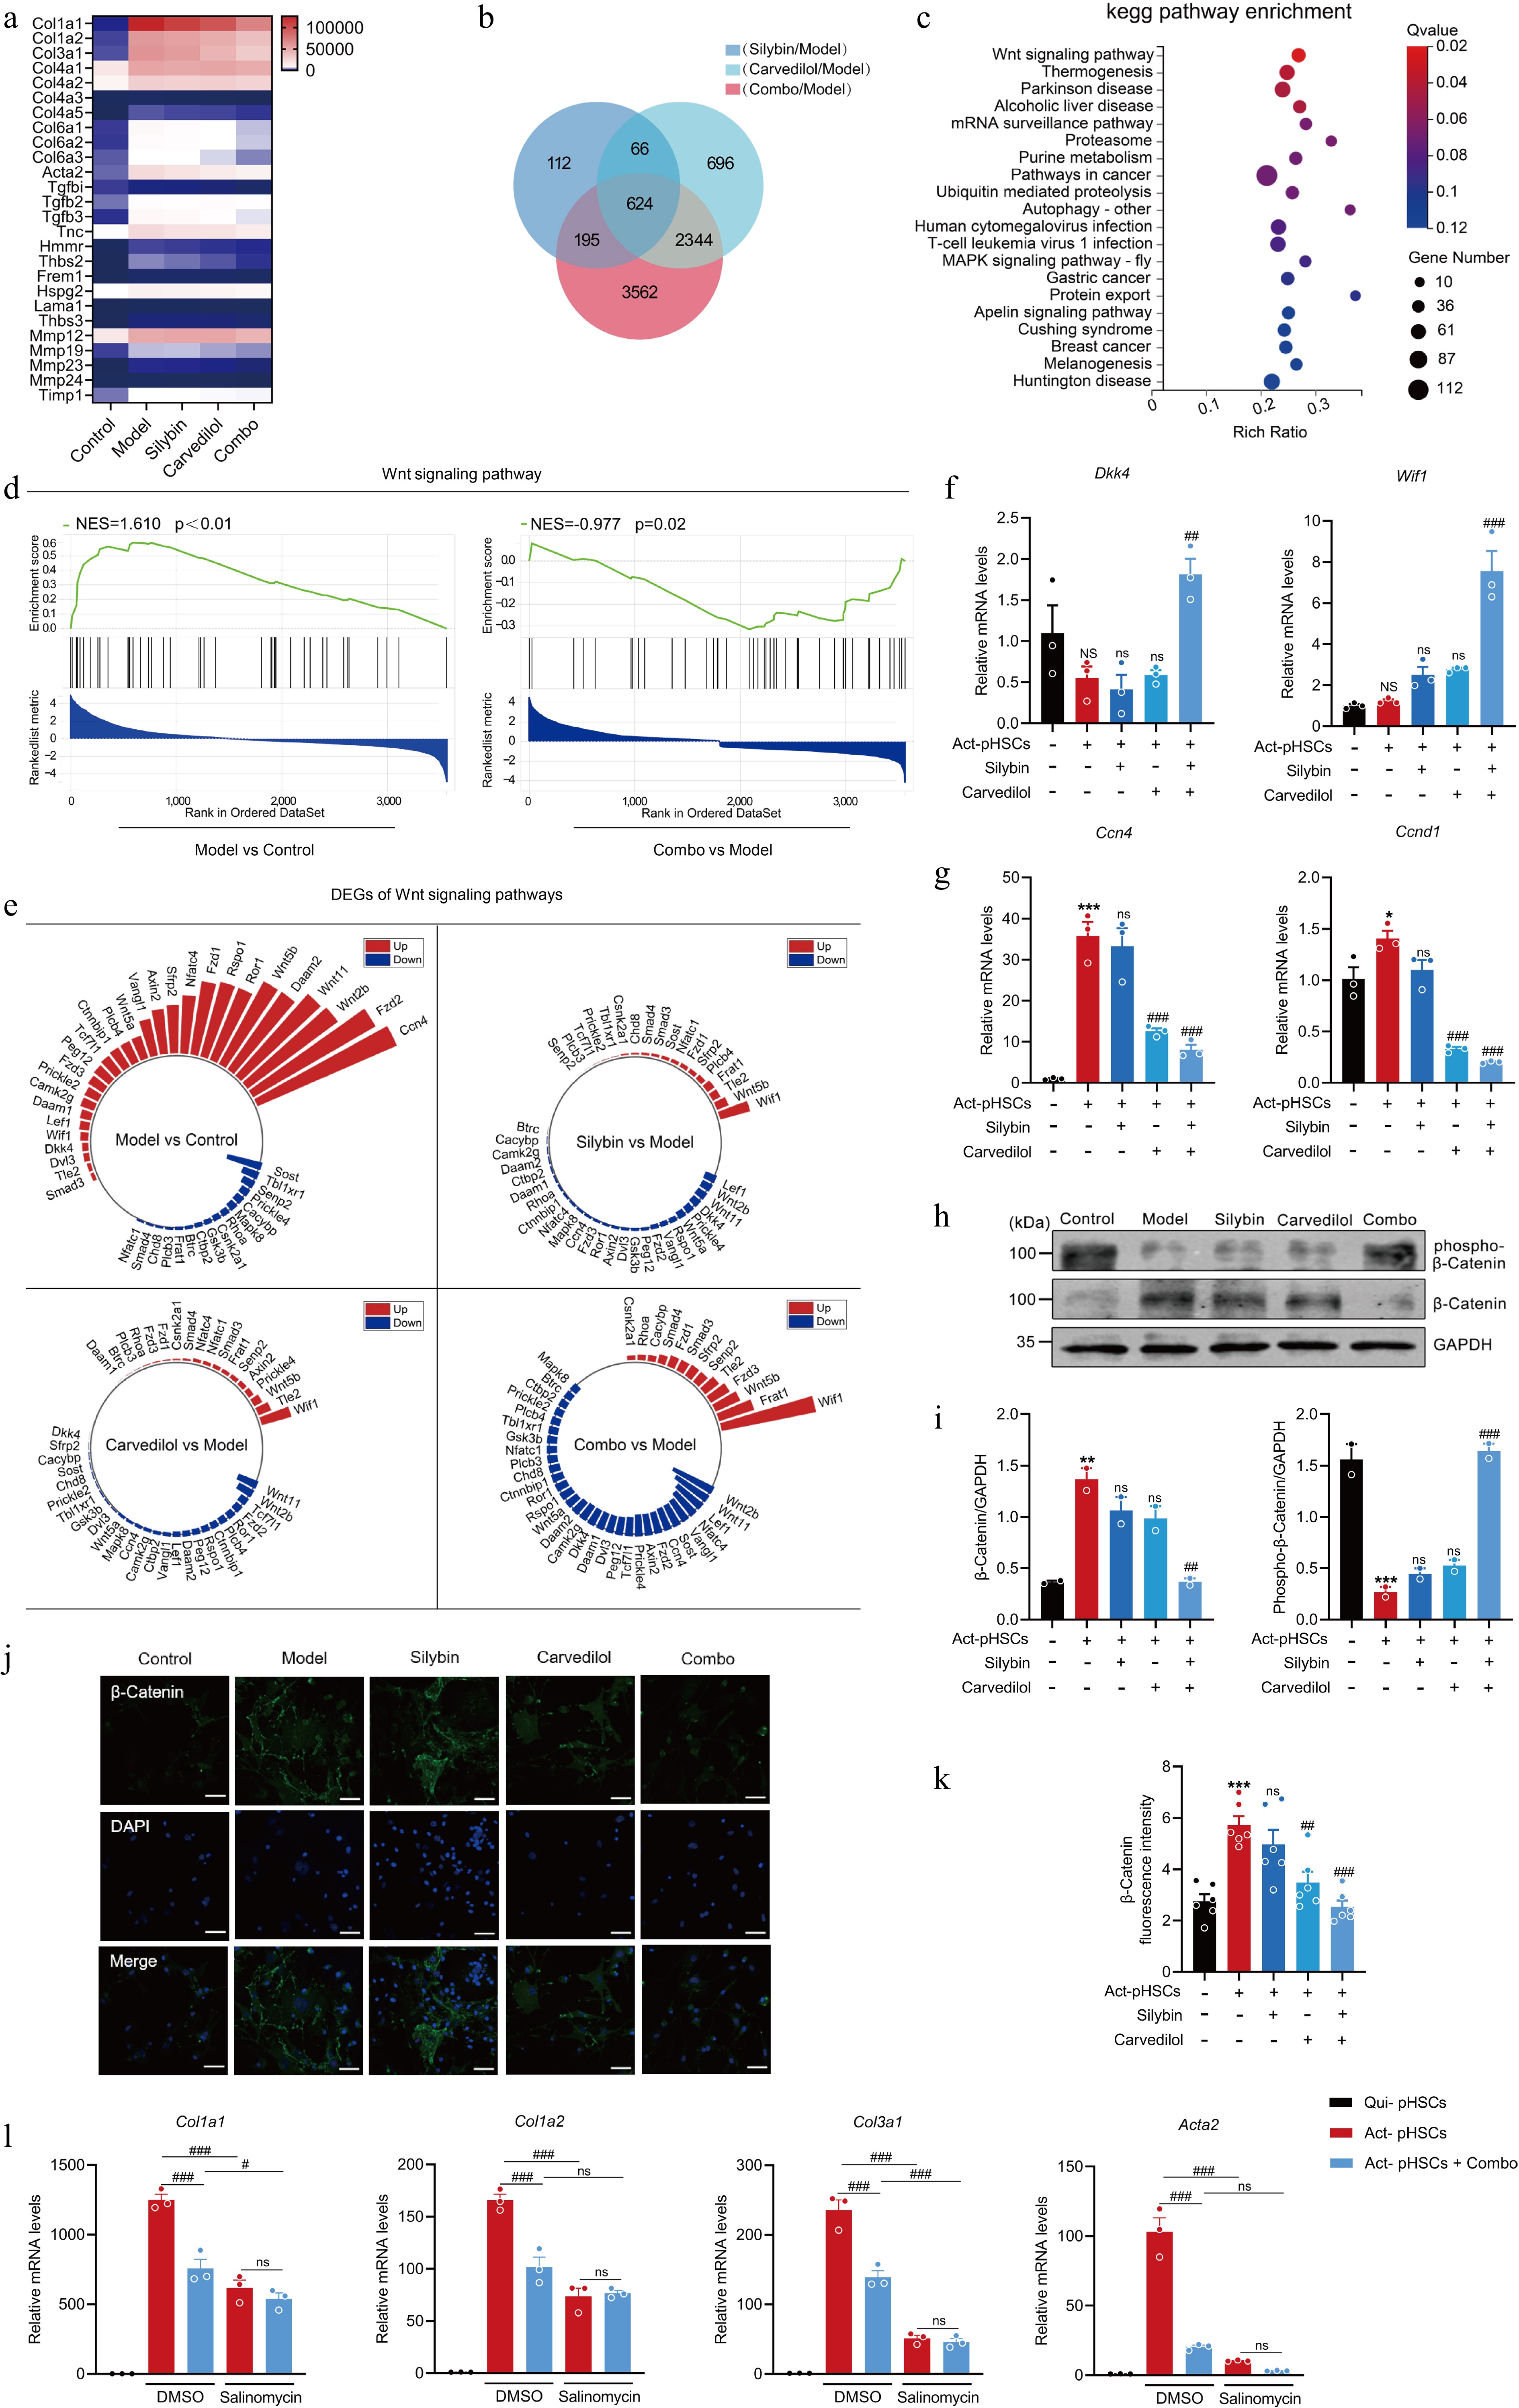
Figure 7.
Silybin and carvedilol synergistically inhibits HSC activation by regulating the Wnt signaling pathway. (a) Heatmap of the expression of signature HSC activation-related genes across different treatment groups. (b) Venn diagram of DEGs in response to mono- and combination therapies. (c) KEGG pathway enrichment of combo-specific DEGs. (d) GSEA of Wnt signaling pathway. (e) Radial plot of Wnt signaling-related DEGs across inter-group comparisons. (f) The mRNA levels of Wif1 and Dkk1 in pHSCs (n = 3). (g) The mRNA levels of target genes in Wnt signaling in pHSCs (n = 3). (h)–(k) Western blot analysis (h, i, n = 2), immunofluorescence (j, k, n = 6) analysis and the quantification analysis of β-Catenin in pHSCs. (l) The mRNA expression of pro-fibrotic genes in pHSCs by the combination in the presence or absence of salinomycin (n = 3). Results are present as Mean ± SEM, * p < 0.05, *** p < 0.001, and NS, no significance, vs control, #p < 0.05, ## p < 0.01, ### p < 0.001, and ns, no significance, vs model, as assessed with ANOVA.
-
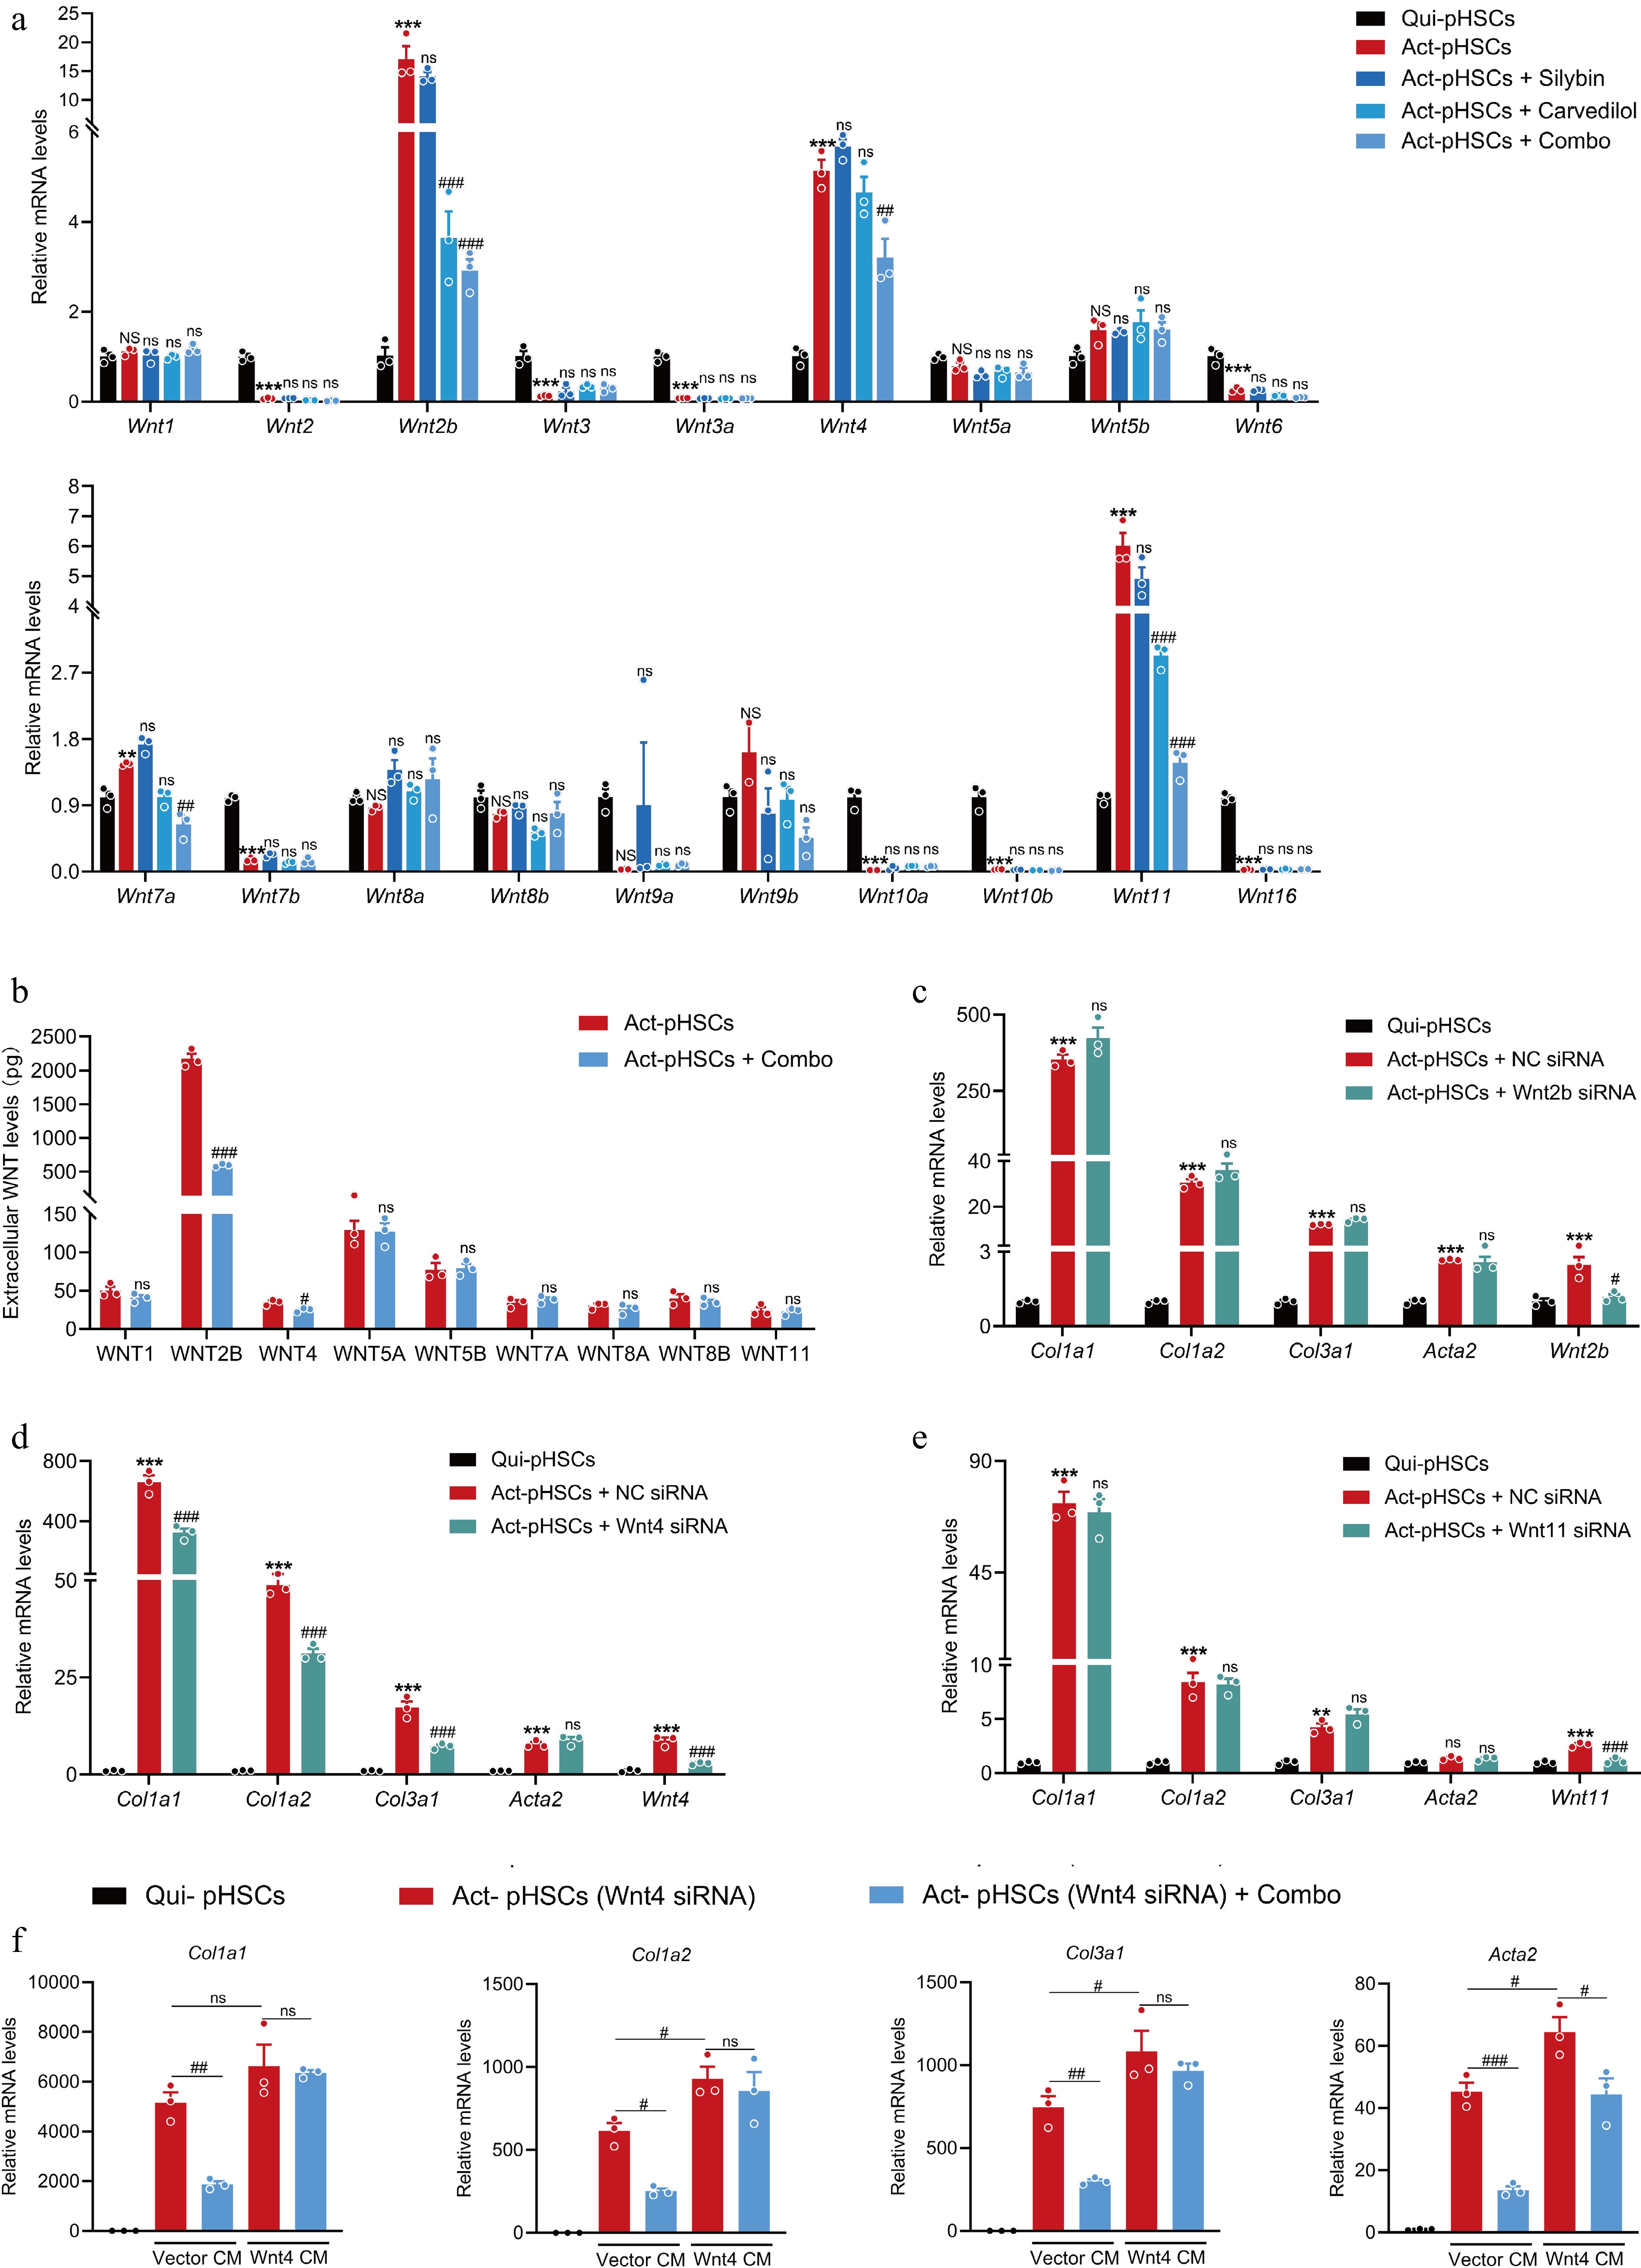
Figure 8.
The combination of silybin and carvedilol inhibits HSC activation by suppressing WNT4. (a) The mRNA expression of 19 Wnt ligands in pHSCs treated with individual or combined silybin and carvedilol (n = 3). (b) Extracellular protein levels of main Wnt ligands in pHSCs (n = 3). mRNA expression of pro-fibrotic genes in pHSCs treated with either (c) Wnt2b siRNA, (d) Wnt4 siRNA or (e) Wnt11 siRNA (n = 3). (f) The mRNA expression of pro-fibrotic genes in pHSCs (Wnt4 knocked down) incubated with conditioned medium collected from HEK293T cells transfected with Vector plasmid (Vector CM) or Wnt4-overexpressing plasmid (Wnt4 CM) (n = 3). Results are presented as Mean ± SEM, * p < 0.05, ** p < 0.01, *** p < 0.001, and ns, no significance, vs control, # p < 0.05, ## p < 0.01,### p < 0.001, and ns, no significance, vs model, as assessed with ANOVA or t-test.
Figures
(8)
Tables
(0)