-
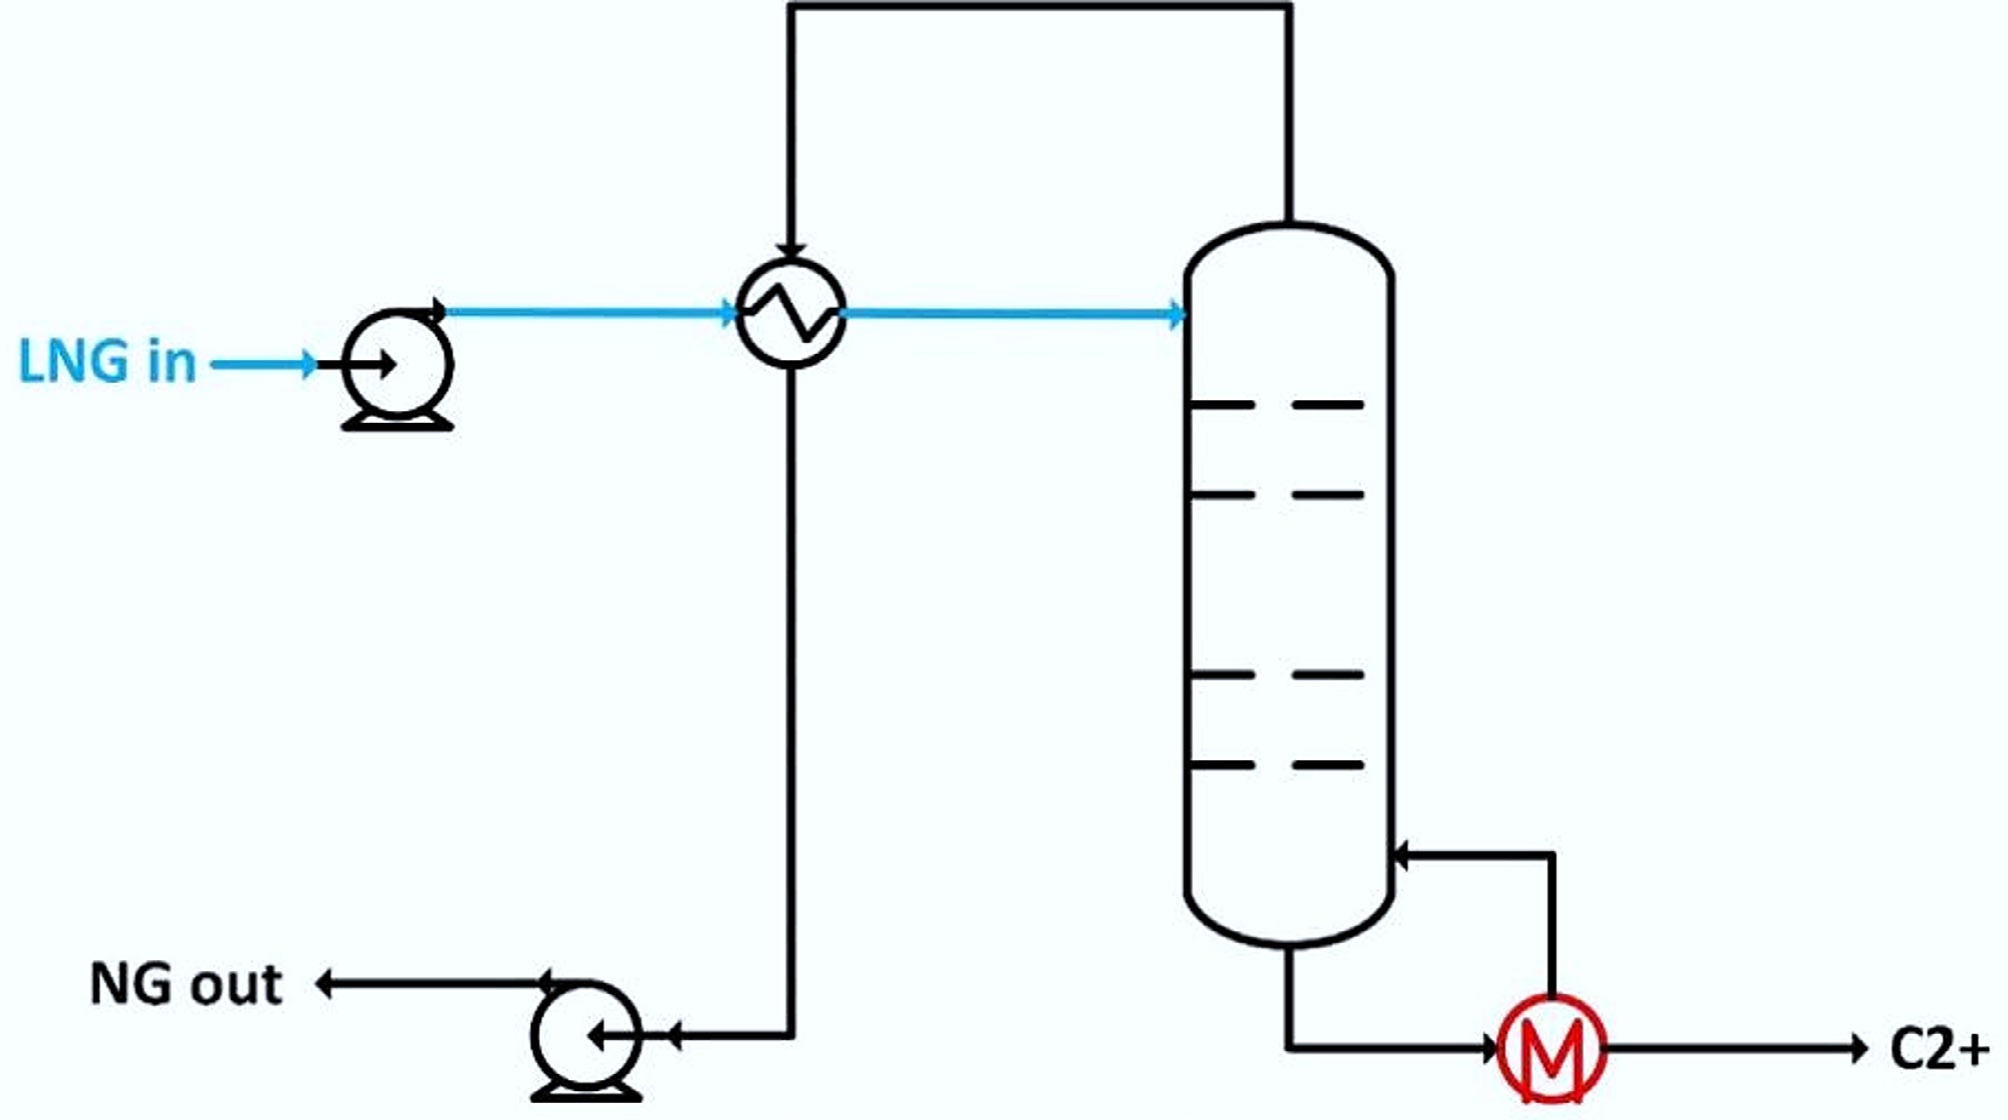
Figure 1.
Simplest configuration of hydrocarbons recovery during regasification.
-
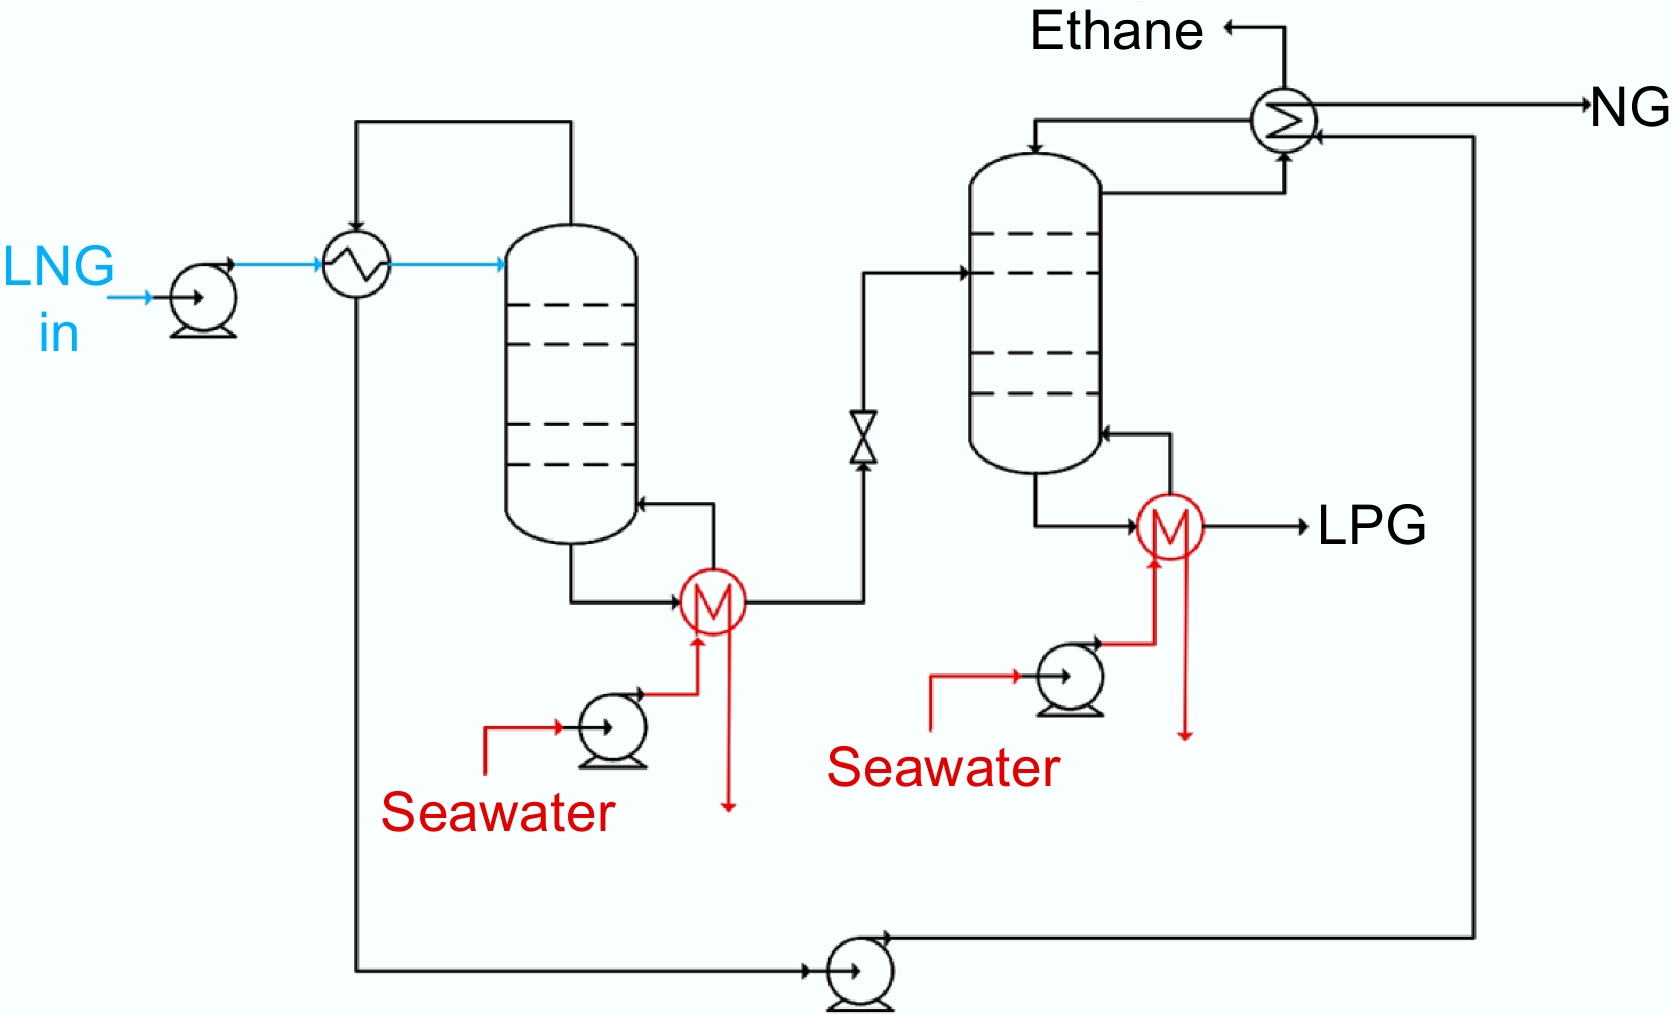
Figure 2.
Hydrocarbons recovery from LNG, design 1.
-
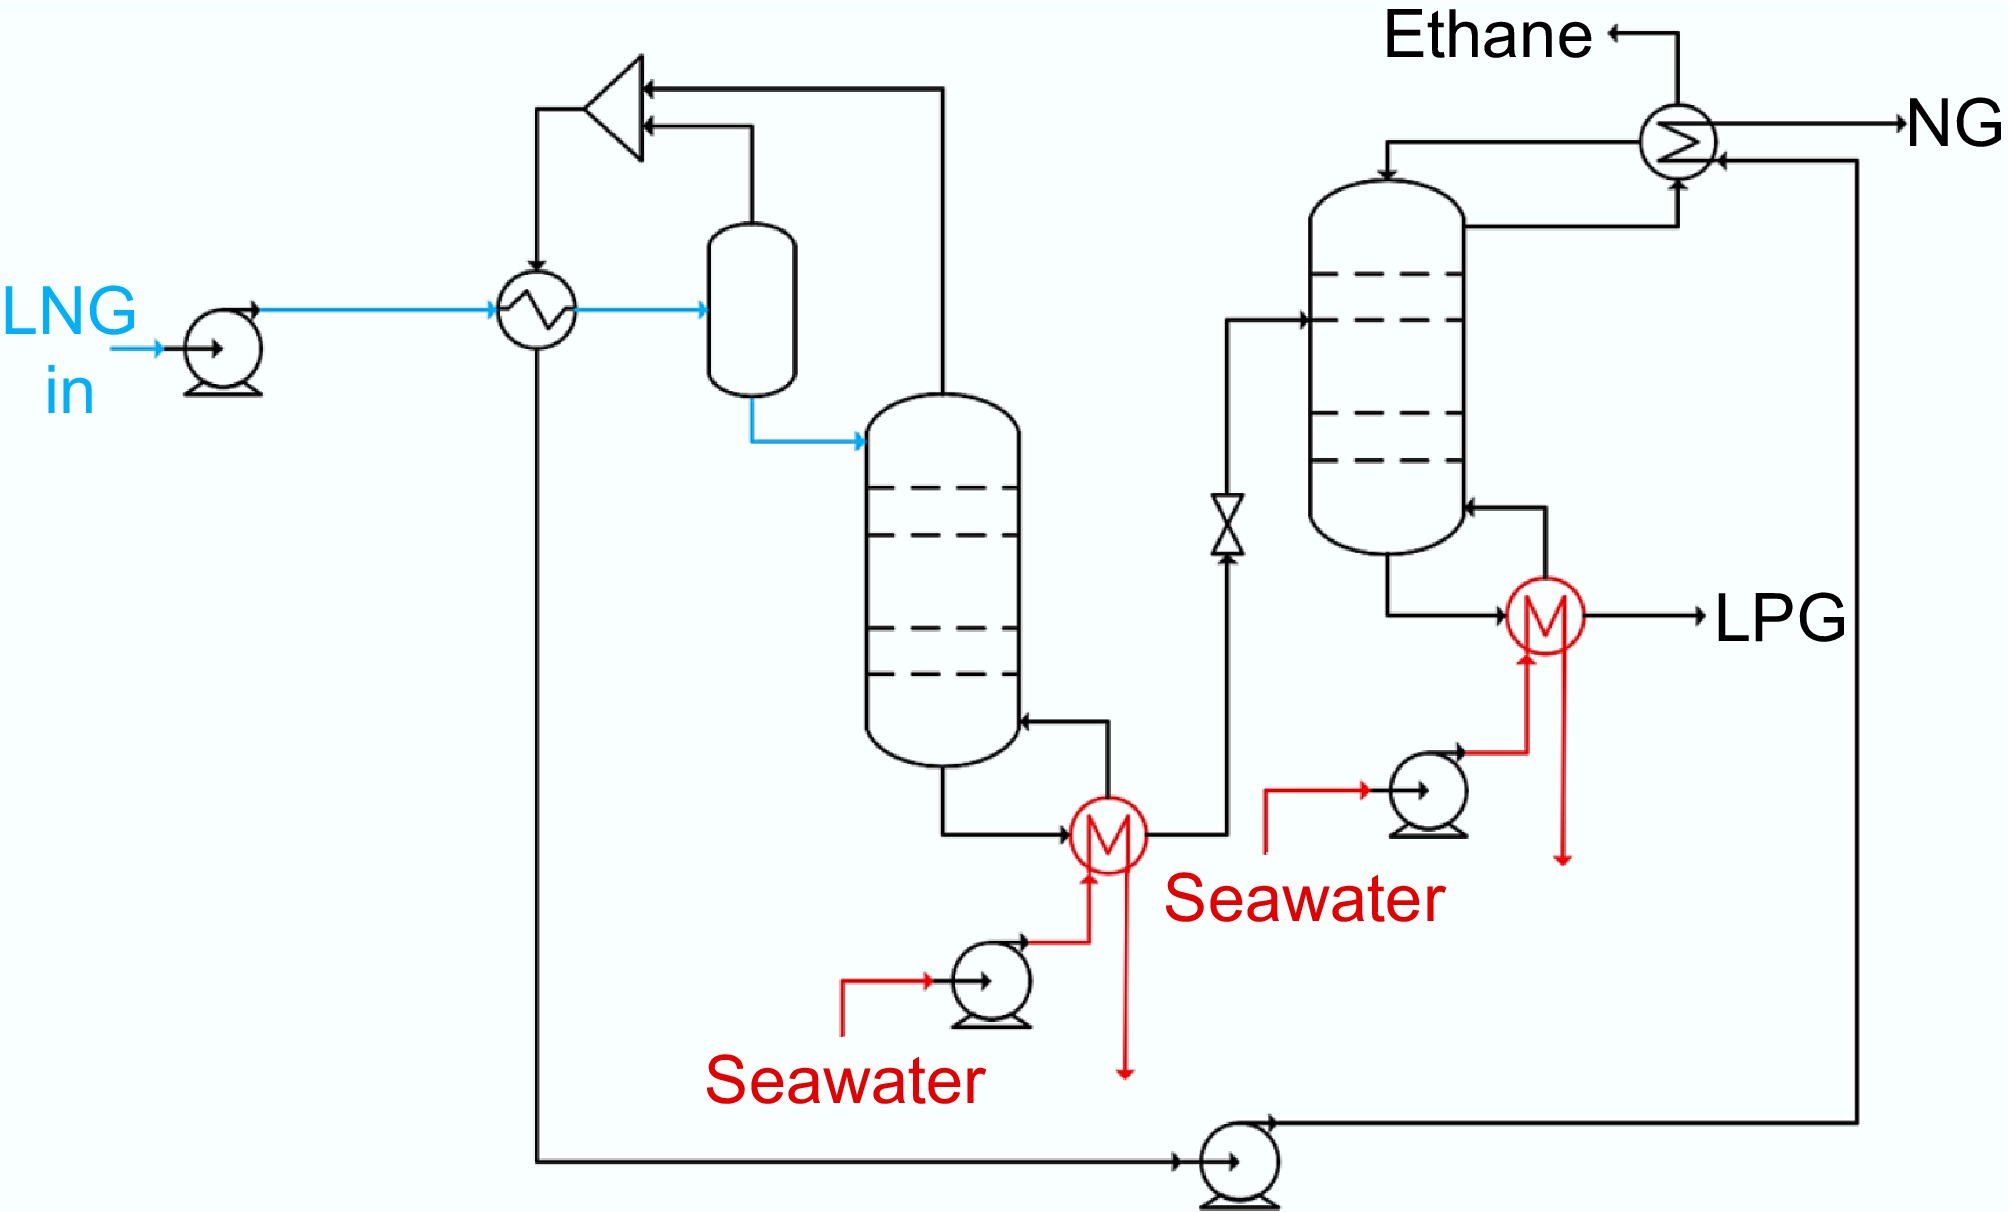
Figure 3.
Hydrocarbons recovery from LNG, design 2.
-
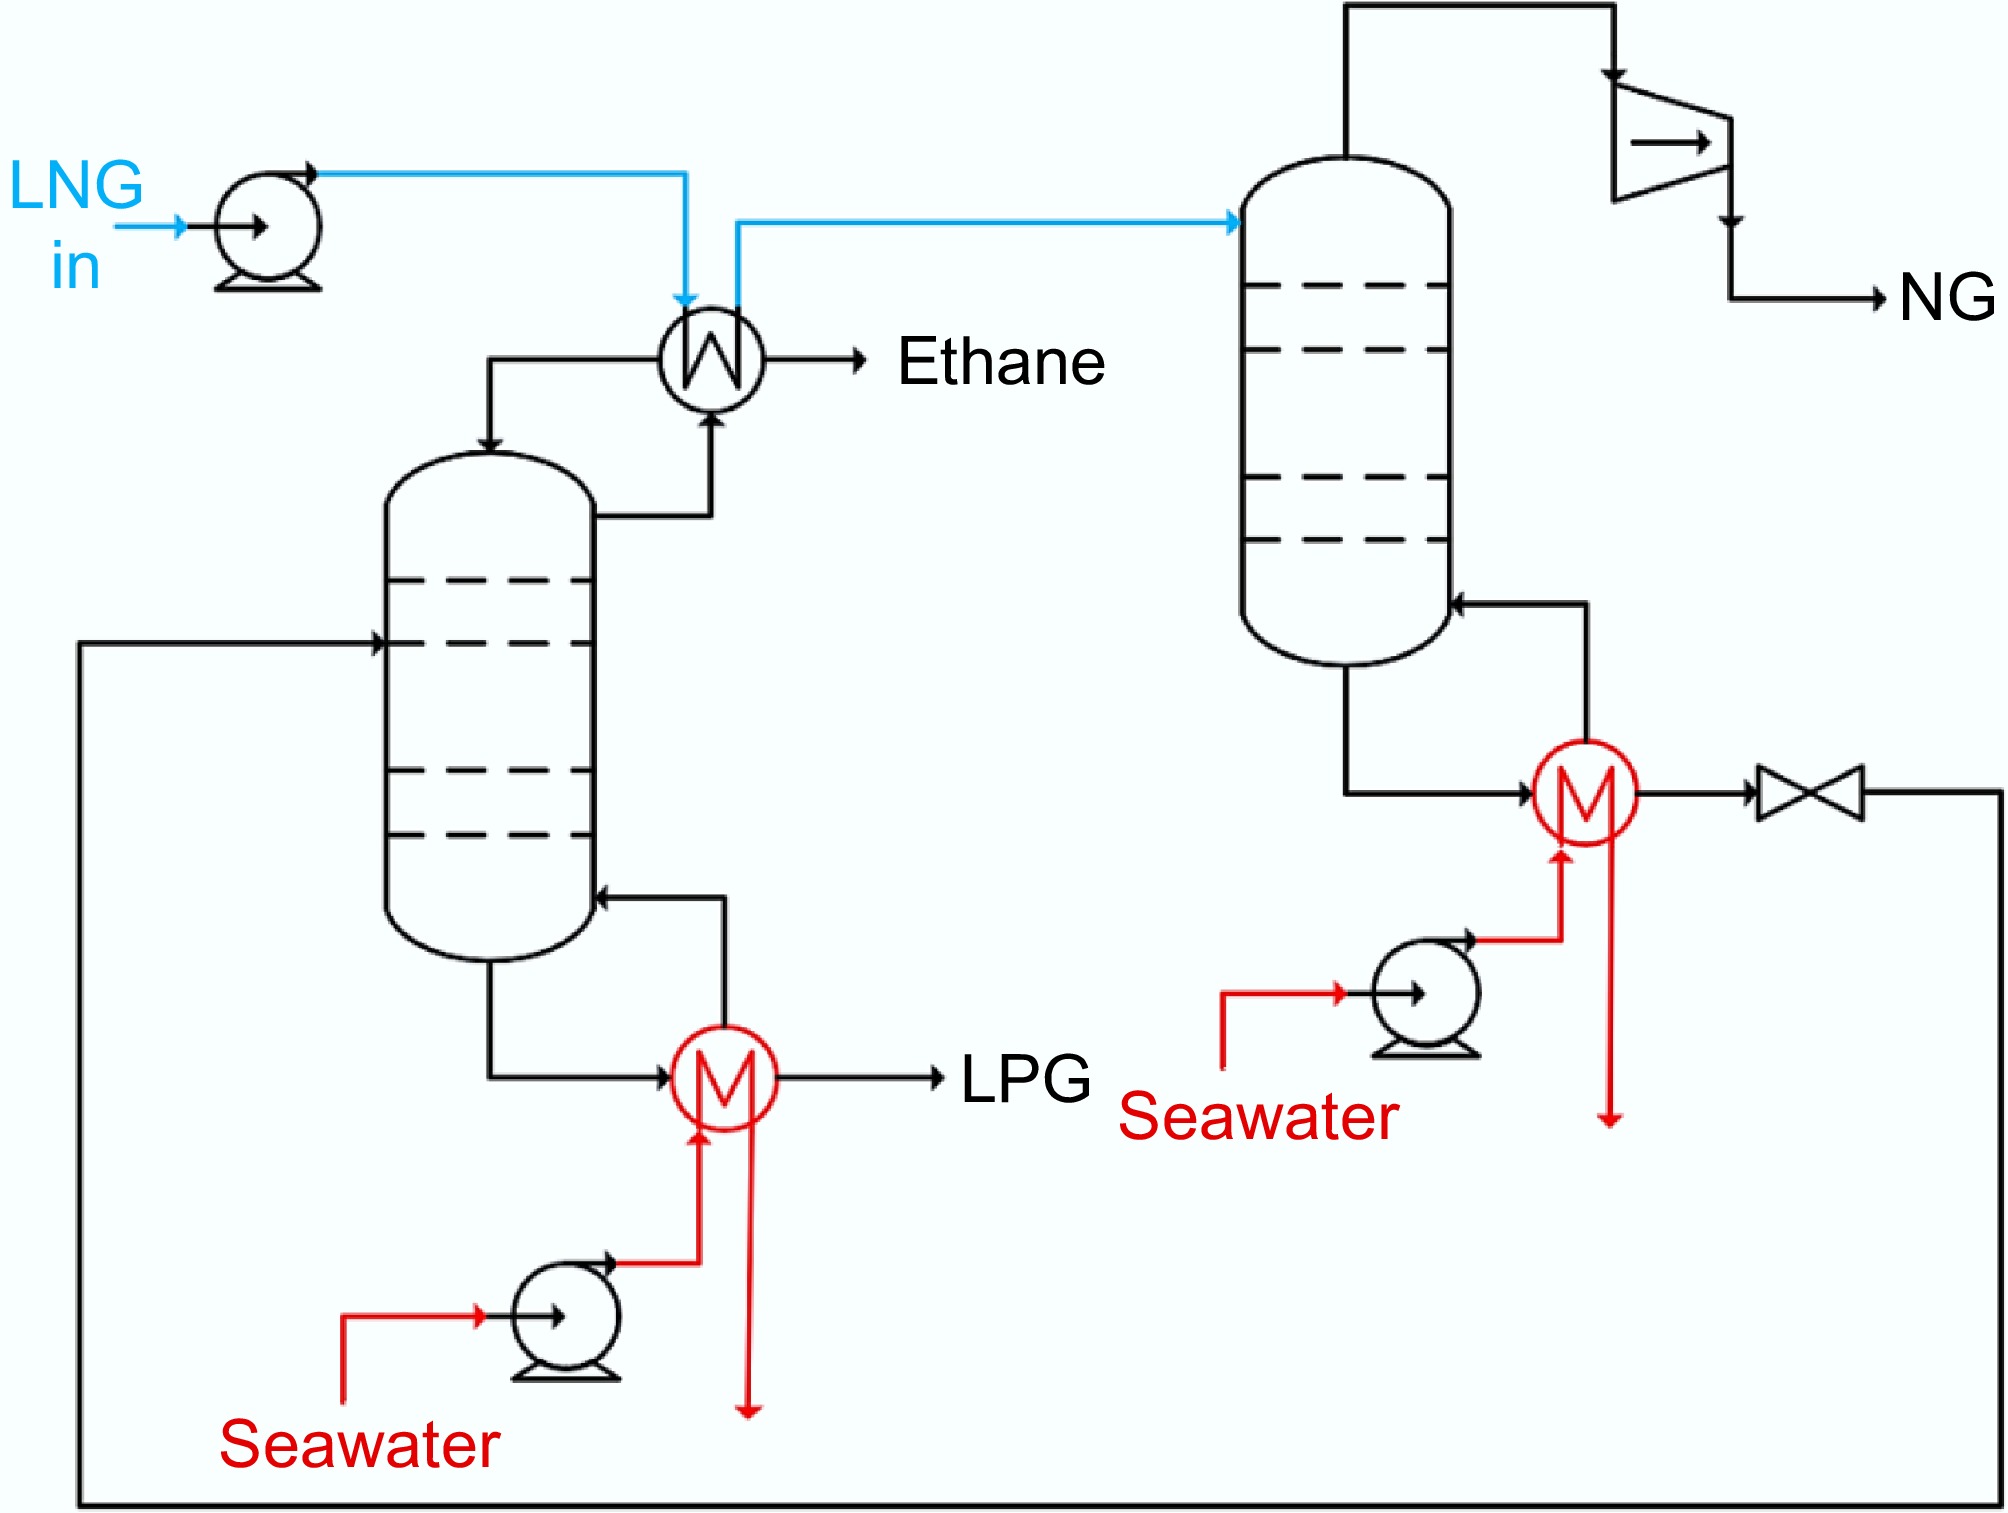
Figure 4.
Hydrocarbon recovery from LNG, design 3.
-
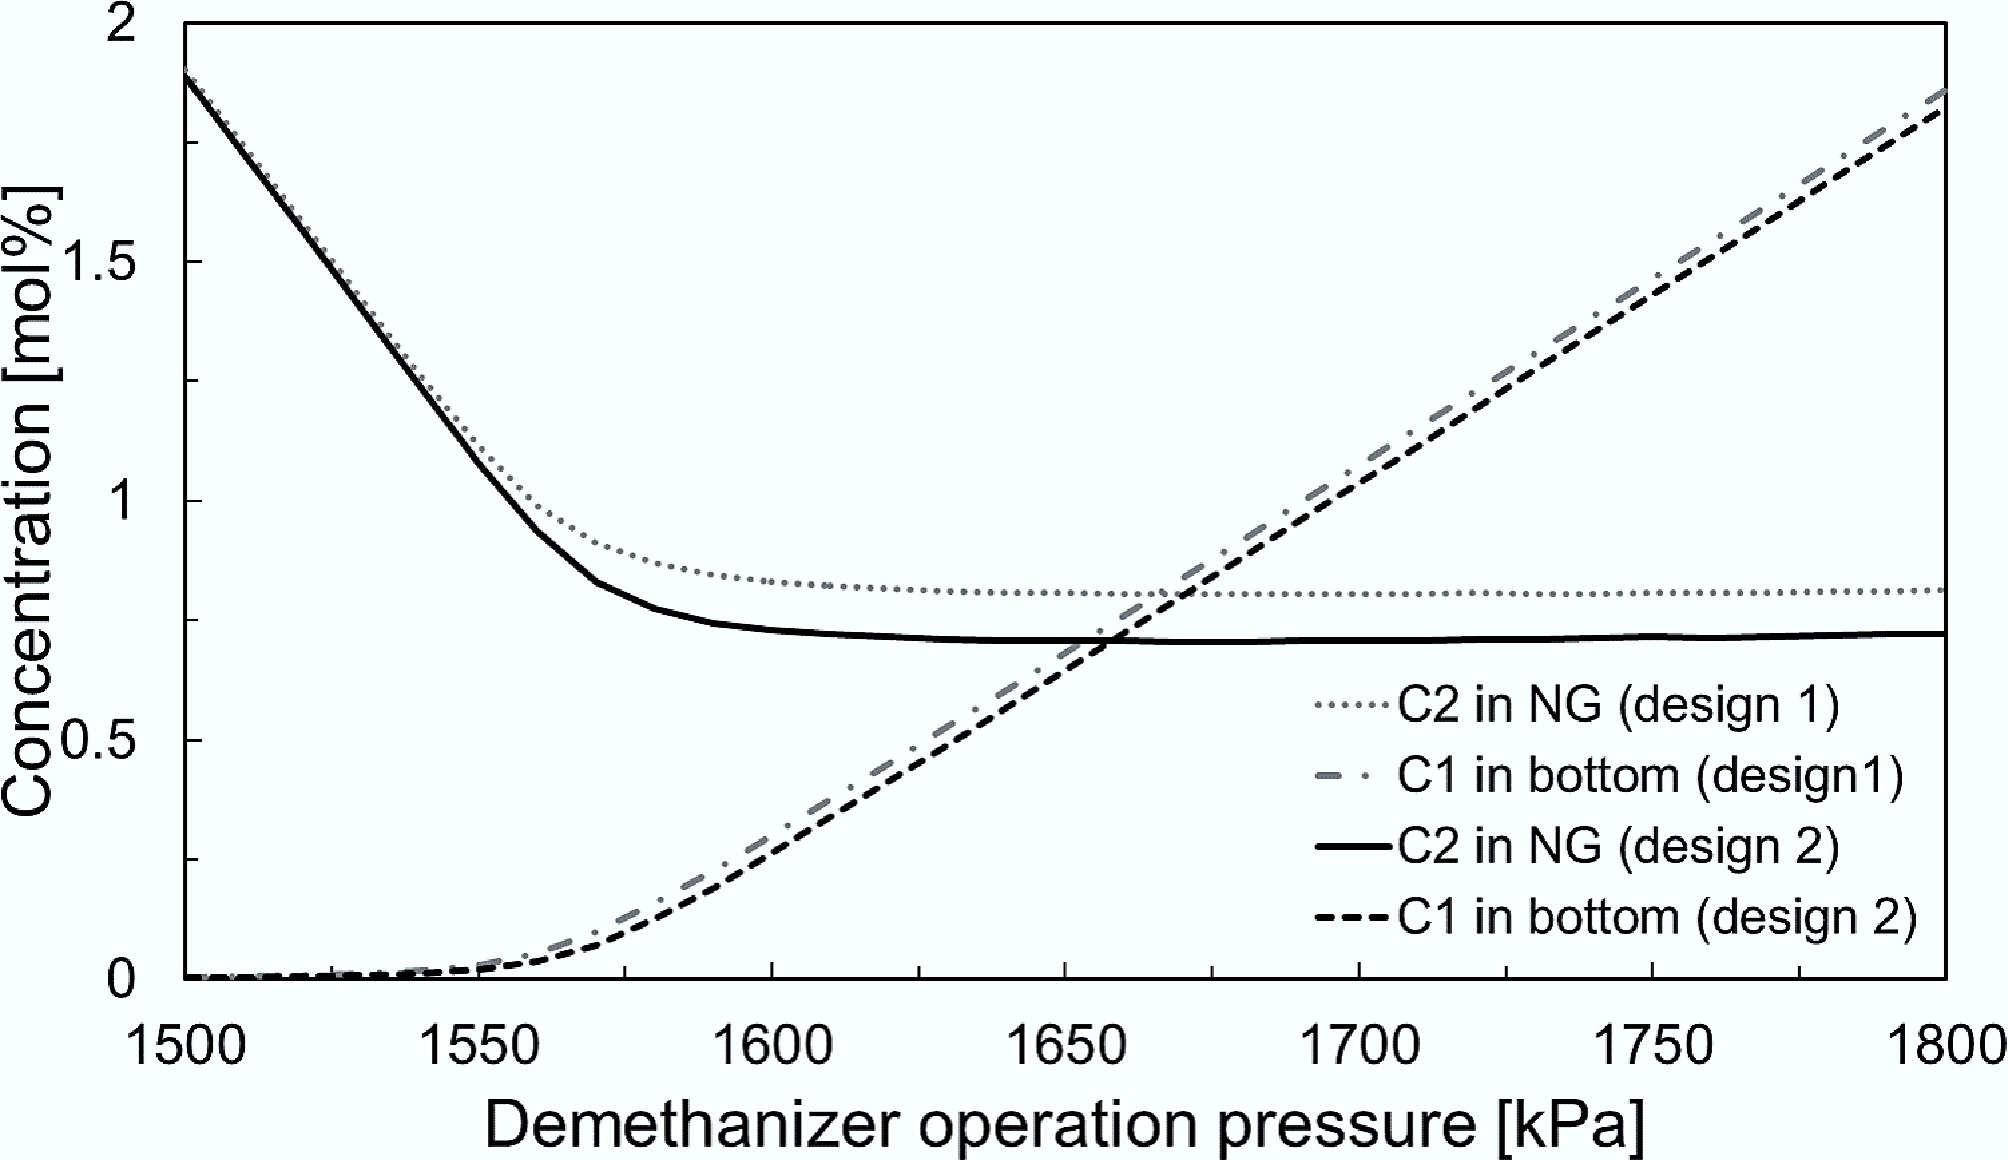
Figure 5.
Concentrations of methane and ethane in bottom and overhead streams at different operation pressures in demethanizer for designs 1 and 2.
-
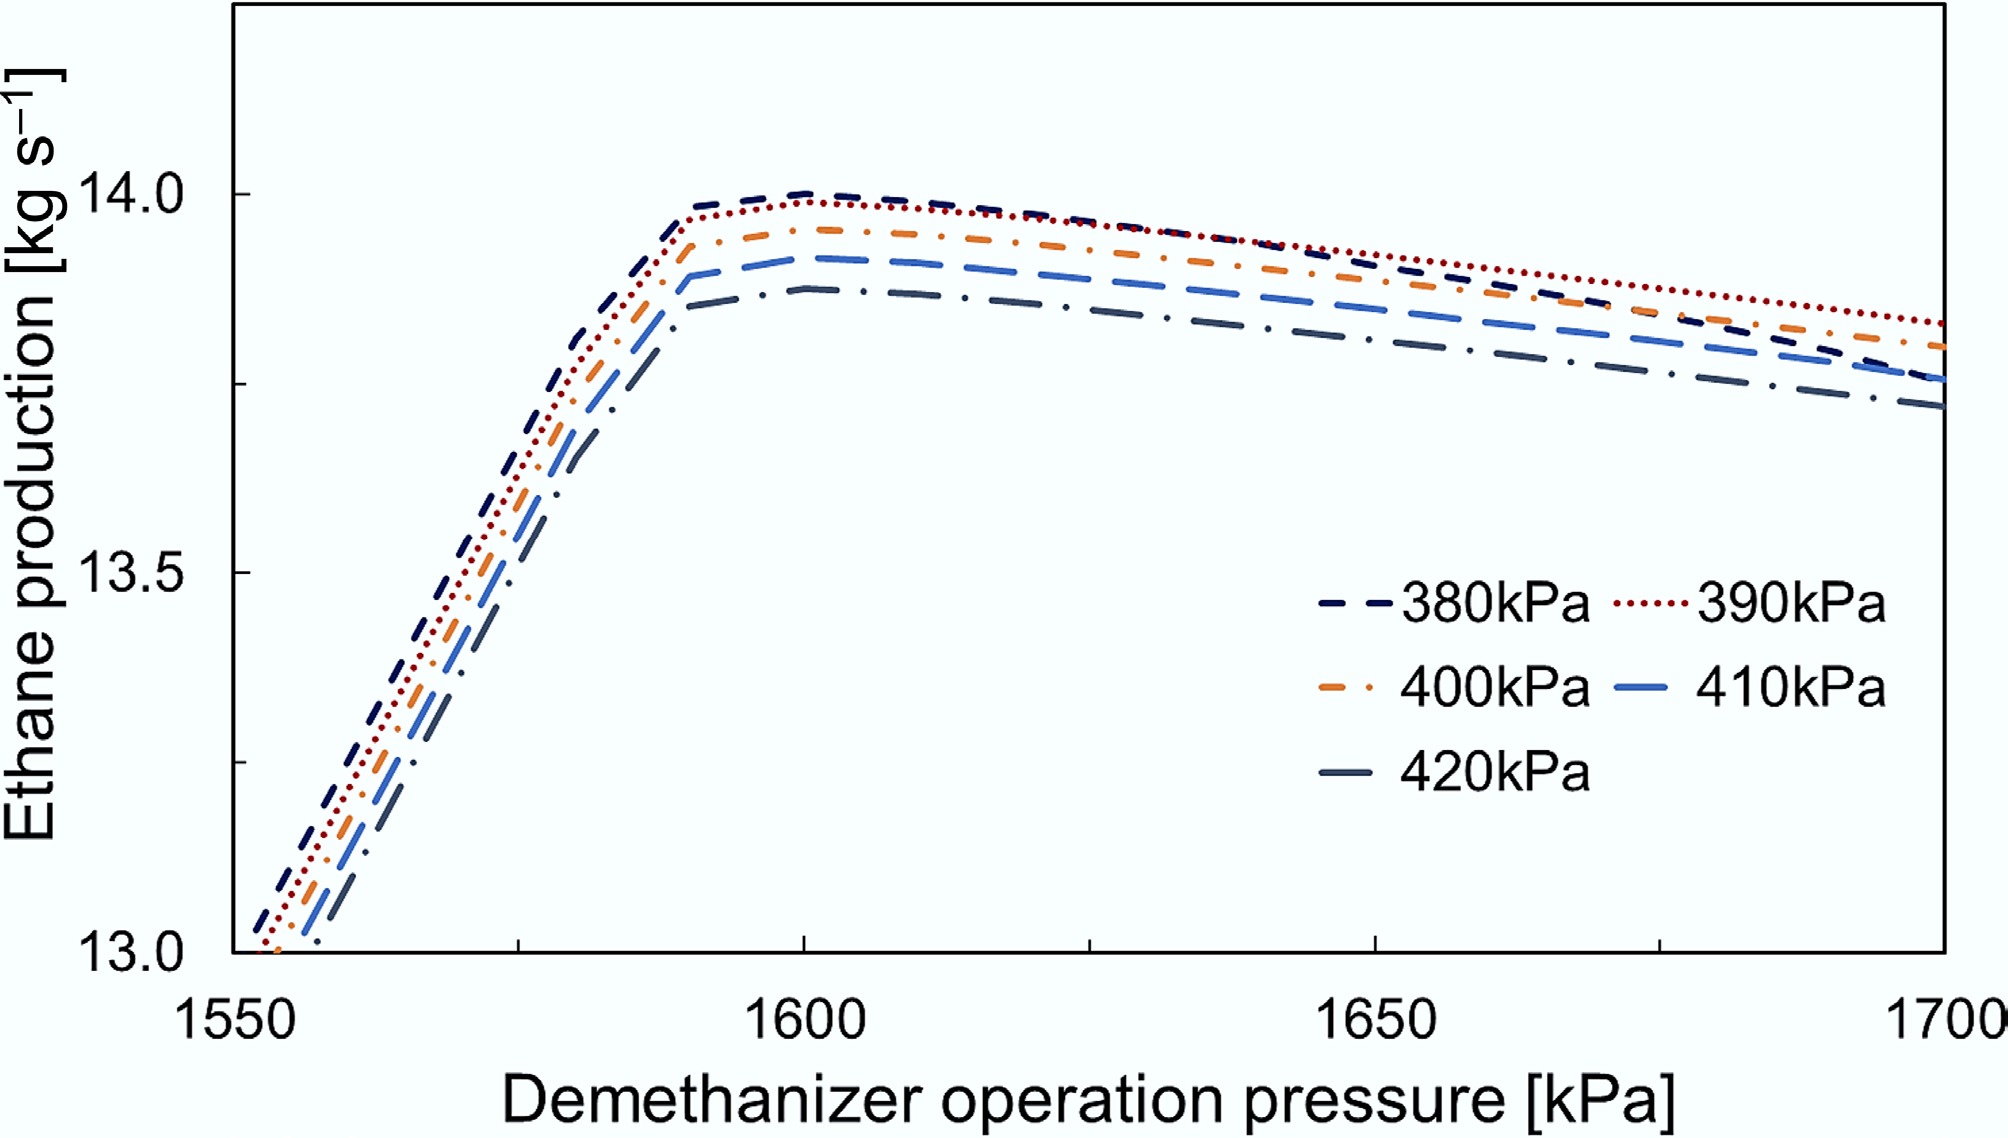
Figure 6.
Production of ethane at different demethanizer and deethanizer operating pressures.
-

Figure 7.
Economic performances under three different LNG mass flow rates.
-
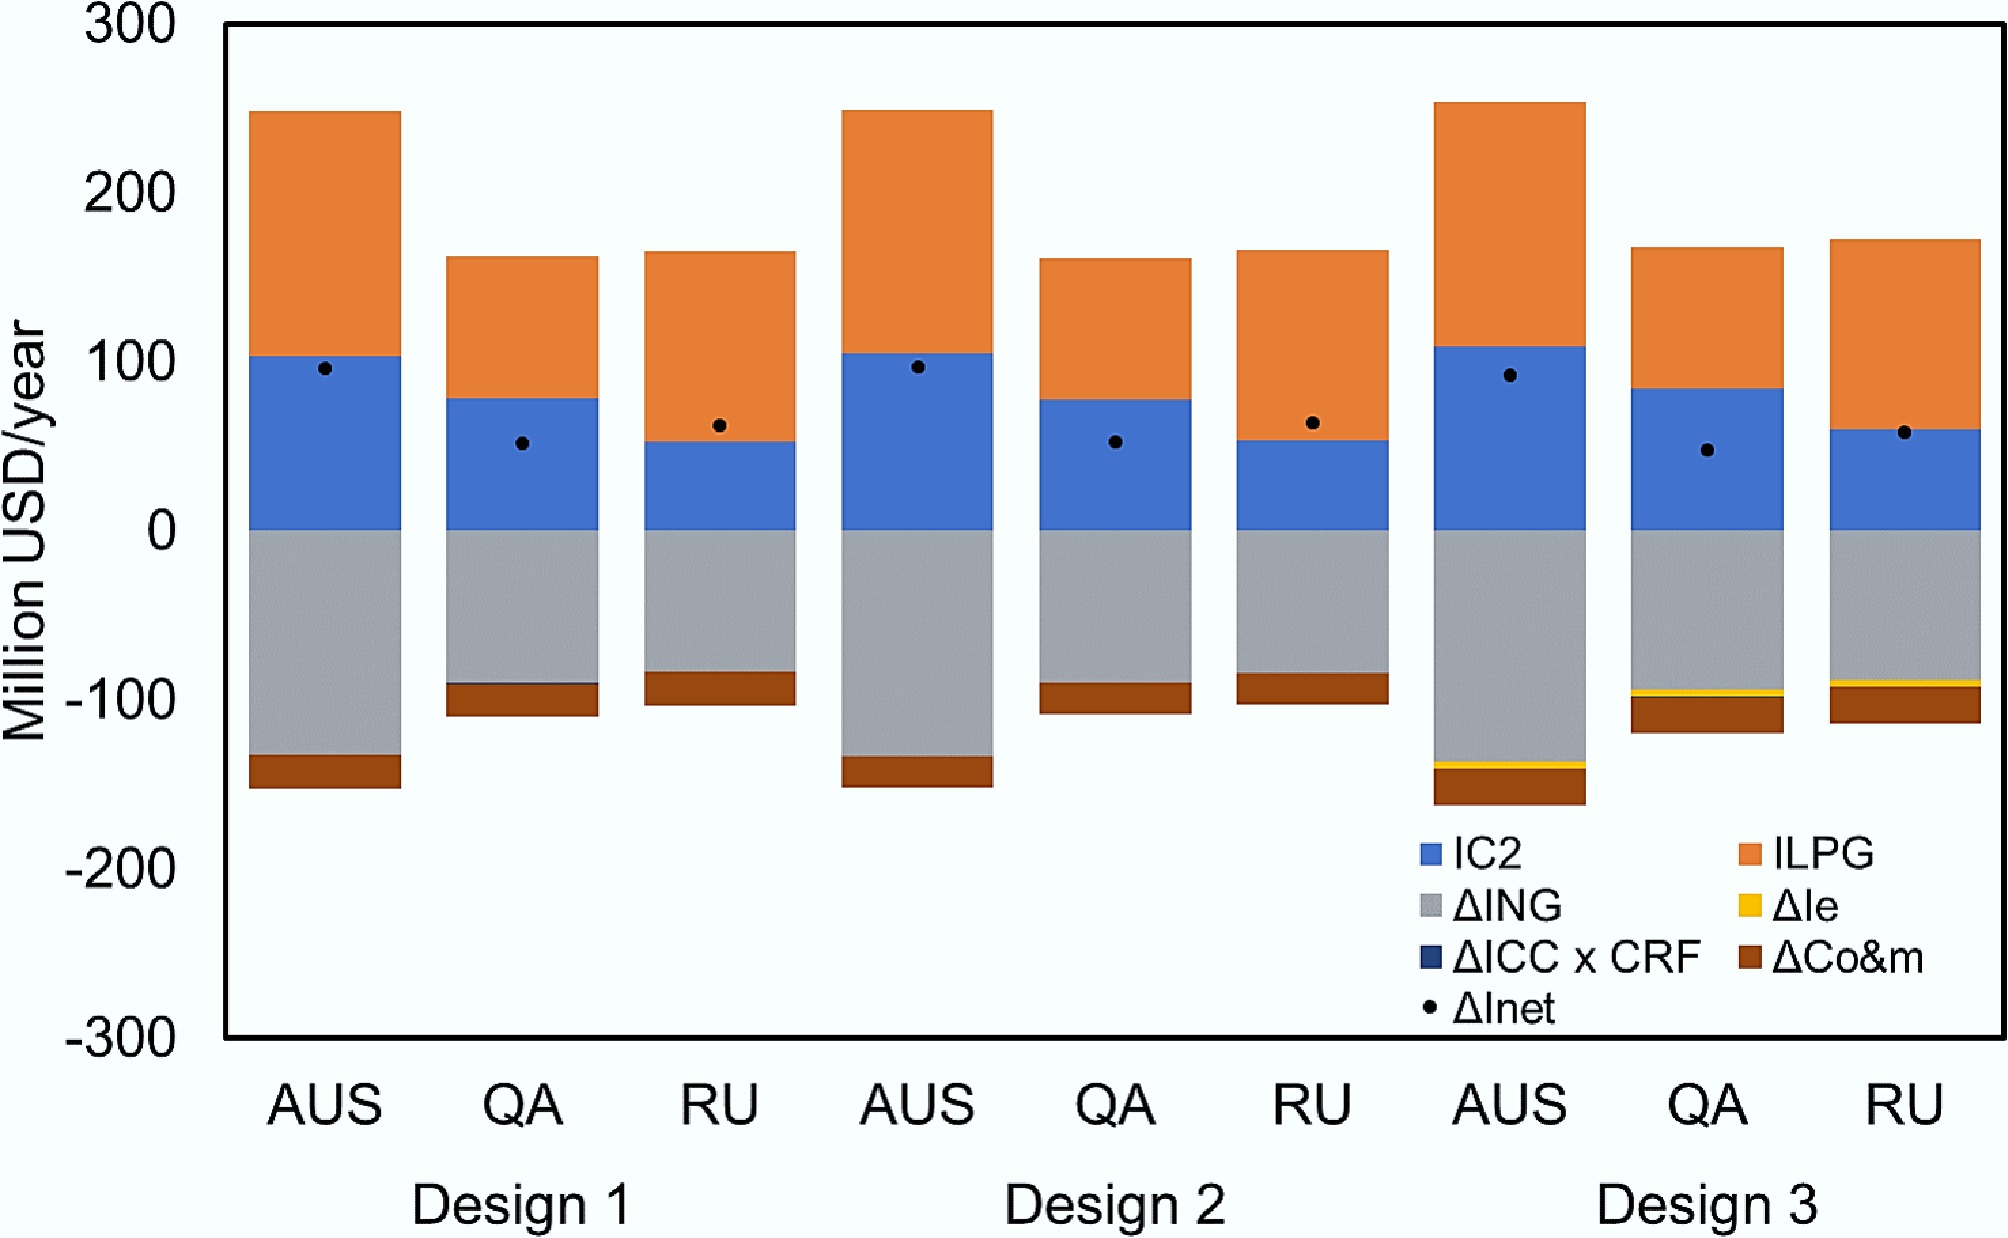
Figure 8.
Economic performances for LNG from different origins.
-
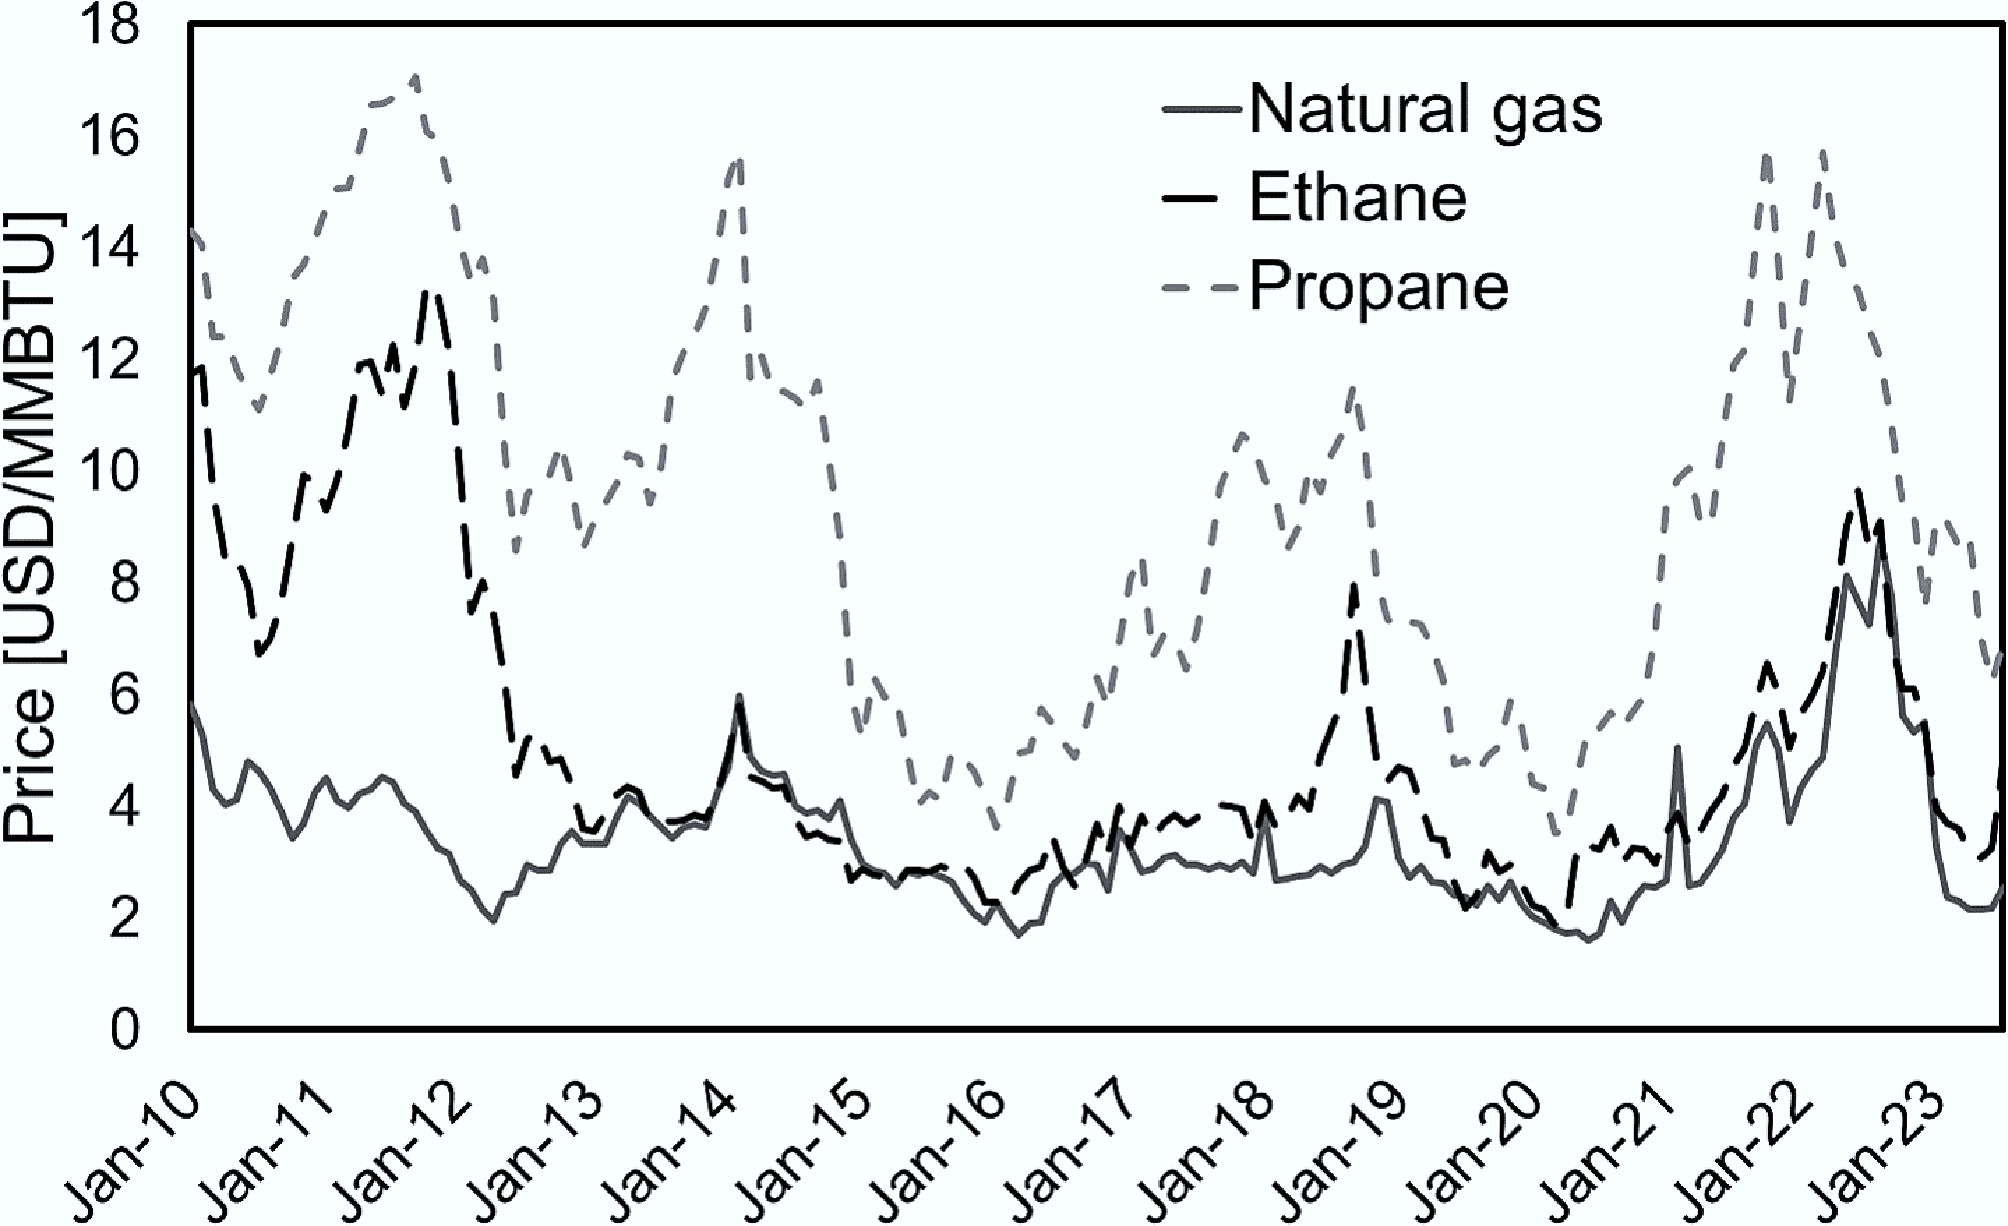
Figure 9.
Sales prices of natural gas and NGL (graph drawn based on EIA data[28]).
-
Hydrocarbon Composition (mol%)* Usage Australia (NWS) Qatar Russia (Sakhalin) USA (Alaska) Methane 87.33 90.91 92.53 99.71 Fuel Ethane 8.33 6.43 4.47 0.09 Fuel, petrochemical feedstock Propane 3.33 1.66 1.97 0.03 Fuel, coolant, solvent, petrochemical feedstock Butane 0.97 0.74 0.95 0.01 Fuel, aerosol propellant, petrochemical feedstock * The values do not add up to 100% as there are other elements in trace quantities. NWS: North West Shelf. Table 1.
Concentrations and usages of major hydrocarbons in LNG from different origins
-
Demethanizer Deethanizer Heat source LNG flow (t h–1) Profit (mUSD ${\bf\$} $ Ref. P (MPa) T (°C) P (MPa) T (°C) 3 40 0.11 1 Combustion, seawater 127.2 505.2a [20] 2.4 30 0.11 1 Combustion, seawater 127.2 506.8a [20] 4.3 20 to 70 0.11 –20 to –35 Combustion, seawater 122.5 7.67b [22] 2.4 20 to 70 0.11 –20 to –35 Combustion, seawater 122.5 10.42b [22] 3.7 N/A N/Ac N/A Steam 435.7 15 [24] N/A N/A N/A N/A Steam, seawater 109.6 24.5 [25] a Total revenue, also included further separations of propane from C4+. b Converted from CNY to USD by the author. c Ethane and C3+ were not further separated. Table 2.
Summary of LNG fractionation designs
-
LNG terminal metric China Japan Receiving terminals design capacity (onshore) (MTPA) 94.87 213.48 LNG import in 2021 (MT) 79.3 74.3 Number of receiving terminals 22 33 Receiving terminal design capacity (average) (MTPA) 4.31 6.47 LNG received in 2021 (average per terminal) (MT) 3.6 2.25 MT, million tons; MTPA, million tons per annum. Table 3.
Scale of LNG receiving terminals in China and Japan[17]
-
Hydrocarbon product Requirement China US Natural gas Higher heating value ≥ 34.0 MJ m–3 a 37.4–45.3 MJ m–3[16] Ethane C2 liquid composition – ≥ 95 vol%c LPG Vapour pressure
at 37.8 °C< 1,380 kPab < 1,434 kpad C3 + C4 > 95 vol%b – a GB 17820-2018, b GB 11174-2011, c GPA Standard 2108-14 (2014a), d GPA Standard 2140-97. Table 4.
Typical requirements for sales gas in China and the US
-
Parameter Value Composition (mol%) Methane 87.33 Ethane 8.33 Propane 3.33 n-butane 0.97 Nitrogen 0.04 LNG storage pressure (kPa) 101.3 LNG storage temperature (°C) –162.7 LNG mass flow rate (kg h–1) 3.6 × 10⁵ NG pipeline pressure (kPa) 10,000 Table 5.
LNG feed conditions
-
Parameter Value Pump/turbine adiabatic efficiency (%) 75 Number of stages in demethanizer 10 Number of stages in deethanizer 10 Tray efficiency (%) 60 Pressure drop in demethanizer (kPa) 10 Pressure drop in deethanizer (kPa) 10 Pressure drop in the heat exchanger (kPa) 20 Maximum temperature of reboilers (°C) 0 Table 6.
A summary of key design parameters
-
Design 1 Design 2 Design 3 Optimum operation condition Demethanizer feed temperature (°C) –105.22 –106.06 –134 Demethanizer bottom pressure (kPa) 1,690 1,670 1,600 Separator boil-off ratio – 0.3936 – Deethanizer pressure (kPa) 380 380 380 Deethanizer reflux ratio 2.34 1.827 1.133 Energy balance LNG pump duty (kW) 457 448 468 NG pump/compressor duty (kW) 1,023 1,017 8,467 Reboiler heat flow (demethanizer) (kJ h–1) 8.04 × 10⁷ 7.85 × 10⁷ 1.56 × 10⁸ Reboiler heat flow (deethanizer) (kJ h–1) 6.78 × 10⁷ 5.68 × 10⁷ 4.28 × 10⁷ NG temperature (°C)a –80 –83.4 –37.49 Heat for warming NG (kJ h–1)a 1.06 × 10⁸ 1.19 × 10⁸ 2.89 × 10⁷ Mass flow (kg h–1)b Natural gas 276,037 275,596 273,663 Ethane 47,218 47,801 50,218 LPG 36,744 36,601 36,118 Total 360,000 360,000 360,000 Ethane recovery (%) 91.5 92.3 96.4 LPG recovery (%) 93.1 92.8 91.5 a Natural gas product is warmed to 0 °C before distributing through the pipeline. b All products comply with the typical specifications outlined in Table 3. Table 7.
Optimised operation conditions and simulation results for the three designs
-
Parameter Value Natural gas selling price (USD ${\$} $ 0.18 Ethane selling price (USD ${\$} $ 0.25 LPG selling price (USD ${\$} $ 0.45 Wholesale electricity cost (USD ${\$} $ 56.88 Discount rate (%) 3 Equipment lifespan (year) 20 Table 8.
Economic analysis parameters
-
Design 1 Design 2 Design 3 IC2 (mUSD ${\$} $ 103.41 104.69 109.08 ILPG (mUSD ${\$} $ 144.84 144.28 144.80 ΔING (mUSD ${\$} $ 132.39 133.09 136.46 ΔIe (mUSD ${\$} $ − − 4.02 ΔICC (mUSD ${\$} $ 2.36 2.74 5.42 CRF (%) 0.07 0.07 0.07 ΔICC × CRF (mUSD ${\$} $ 0.16 0.18 0.36 ΔCo&m (mUSD ${\$} $ 19.89 18.61 21.16 ΔInet (mUSD ${\$} $ 95.83 97.08 91.87 Table 9.
Economic analysis for the proposed designs
-
Design 1 Design 2 Design 3 Installed capital cost Demethanizer column (mUSD ${\$} $ 0.68 0.7 1.34 Deethanizer column (mUSD ${\$} $ 0.62 0.56 0.48 Deethanizer condenser (mUSD ${\$} $ 0.92 0.89 0.7 Heat exchanger (mUSD ${\$} $ 0.14 0.14 − NG compressor (mUSD ${\$} $ − − 2.89 Separator (mUSD ${\$} $ − 0.45 − Total (mUSD ${\$} $ 2.36 2.74 5.42 Operations and maintenance cost Demethanizer (mUSD ${\$} $ 6.1 5.97 12.19 Deethanizer (mUSD ${\$} $ 5.21 4.37 2.86 Heat exchanger (mUSD ${\$} $ 8.57 8.27 − NG compressor (mUSD ${\$} $ − − 6.11 Total (mUSD ${\$} $ 19.89 18.61 21.16 Table 10.
Breakdown of installed capital and operations and maintenance costs
-
Design 1 Design 2 Design 3 IC2 (mUSD ${\$} $ 54.19 54.86 57.16 ILPG (mUSD ${\$} $ 91.41 91.06 91.38 ΔING (mUSD ${\$} $ 130.92 131.61 134.94 ΔIe (mUSD ${\$} $ − − 4.02 ΔICC (mUSD ${\$} $ 2.36 2.74 5.42 CRF (%) 0.07 0.07 0.07 ΔICC × CRF (mUSD ${\$} $ 0.16 0.18 0.36 ΔCo&m (mUSD ${\$} $ 19.89 18.61 21.16 ΔInet (mUSD ${\$} $ (5.36) (4.49) (11.95) Table 11.
Economic analysis of the proposed designs at the lowest NGL sales prices
Figures
(9)
Tables
(11)