


-
Natural gas has been the fastest-growing fossil energy resource over the past few decades and is now the third most widely used fossil fuel in the energy sector after coal and oil[1,2]. With low sulphur levels, natural gas combustion produces much less environmentally harmful gases than coal and oil, and thus, it is considered the cleanest form of fossil fuel[3]. While there are various methods for natural gas transportation, transport via liquefied natural gas (LNG) is currently the most mature and economical when long-distance offshore transmission is required[4−6]. The LNG industry is, therefore, particularly important to gas exporters who are geographically remote from their major customers. In a liquefaction plant, natural gas is cooled to approximately –162 °C, causing it to transition into a condensed liquid phase. During this phase change, the volume of the gas is reduced by a factor of 600[4], making it much more compact and easier to transport. While the high energy density favours long-distance transportation, the liquefaction process involves multiple refrigeration cycles and is one of the most energy-intensive processes in the LNG value chain[4,7]. A typical liquefaction plant consumes over 1,600 kJ kg–1 (CH4) energy during the liquefaction process, of which a significant portion is dissipated as heat during the refrigeration cycles. However, around 830 kJ kg–1 is reserved as cold energy in LNG[8−11]. Much of the cold energy is often wasted in regasification terminals where LNG is warmed using water (seawater), ambient air, or combustion utilities. This vast quantity of potentially usable energy offers the potential for the development of economically viable cold energy utilization facilities. In fact, nearly half of the ongoing research in the realm of optimizing LNG receiving terminals is dedicated to exploring the usability of cold energy[12]. Various applications have been proposed to effectively utilise this otherwise wasted low-temperature resource, including power generation, air separation, hydrocarbon recovery, seawater desalination, and cryogenic carbon dioxide capture[13,14]. Despite the existence of various alternatives, many of them remain theoretical, with a small fraction of the global potential of cold energy in LNG currently being utilized[15].
Among the possible applications, recovering higher hydrocarbons from LNG is particularly valuable in areas with thriving petrochemical industries, as these hydrocarbons can serve as direct chemical feedstocks, offering greater value than natural gas as a fuel[16]. In certain situations, the concentrations of C2+ in LNG can remain substantial despite prior processing before liquefaction. Table 1 shows the compositions[17] and usages[18,19] of the major hydrocarbons in LNG with different origins. The studies of recovering hydrocarbons from LNG began in the 1960s when hydrocarbon removal was used to control the heating value of the regasified LNG[20]. However, more recent studies have usually focused on the economic aspect of marketing the extracted hydrocarbons[21−23]. The cryogenic recovery of hydrocarbons from LNG eliminates the need for energy-intensive cooling processes required in conventional gas processing plants[19], since LNG is already in a liquid state, significantly reducing energy consumption.
Table 1. Concentrations and usages of major hydrocarbons in LNG from different origins
Hydrocarbon Composition (mol%)* Usage Australia (NWS) Qatar Russia (Sakhalin) USA (Alaska) Methane 87.33 90.91 92.53 99.71 Fuel Ethane 8.33 6.43 4.47 0.09 Fuel, petrochemical feedstock Propane 3.33 1.66 1.97 0.03 Fuel, coolant, solvent, petrochemical feedstock Butane 0.97 0.74 0.95 0.01 Fuel, aerosol propellant, petrochemical feedstock * The values do not add up to 100% as there are other elements in trace quantities. NWS: North West Shelf. The most straightforward configuration of hydrocarbon recovery during regasification is shown in Fig. 1. LNG is fed into the top stage of the demethanizer after being pressurized with a pump and warmed in a heat exchanger. The gaseous product from the top, rich in methane, is cooled and condensed back to a liquid state via heat exchange with the cold LNG stream. This conversion of gas to liquid allows the use of pumps instead of compressors, as this natural gas product usually requires further pressurization for distribution.
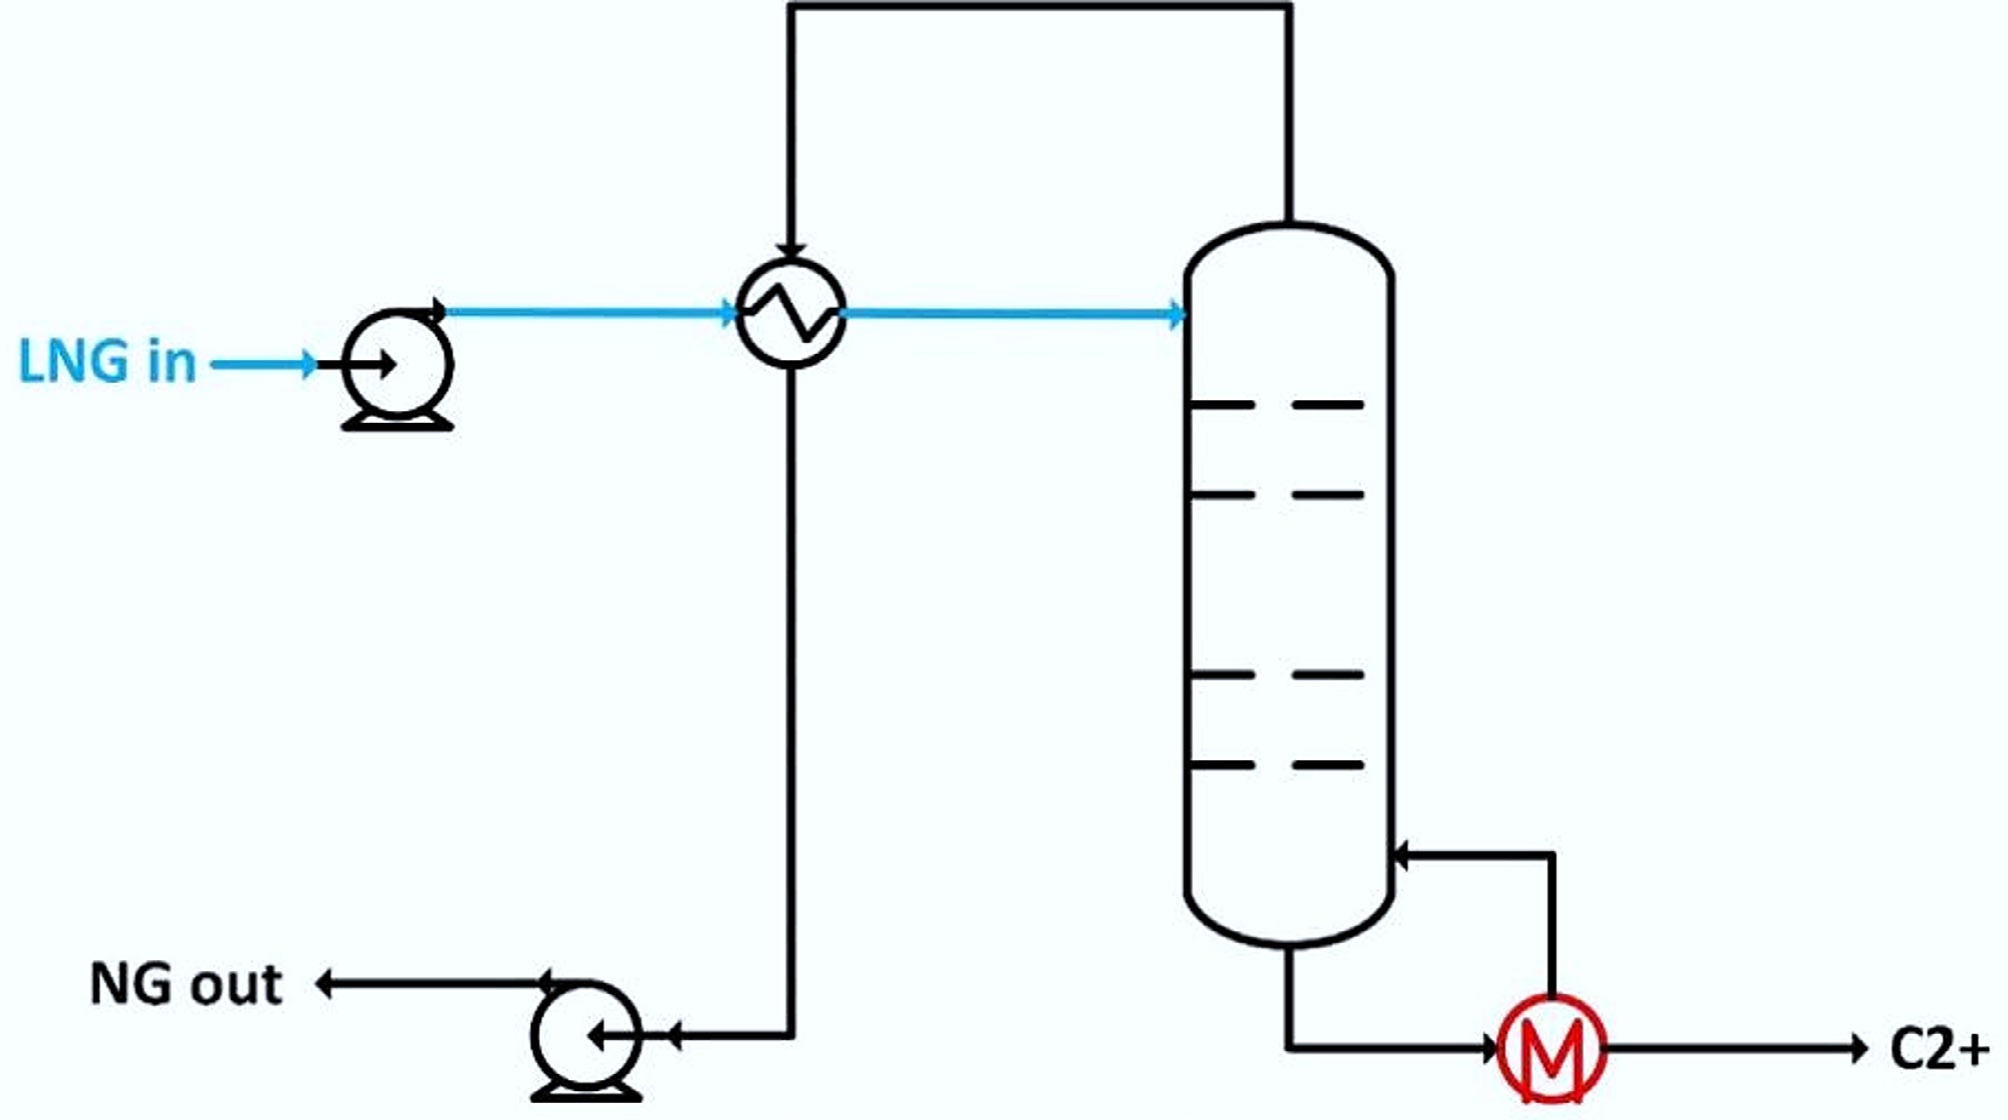
Figure 1.
Simplest configuration of hydrocarbons recovery during regasification.
One of the major design parameters in a demethanizer is the operating pressure. A higher operation pressure reduces the compression costs of methane, but a higher reboiler temperature is required as the relative volatility is reduced at higher pressure. In contrast, a lower operating pressure allows a lower reboiler temperature, but the compression costs of methane increase. For this reason, some researchers included both low- and high-pressure designs and compared their performance in terms of efficiency and cost[20,22,24]. Table 2 summarises some designs from the literature with their corresponding operation conditions, heat sources, and estimated profits. It is, however, noticed that the profits serve only as a reference, as both costs and revenues can vary significantly across jurisdictions. Partial combustion of LNG or high-temperature steam is usually implemented to provide the required heat to the demethanizer reboiler.
Table 2. Summary of LNG fractionation designs
Demethanizer Deethanizer Heat source LNG flow (t h–1) Profit (mUSD${\bf\$} $ a–1) Ref. P (MPa) T (°C) P (MPa) T (°C) 3 40 0.11 1 Combustion, seawater 127.2 505.2a [20] 2.4 30 0.11 1 Combustion, seawater 127.2 506.8a [20] 4.3 20 to 70 0.11 –20 to –35 Combustion, seawater 122.5 7.67b [22] 2.4 20 to 70 0.11 –20 to –35 Combustion, seawater 122.5 10.42b [22] 3.7 N/A N/Ac N/A Steam 435.7 15 [24] N/A N/A N/A N/A Steam, seawater 109.6 24.5 [25] a Total revenue, also included further separations of propane from C4+. b Converted from CNY to USD by the author. c Ethane and C3+ were not further separated. Previous studies have primarily focused on the recovery of higher hydrocarbons using heat sources such as LNG boil-off gas combustion, process water, or industrial waste heat. However, these approaches often require additional infrastructure, high-temperature utilities, or are limited by site-specific heat availability, which restricts their wider application at LNG receiving terminals. In contrast, the present study explores the use of seawater as a sustainable, readily available heat source for both the demethanizer and deethanizer columns. This approach eliminates the need for high-temperature heat utilities and allows direct integration with existing open-rack vaporizer systems commonly used at regasification terminals.
This paper proposes and systematically compares three alternative process configurations in terms of hydrocarbon recovery and economic performance. Design 1 and 2 employ high-pressure operation and effective internal heat integration to maximise the recovery of cold energy, while design 3 adopts a low-pressure configuration that enhances component separation at the expense of higher compression energy. This work extends the existing knowledge on LNG hydrocarbon recovery by examining the impacts of seawater heating and thermodynamic configuration on process performance and profitability.
-
To evaluate and compare the economic feasibility of alternative process designs for recovering higher hydrocarbons from LNG during regasification, separation effectiveness and profitability are considered the key performance indicators. In contrast to previous work, where the combustion of LNG boil-off, process water, and waste heat from nearby industrial estates were used as heat sources, seawater at ambient temperature was employed as the heat source for both demethanizer and deethanizer columns in all of the proposed designs. It is assumed that basic equipment, such as LNG pumps, seawater pumps, and seawater heat exchangers are already available, and procurement of this equipment is not required, as they are already in use in a traditional open rack vaporizer[26]. It should be stressed that the present study aims to provide a conceptual comparison of alternative design configurations using typical industrial parameters, rather than to reproduce or benchmark a specific LNG terminal.
Scale of production and sales specifications
-
It is noted that the costs and values of the recovery systems highly depend on the scale of production and the corresponding regional demands of the products. For instance, China and Japan are two major LNG importers, and their corresponding receiving terminal scales can serve as references in this study, as shown in Table 3[17].
Table 3. Scale of LNG receiving terminals in China and Japan[17]
LNG terminal metric China Japan Receiving terminals design capacity (onshore) (MTPA) 94.87 213.48 LNG import in 2021 (MT) 79.3 74.3 Number of receiving terminals 22 33 Receiving terminal design capacity (average) (MTPA) 4.31 6.47 LNG received in 2021 (average per terminal) (MT) 3.6 2.25 MT, million tons; MTPA, million tons per annum. Similarly, the demands and requirements for higher hydrocarbons differ between jurisdictions. While the exact sales gas specifications usually depend on the contracts, some typical requirements in China and the US are outlined in Table 4. With the assumption that LNG has undergone upstream processes before liquefaction, the heating value of natural gas after the separation of higher hydrocarbons becomes the only concern. On the other hand, ethane and LPG (propane-butane mixture) generally require a component content of over 95 vol% of C2 and C3/C4 in the products.
Table 4. Typical requirements for sales gas in China and the US
Hydrocarbon product Requirement China US Natural gas Higher heating value ≥ 34.0 MJ m–3 a 37.4–45.3 MJ m–3[16] Ethane C2 liquid composition – ≥ 95 vol%c LPG Vapour pressure
at 37.8 °C< 1,380 kPab < 1,434 kpad C3 + C4 > 95 vol%b – a GB 17820-2018, b GB 11174-2011, c GPA Standard 2108-14 (2014a), d GPA Standard 2140-97. Proposed designs
-
This study analysed and compared three designs with their corresponding schematic diagrams shown in Figs 2−4. As mentioned in previously, a demethanizer can be operated at either high temperature and high pressure, or low temperature and low pressure. The first two designs in this paper focused on effectively utilising cold energy and operating at higher temperatures and pressures. In comparison, the third design operated at lower temperatures and pressures, aiming at attaining a better separation. Designs 1 and 3 were relatively fundamental designs, while design 2 was a modification of design 1. Although the two designs have been studied in some literature, this work focused on using seawater as the heat source for both columns.
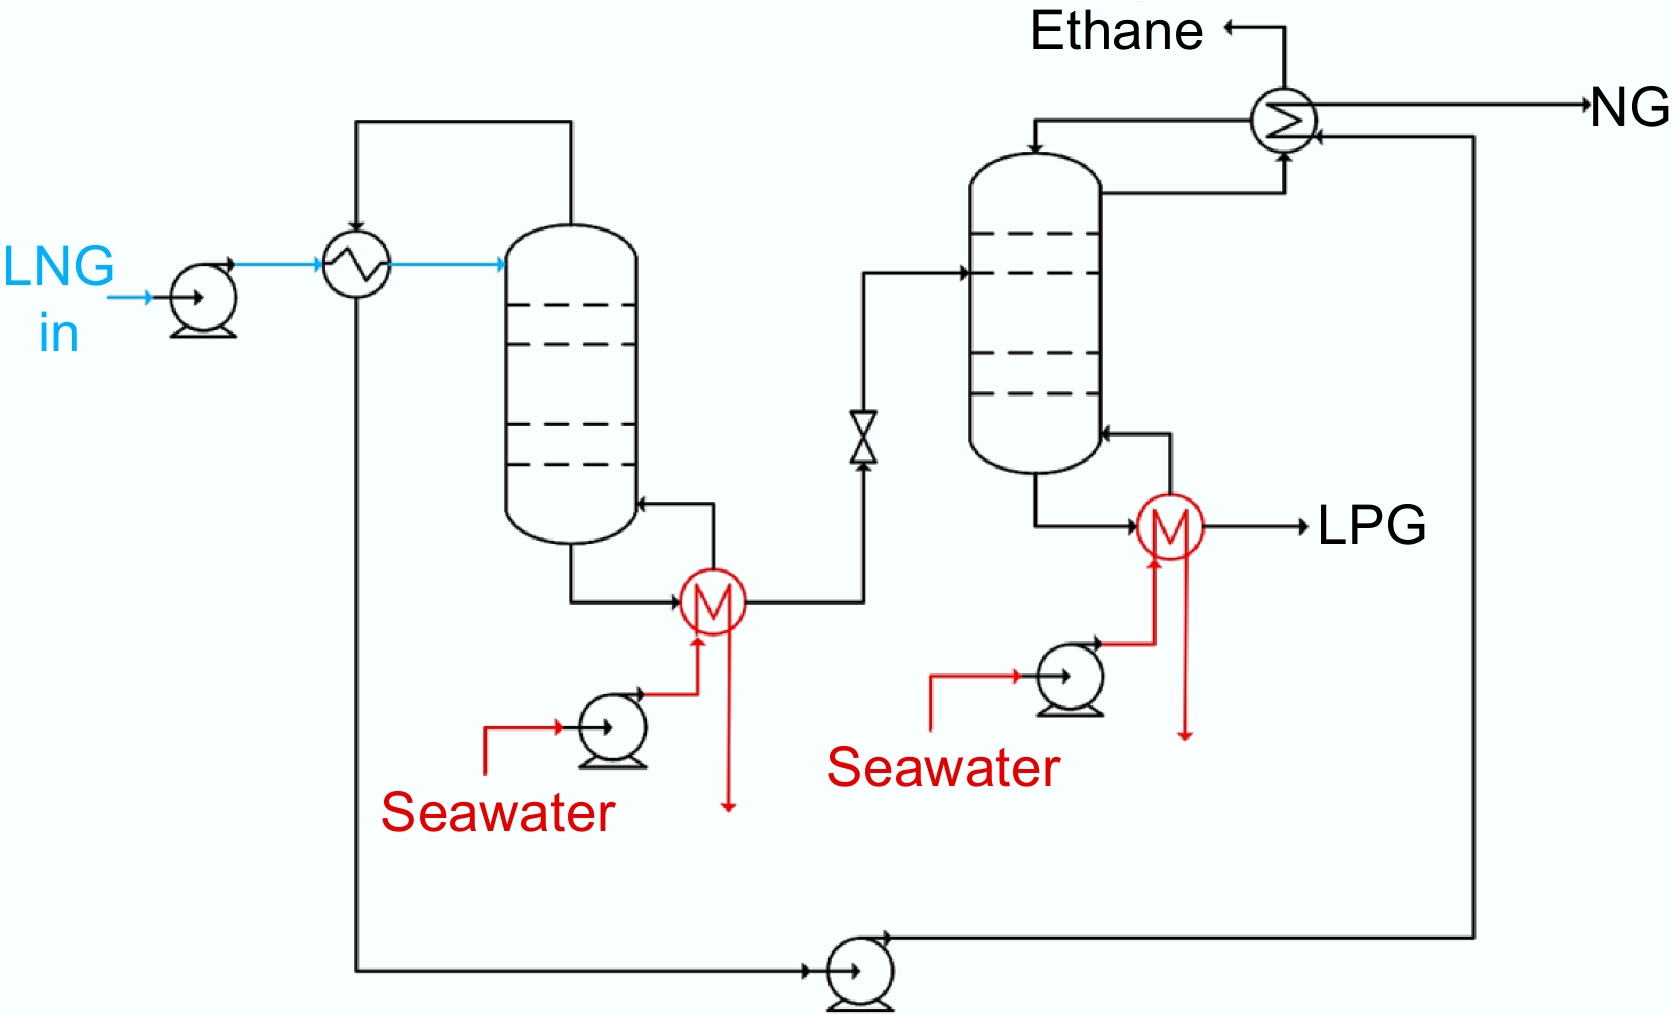
Figure 2.
Hydrocarbons recovery from LNG, design 1.
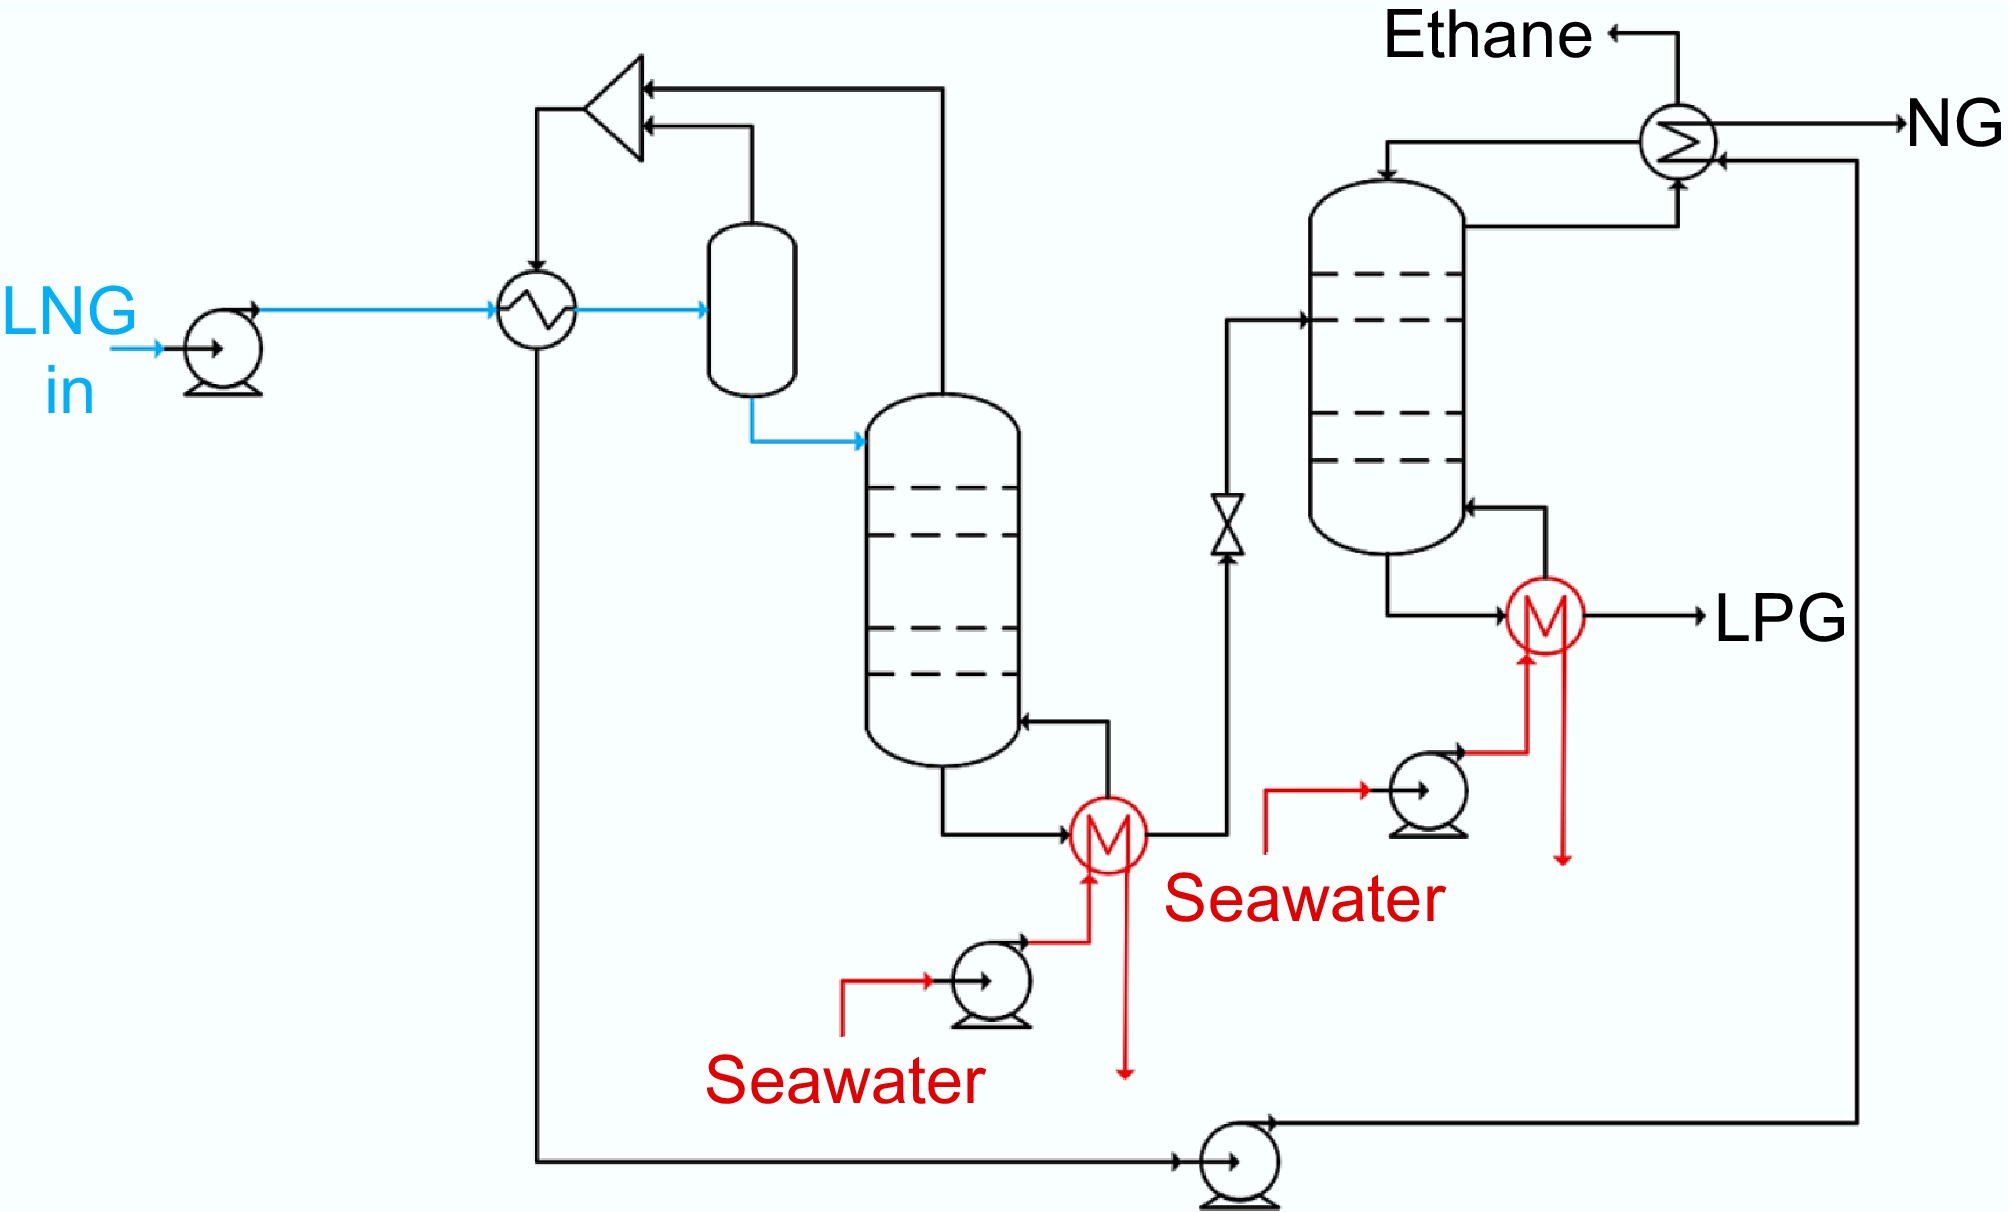
Figure 3.
Hydrocarbons recovery from LNG, design 2.
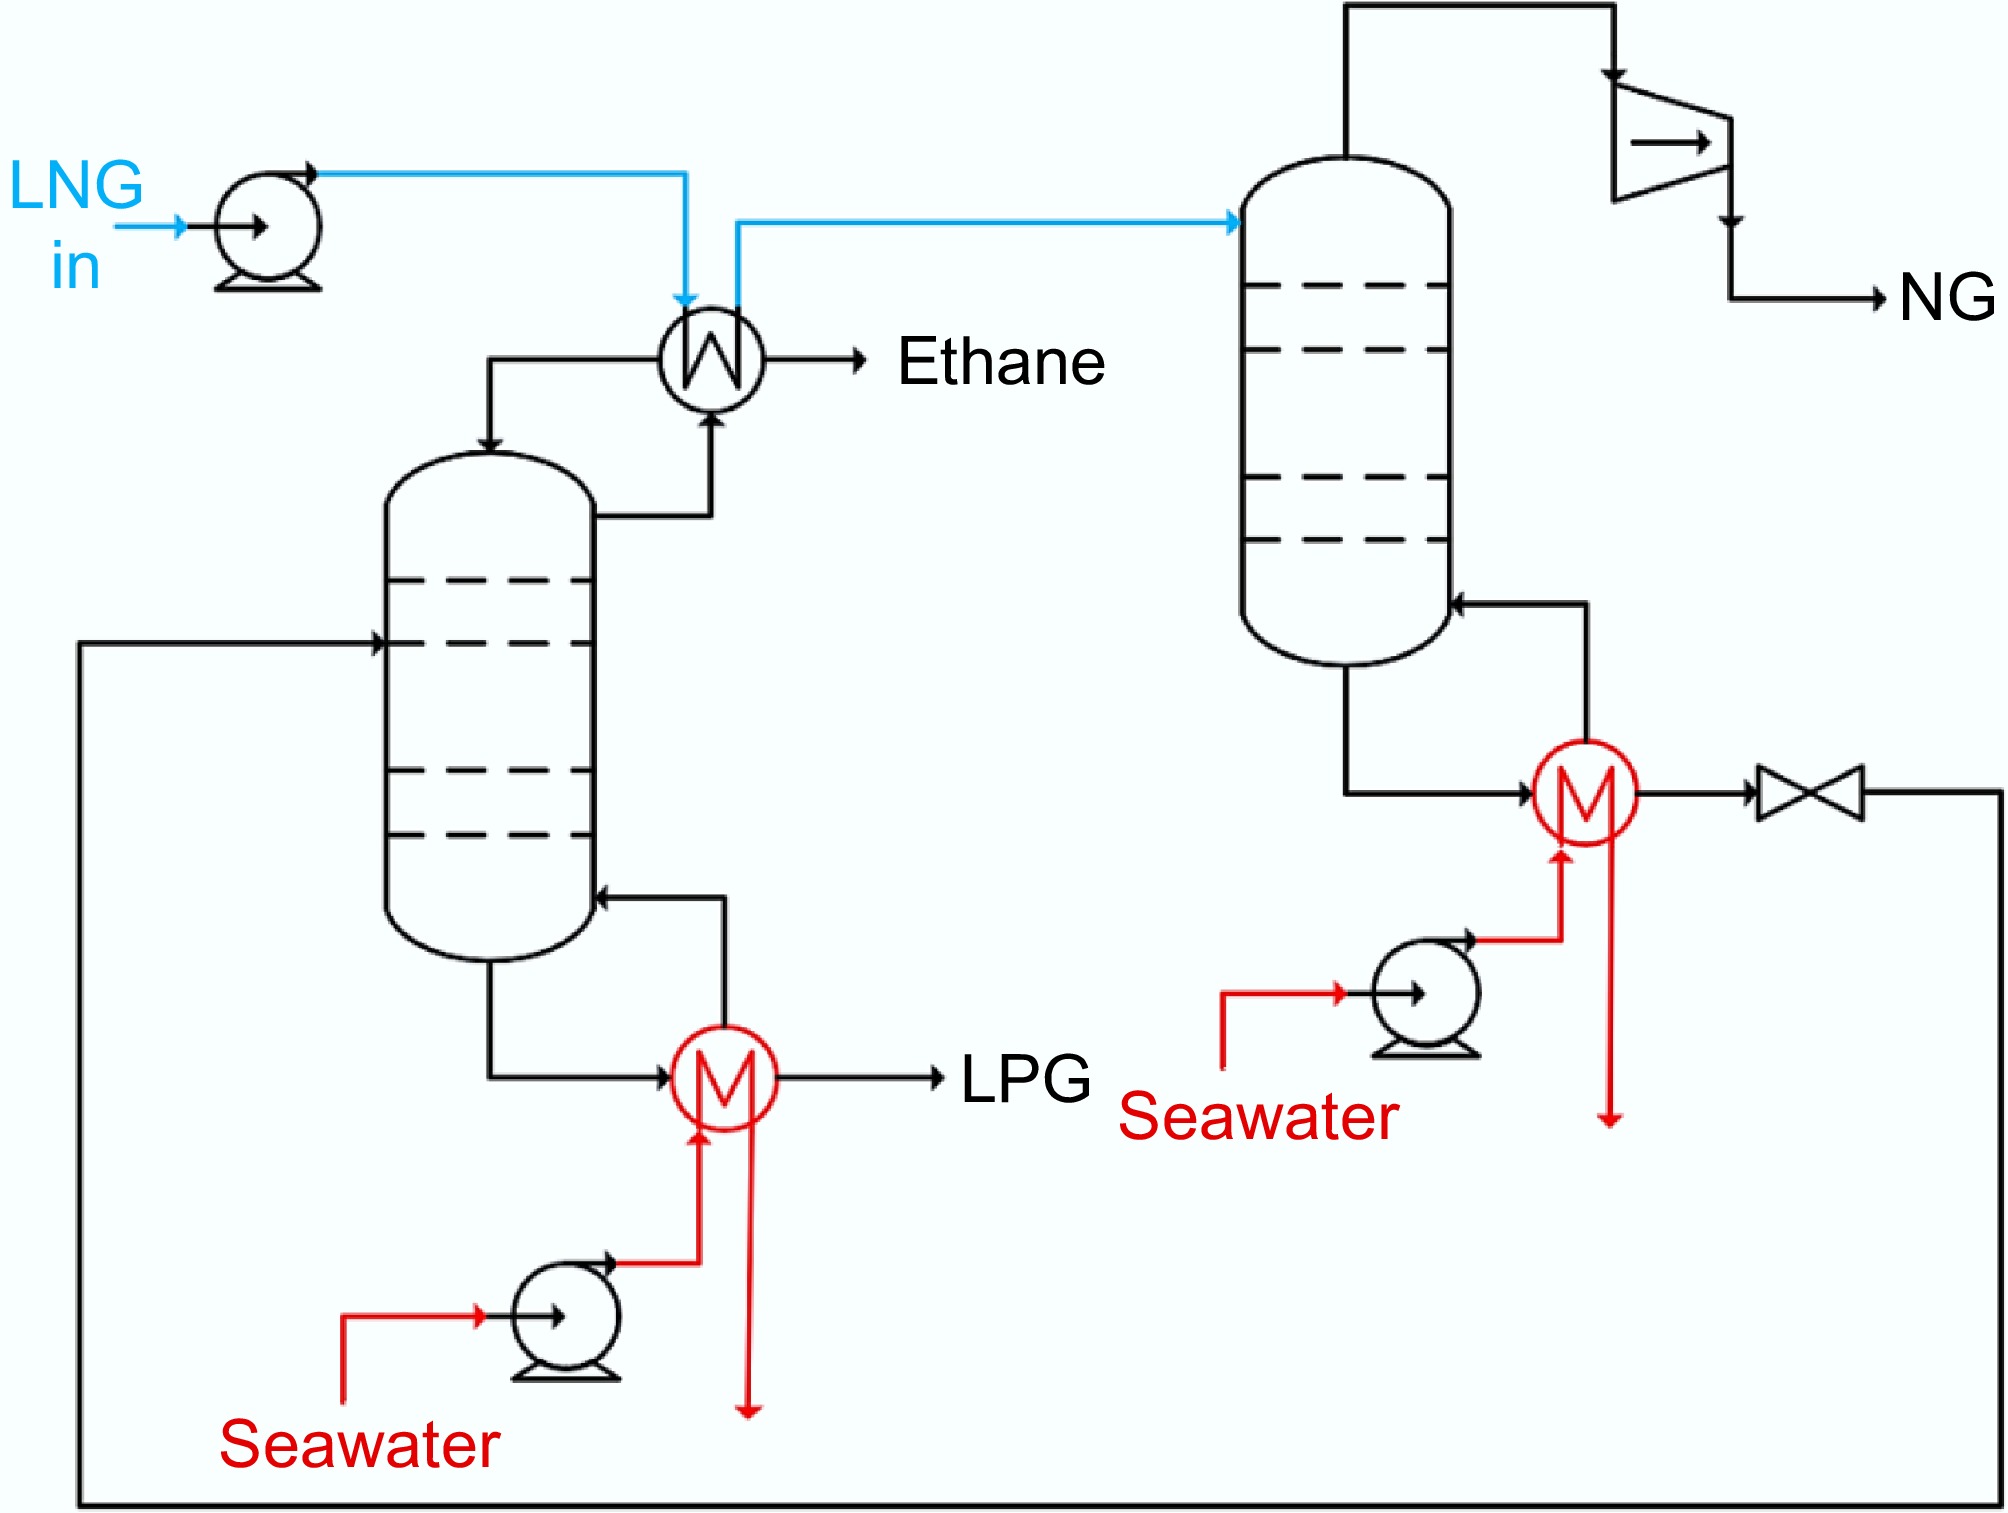
Figure 4.
Hydrocarbon recovery from LNG, design 3.
In the first design, LNG was first pressurised and then slightly warmed to a two-phase mixture before entering the demethanizer column. This heat exchange operation also cooled and condensed the overhead methane-rich gas back to a liquid state, which allowed the use of a pump to further pressurise it to the distribution pressure. The bottom product, which was rich in heavy hydrocarbons, then expands through a valve and enters the deethanizer column. This column further separated ethane from propane and butane. This design utilised cold energy through effective heat transfer between different streams. The cooling and condensation of the overhead stream significantly reduced compression costs, and the cold natural gas provides the required cooling for the condenser.
The second design was similar to the first, with the addition of a two-phase separator preceding the demethanizer. The pressurised LNG passed through the heat exchanger and then entered the separator. The liquid product from the separator was then fed into the demethanizer. The gas products from the separator and demethanizer were mixed and then condensed through the heat-exchanging process with the pressurised LNG stream. The remaining operations were identical to those in design 1. While the separator did not remove methane from the remaining liquid as effectively as in a distillation column, the removal of a significant amount of methane gas reduced the quantity of liquid entering the distillation column. This implied that a smaller column may be implemented, reducing capital and operational costs.
In the third design, the pressurised LNG stream first served as the cooling medium for the condenser of the deethanizer. It then entered the demethanizer column directly. The methane-rich overhead product from the demethanizer was compressed to distribution pressure by a compressor. The bottom product of the column then expanded through an expansion valve and entered the deethanizer column, where it was further separated into ethane and LPG. This design did not utilise cold energy as efficiently as the first two designs. For instance, the heat exchange process in the condenser involved a larger temperature difference than that in the heat exchangers in the first two designs, as the ethane stream was at a higher temperature than the overhead streams. The use of a compressor instead of a pump also incurred much higher operational costs. However, as the LNG entered the demethanizer at a lower temperature, better separation could be obtained, and more heavy hydrocarbons were recovered from LNG in this design.
Feed conditions and design parameters
-
The LNG feed conditions and the design parameters are listed in Tables 5 and 6, respectively.
Table 5. LNG feed conditions
Parameter Value Composition (mol%) Methane 87.33 Ethane 8.33 Propane 3.33 n-butane 0.97 Nitrogen 0.04 LNG storage pressure (kPa) 101.3 LNG storage temperature (°C) –162.7 LNG mass flow rate (kg h–1) 3.6 × 10⁵ NG pipeline pressure (kPa) 10,000 Table 6. A summary of key design parameters
Parameter Value Pump/turbine adiabatic efficiency (%) 75 Number of stages in demethanizer 10 Number of stages in deethanizer 10 Tray efficiency (%) 60 Pressure drop in demethanizer (kPa) 10 Pressure drop in deethanizer (kPa) 10 Pressure drop in the heat exchanger (kPa) 20 Maximum temperature of reboilers (°C) 0 -
The primary optimisation parameters include the operating pressures and temperatures of the two columns. The reboilers' temperatures are set to 0 °C for all the designs. This specification allows effective heat transfer between the hydrocarbons and seawater since seawater temperatures rarely drop below 10 °C. While a lower reboiler temperature is still feasible, it requires the columns to be operated at lower pressures, increasing the compression costs afterwards. Besides, natural gas and ethane products must be regasified before further delivery, and warming them in the distillation columns is more energy efficient than in separate heat exchangers in downstream operations. However, this assumption holds only when the recovery of hydrocarbons is the sole application of cold energy, and all products must be warmed to ambient temperature.
In contrast, operating the distillation columns at lower temperatures and lower pressures reserves more cold energy in the cold streams, which provides possibilities for implementing other applications in the system. For instance, previous researchers have further proposed integrating an air separation unit with the hydrocarbon recovery system to utilise cold energy in LNG[27]. All of the proposed designs in this work were simulated using Aspen HYSYS simulation software. Meanwhile, the Aspen Simulation Workbook add-in and built-in Visual Basic function in Microsoft Excel are used to control the repetitive fine-tunings.
Designs 1 and 2
-
The optimisation processes for designs 1 and 2 involved simulating the two distillation columns separately. This approach was adopted because the downstream operations do not affect the operations of the demethanizer columns in these two designs. Hence, the optimum operating conditions of the columns can be found without simulating the second column simultaneously. The demethanizer columns were simulated over a range of operating pressures with the reboiler temperature set to 0 °C. The optimum operation conditions were obtained when the minimum quantity of ethane remained in the overhead streams. The deethanizer columns were then simulated with the bottom products of the demethanizer as the feed streams. A molar concentration of 95 mol% of ethane in the overhead products was set as a design specification to comply with sales specifications. The maximum amount of ethane was extracted to minimise the amount of ethane remaining in LPG, as excess ethane in LPG may not meet sales gas specifications. The simulation results of the demethanizer columns for designs 1 and 2 are shown in Fig. 5. While the quantity of methane in the bottom product is not as critical, it should be noted that almost all methane in the bottom product remains in the ethane product as the deethanizer will not further separate methane from ethane. For this reason, the methane in the bottom product should not exceed 2% to 3%.
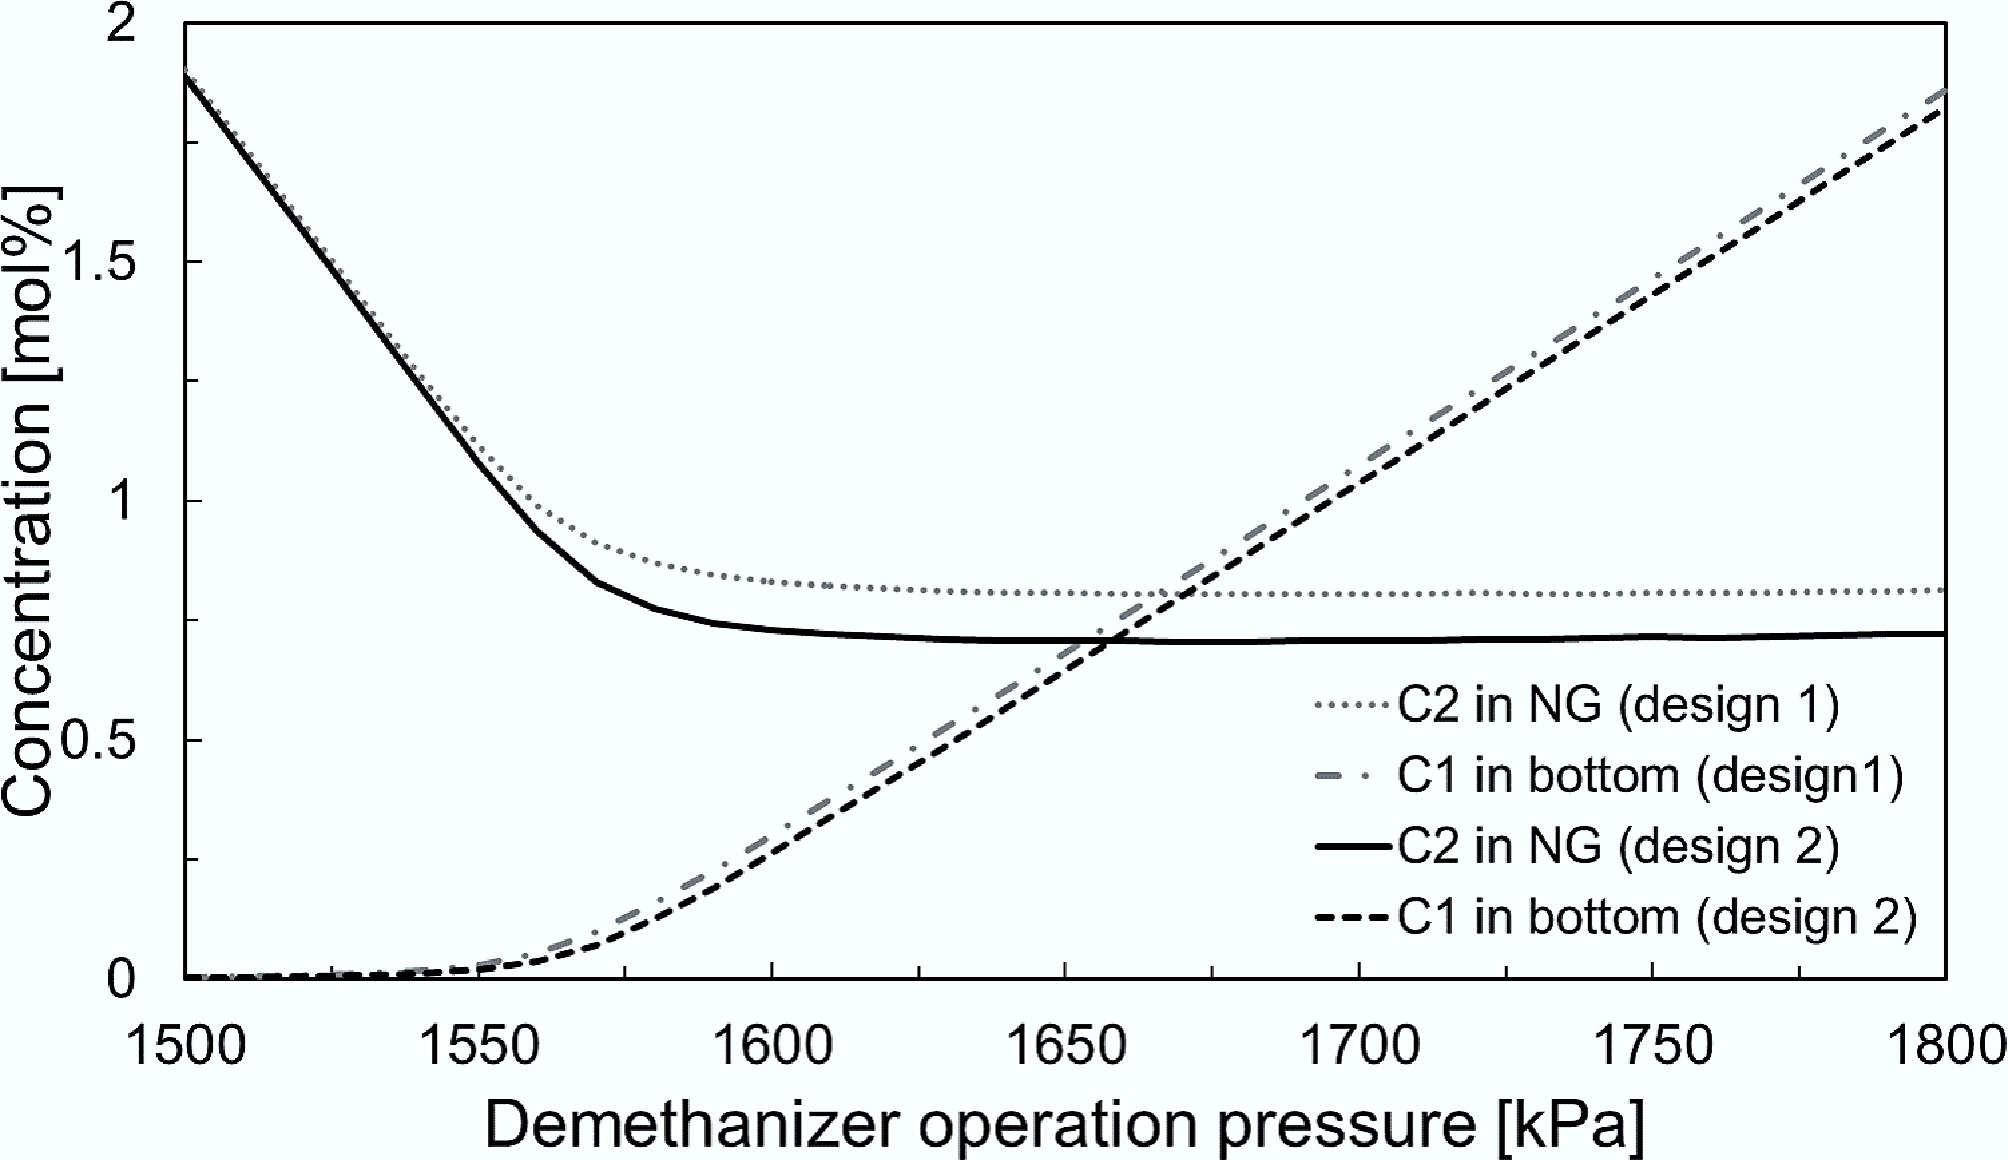
Figure 5.
Concentrations of methane and ethane in bottom and overhead streams at different operation pressures in demethanizer for designs 1 and 2.
Overall, the two designs performed similarly, with design 2 extracting slightly more ethane from LNG. At low pressures, significant amounts of ethane remained in the overhead streams, while very little methane was left in the bottom streams. The results indicate that the relative volatilities are high at these pressures, and the demethanizers are separating ethane from propane instead. With the increase in operation pressure, more ethane was recovered from the LNG until a plateau was reached, where further increasing the pressure did not show a significant difference. The optimum operating pressures for the demethanizer columns were 1,690 and 1,670 kPa, where 0.8 mol% and 0.71 mol% of ethane remained in the overhead streams for designs 1 and 2, respectively.
As for the deethanizer columns, the two designs yielded almost identical results, where the ethane remaining in the LPG streams increased linearly with the operating pressures. The optimum ethane recovery was achieved at an operating pressure of 380 kPa, as the minimum ethane remained in the bottom products. Neither design could obtain a convergent result for pressures below 380 kPa, as further reduction of the operation pressure causes excessive C3 to remain in the top product.
Design 3
-
In design 3, LNG first served as the cooling medium for the deethanizer before entering the demethanizer column, which indicated that the simulation results of the demethanizer column depended on the downstream operations. As a result, the two distillation columns could not be simulated separately as they affected each other's performance. Simulations from previous designs revealed that with the deethanizer reboiler temperature specified at 0 °C, the lower the operating pressure, the greater the ethane recovery from LPG. However, in design 3, the lower deethanizer operating pressure suggested that more heat would be discharged from the condenser to the LNG. This implied that the LNG would enter the demethanizer column at a higher temperature, which would be unfavourable for the methane separation. Therefore, the optimization of design 3 involves simulating the entire design at different demethanizer and deethanizer operating pressures simultaneously. Therefore, instead of comparing ethane contents in the bottom and LPG streams, the performance is compared directly in terms of ethane production rate.
The design was simulated at different demethanizer operating pressures from 1,560 to 1,700 kPa, with deethanizer pressure varied from 380 to 420 kPa. The results are shown in Fig. 6. In general, the variations of deethanizer pressures affected ethane production linearly, as indicated by the equal spacing between the lines. This was because the flow rate of the deethanizer was much lower than that of the demethanizer, and the variations in deethanizer pressures did not affect the performance of the demethanizer. However, with the deethanizer operating at 380 kPa, the ethane production decreased rapidly when the demethanizer operating pressure increased. As similar patterns were demonstrated at higher deethanizer pressures, it was hypothesised that at a lower deethanizer pressure, the influence from the deethanizer became more substantial as the demethanizer pressure increased, and ethane production rate was not a simple function of either pressure. Nevertheless, the maximum amount of ethane was produced with the demethanizer operating at 1,600 kPa and the deethanizer operating at 380 kPa.
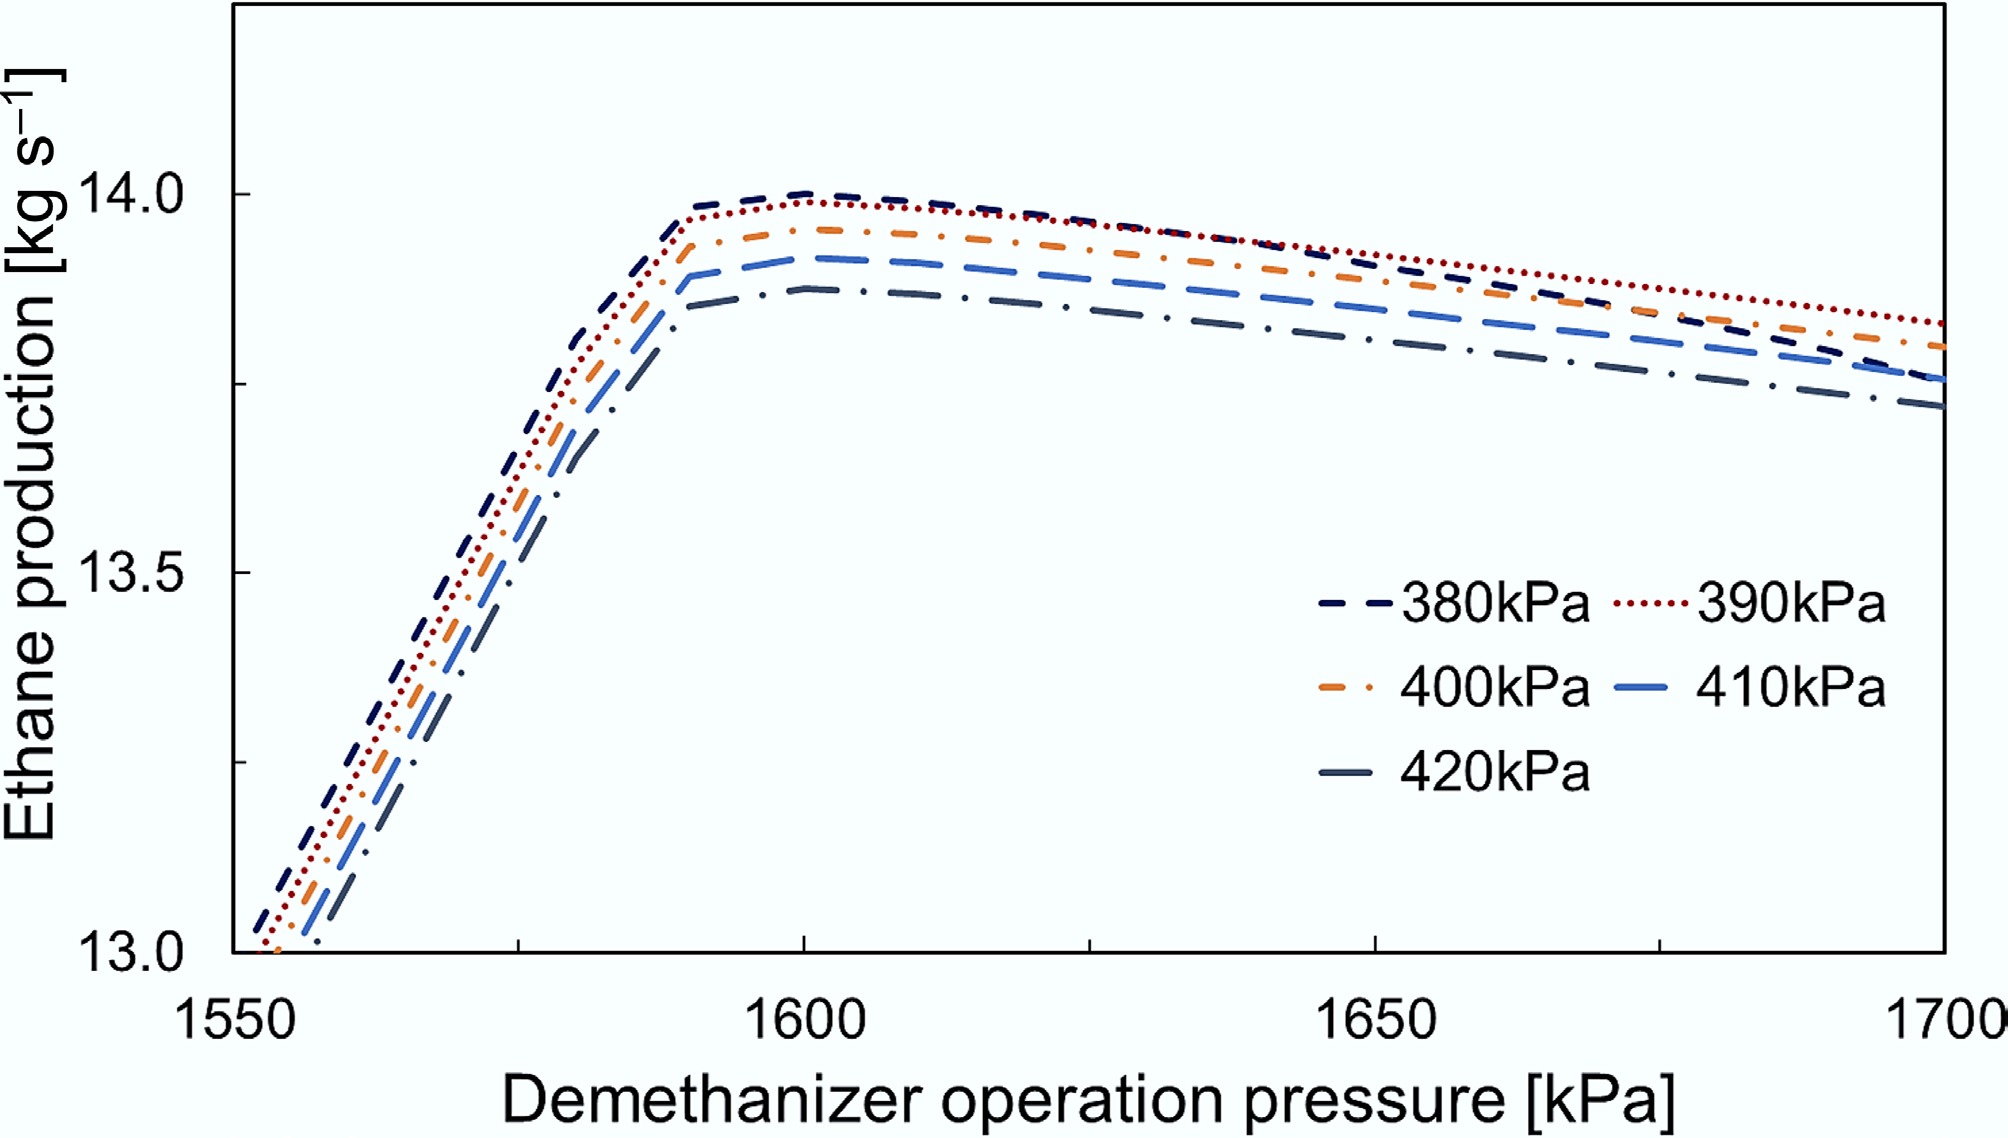
Figure 6.
Production of ethane at different demethanizer and deethanizer operating pressures.
Comparison of the three designs
-
The comparisons of the simulation results are shown in Table 7. Among the three proposed designs, designs 1 and 2 showed similar results for both energy and material streams, with less than 5% difference for most parameters. This was because the only difference between the two designs was the addition of a separator before the demethanizer, which functioned similarly to an extra distillation stage. As a result, the energy and material balances of the two designs were similar. The discrepancies between the two designs emerged when the sizes of the equipment were considered.
Table 7. Optimised operation conditions and simulation results for the three designs
Design 1 Design 2 Design 3 Optimum operation condition Demethanizer feed temperature (°C) –105.22 –106.06 –134 Demethanizer bottom pressure (kPa) 1,690 1,670 1,600 Separator boil-off ratio – 0.3936 – Deethanizer pressure (kPa) 380 380 380 Deethanizer reflux ratio 2.34 1.827 1.133 Energy balance LNG pump duty (kW) 457 448 468 NG pump/compressor duty (kW) 1,023 1,017 8,467 Reboiler heat flow (demethanizer) (kJ h–1) 8.04 × 10⁷ 7.85 × 10⁷ 1.56 × 10⁸ Reboiler heat flow (deethanizer) (kJ h–1) 6.78 × 10⁷ 5.68 × 10⁷ 4.28 × 10⁷ NG temperature (°C)a –80 –83.4 –37.49 Heat for warming NG (kJ h–1)a 1.06 × 10⁸ 1.19 × 10⁸ 2.89 × 10⁷ Mass flow (kg h–1)b Natural gas 276,037 275,596 273,663 Ethane 47,218 47,801 50,218 LPG 36,744 36,601 36,118 Total 360,000 360,000 360,000 Ethane recovery (%) 91.5 92.3 96.4 LPG recovery (%) 93.1 92.8 91.5 a Natural gas product is warmed to 0 °C before distributing through the pipeline. b All products comply with the typical specifications outlined in Table 3. On the other hand, design 3 recovered the greatest quantity of ethane from LNG. The ethane production was approximately 5%–6% more than that from designs 1 and 2. However, since the natural gas product was compressed in a gaseous state, significantly more power was required to pressurize it to distribution pressure. In contrast, as the temperature of the natural gas increased after compression, less energy was required to warm it further before entering pipelines. It was also noted that the reboiler of the demethanizer required almost double the heat flow compared to that in the first two designs. This was because the LNG stream was fed to the column at a lower temperature; hence, more energy is required for the separation processes.
Although the overall energy balance was very similar among the three designs, it should be stressed that all required heating was assumed to be provided by ambient-temperature water. Consequently, the compressor required higher operating costs than a heat exchanger of similar total heat flow, and therefore, the reduction of compression utilities, instead of heating, would demonstrate a more significant reduction in operation costs. Designs 1 and 2 were, therefore, more energy-efficient and better utilised the cold energy in LNG, while design 3 recovered more ethane at higher energy consumption.
From an environmental perspective, the proposed configurations eliminate the need for combustion and other external heat sources, potentially reducing associated CO2 emissions and improving overall energy efficiency. A notable environmental consideration is the discharge of the cooled seawater, which is in a similar magnitude to that of the existing open rack vaporizer systems and can therefore be mitigated through standard thermal management practices. These aspects suggest that the proposed designs may offer both economic and environmental benefits.
-
The economic performance of the three proposed designs was studied in terms of profitability. This economic analysis serves as an indicator to justify the economic feasibility of constructing a hydrocarbon recovery system at a traditional regasification terminal that does not utilise cold energy during LNG regasification. The sensitivity analysis section studies feedstock with different flow rates, NGL sales prices, and LNG with various compositions. This analysis determines the effects on the overall system profitability under various circumstances.
Economic analysis
-
This economic analysis is based on the following assumptions:
(1) The proposed designs are compared to a hypothetical regasification terminal where LNG is regasified to natural gas using a traditional open rack vaporizer. Equipment items such as LNG pumps, seawater pumps and seawater heat exchangers are already used and are not included in this analysis.
(2) All heating requirements are provided by ambient-temperature seawater, and no extra power is required except for the use of a compressor in design 3.
(3) Capital and other operation and maintenance costs are estimated using the Aspen Process Economic Analyzer with the US_Metric template.
(4) The prices of sale of natural gas, ethane, and LPG are the average values of prices between 2010 and 2023. LPG is assumed to have the same selling price as propane.
These assumptions are established to facilitate the understanding of the overall economic profitability of the proposed designs. It should be emphasised that these assumptions do not apply to every circumstance, and the precise cost and benefit analysis generally requires parameters that are unique to a particular environment. It is also noted that both costs and selling prices of hydrocarbons are highly dependent on jurisdictions. Hydrocarbon prices were averaged over the period 2010–2023 to represent long-term market conditions and to avoid distortion from short-term volatility, such as the 2022 spike caused by global supply disruptions. The purpose of this study is to evaluate relative technoeconomic performance among design alternatives rather than to forecast current profitability. Therefore, applying long-term average prices ensures a consistent and representative economic comparison under typical market conditions.
The following equation is used to evaluate the economic performance of the three designs in terms of net profit per year. The net incomes of the systems equal the extra income from selling ethane and LPG minus the reduction in natural gas sales and additional operational and capital costs. The capital costs of the equipment are reflected in annual costs by multiplying a capital recovery factor. The selling prices of hydrocarbons, electricity costs, discount rate, and equipment lifespan are listed in Table 8.
Table 8. Economic analysis parameters
Parameter Value Natural gas selling price (USD${\$} $ kg–1) 0.18 Ethane selling price (USD${\$} $ kg–1) 0.25 LPG selling price (USD${\$} $ kg–1) 0.45 Wholesale electricity cost (USD${\$} $ MWh−1) 56.88 Discount rate (%) 3 Equipment lifespan (year) 20 $ \Delta {\mathrm{I}}_{\mathrm{n}\mathrm{e}\mathrm{t}}={\mathrm{I}}_{\mathrm{C}2}+{\mathrm{I}}_{\mathrm{L}\mathrm{P}\mathrm{G}}-\Delta {\mathrm{I}}_{\mathrm{N}\mathrm{G}}-\Delta {\mathrm{I}}_{\mathrm{e}}-\Delta \mathrm{I}\mathrm{C}\mathrm{C}\times \mathrm{C}\mathrm{R}\mathrm{F}-\Delta {\mathrm{C}}_{\mathrm{O} {\&}\mathrm{M}} $ where, ΔInet = net income. IC2 = income from selling ethane. ILPG = income from selling LPG. ΔING = variation in natural gas sales. ΔIe = variation in electricity costs. ΔICC = variation in Installed Capital Cost (ICC). CRF = Capital Recovery Factor (CRF). ΔCO&M = variation in operations and maintenance costs.
$ \mathrm{C}\mathrm{R}\mathrm{F}=\left[\mathrm{k}\times {\left(1+\mathrm{k}\right)}^{{\tau}}\right]/[{\left(1+\mathrm{k}\right)}^{{\tau}}-1] $ where, k = discount rate, τ = life span of equipment.
The costs and profits of the three designs are outlined in Table 9. A detailed breakdown of the capital investment and operations and maintenance costs is provided in Table 10 for reference. Overall, all three designs were profitable under the simulated circumstances, with design 2 being the most economically preferable, at around 1.3% and 5.7% more profitable than designs 1 and 3. The total net profits were essentially dependent on the sales of hydrocarbons, as they were over ten times higher than other costs. While there were around 15% and 7% differences in capital and operational costs between designs 1 and 2, they were similar in terms of hydrocarbon sales. Therefore, the overall net profits were also similar. Design 3 recovered more ethane from LNG, which generated 5.5% more income from ethane sales compared to design 1. However, due to the use of compressors instead of pumps, its significantly higher capital and operational costs offset the extra income, and design 3 was the least profitable.
Table 9. Economic analysis for the proposed designs
Design 1 Design 2 Design 3 IC2 (mUSD${\$} $ year−1) 103.41 104.69 109.08 ILPG (mUSD${\$} $ year−1) 144.84 144.28 144.80 ΔING (mUSD${\$} $ year−1) 132.39 133.09 136.46 ΔIe (mUSD${\$} $ year−1) − − 4.02 ΔICC (mUSD${\$} $) 2.36 2.74 5.42 CRF (%) 0.07 0.07 0.07 ΔICC × CRF (mUSD${\$} $ year−1) 0.16 0.18 0.36 ΔCo&m (mUSD${\$} $ year−1) 19.89 18.61 21.16 ΔInet (mUSD${\$} $ year−1) 95.83 97.08 91.87 Table 10. Breakdown of installed capital and operations and maintenance costs
Design 1 Design 2 Design 3 Installed capital cost Demethanizer column (mUSD${\$} $) 0.68 0.7 1.34 Deethanizer column (mUSD${\$} $) 0.62 0.56 0.48 Deethanizer condenser (mUSD${\$} $) 0.92 0.89 0.7 Heat exchanger (mUSD${\$} $) 0.14 0.14 − NG compressor (mUSD${\$} $) − − 2.89 Separator (mUSD${\$} $) − 0.45 − Total (mUSD${\$} $) 2.36 2.74 5.42 Operations and maintenance cost Demethanizer (mUSD${\$} $ year−1) 6.1 5.97 12.19 Deethanizer (mUSD${\$} $ year−1) 5.21 4.37 2.86 Heat exchanger (mUSD${\$} $ year−1) 8.57 8.27 − NG compressor (mUSD${\$} $ year−1) − − 6.11 Total (mUSD${\$} $ year−1) 19.89 18.61 21.16 Sensitivity analysis
-
Unlike a traditional sensitivity analysis, which usually aims at predicting the outcome of a model or system across a specific range of changing variables, the analysis presented in this paper focuses on simulating the proposed designs over certain non-continuous, discrete scenarios. This is because the variables in the designs generally do not change continuously over time. For instance, the compositions of feed LNG depend on its origin and are not likely to vary significantly over time. As a result, instead of running the model over a range of changing parameters, this sensitivity analysis serves as an applicability test to examine the economic feasibility of the designs under different circumstances.
Variations in LNG mass flow rate
-
The economic performances of the three designs were simulated at LNG mass flow rates of 100 kg s−1 (3.15 MTPA), 50 kg s−1 (1.58 MTPA), and 10 kg s−1 (0.32 MTPA), respectively. The corresponding results are shown in Fig. 7. As the mass and energy balances were independent of the flow rate, the products and hence the hydrocarbon sales varied linearly with the flow rate change. It was also noted that Aspen Process Economic Analyzer uses a scaling factor to estimate the operating and maintenance costs of the designs. Therefore, these costs were also linear functions of the flow rate. The installed capital costs were the only costs that did not change linearly with LNG mass flow rate. In all three designs, the unit capital costs per flow rate increased as the flow rate decreased. Nevertheless, the capital costs accounted for less than 0.1% of the total costs and did not significantly affect the overall profitability of the designs. As a result, the total profits of the three designs varied almost linearly with the change in LNG flow rate. However, it was noted that the capital costs contributed more to the total costs as the system diminished in size, and the linearity might not hold when the flow rate decreased further.

Figure 7.
Economic performances under three different LNG mass flow rates.
Variations in LNG compositions
-
LNG with different compositions (Table 1) from Australia (North West Shelf), Qatar and Russia (Sakhalin) were simulated, and the results are shown in Fig. 8. It should be noted that the LNG originating from the USA (Alaska) contains less than 1% higher hydrocarbons and cannot be fed into any of the hydrocarbon recovery systems. The simulations assumed that LNG with different compositions was fed to the proposed designs without extra pre-processing or further optimisations. It was evident that since Australian LNG contains the highest ethane and LPG contents, the recovery systems were the most lucrative with it. While Qatar LNG had a lower methane and a higher ethane content than Russian LNG, the latter had a higher LPG content, and therefore, recovering higher hydrocarbons from Russian LNG generated more profits. Design 2 performed the best with all three LNG compositions.
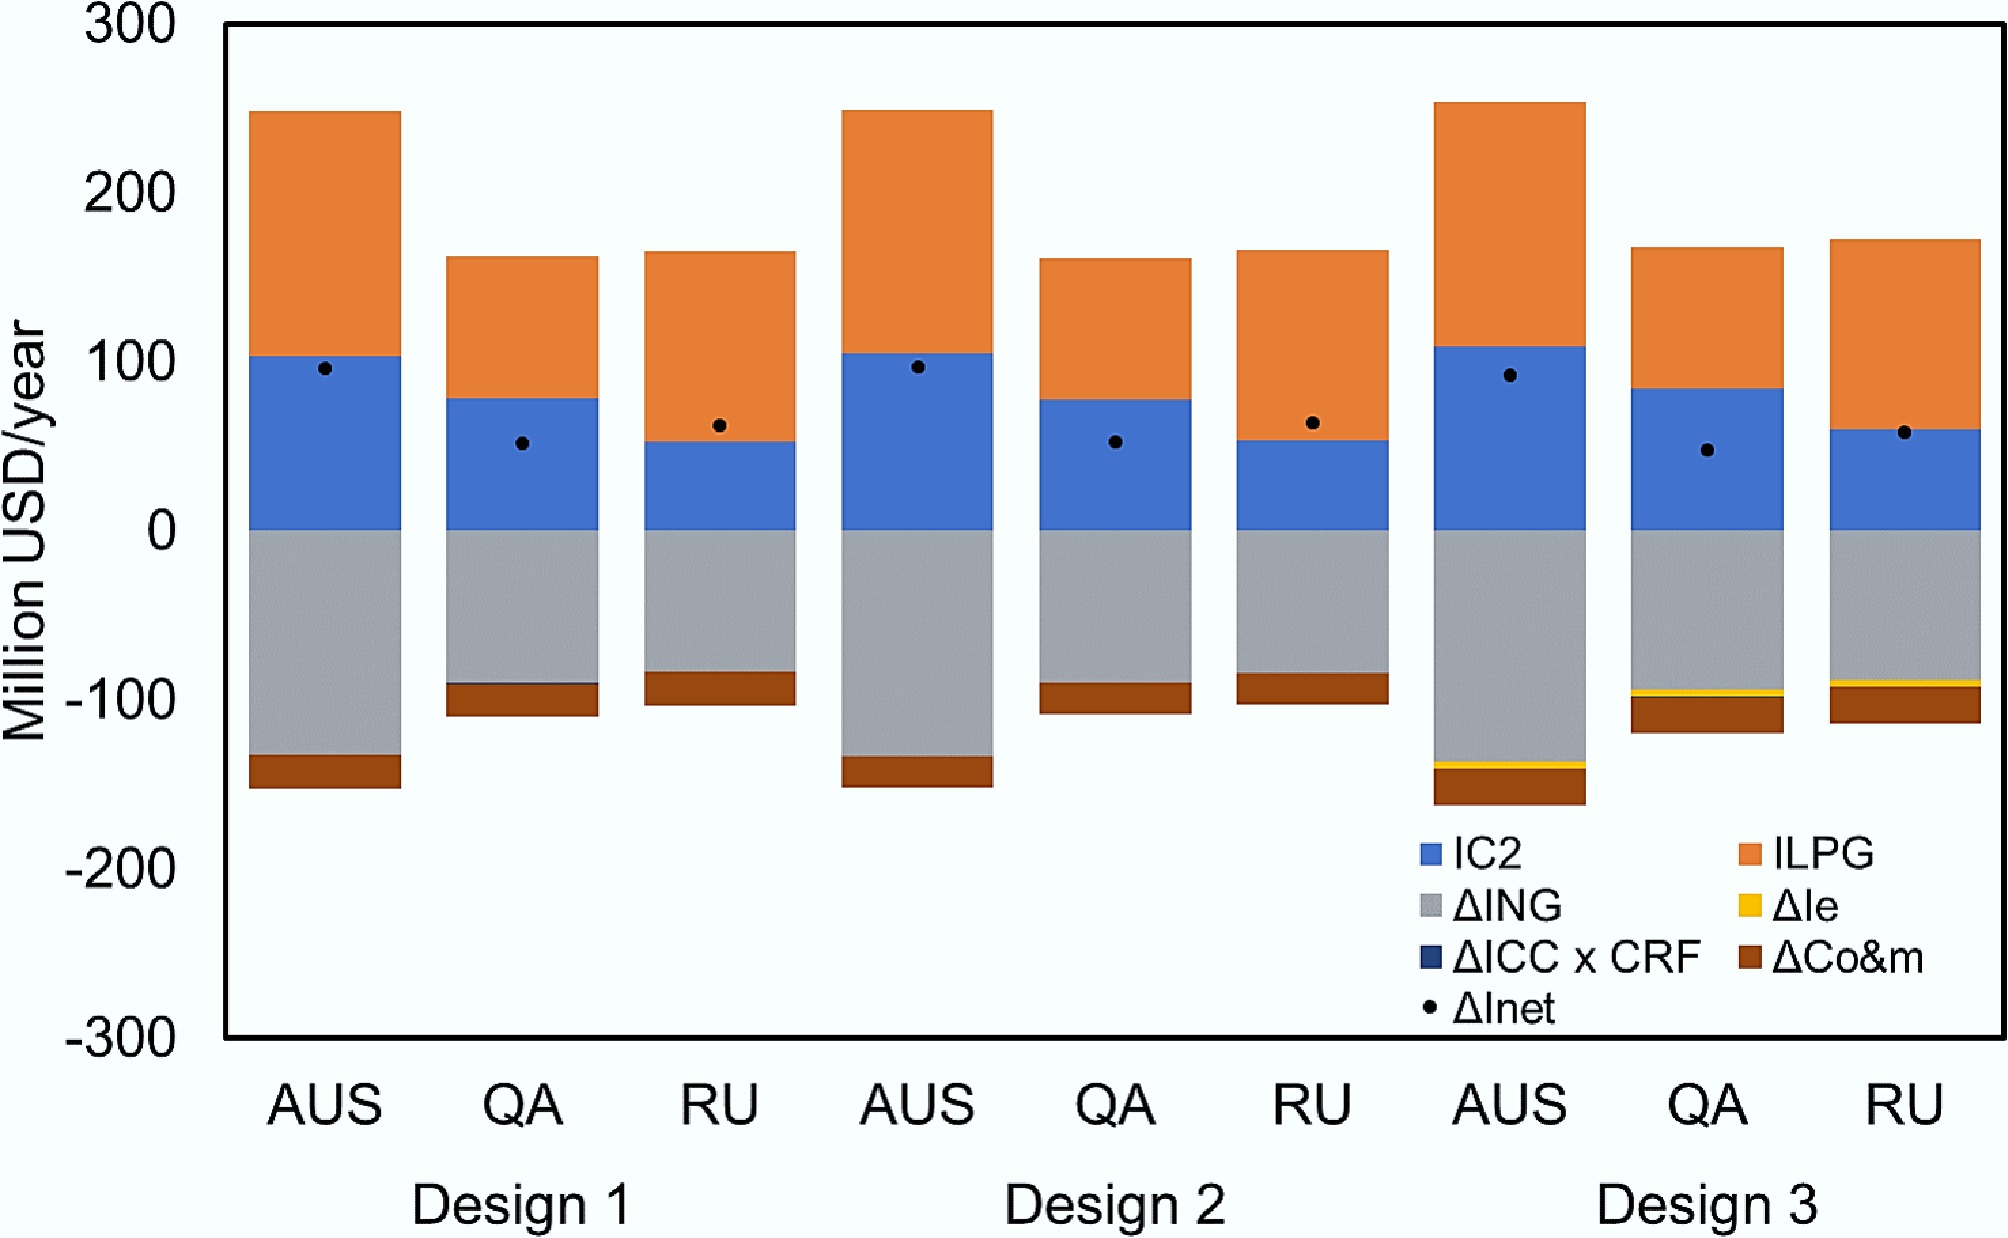
Figure 8.
Economic performances for LNG from different origins.
Furthermore, the differences between design 2 and the other two designs were more significant when the LNG contained less heavy hydrocarbons. For instance, design 2 generated 1.3% and 5.7% more profits than designs 1 and 3 with recovering hydrocarbons from Australian LNG, but the differences increased to 1.7% and 9.9% for Qatar LNG and 2.1% and 8.6% for Russian LNG. This was because design 2 was more thermodynamically efficient than designs 1 and 3, and the reduction in other costs was more significant when fewer products were produced. Design 3, in contrast, required similar or more energy to compress the natural gas product even when less ethane and LPG were produced.
Economic performances at lowest NGL sales prices
-
The sales prices of natural gas and NGL generally fluctuate with time. As shown in Fig. 9, the highest sales prices of hydrocarbons can be multiple times the average prices. However, it should be noted that instead of the sales prices of the hydrocarbons, the price differences between natural gas and ethane and LPG (propane) influence the profitability of the proposed designs. There were occasions when natural gas was sold at a higher price than ethane. For instance, at the end of 2014, natural gas, ethane, and LPG were trading at USD
${\$} $ 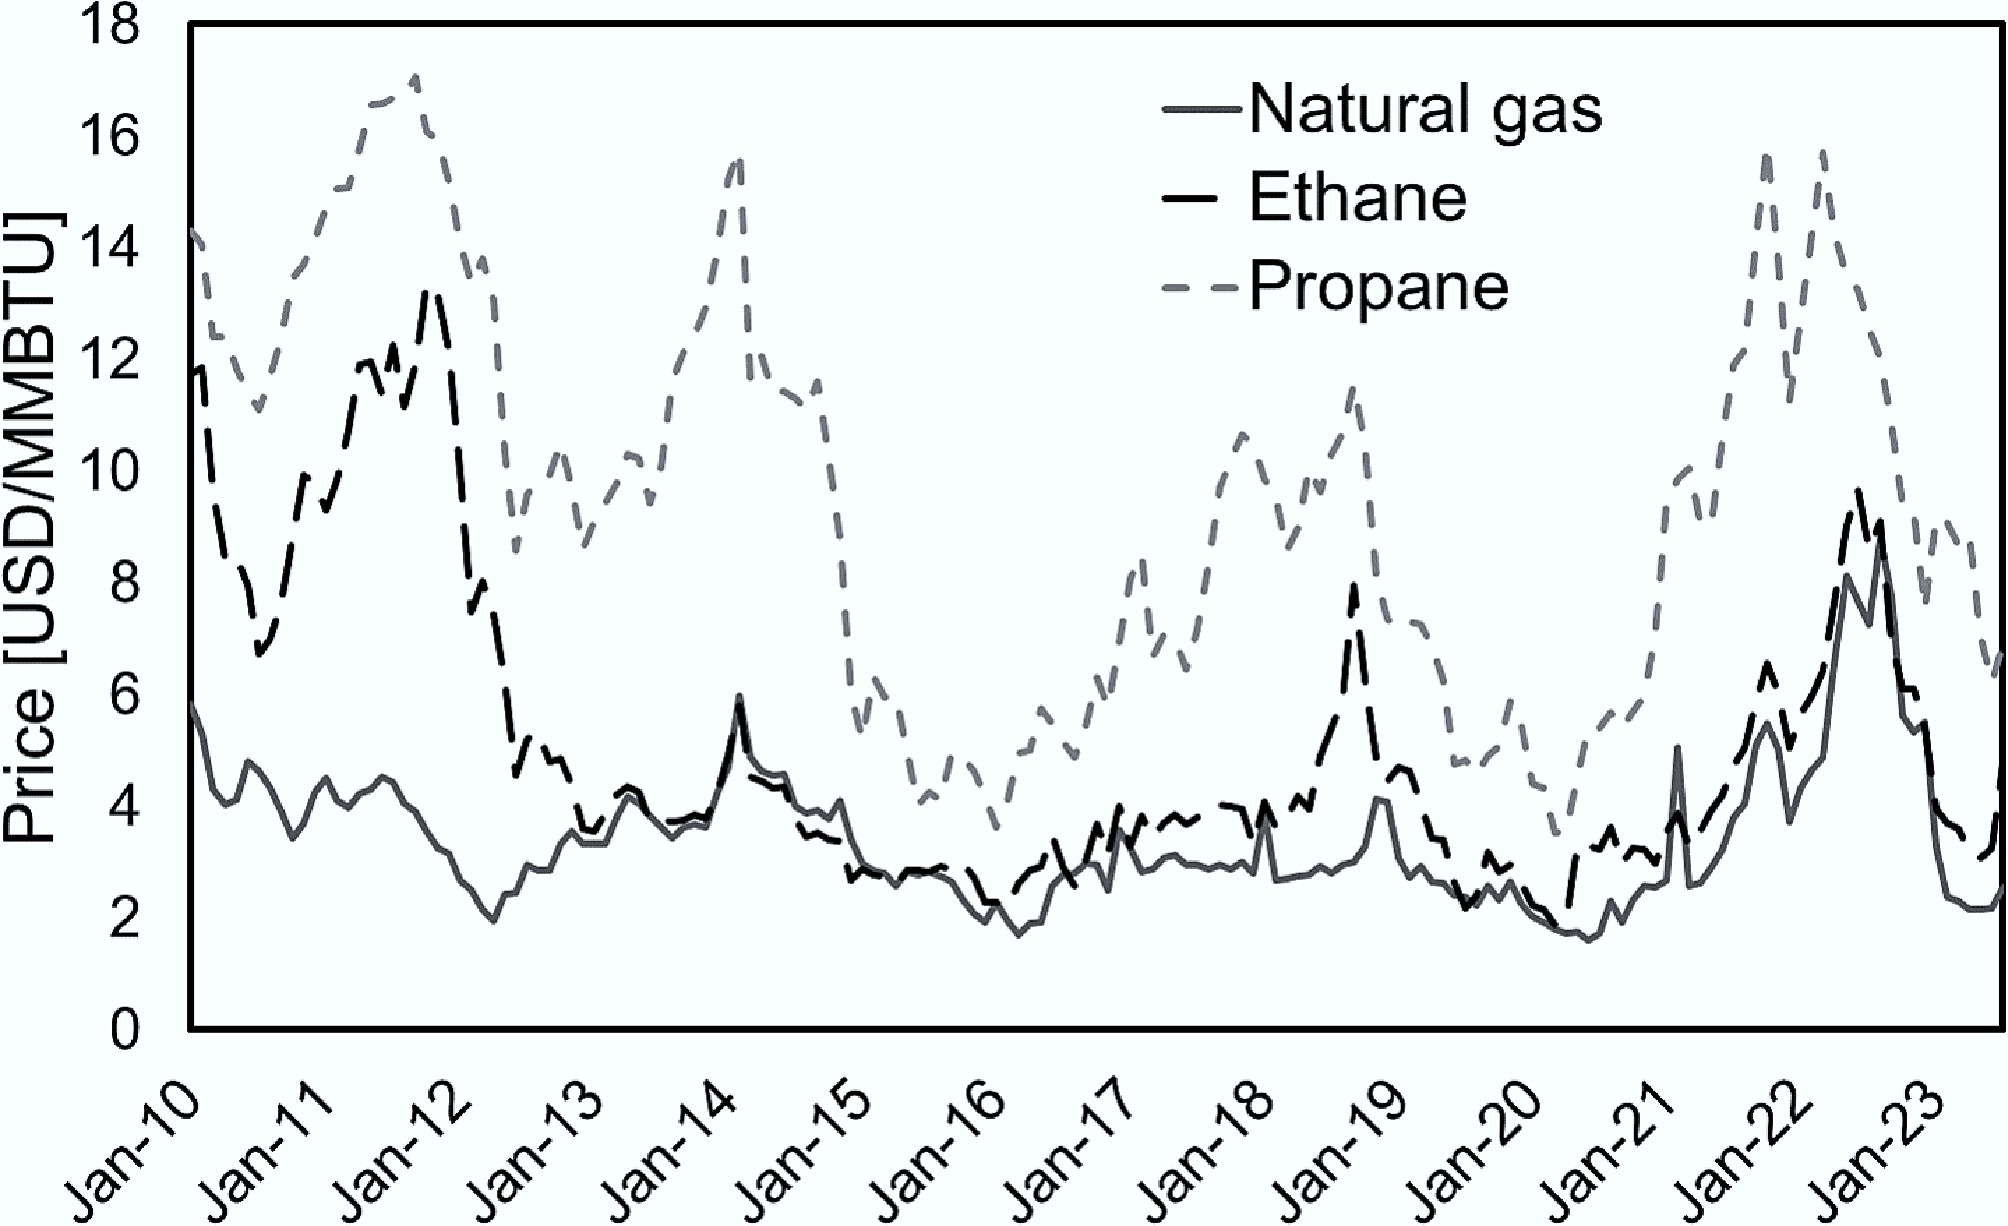
Figure 9.
Sales prices of natural gas and NGL (graph drawn based on EIA data[28]).
Table 11. Economic analysis of the proposed designs at the lowest NGL sales prices
Design 1 Design 2 Design 3 IC2 (mUSD${\$} $ year−1) 54.19 54.86 57.16 ILPG (mUSD${\$} $ year−1) 91.41 91.06 91.38 ΔING (mUSD${\$} $ year−1) 130.92 131.61 134.94 ΔIe (mUSD${\$} $ year−1) − − 4.02 ΔICC (mUSD${\$} $) 2.36 2.74 5.42 CRF (%) 0.07 0.07 0.07 ΔICC × CRF (mUSD${\$} $ year−1) 0.16 0.18 0.36 ΔCo&m (mUSD${\$} $ year−1) 19.89 18.61 21.16 ΔInet (mUSD${\$} $ year−1) (5.36) (4.49) (11.95) The fluctuations of hydrocarbon sales prices depend on many factors, and the three products can have different trends. It is, therefore, hard to construct a correlation between them and their impacts on the system's profitability numerically. Nevertheless, it has more often been the case that both ethane and LPG have had higher sales prices than natural gas throughout the years, and the proposed designs will remain profitable.
-
Three higher hydrocarbon recovery designs were proposed and analysed for techno-economic feasibility using Aspen HYSYS simulation. All three designs can recover ethane and LPG with minimal energy requirement when using seawater at ambient temperature as the heat source. The first two designs involving cooling and re-condensation of the natural gas stream allow the use of pumps instead of compressors. The third design, while not utilising cold energy as effectively as the other two due to a greater temperature gradient between the hot and cold streams, benefits from a lower demethanizer feed temperature, which was shown to improve ethane recovery.
Overall, all three designs were shown to be able to generate net profits. Designs 2 and 1 exhibited similar profitability under different circumstances, while design 3 was generally less economically favourable. This was because the extra ethane produced in design 3 cannot compensate for the extra capital and operational costs associated with the extra compressor. The sensitivity analysis indicated that the net profit was linearly affected by the mass flow rate of LNG, and the three systems remain profitable even when fed with LNG from different origins. Moreover, on rare occasions when the sales price of ethane drops below that of natural gas, all three designs suffer from losses as the recovery of ethane will not generate extra income. Lastly, all three designs require external heating to warm up the NG after the recovery, which indicates that some cold energy is still embedded in the product streams. It is therefore suggested that it may be possible to implement multiple cold energy utilisation systems simultaneously, and hence, the additional exploration in this topic may be valuable.
-
The authors confirm contribution to the paper as follows: all authors were responsible for the study conception and design; simulations were performed by Shing-hon Wong; the analysis and interpretation of results were performed by Shing-hon Wong, Gongkui Xiao, Dongke Zhang; the draft manuscript was prepared by Shing-hon Wong. All authors reviewed the results and approved the final version of the manuscript.
-
The data generated and/or analysed during this study is not publicly, but is available from the corresponding author, Shing-hon Wong upon reasonable request.
-
The first author (Shing-Hon Wong) receives a PhD stipend scholarship from the Future Energy Exports CRC (www.fenex.org.au). This work has received partial support from the Australian Research Council under the Discovery Projects Scheme (Grant Nos DP210103766 and DP220100116). FEnEx CRC Document 2025/21.RP1.0072.PHD-FNX-MILE0825.
-
The authors declare that they have no conflict of interest
-
Full list of author information is available at the end of the article.
- Copyright: © 2025 by the author(s). Published by Maximum Academic Press, Fayetteville, GA. This article is an open access article distributed under Creative Commons Attribution License (CC BY 4.0), visit https://creativecommons.org/licenses/by/4.0/.
-
About this article
Cite this article
Wong SH, Xiao G, Zhang D. 2025. A technoeconomic analysis of cryogenic recovery of heavy hydrocarbons from LNG using seawater as the heat source. Energy & Environment Nexus 1: e013 doi: 10.48130/een-0025-0013 

A technoeconomic analysis of cryogenic recovery of heavy hydrocarbons from LNG using seawater as the heat source
- Received: 20 August 2025
- Revised: 30 October 2025
- Accepted: 18 November 2025
- Published online: 16 December 2025
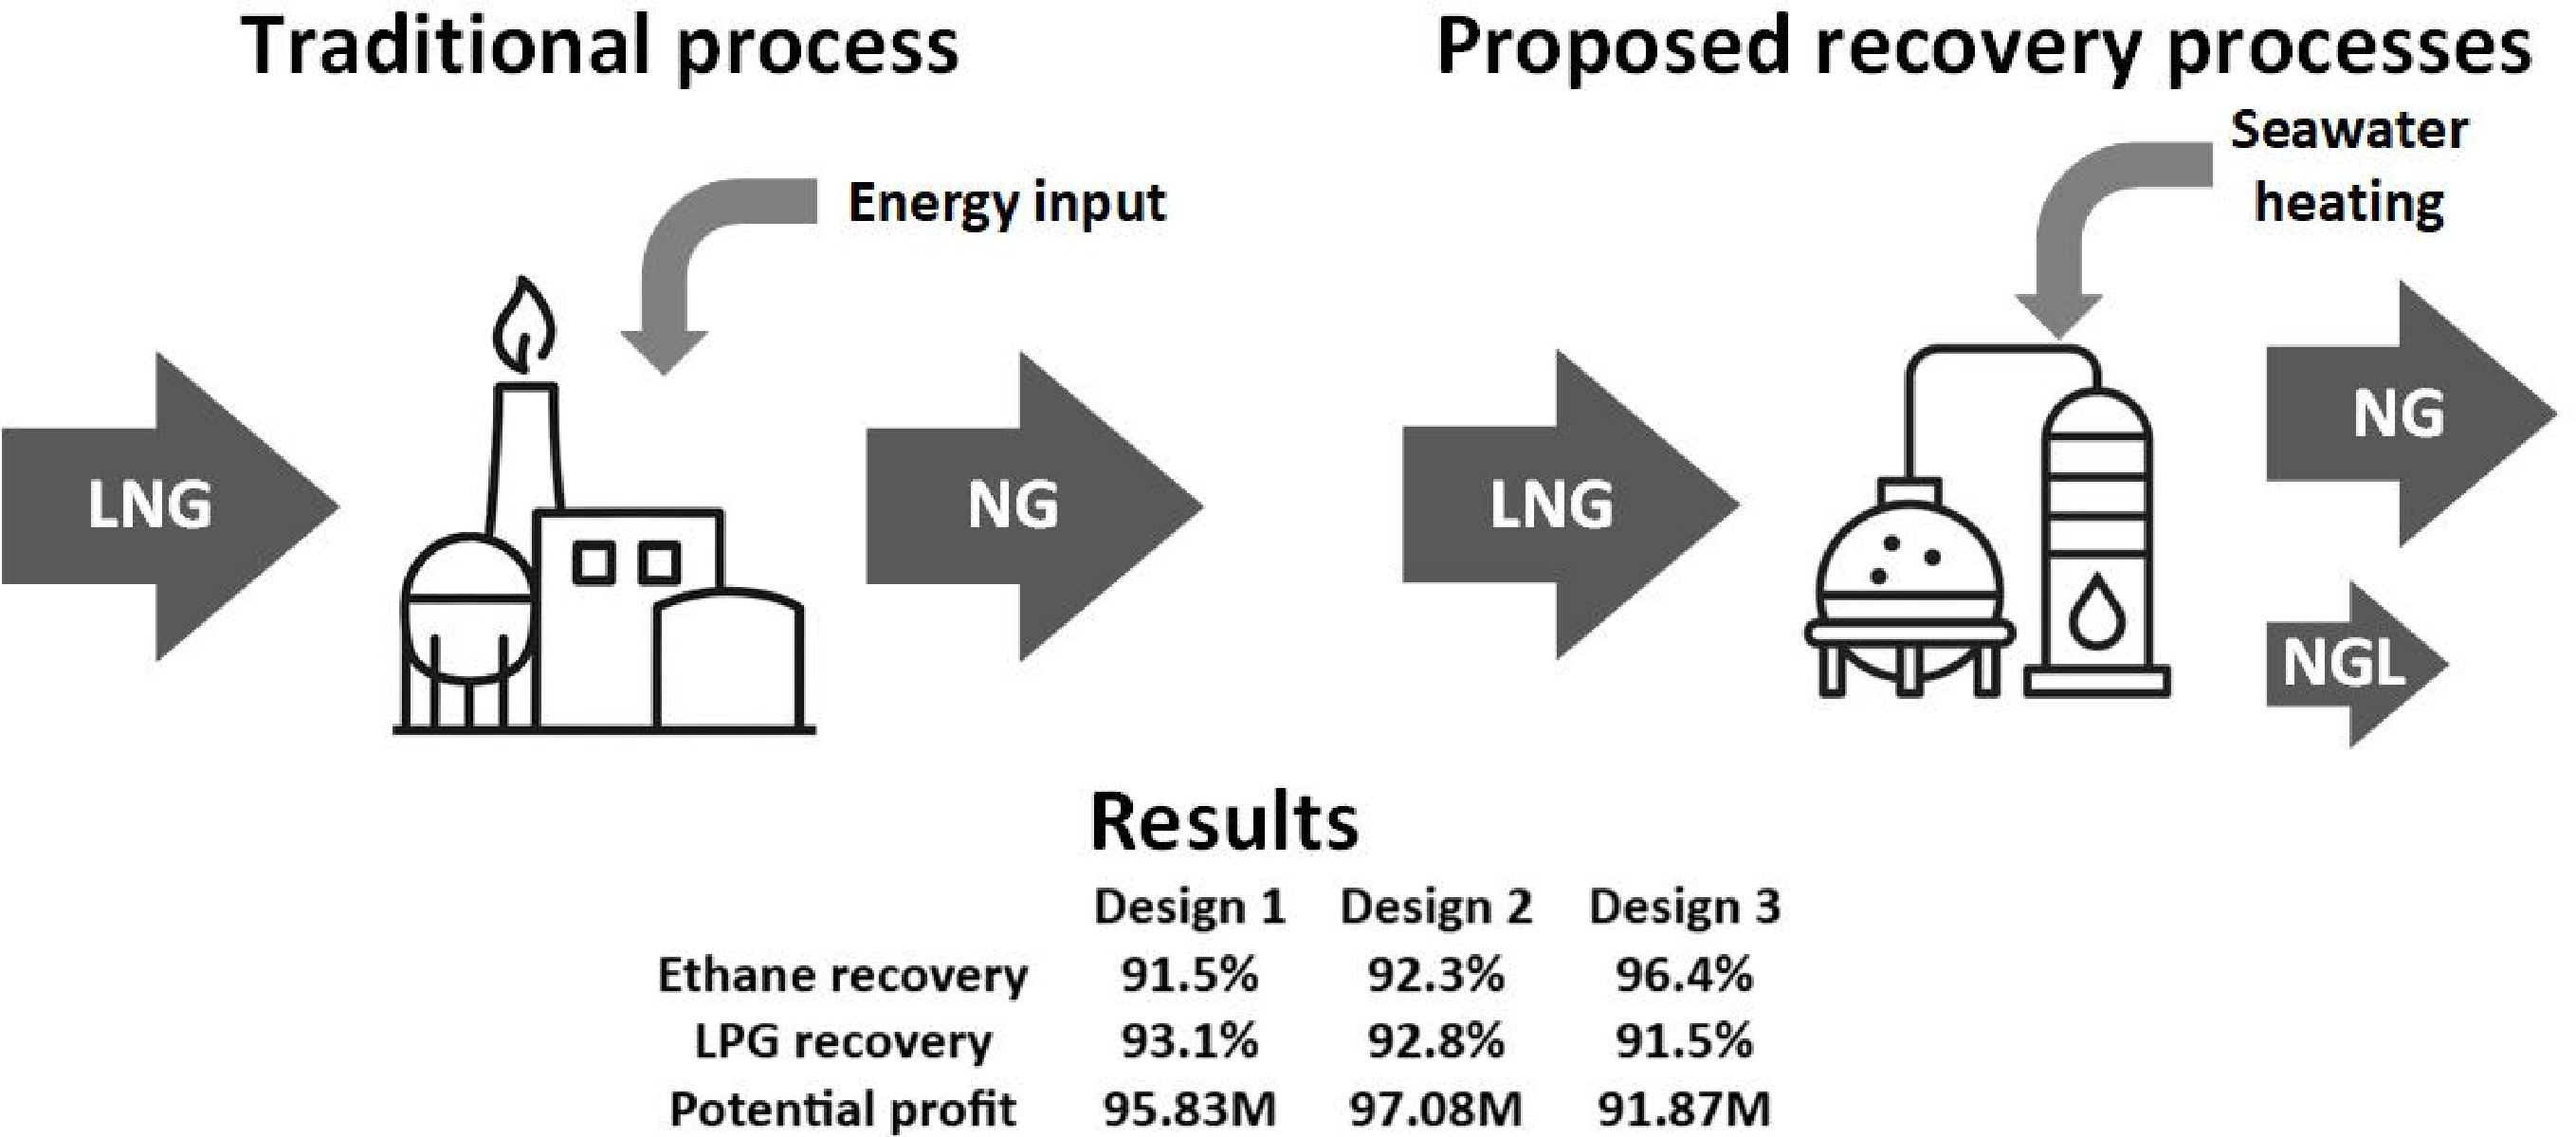
Abstract: Three alternative process configurations for higher hydrocarbon recovery during LNG regasification were proposed and analysed, aiming to increase the economic value of LNG at receiving terminals. All three designs considered the use of seawater at ambient temperature as the heat source in cryogenic distillation to separate ethane and LPG from LNG with minimal external energy. The first two designs utilised the cold energy in LNG through effective heat transfer between LNG and the warm natural gas stream, with the first design serving as a baseline configuration. The second design incorporated an additional separator to reduce column duty and improve process efficiency, while the third design attempted to recover the maximum amount of higher hydrocarbons from LNG with a lower demethanizer feed temperature. All three designs were simulated using Aspen HYSYS, and the corresponding economic and sensitivity analyses were conducted to compare the economic returns of the designs. The three designs recovered 91.5%, 92.3%, and 96.4% of ethane and 93.1%, 92.8%, and 91.5% of LPG, respectively. While all three designs were economically feasible, the second design was shown to be the most profitable, yielding a net profit of USD$ {\$} $97.08 million for a regasification terminal with a 3.15 MTPA receiving capacity.