-
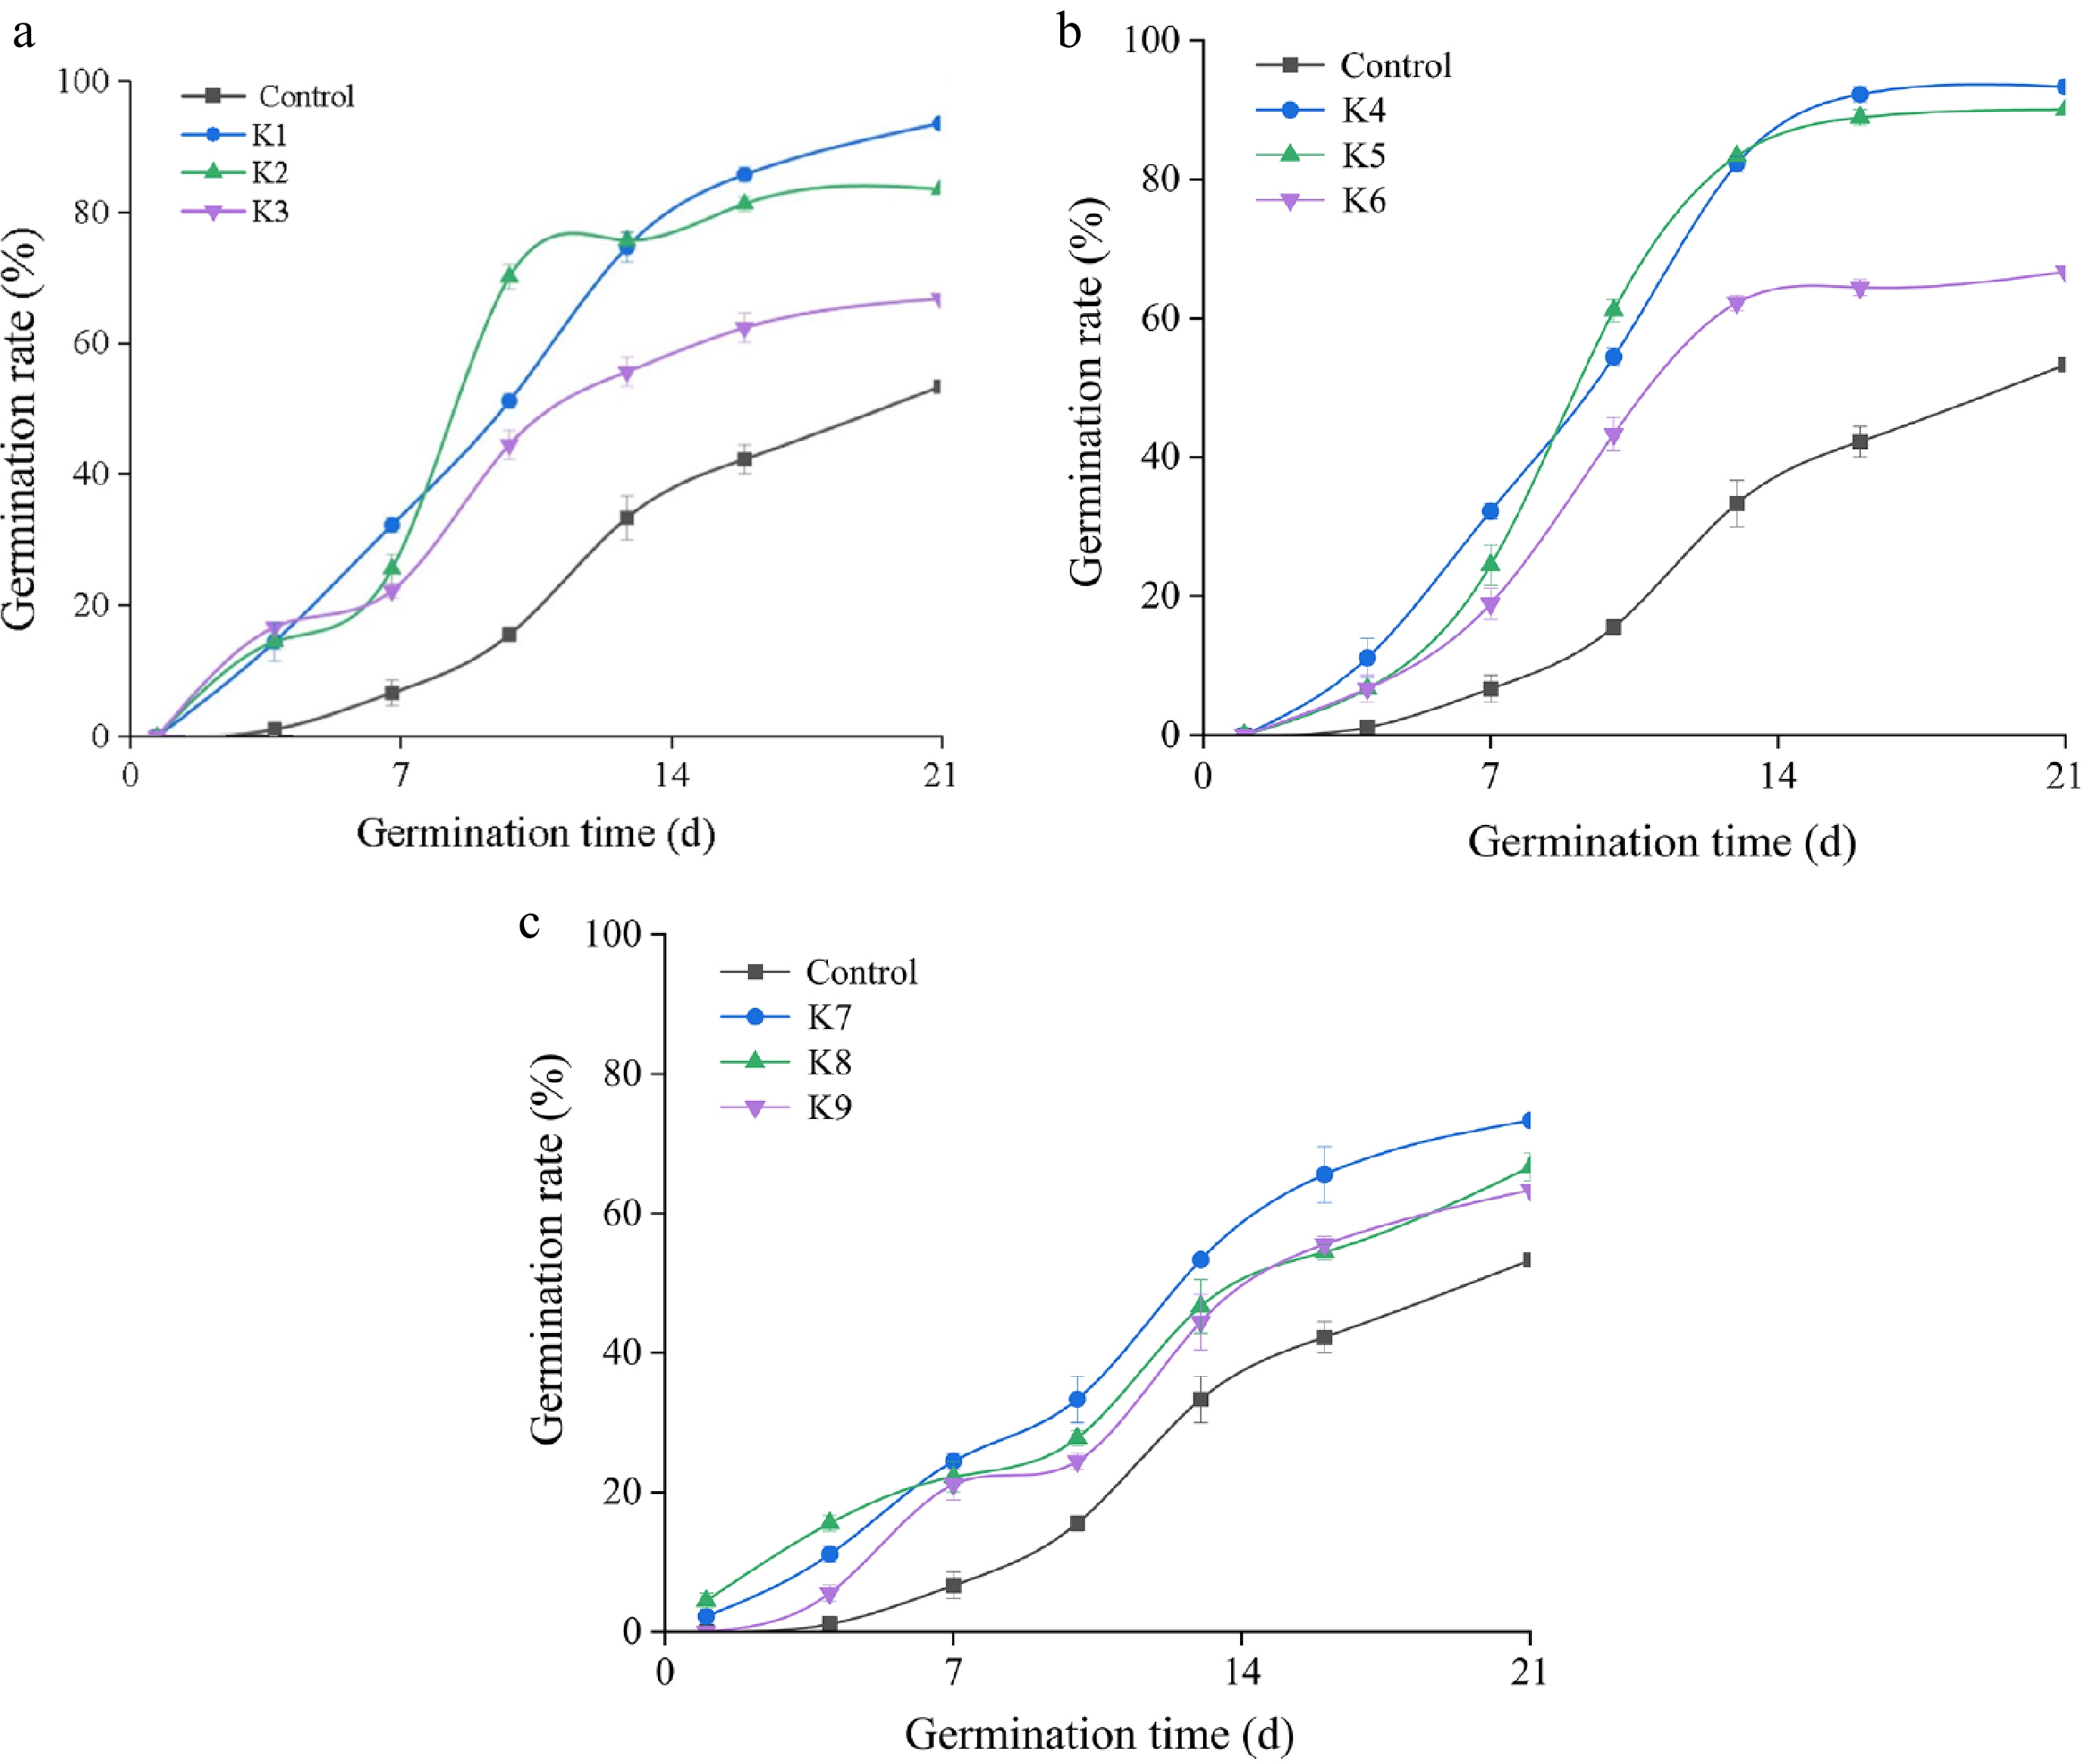
Figure 1.
Germination dynamics of I. typhifolia seeds treated with different KNO3 concentrations. (a) Seeds treated with KNO3 solution for 1 d. (b) Seeds treated with KNO3 solution for 2 d. (c) Seeds treated with KNO3 solution for 4 d. Note: Different vertical bar heights ( ± SE) within the same column indicate a significant difference at p < 0.05.
-
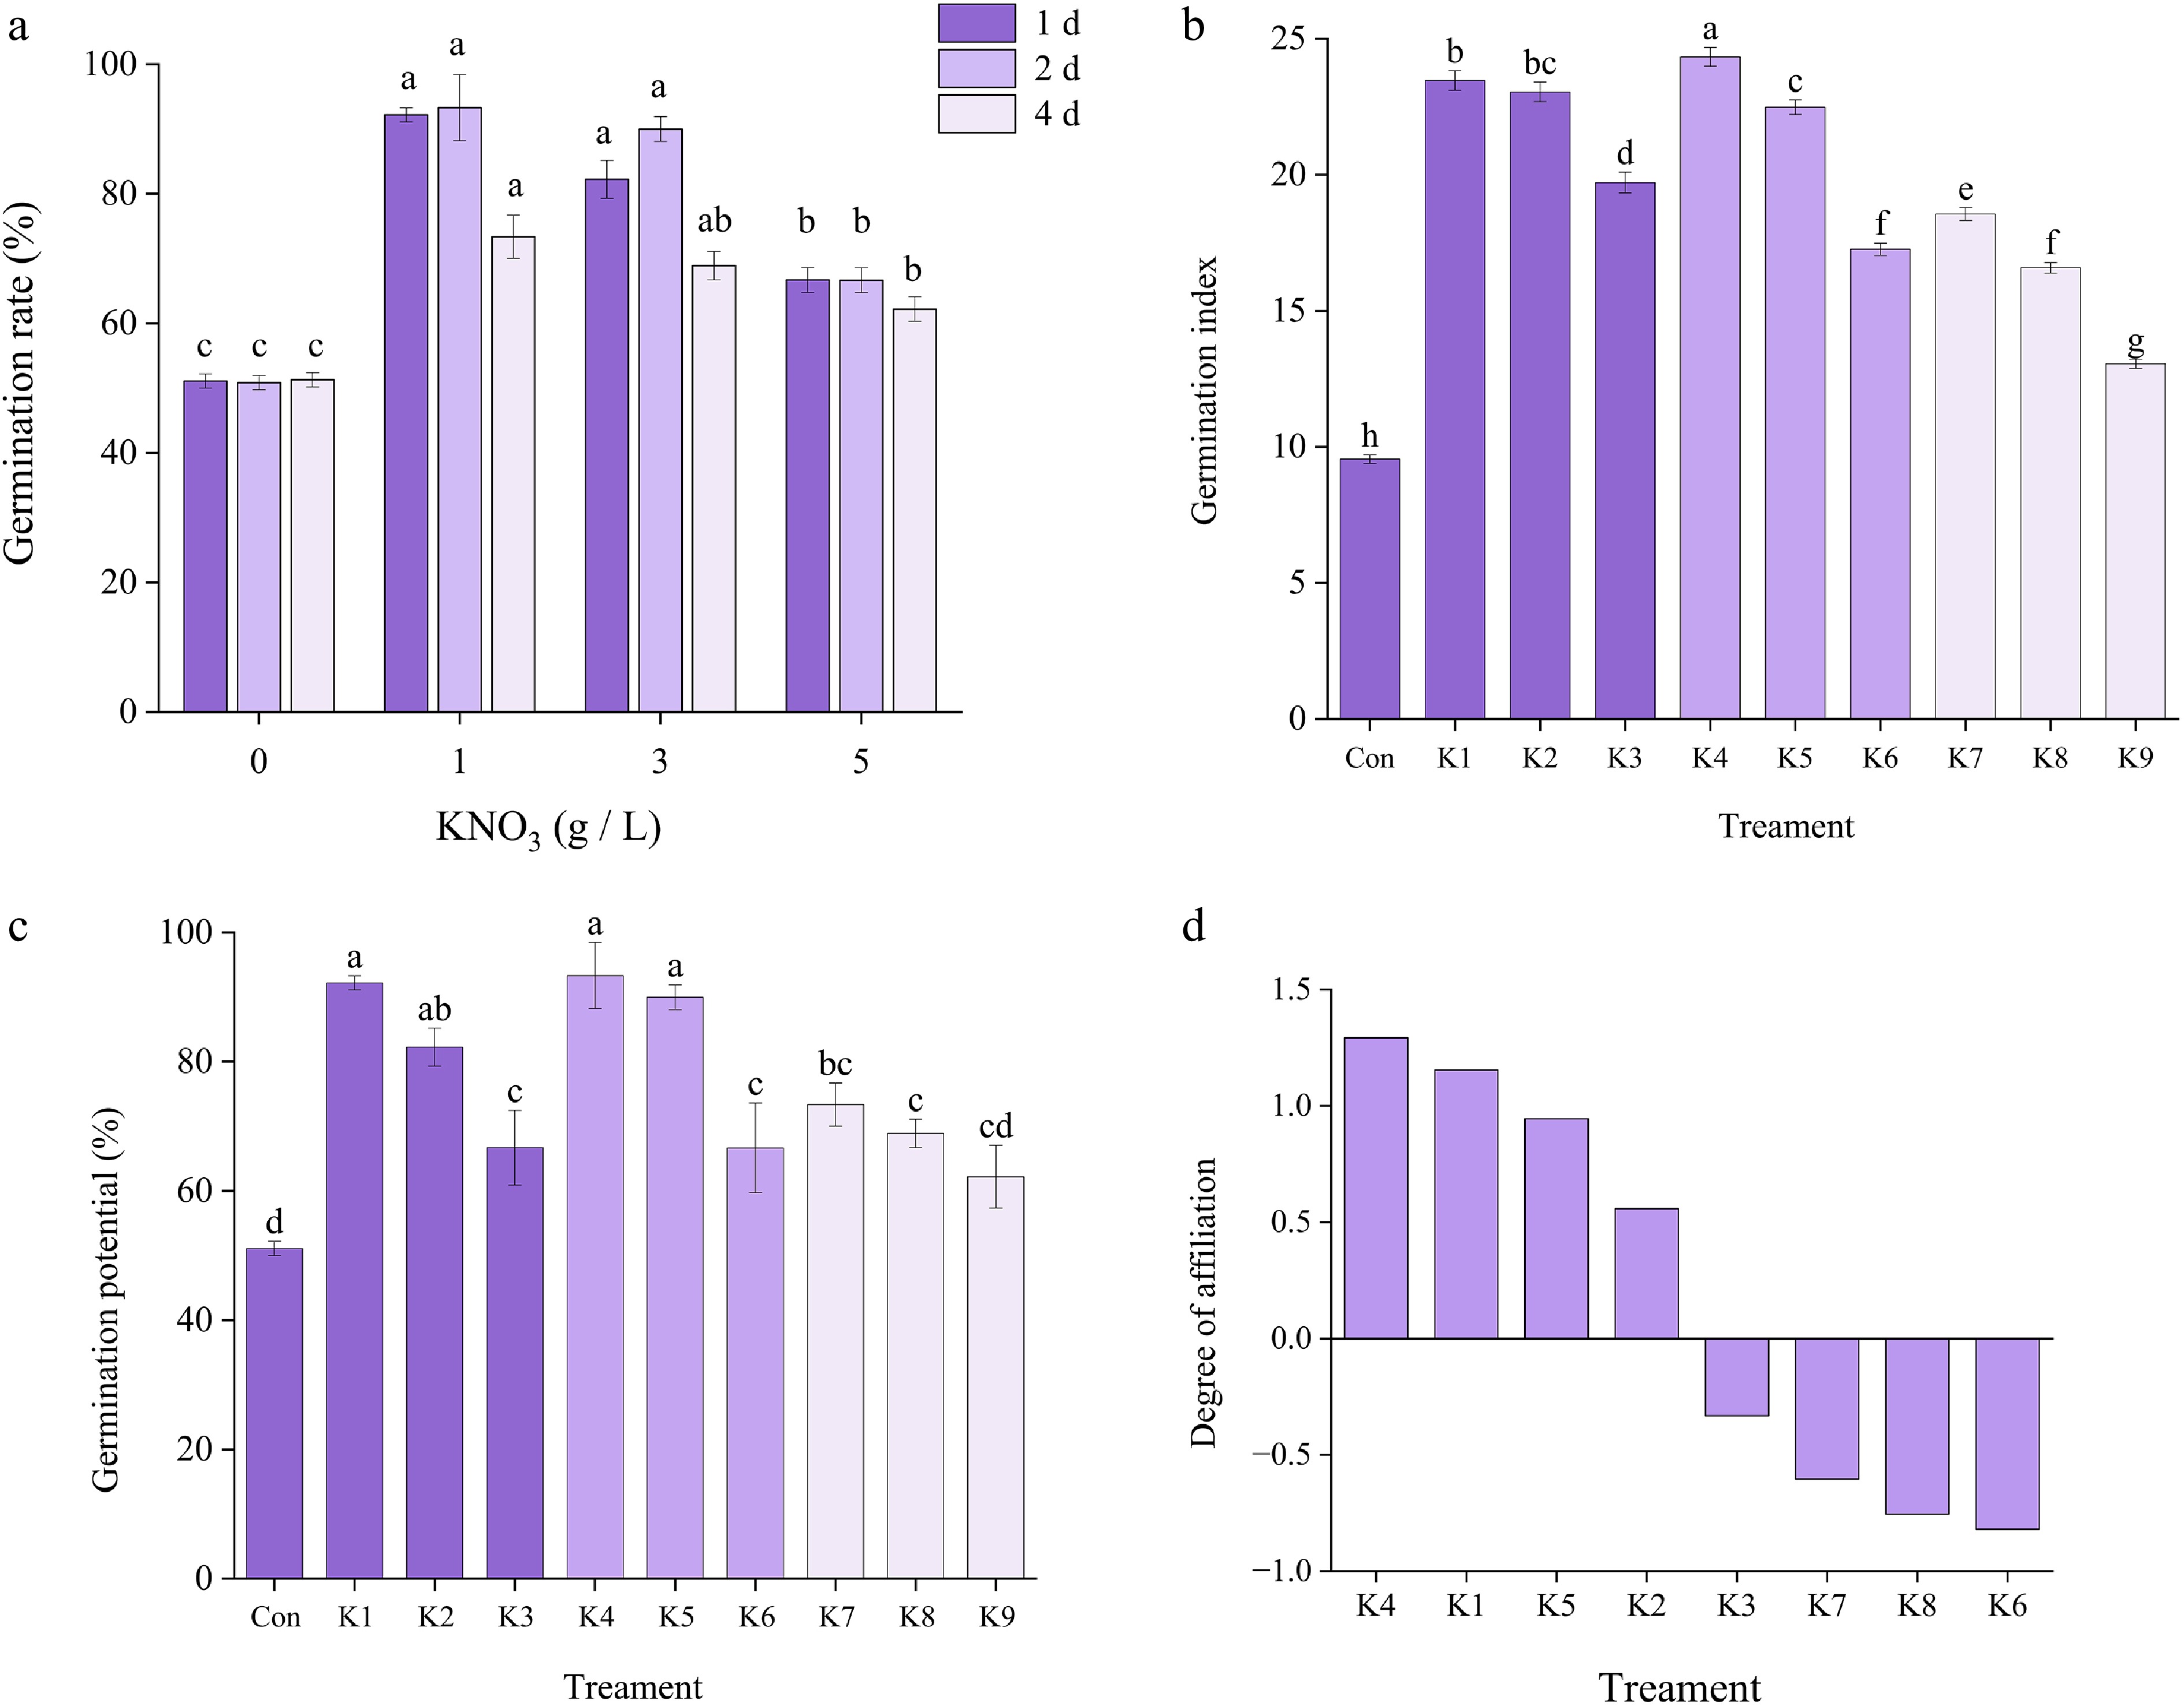
Figure 2.
Germination indexes of I. typhifolia seeds treated with KNO3 solution for 1, 2, and 4 d. (a) Germination rate. (b) Germination index. (c) Germination potential. (d) Comprehensive analysis of the membership function of seed germination of I. typhifolia seeds after KNO3 treatment. Note: Different letters within the same column indicate a significant difference at p < 0.05 according to ANOVA and Duncan's test.
-
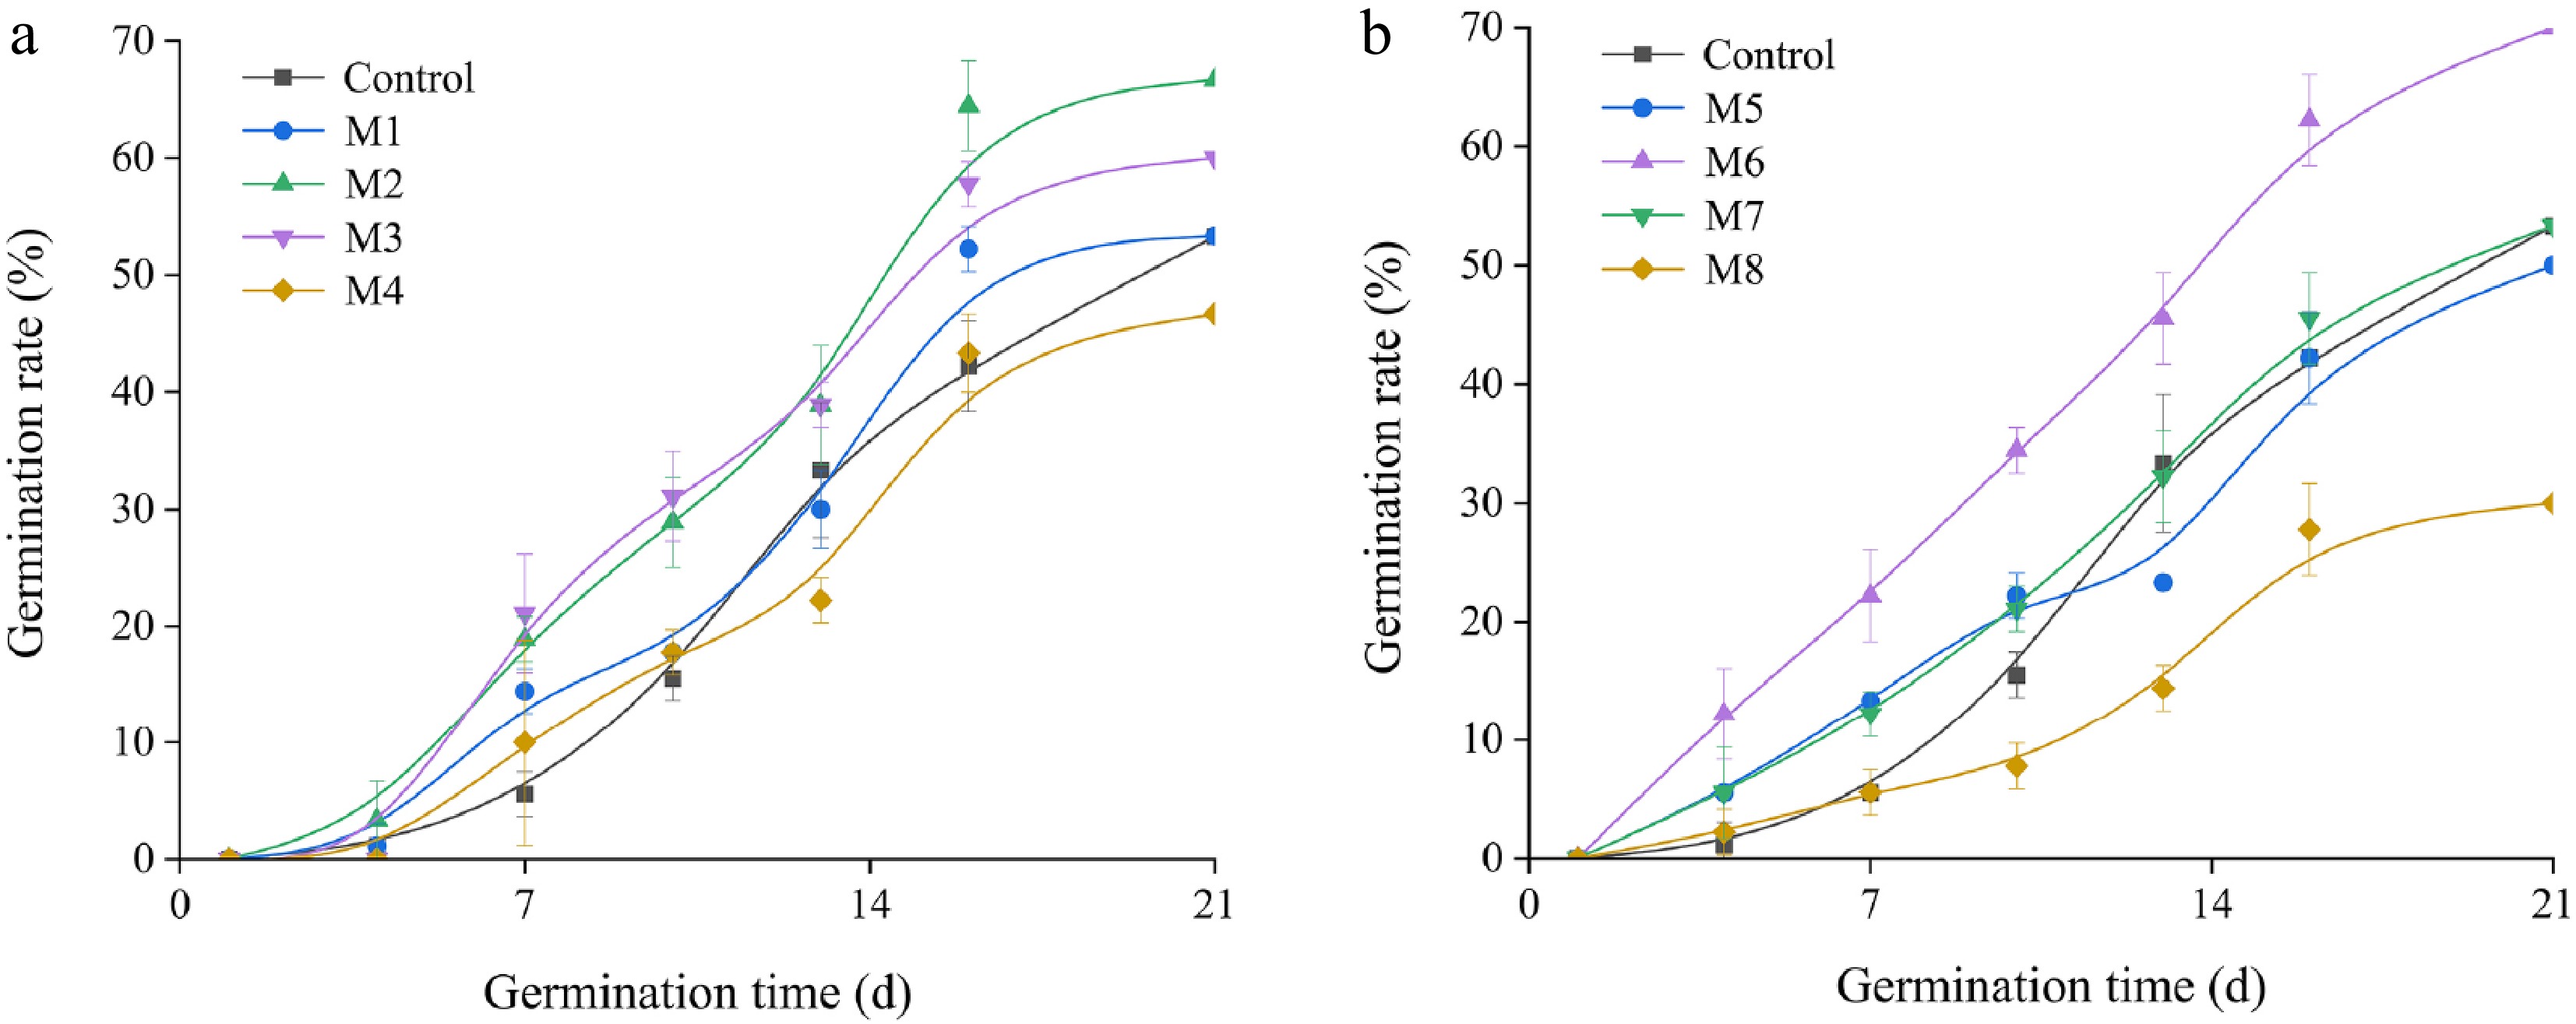
Figure 3.
Germination dynamics of I. typhifolia seeds under microwave treatment. (a) 450 W. (b) 700 W. Different vertical bar heights (± SE) within the same column indicate a significant difference at p < 0.05.
-
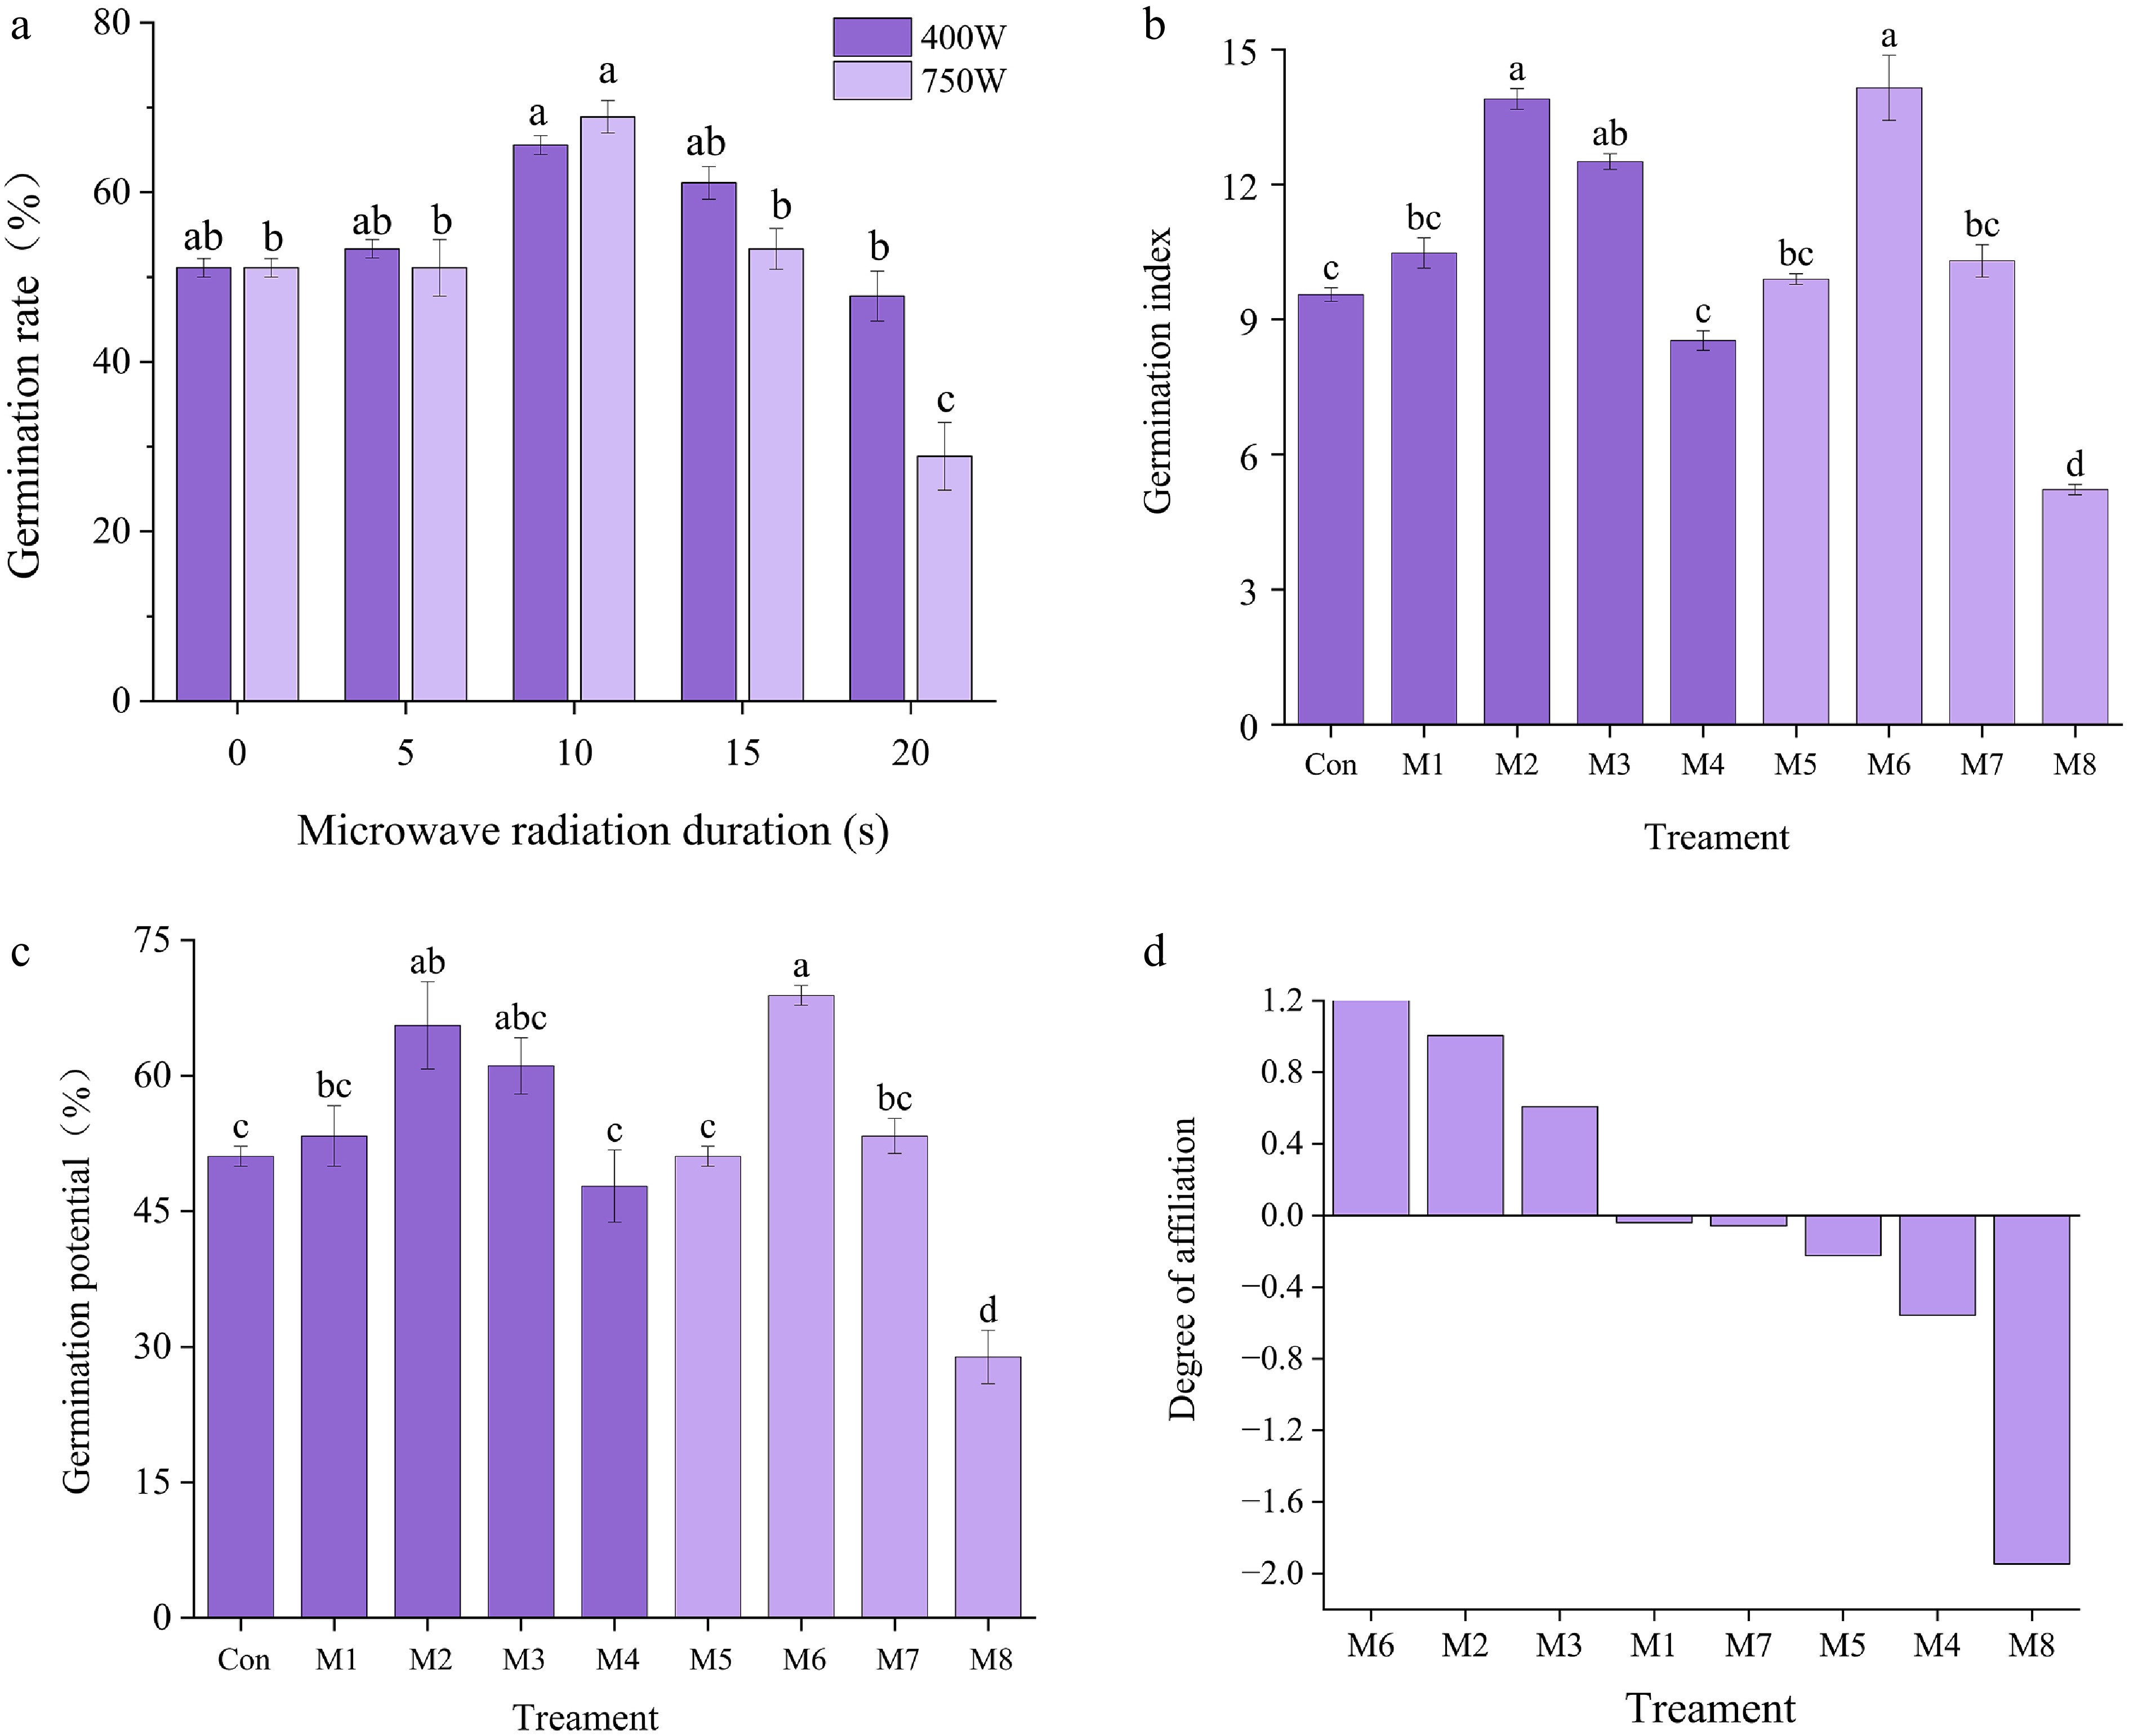
Figure 4.
Germination indexes of I. typhifolia seeds under microwave treatment for 450 W and 700 W. (a) Germination rate. (b) Germination index. (c) Germination potential. (d) Comprehensive analysis of the membership function of seed germination of I. typhifolia seeds after microwave treatment. Note: The results are means of three replicates (n = 3) ± standard error. Different letters within the same column indicate a significant difference at p < 0.05 according to ANOVA and Duncan's test.
-
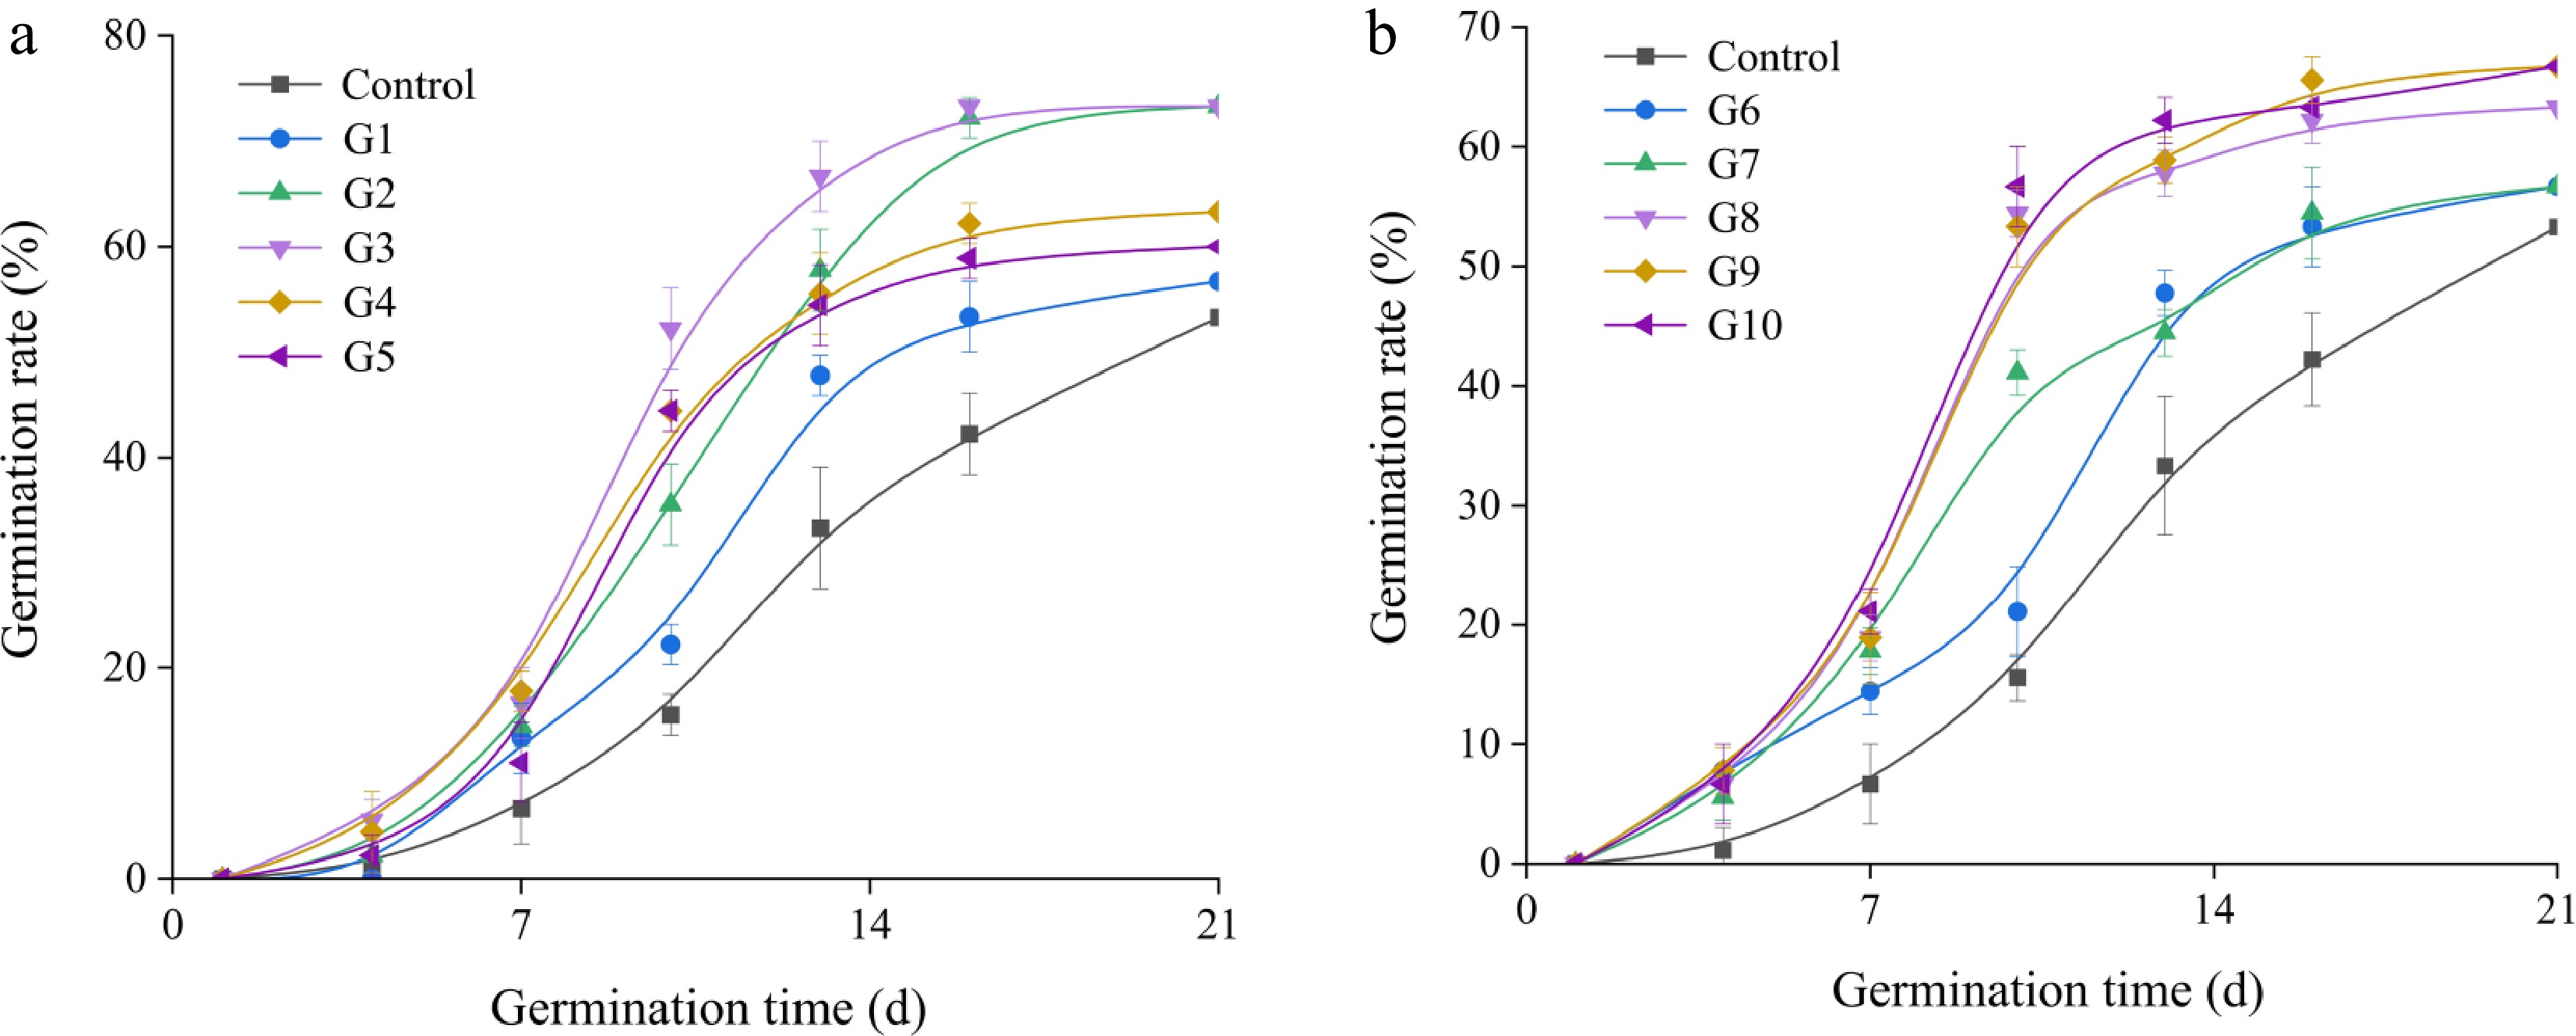
Figure 5.
Germination dynamics of I. typhifolia seeds under GA3 treatment for (a) 1 d, and (b) 2 d. Different vertical bars height ( ± SE) within the same column indicate a significant difference at p < 0.05.
-
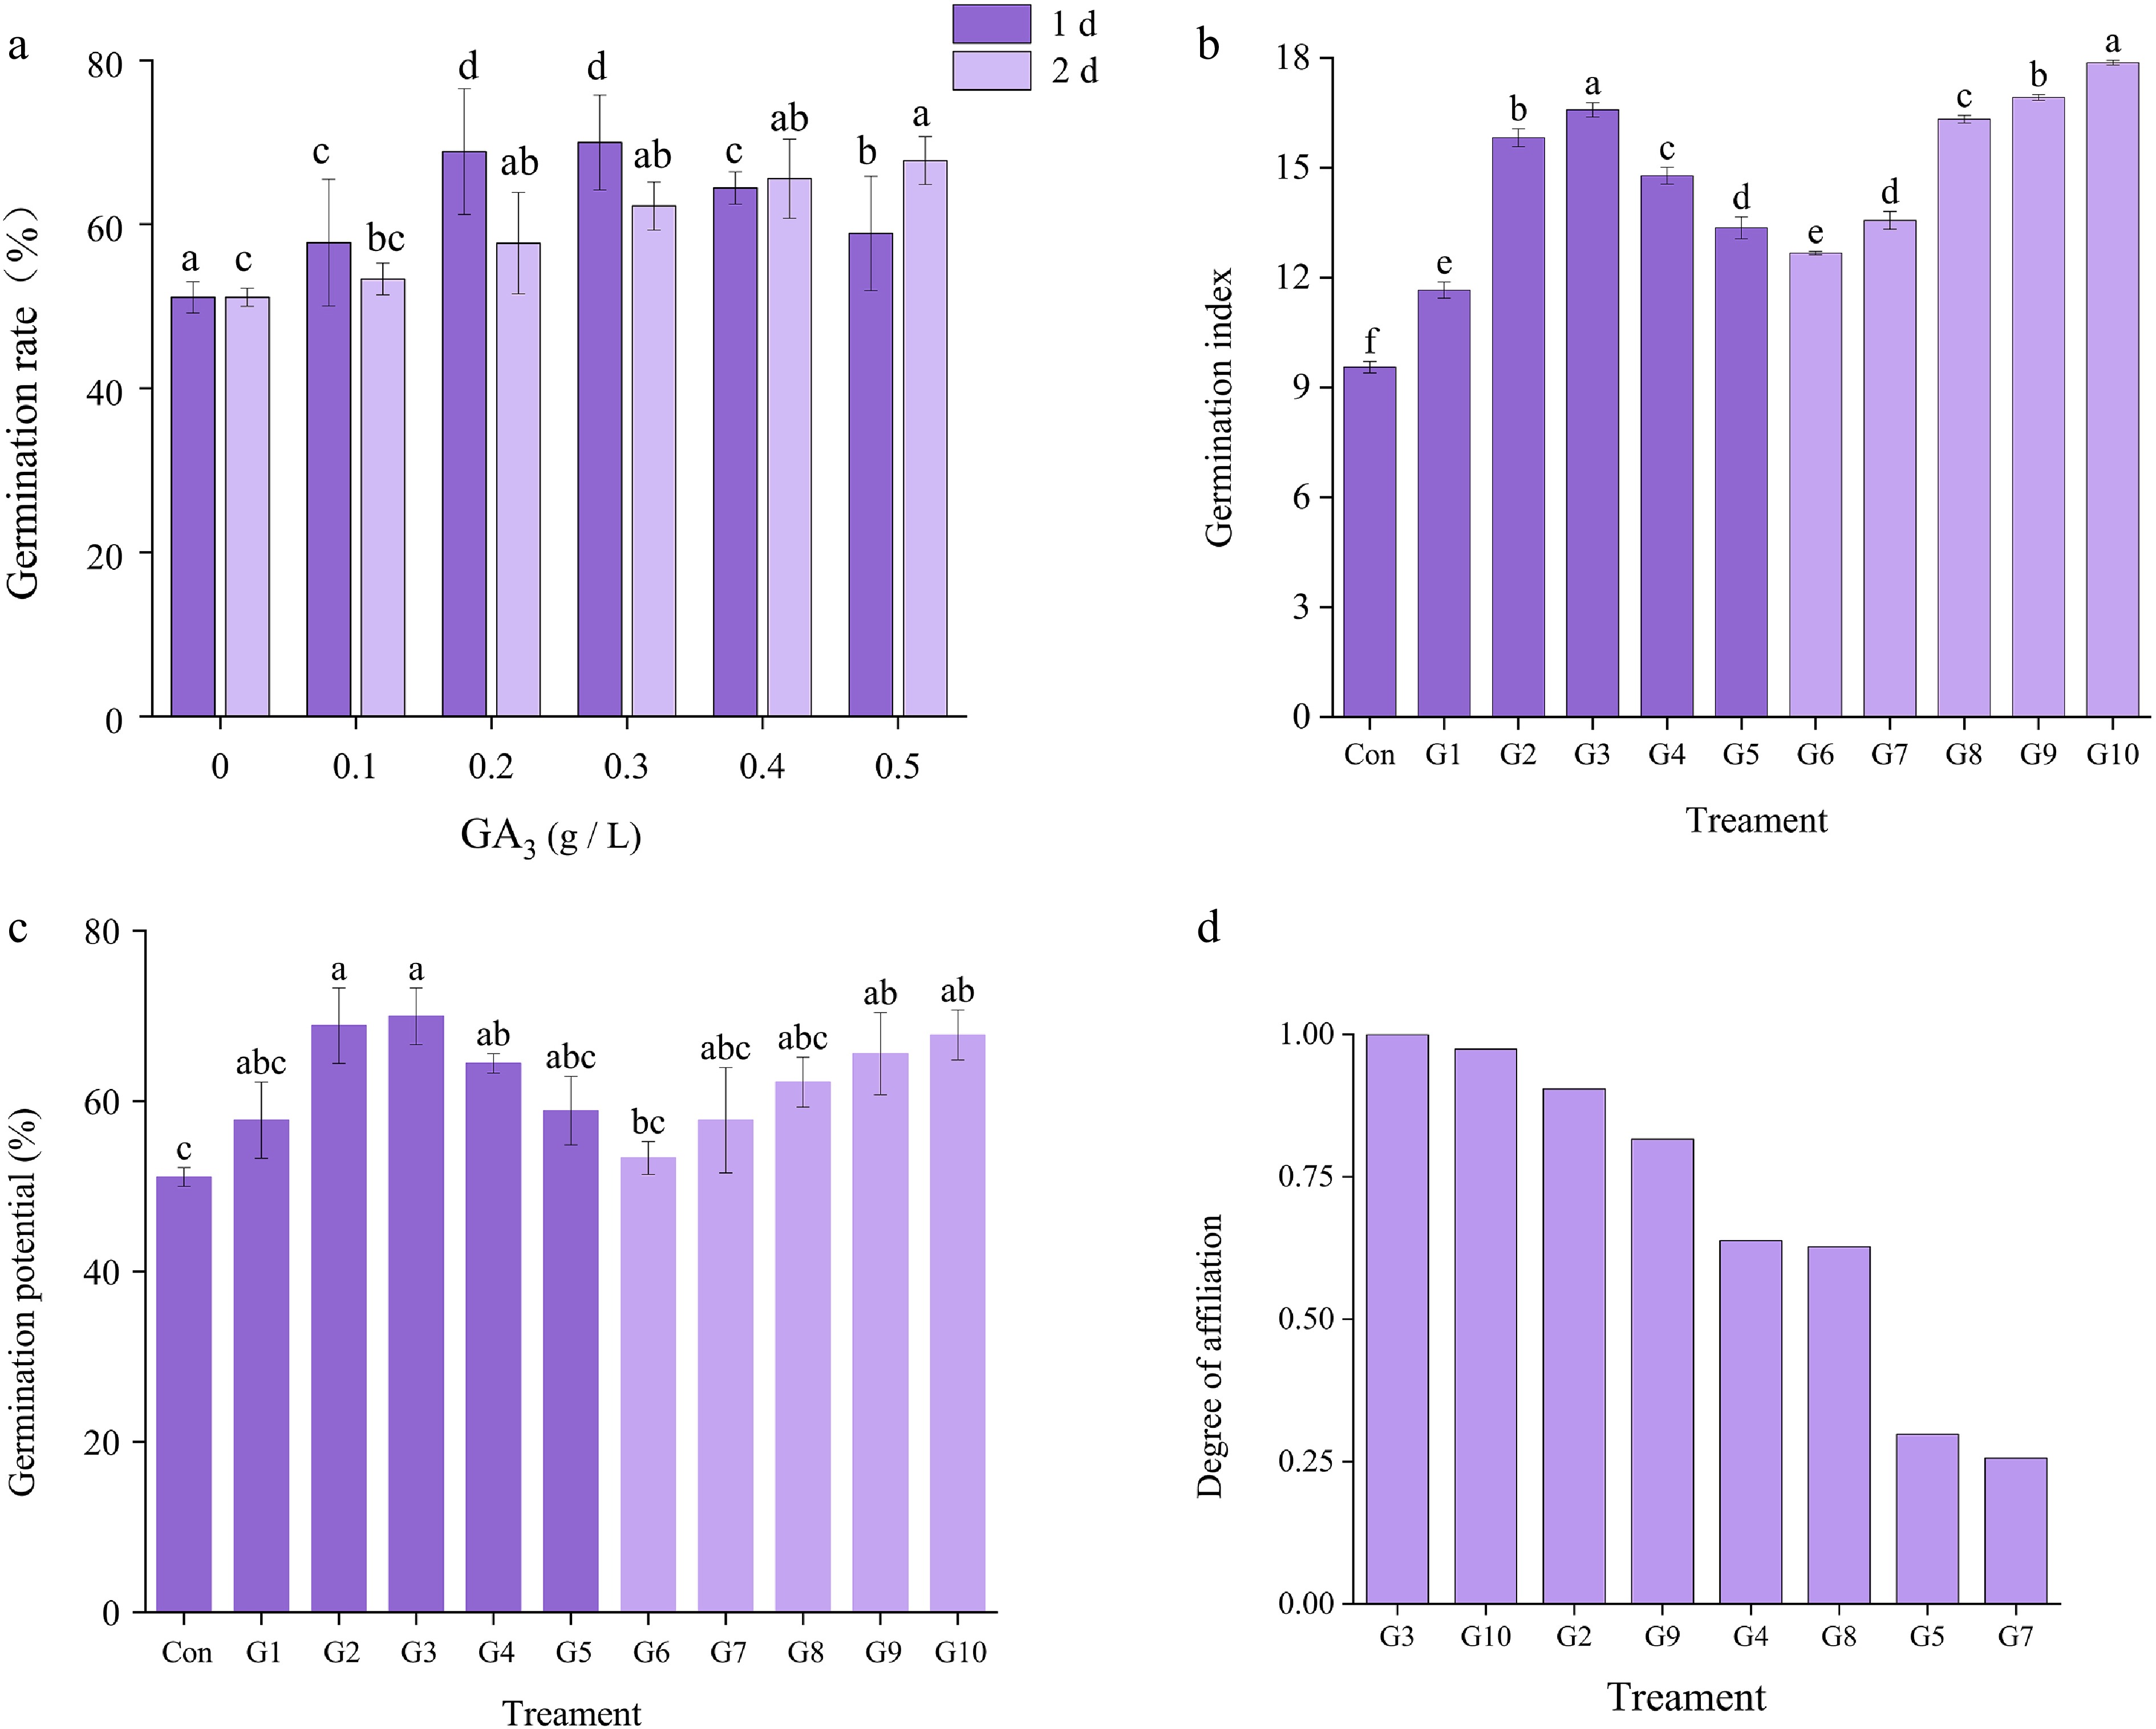
Figure 6.
Germination indexes of I. typhifolia seeds under GA3 treatment for 1 and 2 d. (a) Germination rate. (b) Germination index. (c) Germination potential. (d) Comprehensive analysis of the membership function of seed germination of I. typhifolia seeds after GA3 treatment. Note: The results are means of three replicates (n = 3) ± standard error. Different letters within the same column indicate a significant difference at p < 0.05 according to ANOVA and Duncan's test.
-
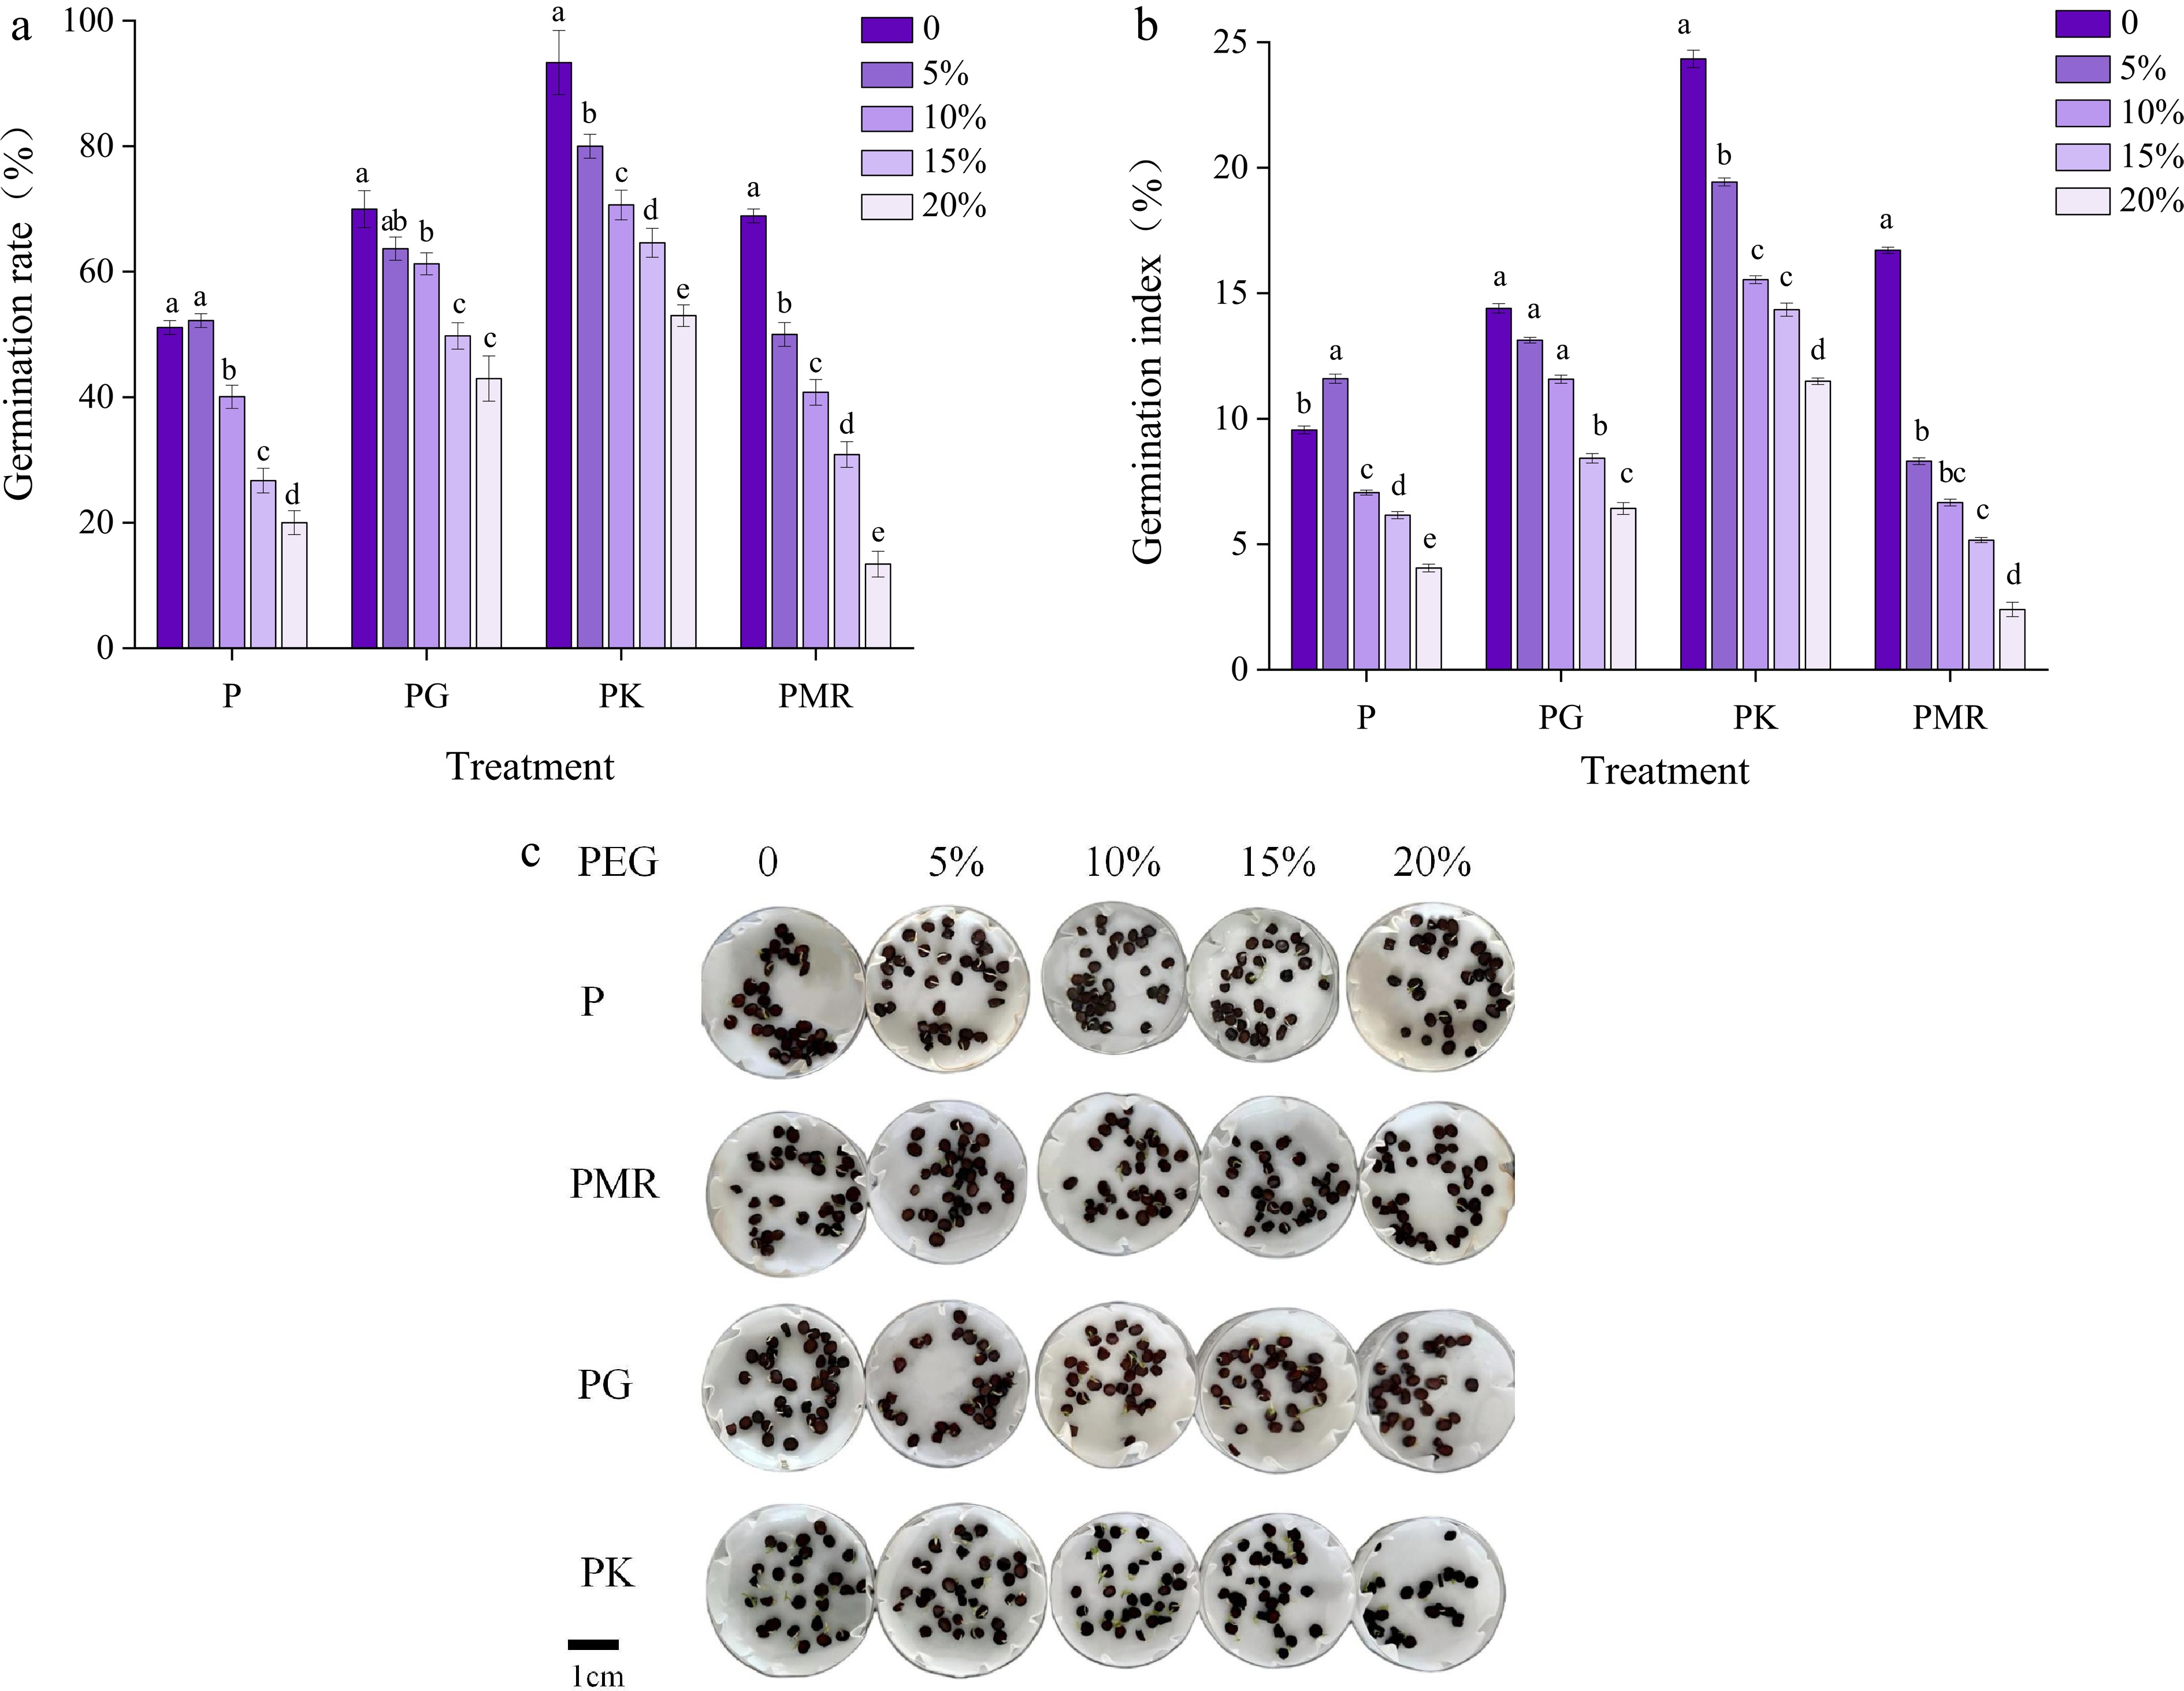
Figure 7.
Alleviation effects of different treatments on the germination of I. typhifolia seeds under drought stress. (a) Germination rate. (b) Germination index. (c) Status of seeds germinated under drought stress for 21 d after different treatments. Note: The results are means of three replicates (n = 3) ± standard error. Different letters within the same column indicate a significant difference at p < 0.05 according to ANOVA and Duncan's test.
-
Number Designation Treatment 1 Control water 2 K1 1.0 g·L−1 KNO3, for 1 d 3 K2 3.0 g·L−1 KNO3, for 1 d 4 K3 5.0 g·L−1 KNO3, for 1 d 5 K4 1.0 g·L−1 KNO3, for 2 d 6 K5 3.0 g·L−1 KNO3, for 2 d 7 K6 5.0 g·L−1 KNO3, for 2 d 8 K7 1.0 g·L−1 KNO3, for 4 d 9 K8 3.0 g·L−1 KNO3, for 4 d 10 K9 5.0 g·L−1 KNO3, for 4 d 11 M1 Microwave 450 W, for 5 s 12 M2 Microwave 450 W, for 10 s 13 M3 Microwave 450 W, for 15 s 14 M4 Microwave 450 W, for 20 s 15 M5 Microwave 700 W, for 5 s 16 M6 Microwave 700 W, for 10 s 17 M7 Microwave 700 W, for 15 s 18 M8 Microwave 700 W, for 20 s 19 G1 0.1 g·L−1 GA3, for 1 d 20 G2 0.2 g·L−1 GA3, for 1 d 21 G3 0.3 g·L−1 GA3, for 1 d 22 G4 0.4 g·L−1 GA3, for 1 d 23 G5 0.5 g·L−1 GA3, for 1 d 24 G6 0.1 g·L−1 GA3, for 2 d 25 G7 0.2 g·L−1 GA3, for 2 d 26 G8 0.3 g·L−1 GA3, for 2 d 27 G9 0.4 g·L−1 GA3, for 2 d 28 G10 0.5 g·L−1 GA3, for 2 d 29 P1 Control followed by 5% PEG-6000 30 P2 Control followed by 10% PEG-6000 31 P3 Control followed by 15% PEG-6000 32 P4 Control followed by 20% PEG-6000 33 PG1 G3 followed by 5% PEG-6000 34 PG2 G3 followed by 10% PEG-6000 35 PG3 G3 followed by 15% PEG-6000 36 PG4 G3 followed by 20% PEG-6000 37 PK1 K4 followed by 5% PEG-6000 38 PK2 K4 followed by 10% PEG-6000 39 PK3 K4 followed by 15% PEG-6000 40 PK4 K4 followed by 20% PEG-6000 41 PMR1 M6 followed by 5% PEG-6000 42 PMR2 M6 followed by 10% PEG-6000 43 PMR3 M6 followed by 15% PEG-6000 44 PMR4 M6 followed by 20% PEG-6000 Table 1.
Treatments with different solution concentrations, power levels, and treatment durations.
Figures
(7)
Tables
(1)