-
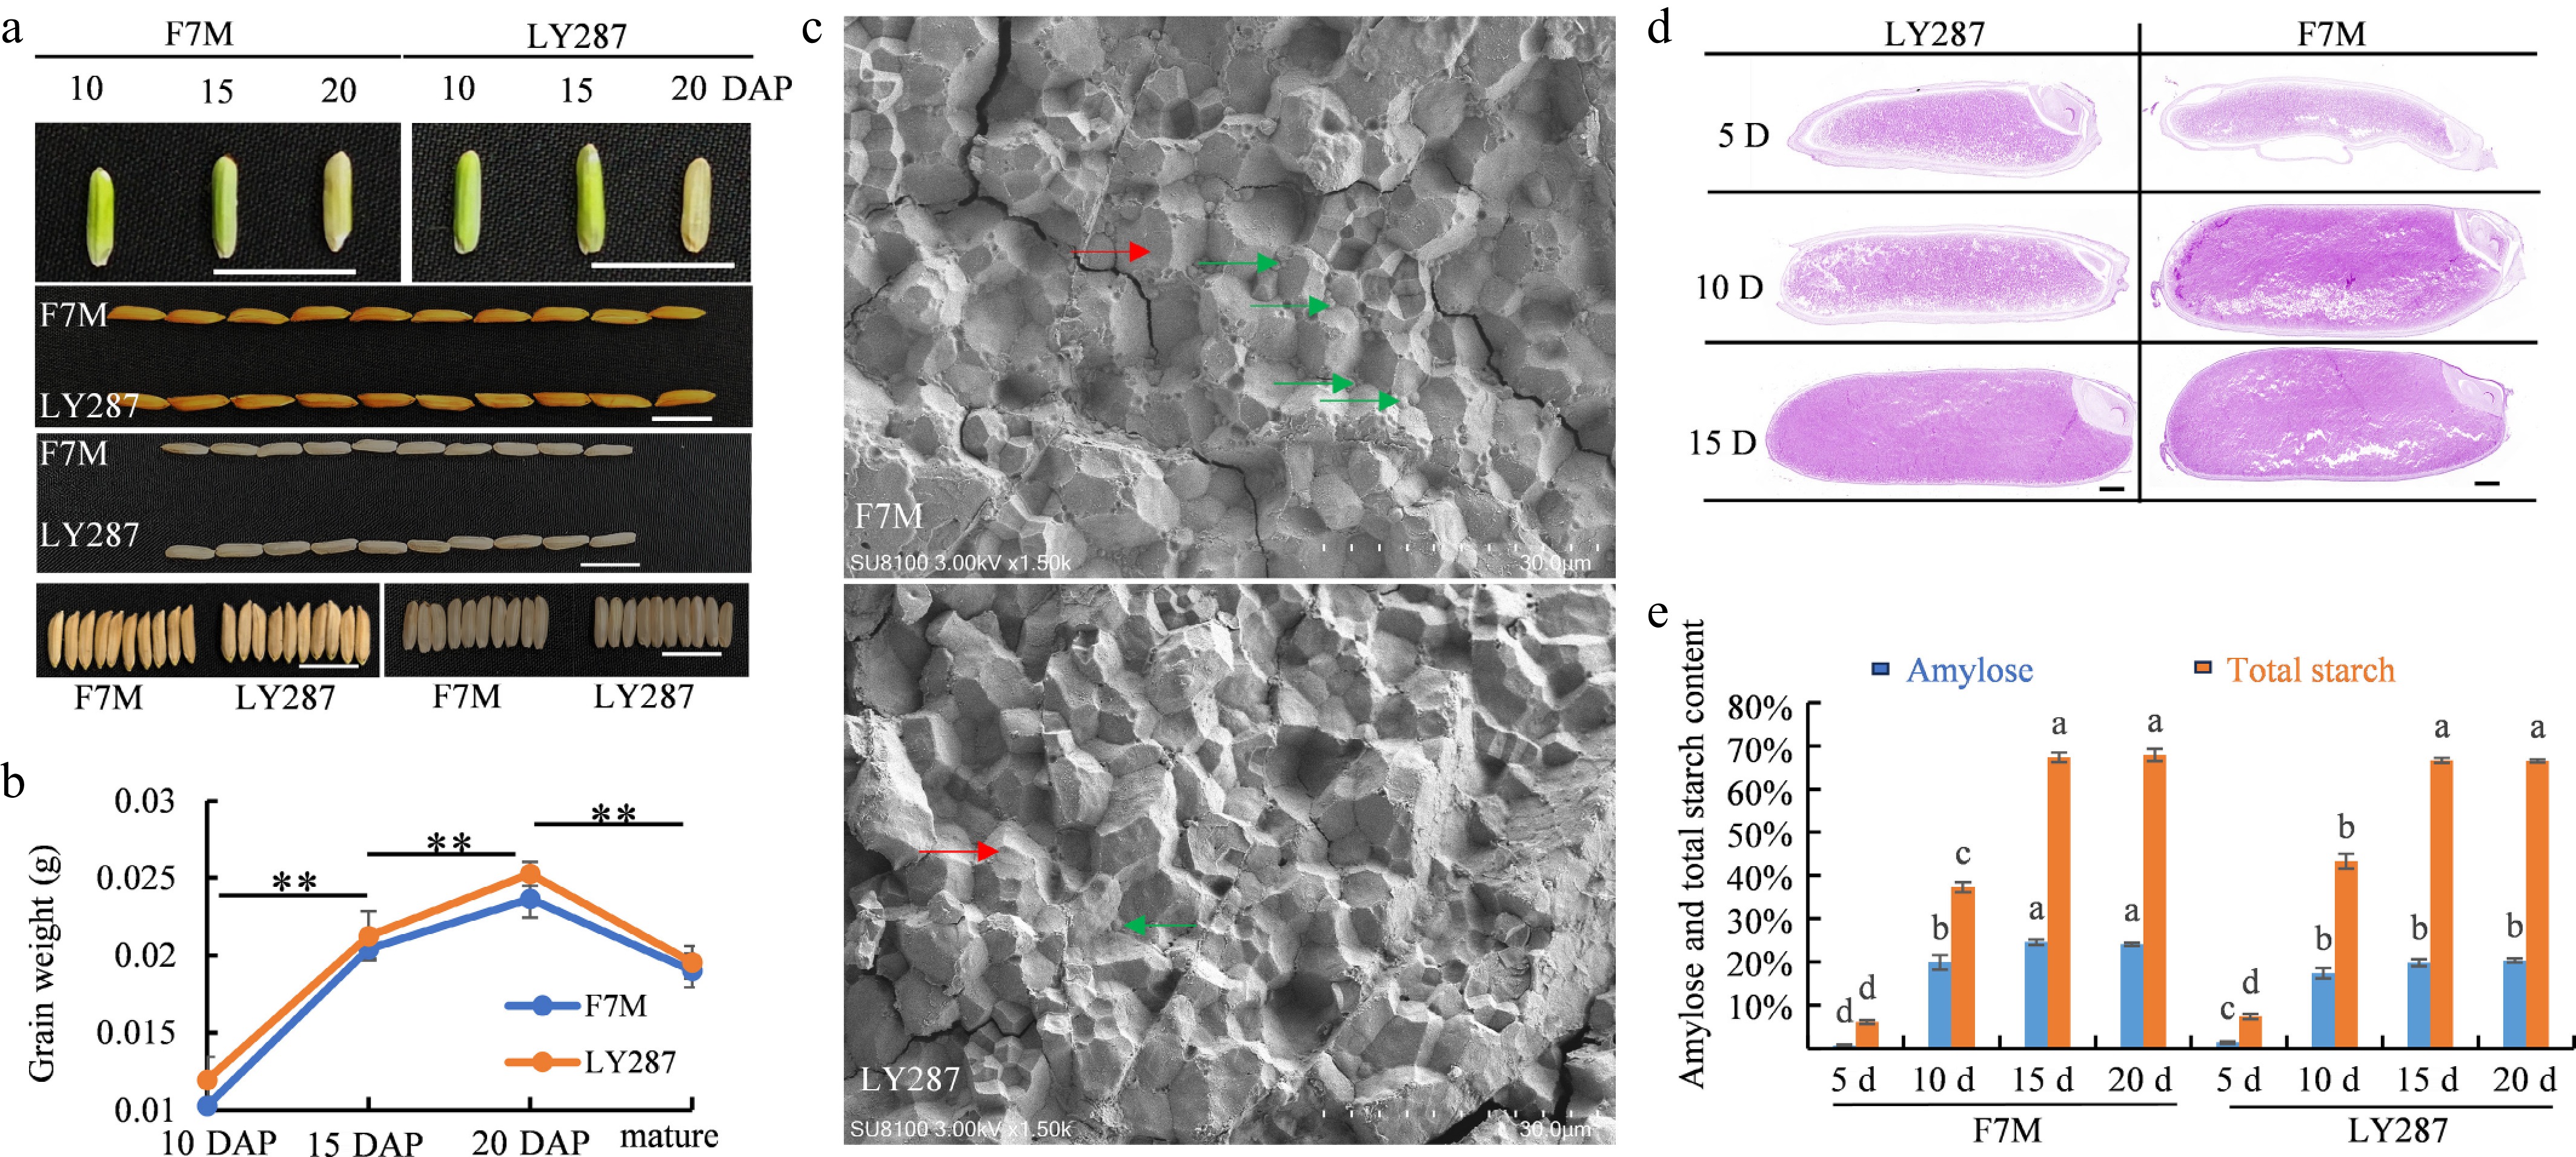
Figure 1.
Characteristics of grain appearance and structure of starch in Liangyou 287 (LY287), and male parent F7M. (a) Grain appearance traits of LY287 and male parent F7M at 10, 15, and 20 d after pollination (DAP), bar = 1 cm. (b) Grain weights of LY287 and male parent F7M at 10, 15, 20 DAP, and the mature stage. Significant differences were determined by Student's t-test (** p < 0.01). (c) Scanning electron microscope, SU8100, was used to visualize the starch structure of grains, bar = 30 μm, as shown above. The red arrow points to the large starch crystal structure, while the green arrow points to the small starch crystal structure. (d) Paraffin sectioning and starch granule Periodic Acid–Schiff (PAS) staining, bar = 500 μm. (e) Apparent amylose and total starch content measurement. Significant differences were determined by ANOVA (p < 0.05).
-
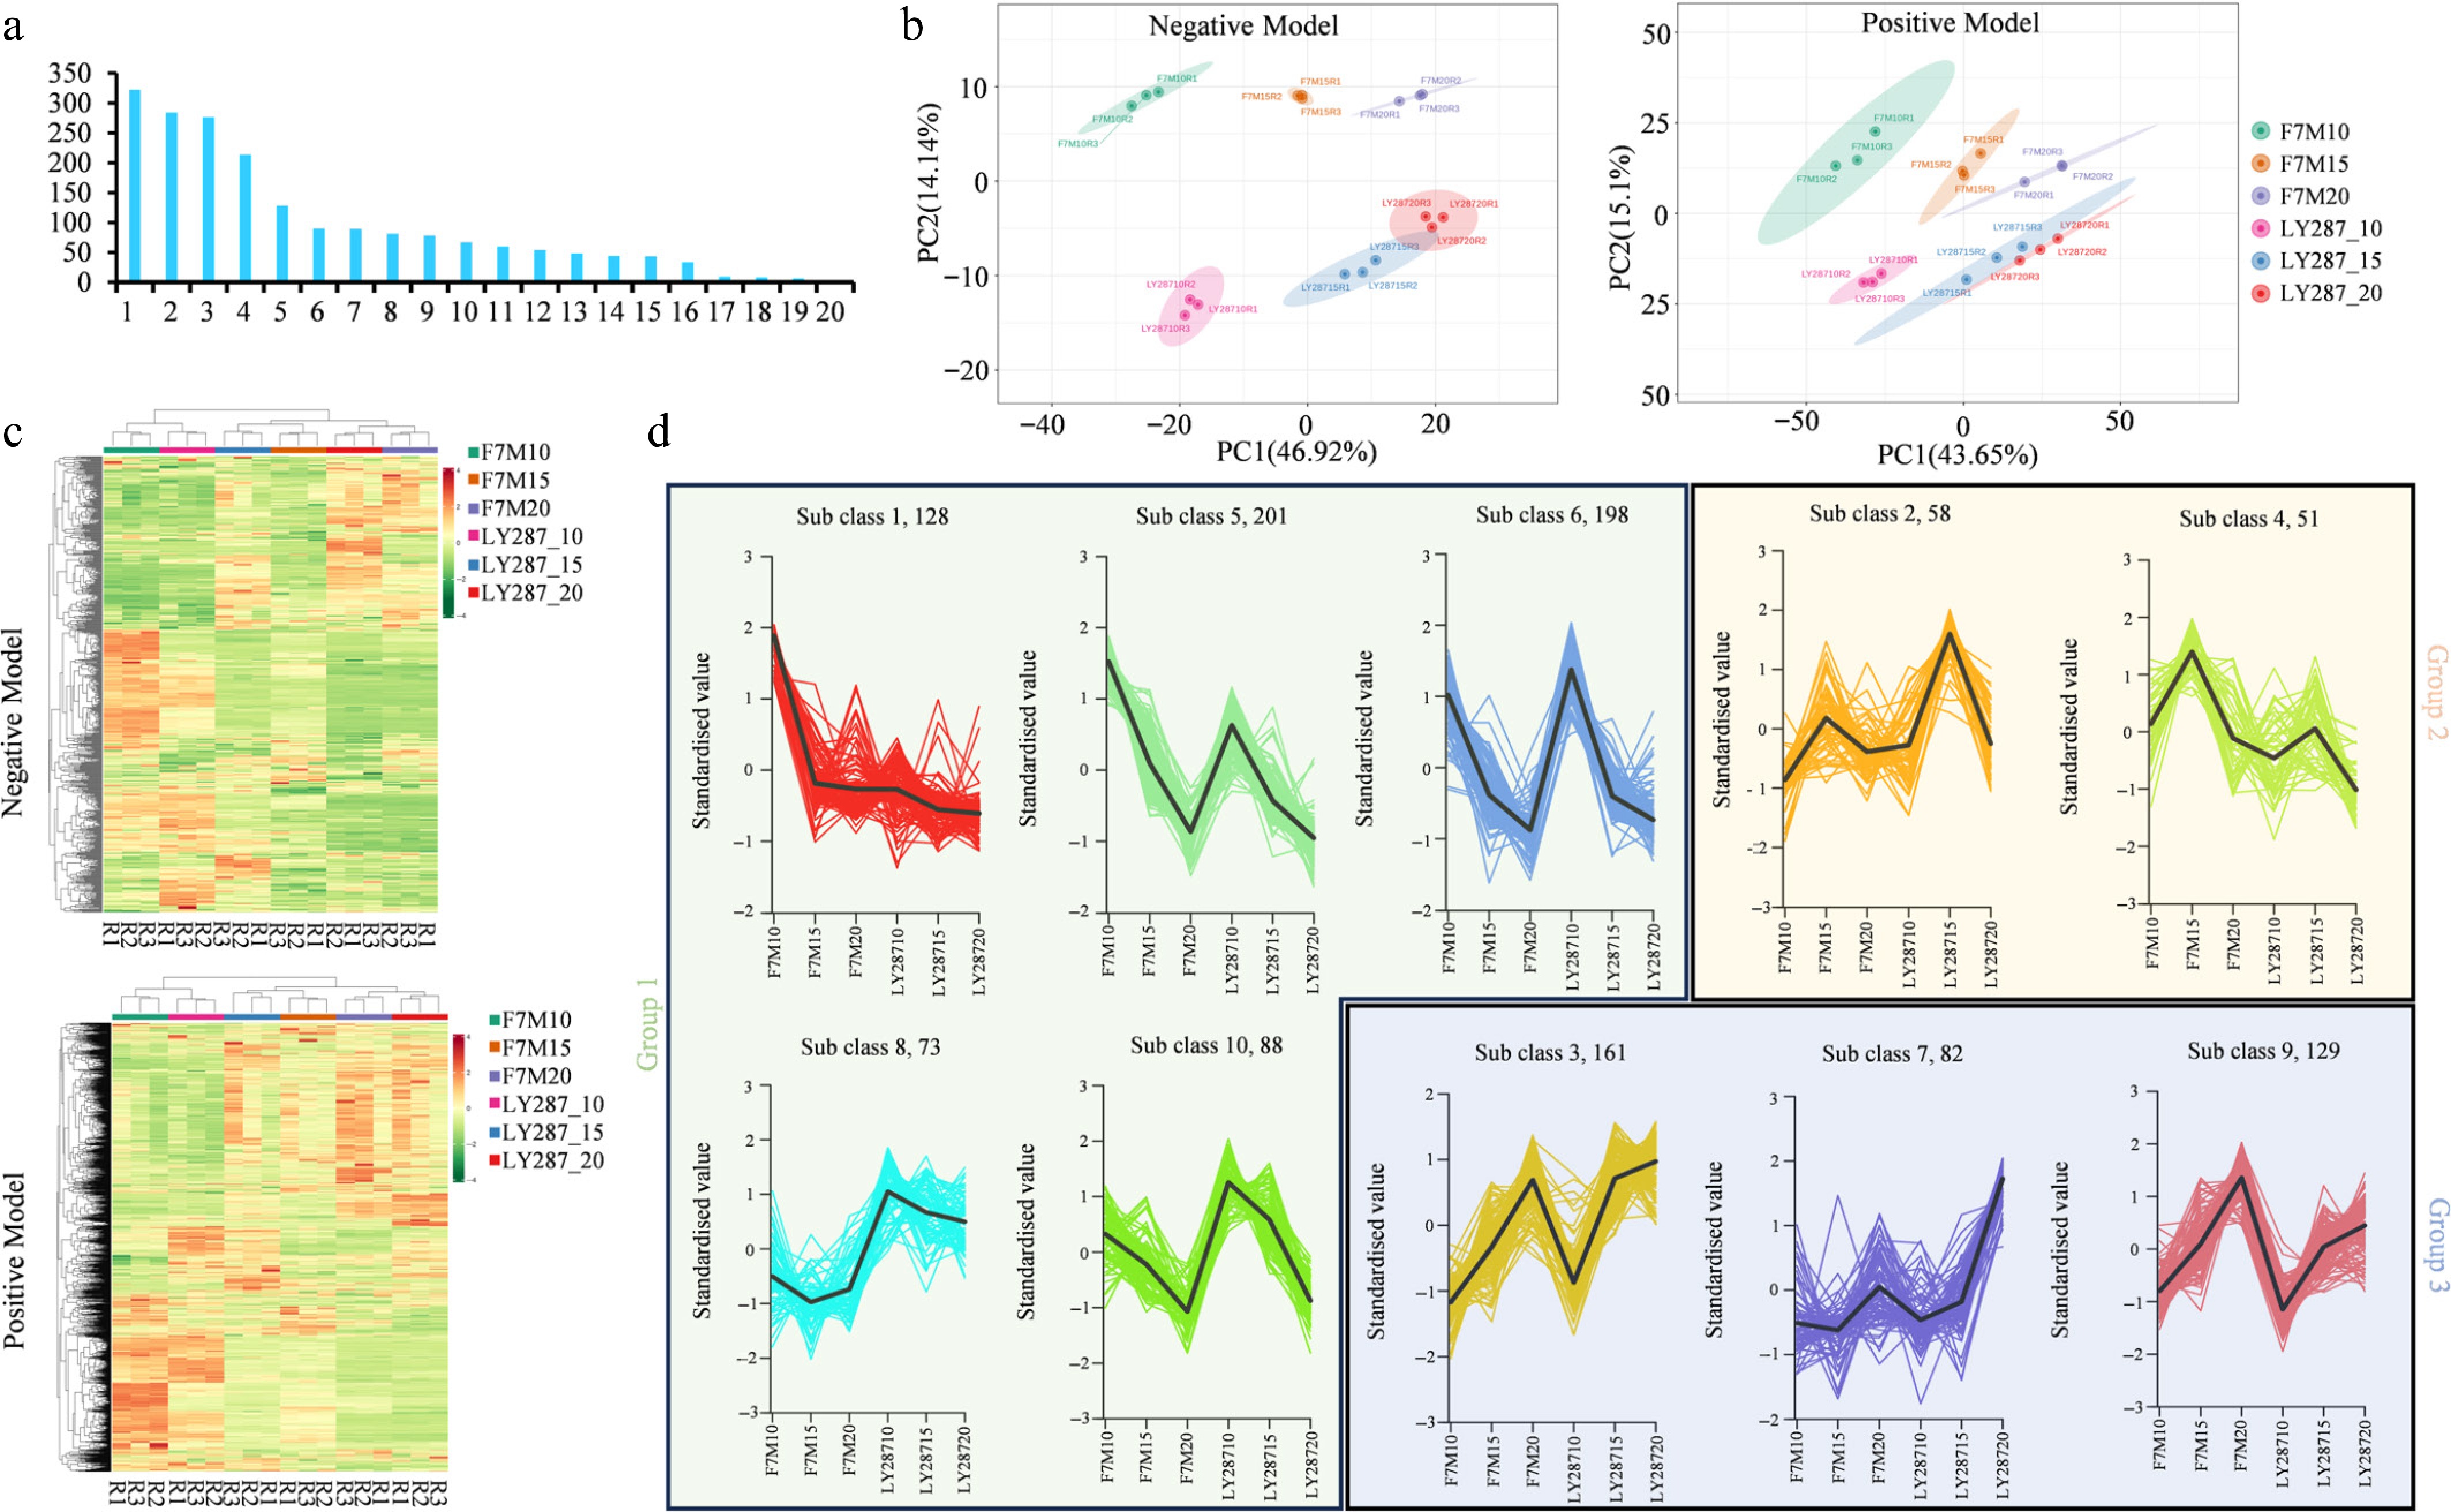
Figure 2.
Metabolites analysis of male parent F7M and hybrid LY287. (a) Categorization of metabolites discovered in rice grain. 1 to 20 means amino acids and derivatives, the unknown metabolites, organic acids, benzene and substituted derivatives, lipids, flavonoids, alcohol and amines, alkaloids, glycoprotein, heterocyclic compounds, phenolic acids, nucleotides and derivatives, terpenoids, fatty acids, glycerolipids, lignin-s and coumarins, saccharolipids, steroids, quinones, tannins. (b) Principal Component Analysis (PCA) of identified metabolites in positive and negative modes. (c) Clustering heat map of identified metabolite content. R1, R2, and R3 represent three biological samples. (d) Clustering analysis of differentially accumulated metabolites (DAMs) using k-means. These DAMs can be categorized into three major groups based on their overall trends.
-
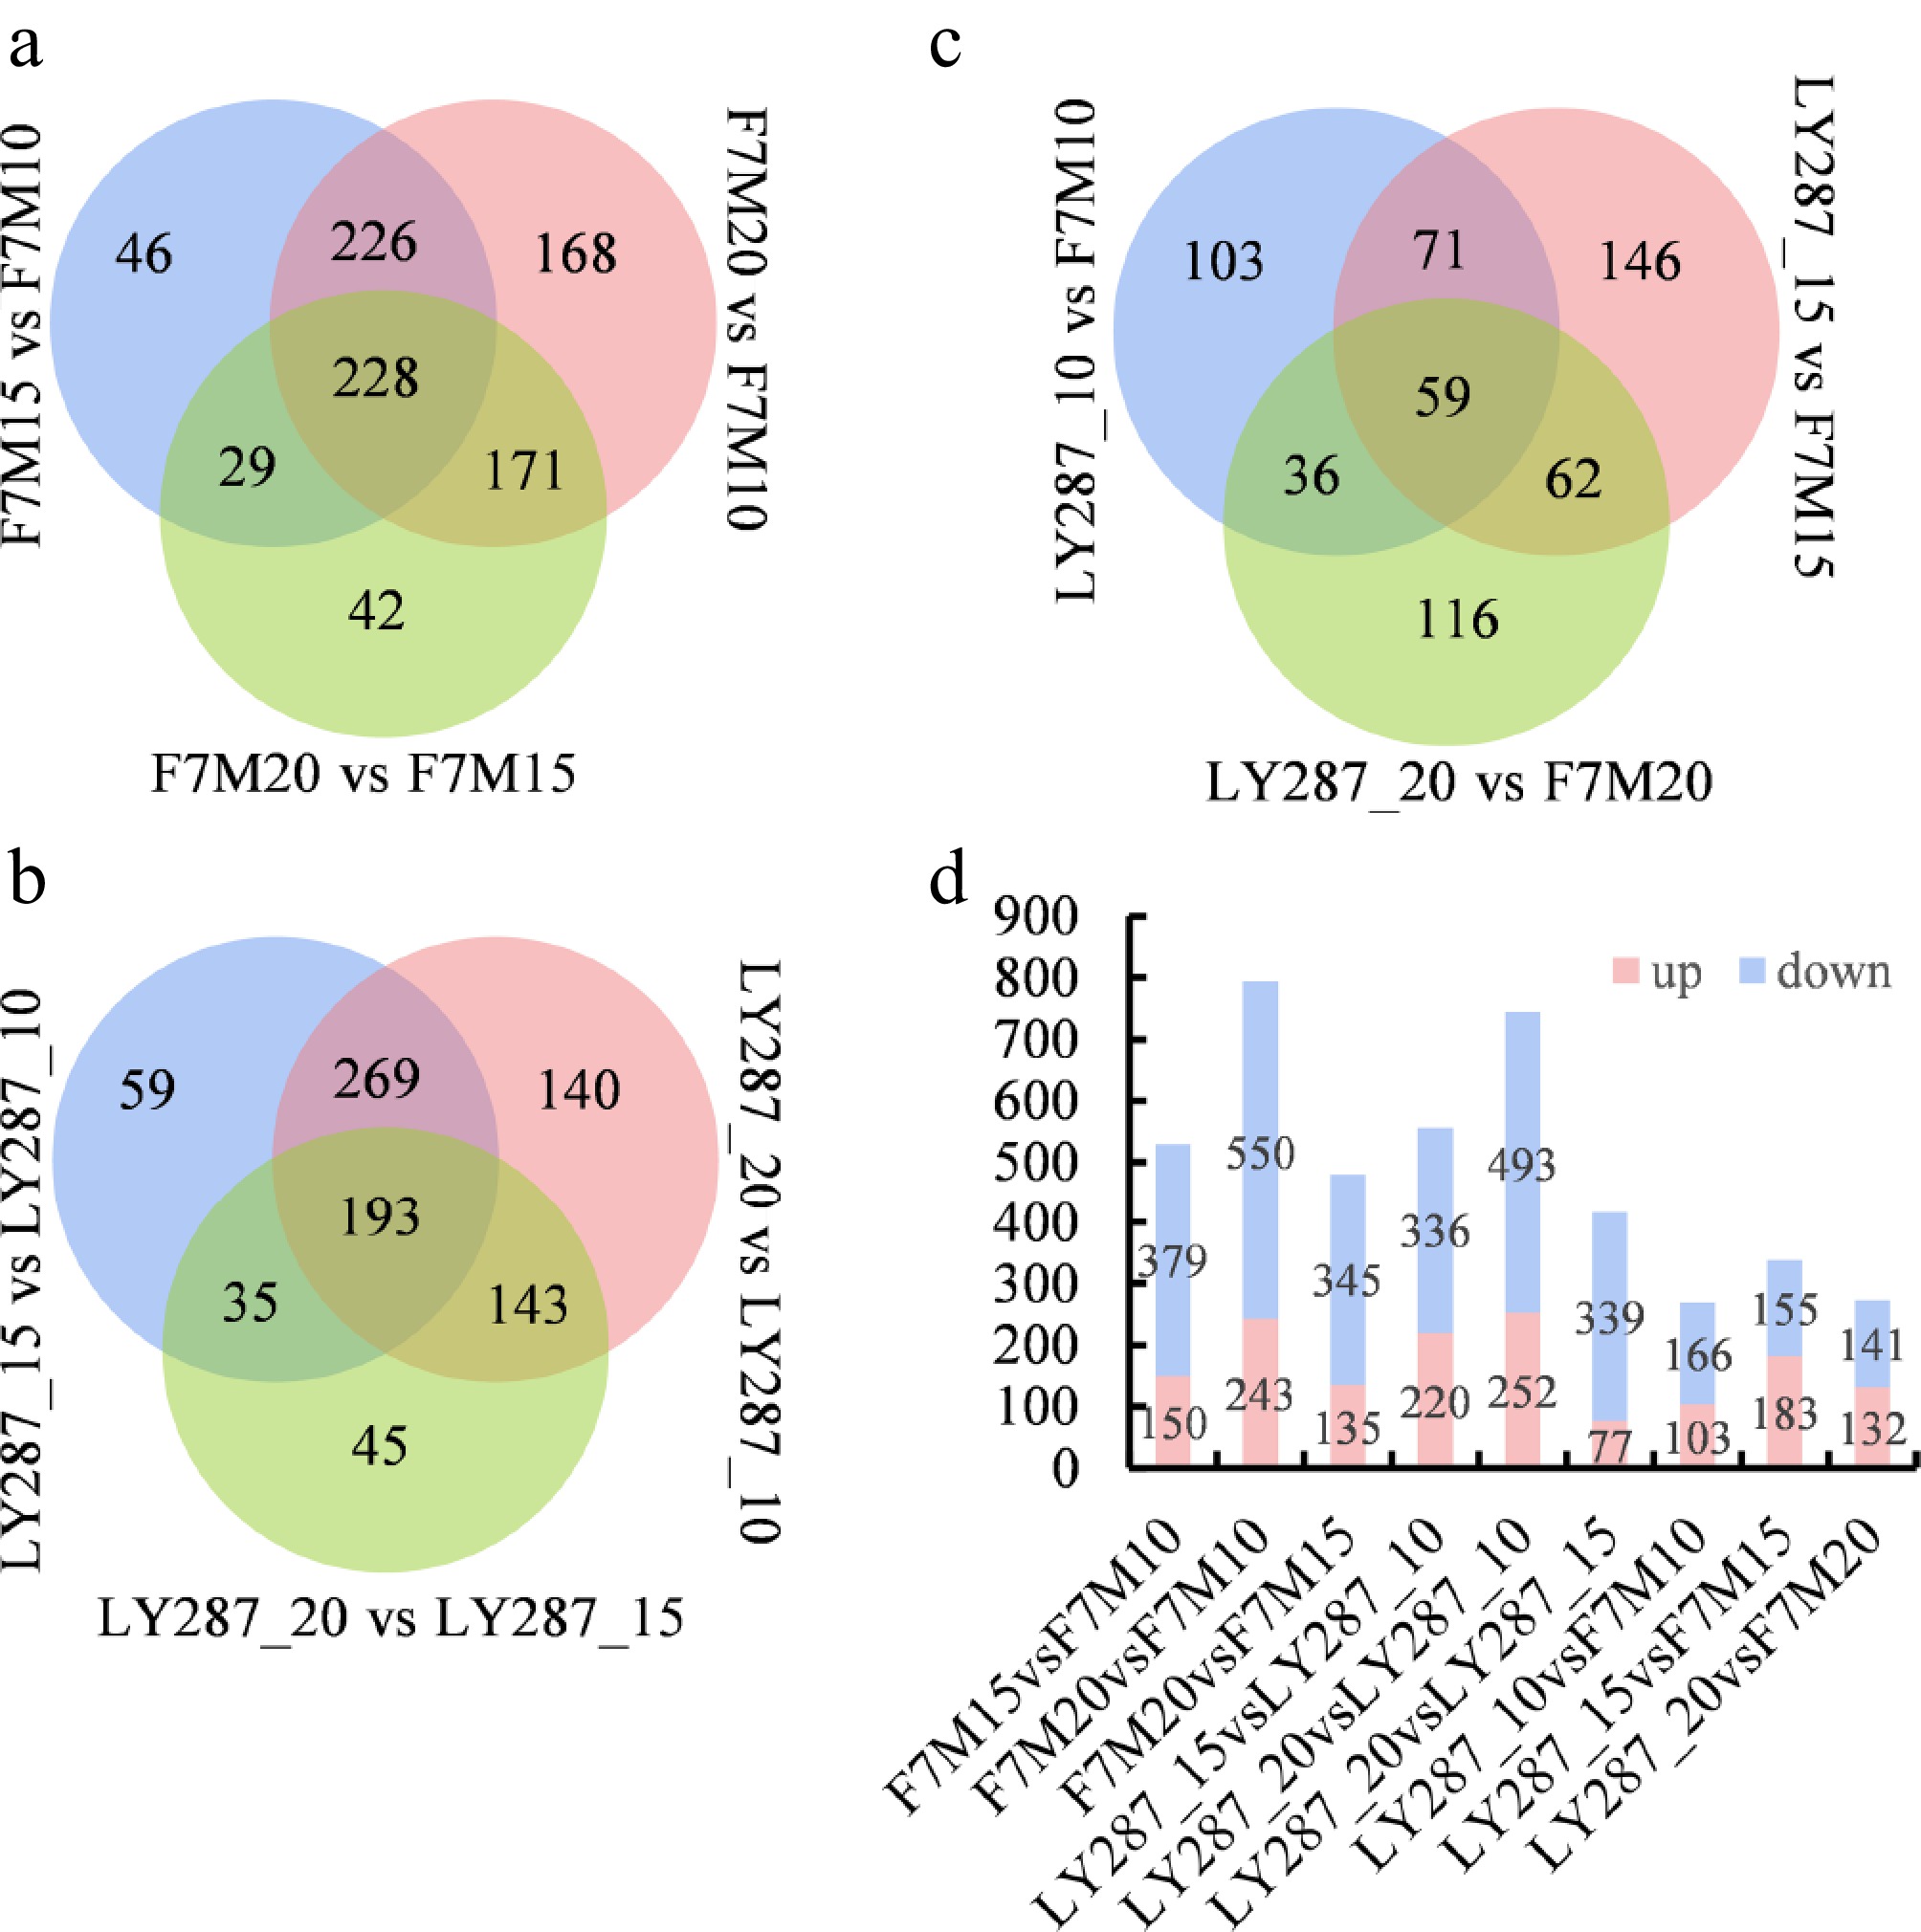
Figure 3.
Statistical analysis of differentially accumulated metabolites (DAMs). (a) Venn analysis of DAMs in F7M at three stages of grain filling. (b) Venn analysis of DAMs in LY287 at three stages of grain filling. (c) Venn analysis of DAMs between F7M and LY287 at three stages of grain filling. (d) Number of DAMs in different comparisons.
-
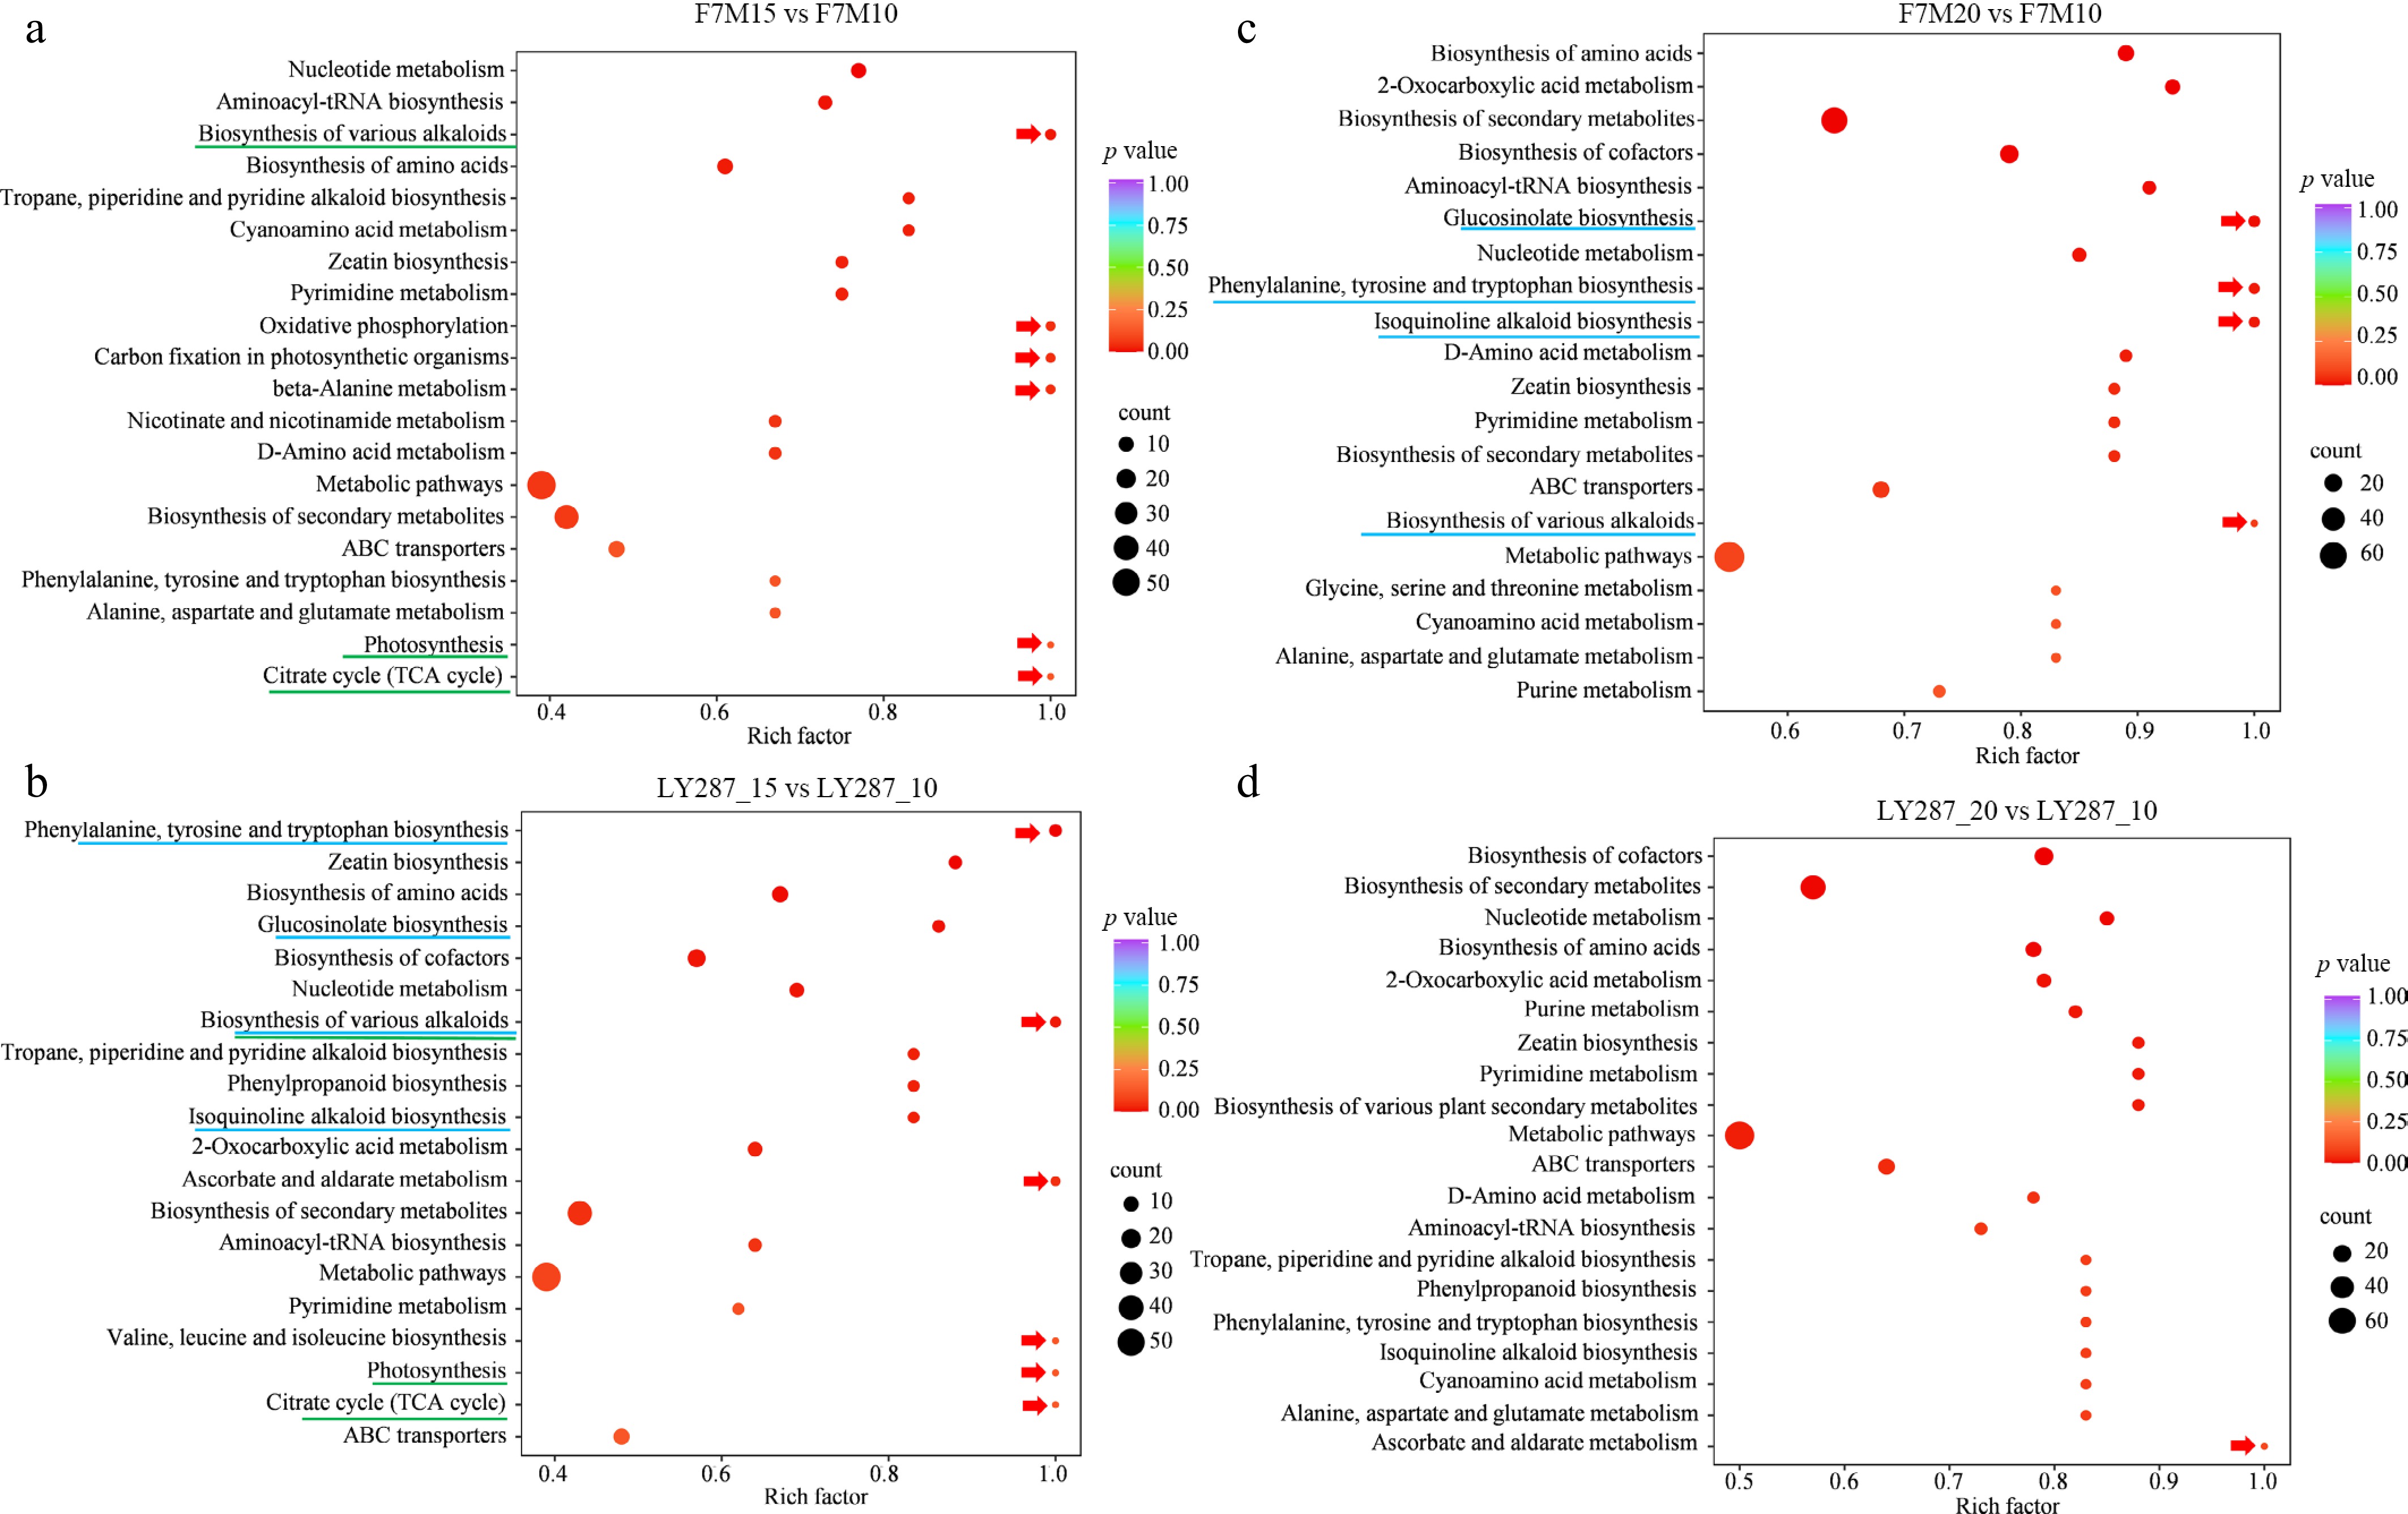
Figure 4.
KEGG enrichment analysis of DAMs. (a) Enriched pathways in F7M were discovered through the use of DAMs obtained from comparing 15 to 10 DAP. (b) Enriched pathways in LY287 were discovered through the use of DAMs obtained from comparing 15 to 10 DAP. (c) Enriched pathways in F7M were discovered through the use of DAMs obtained from comparing 20 to 10 DAP. (d) Enriched pathways in LY287 were discovered through the use of DAMs obtained from comparing 20 to 10 DAP. Red arrows indicate the most enriched pathways in each comparison.
-
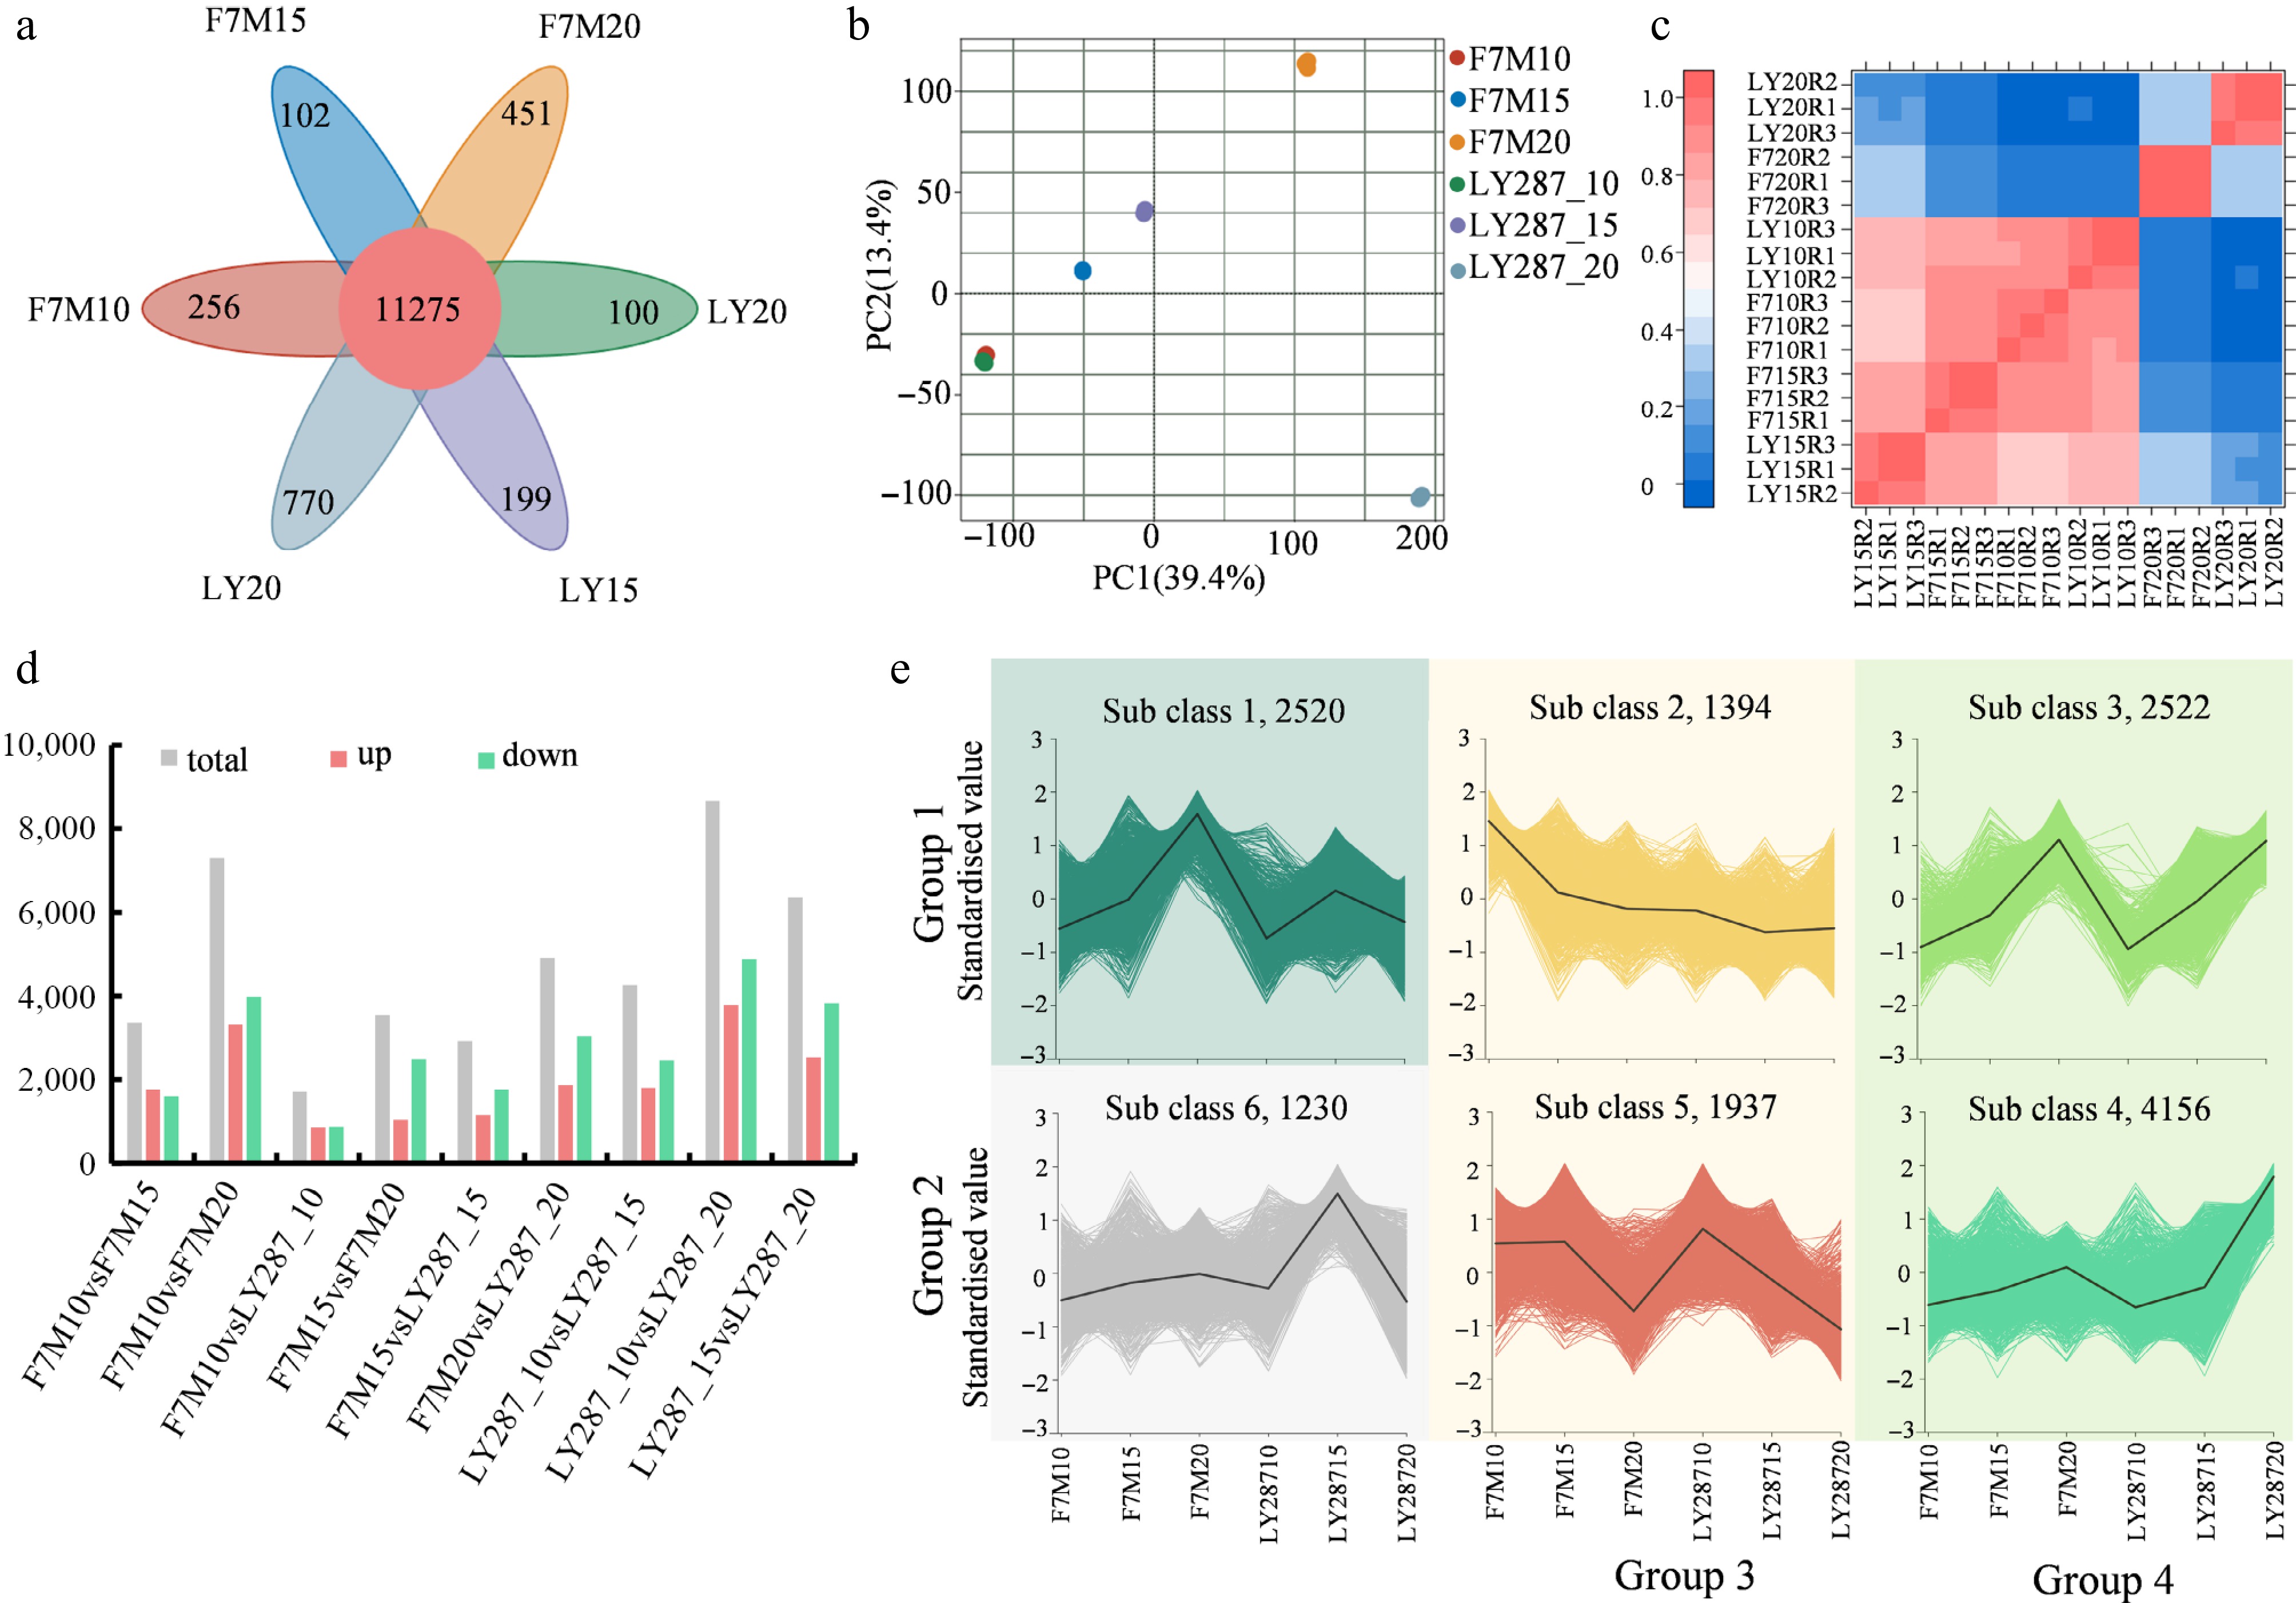
Figure 5.
Statistical analysis of differentially expressed genes (DEGs). (a) Venn analysis of DEGs in F7M and LY287at three stages of grain filling. (b) Principal component analysis (PCA) of identified genes in rice grain. (c) A heatmap illustrating the correlation among samples as determined by the Pearson correlation coefficient. A correlation coefficient approaching one indicates a stronger resemblance in expression patterns between samples. (d) Number of DEGs in different comparisons. (e) Clustering analysis of DEGs using k-means. These DEGs can be classified into four main groups according to their overall patterns.
-
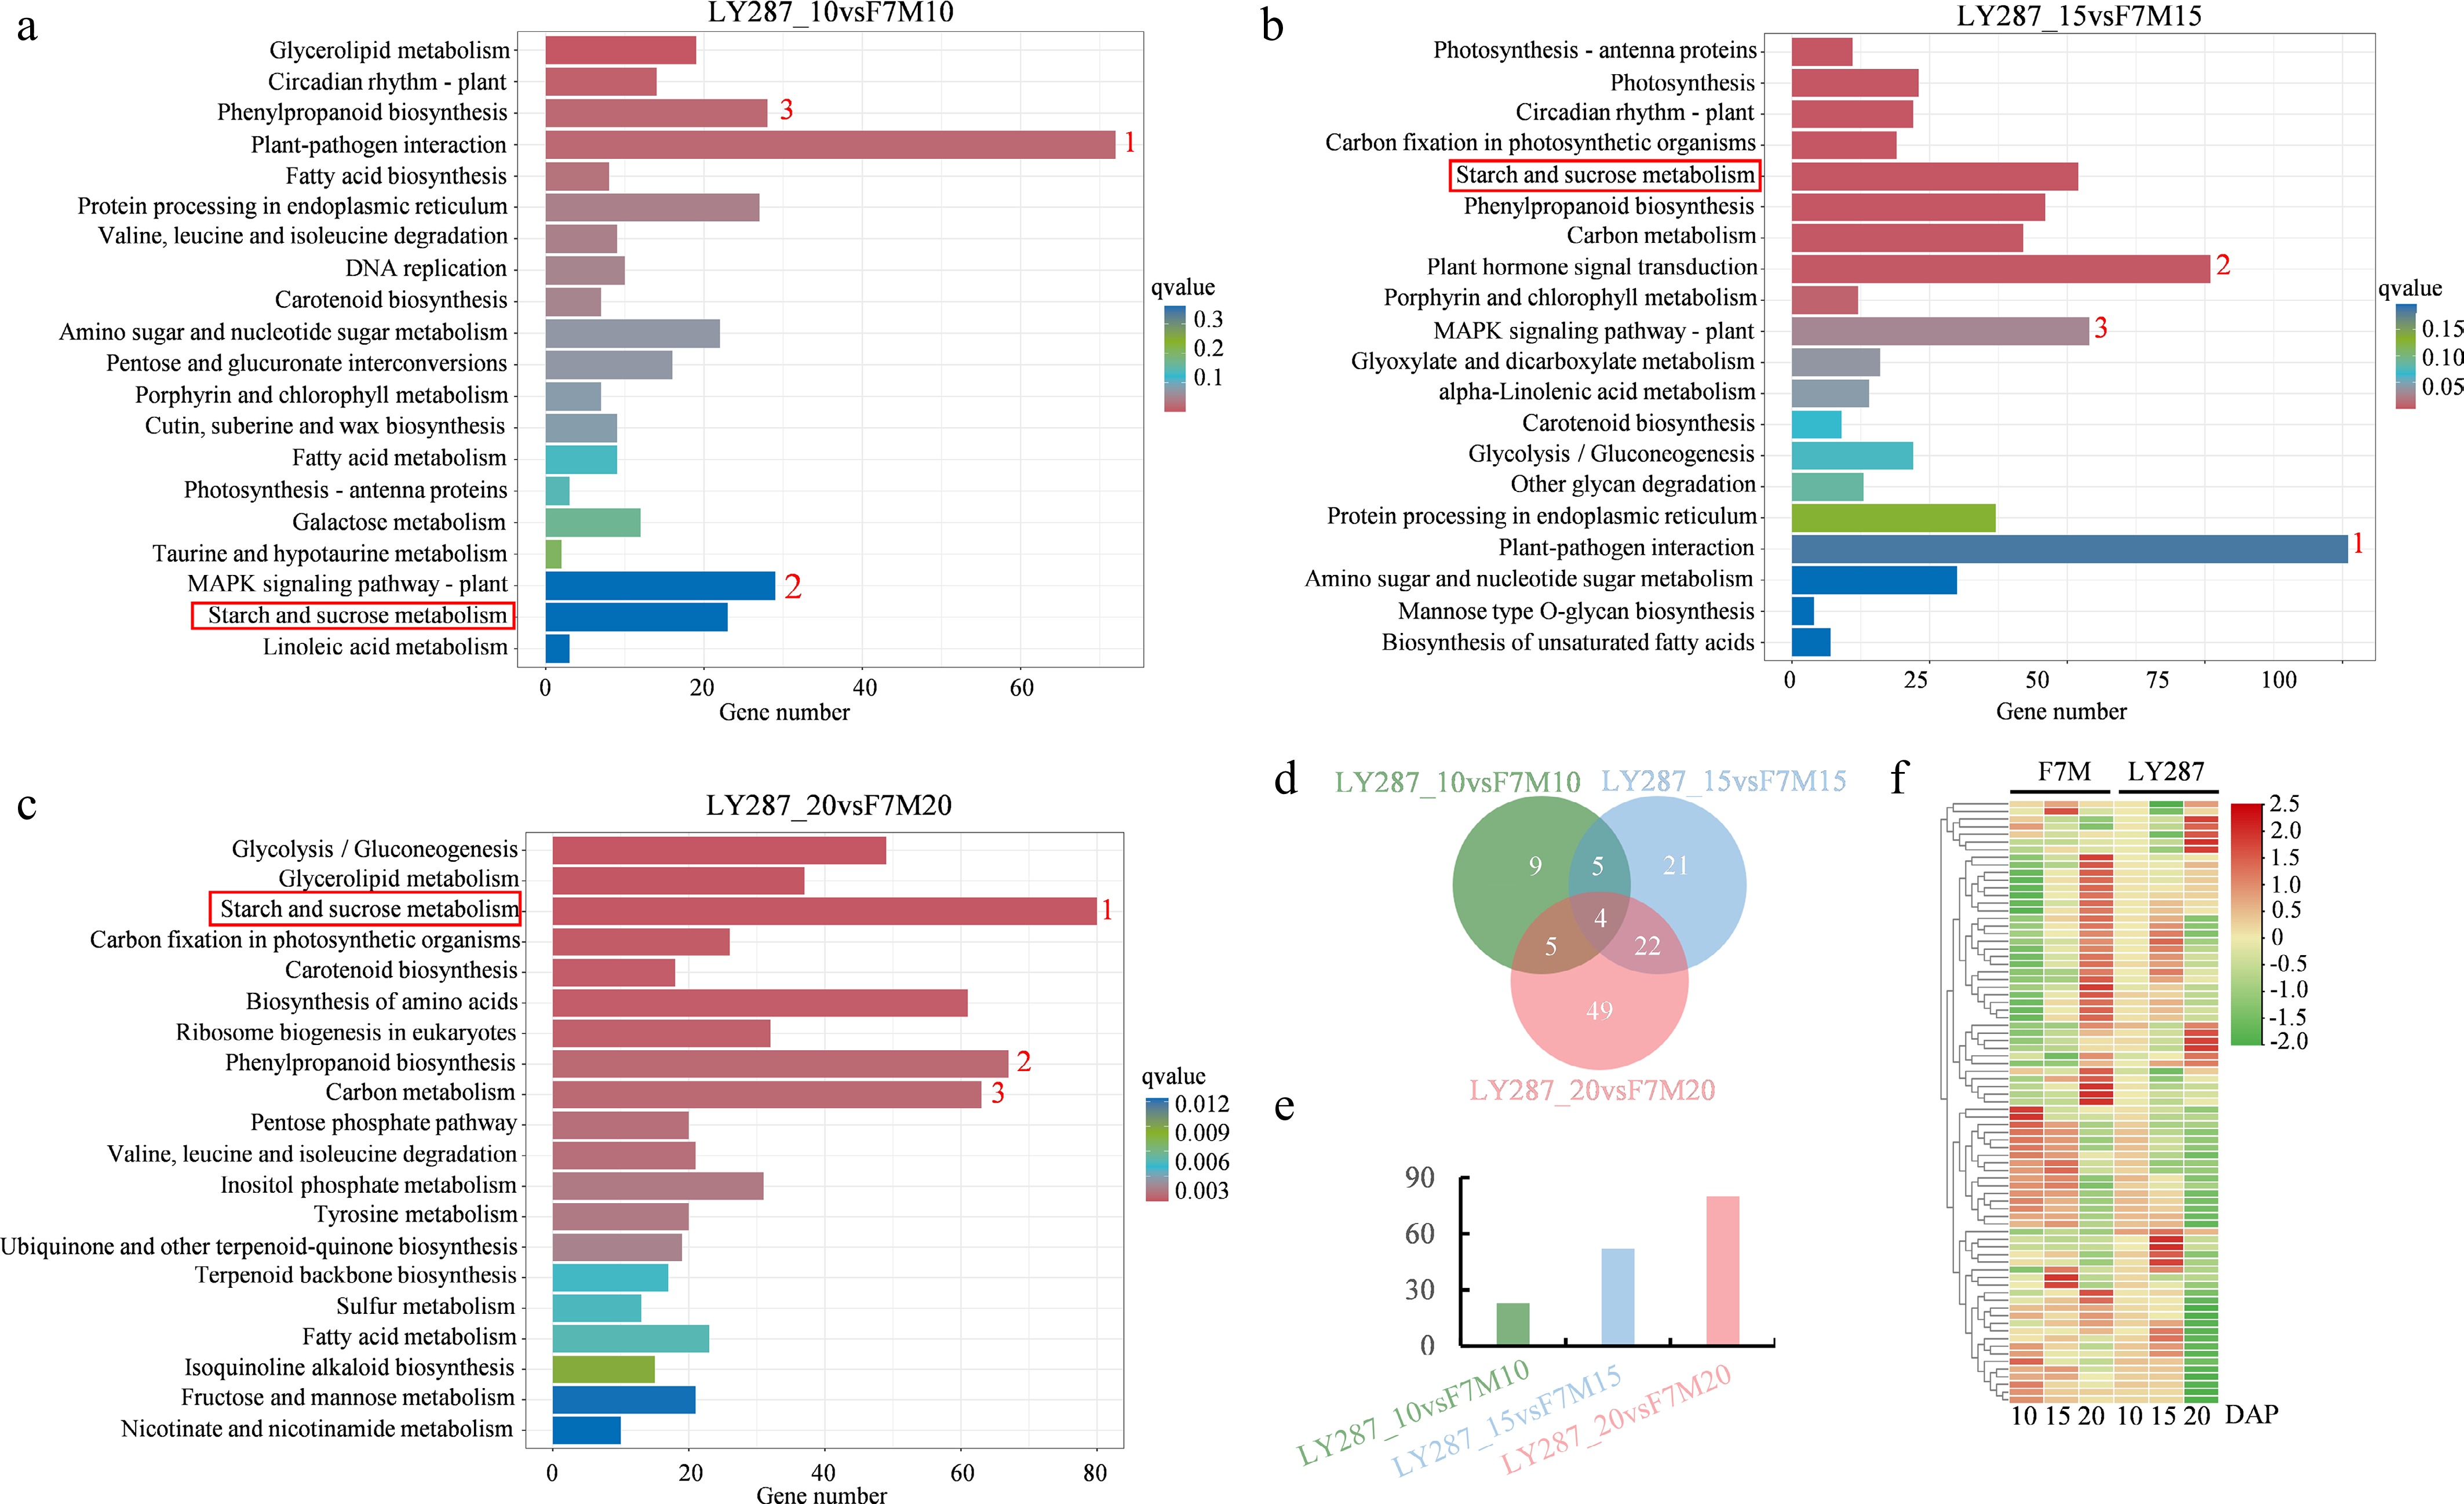
Figure 6.
Comparative KEGG analysis of F7M and LY287. (a) Enriched KEGG pathways were discovered through the use of DEGs obtained from comparing F7M and LY287 at 10 DAP. (b) Enriched KEGG pathways were discovered through the use of DEGs obtained from comparing F7M and LY287 at 15 DAP. (c) Enriched KEGG pathways were discovered through the use of DEGs obtained from comparing F7M and LY287 at 20 DAP. The red number represents the stop three enriched pathways, and the red box highlights the starch and sucrose metabolism pathways. (d) Venn analysis of DEGs related to starch and sucrose metabolism in three comparisons. (e) The number of DEGs that are specifically identified during individual comparisons. (f) Heat map showing abundance of DEGs that are specifically identified during individual comparisons (same as the DEGs in Fig. 6e).
-
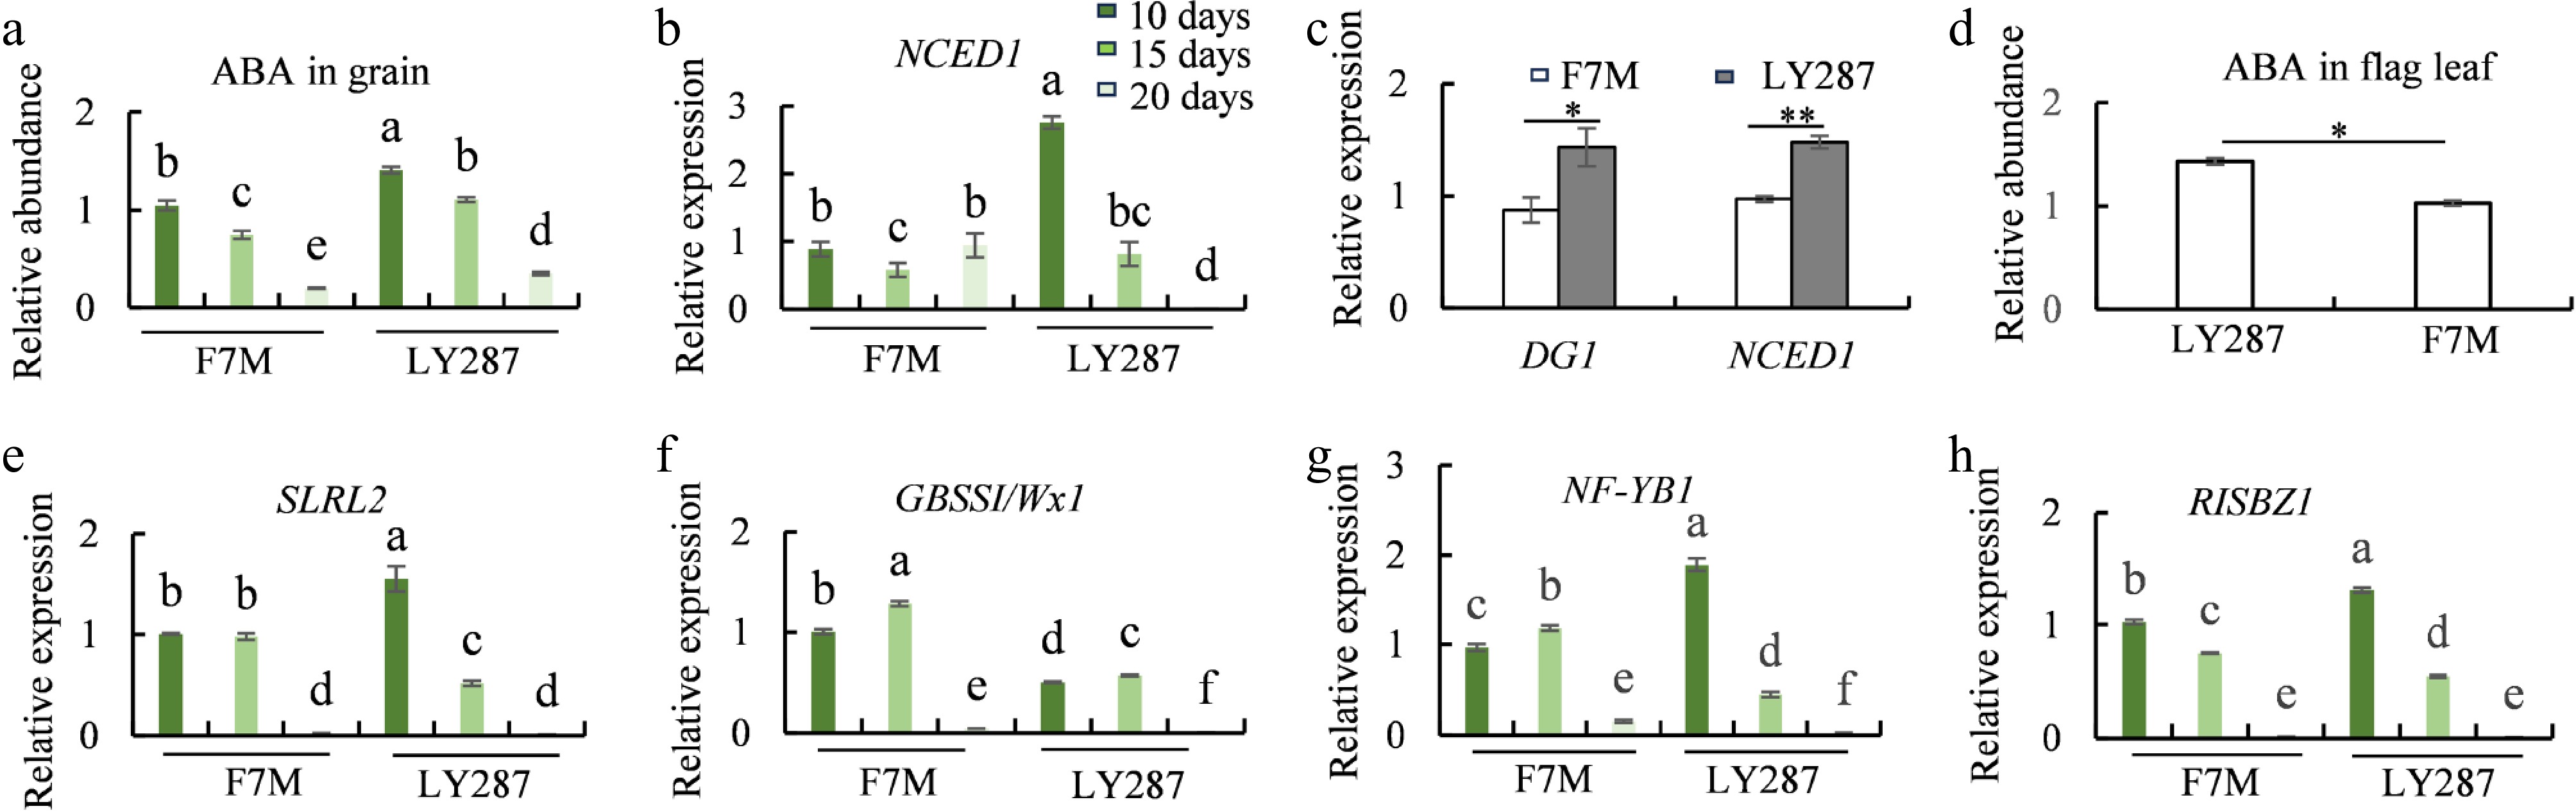
Figure 7.
ABA content and the expression of starch-synthesis-related genes. (a) ABA content in grain of male parent F7M and hybrid LY287 at different developmental stages. (b) Expression levels of NCED1 in rice grain of F7M and LY287 at different developmental stages. (c) Expression levels of DG1 and NCED1 in mature flag leaf of F7M and LY287. (d) ABA content in mature flag leaf of F7M and LY287. (e−h) Expression levels of SLRL2, GBSSI, NF-YB1, and RISBZ1 in rice grain of F7M and LY287 at different developmental stages.
-
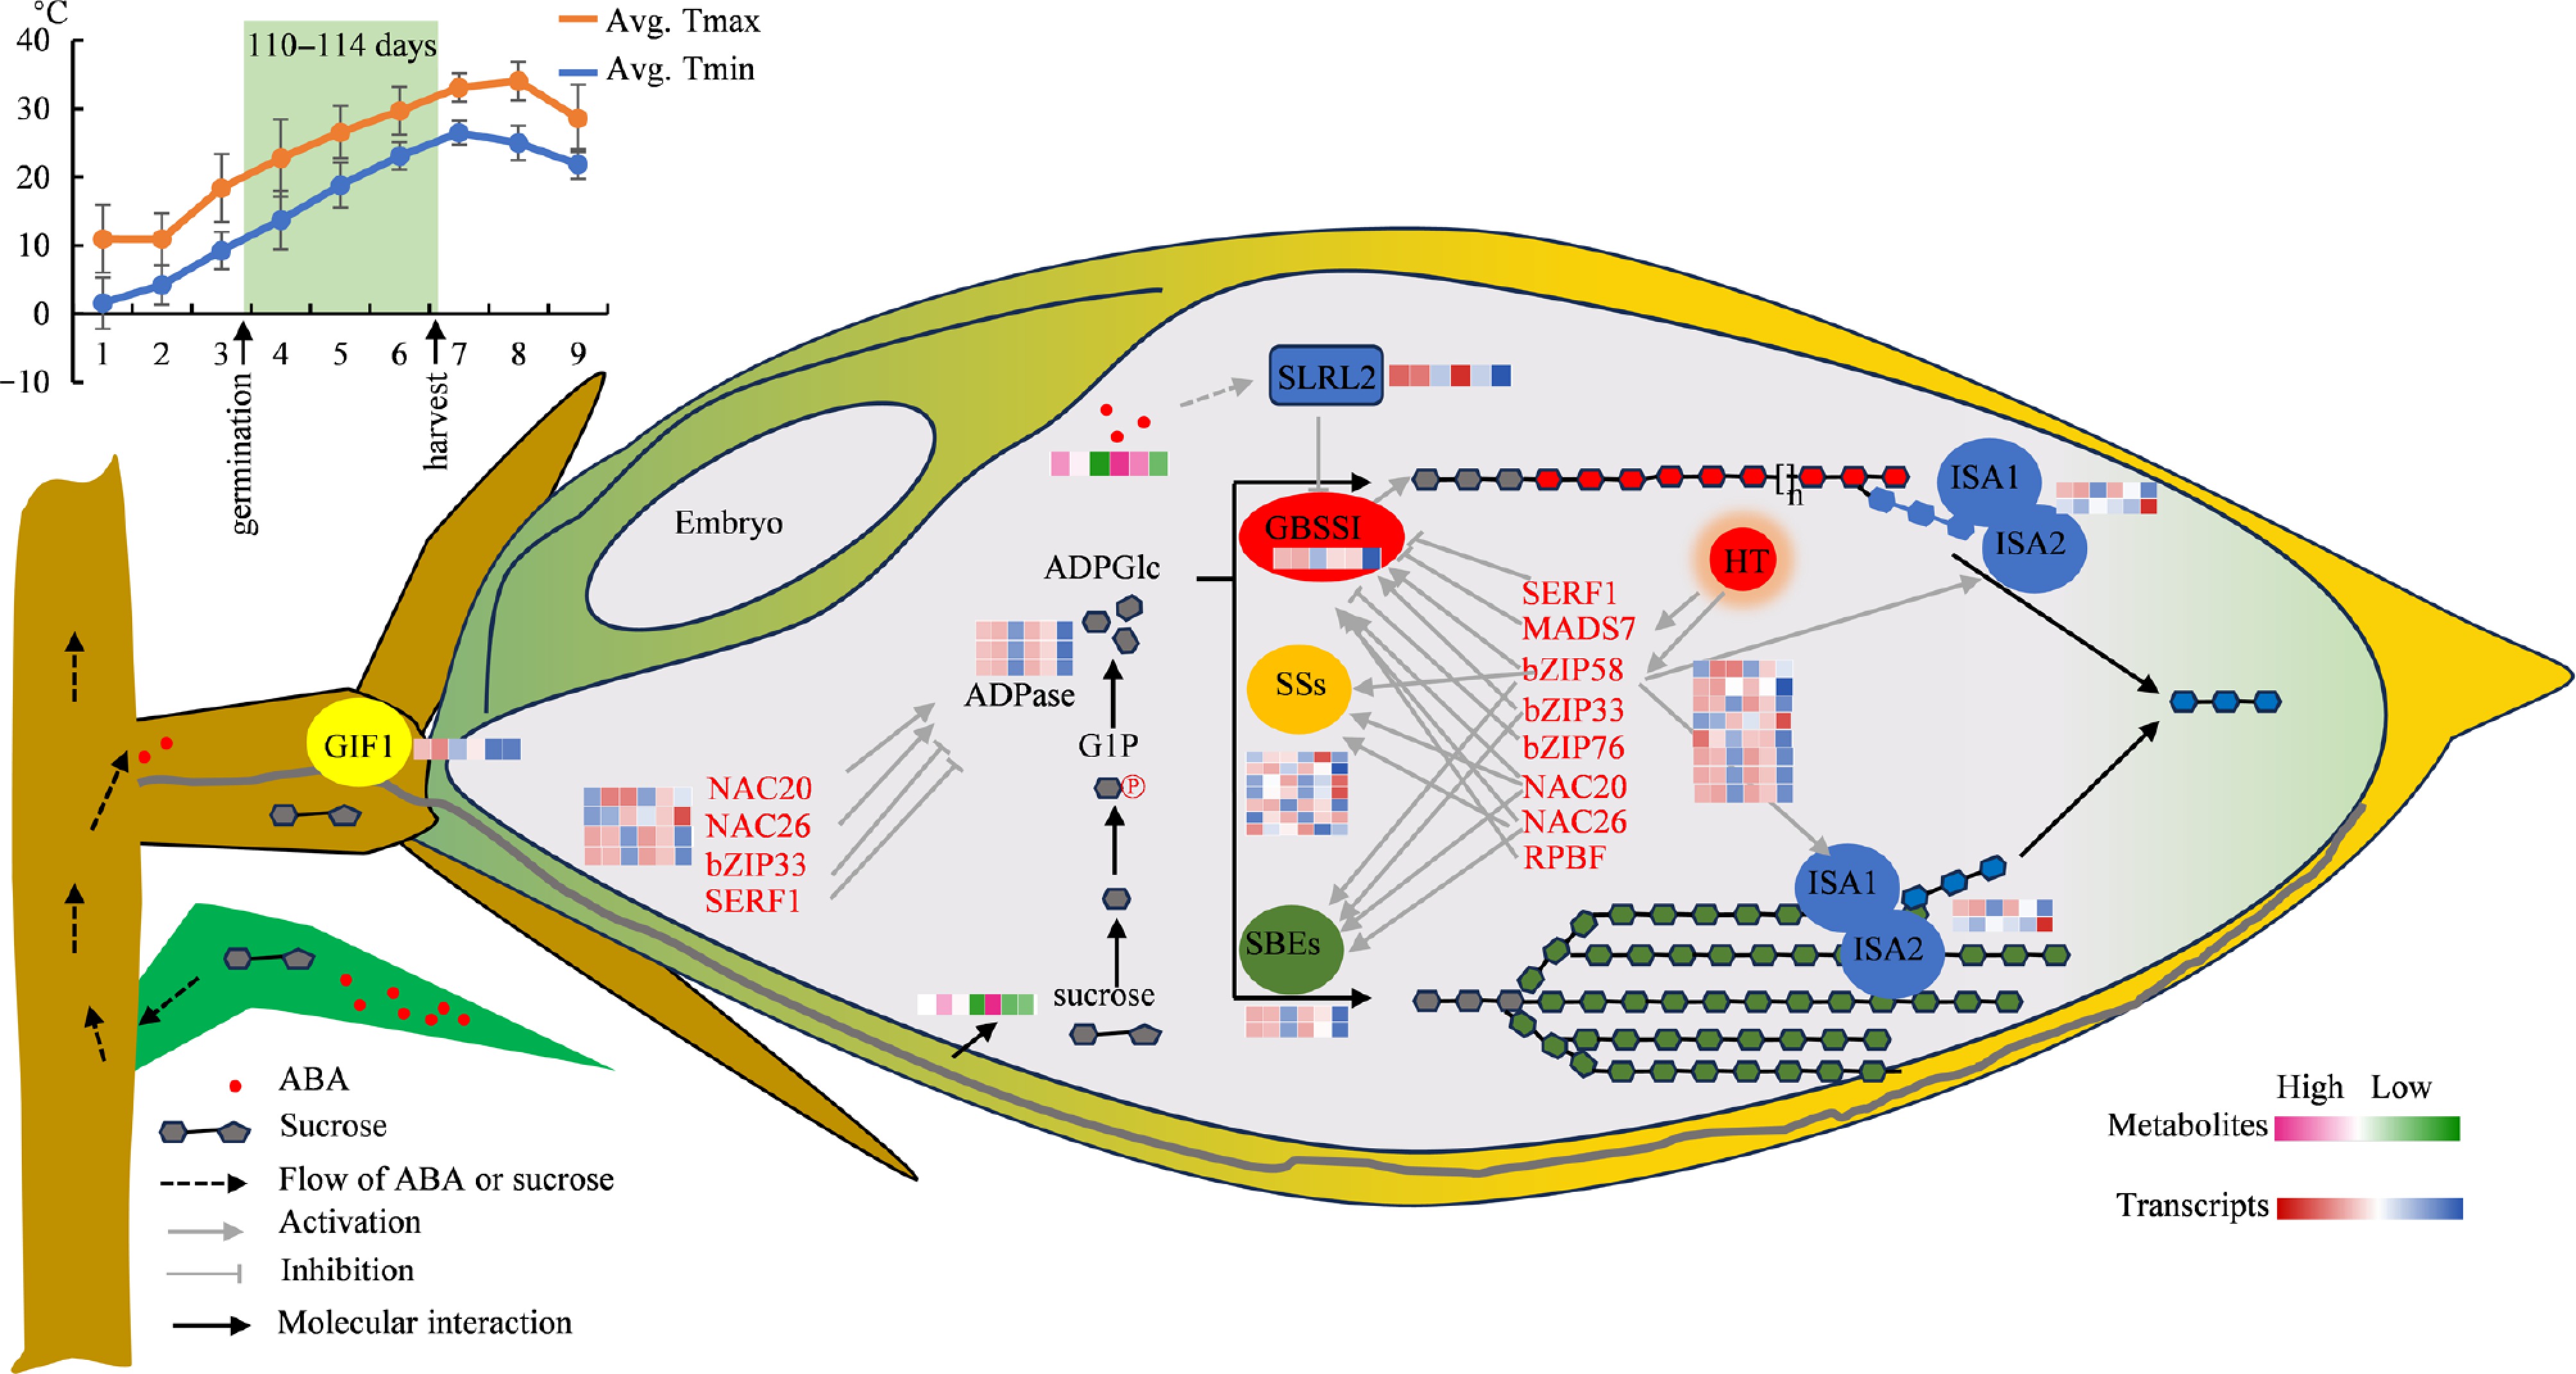
Figure 8.
An analysis diagram illustrating the principal metabolic pathways of key DEGs and DAMs involved in grain filling. LY287 starts the biosynthesis of storage compounds earlier than its male parent, which results in its superior grain quality. In spring, LY287 and its parents were germinated on Mar. 25th, and the growth cycle of rice, from germination to harvest, spans a total of 110–114 d. The line chart displays the temperatures of rice planting regions in 2023. As the rice transitions from the grain filling stage to the final harvest, the temperature steadily increases. Avg. Tmax means the average daily maximum temperature within a month, and Avg. Tmin means the average daily minimum temperature within a month. LY287 has the ability to kickstart the production of starch storage substances earlier than its male parent, which helps minimize the negative effects of high temperatures on the starch composition in seeds, leading to an enhancement in the overall quality of rice. GIF1, grain incomplete filling 1; GBSSI, granule-bound starch synthase I; SSs, soluble starch synthase; SBEs, starch branching enzyme; ISA, debranching enzyme; HT, high temperature. Six closely arranged colored square grids are used to illustrate the relative abundance of DEGs (blue, white, and red) and DAMs (green, white, and pink). From left to right, six square grids mean F7M seeds with 10, 15, 20 DAP, and LY287 seeds with 10, 15, 20 DAP, respectively.
-
Brown rice percentage
(%)Head rice percentage
(%)Grain length (mm) Grain width (mm) Length-width ratio (%) Translucency (%) Chalkiness degree (%) Amylose
(%)Gel consistency (mm) Alkali spreading value LY287 80.4 ± 1.2 65.3 ± 0.7 ** 7.3 ± 0.1 2.1 ± 0.2 3.5 ± 0.5 1 ± 0.2 1.0 ± 0.2 * 19.5 ± 1.3 * 61.0 ± 0.5 ** 5.3 ± 1.5 F7M 80.8 ± 0.8 62.8 ± 1.3 7.4 ± 0.2 2.2 ± 0.1 3.4 ± 0.7 1 ± 0.5 1.6 ± 0.5 20.3 ± 1.6 56.8 ± 0.4 5.6 ± 1.4 Brown rice percentage: Shell rice is huller-milled to produce brown rice. The brown rice percentage is calculated by the complete brown rice number to the shell rice number. Head rice percentage: Polished rice is derived from brown rice through the milling conducted by a rice mill. Head rice percentage is calculated by complete polished rice number to the brown rice number. Length-width ratio: The ratio of grain length to grain width. Translucency: The percentage of transparent or semi-transparent rice grains among all rice grains. Chalkiness degree: The projected area of the white opaque portion within the rice endosperm equates to the total projected area of the rice grains being studied. Amylose: The ratio of amylose weight to total starch weight. Gel consistency: The flow length of rice gel is observed after alkali gelatinization under specified conditions upon cooling. Alkali spreading value: The erosion degree of intact rice grains caused by an alkaline solution. Asterisk means significant differences were determined by Student's t-test (* p < 0.05, ** p < 0.01). Table 1.
Rice quality of LY287 and its male parent F7M.
Figures
(8)
Tables
(1)