-
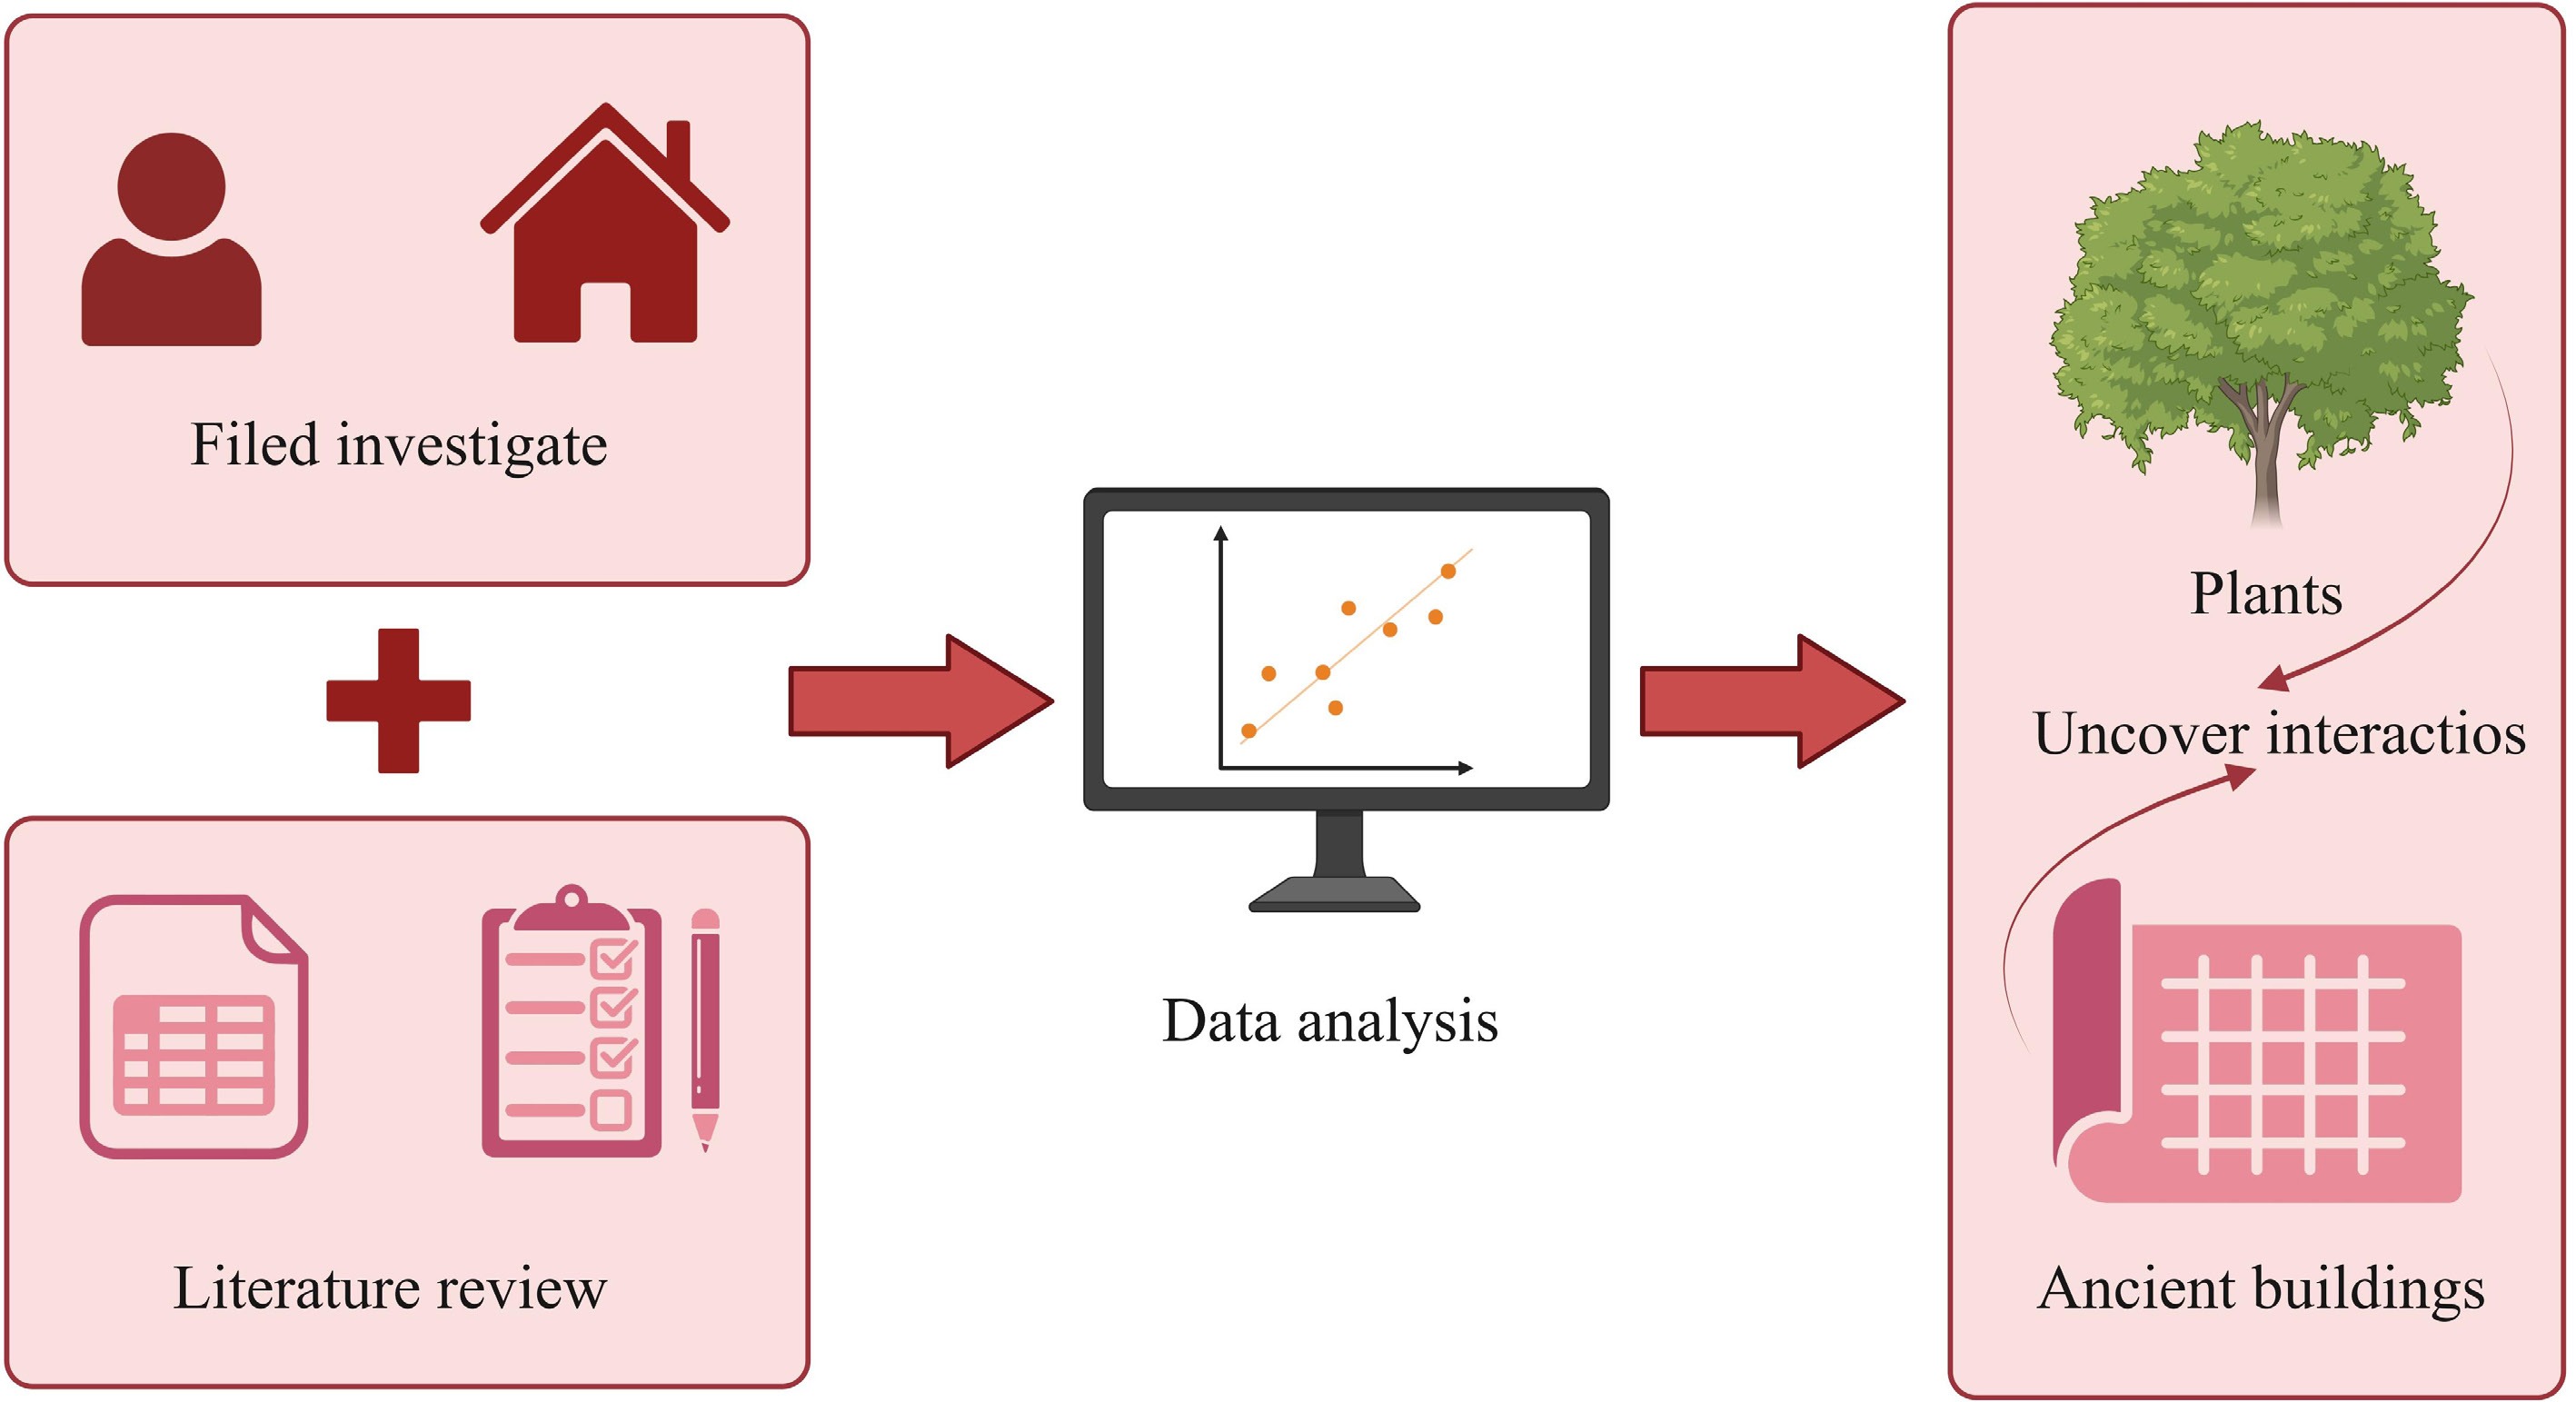
Figure 1.
Flowchart illustrating the methodological framework of this study.
-
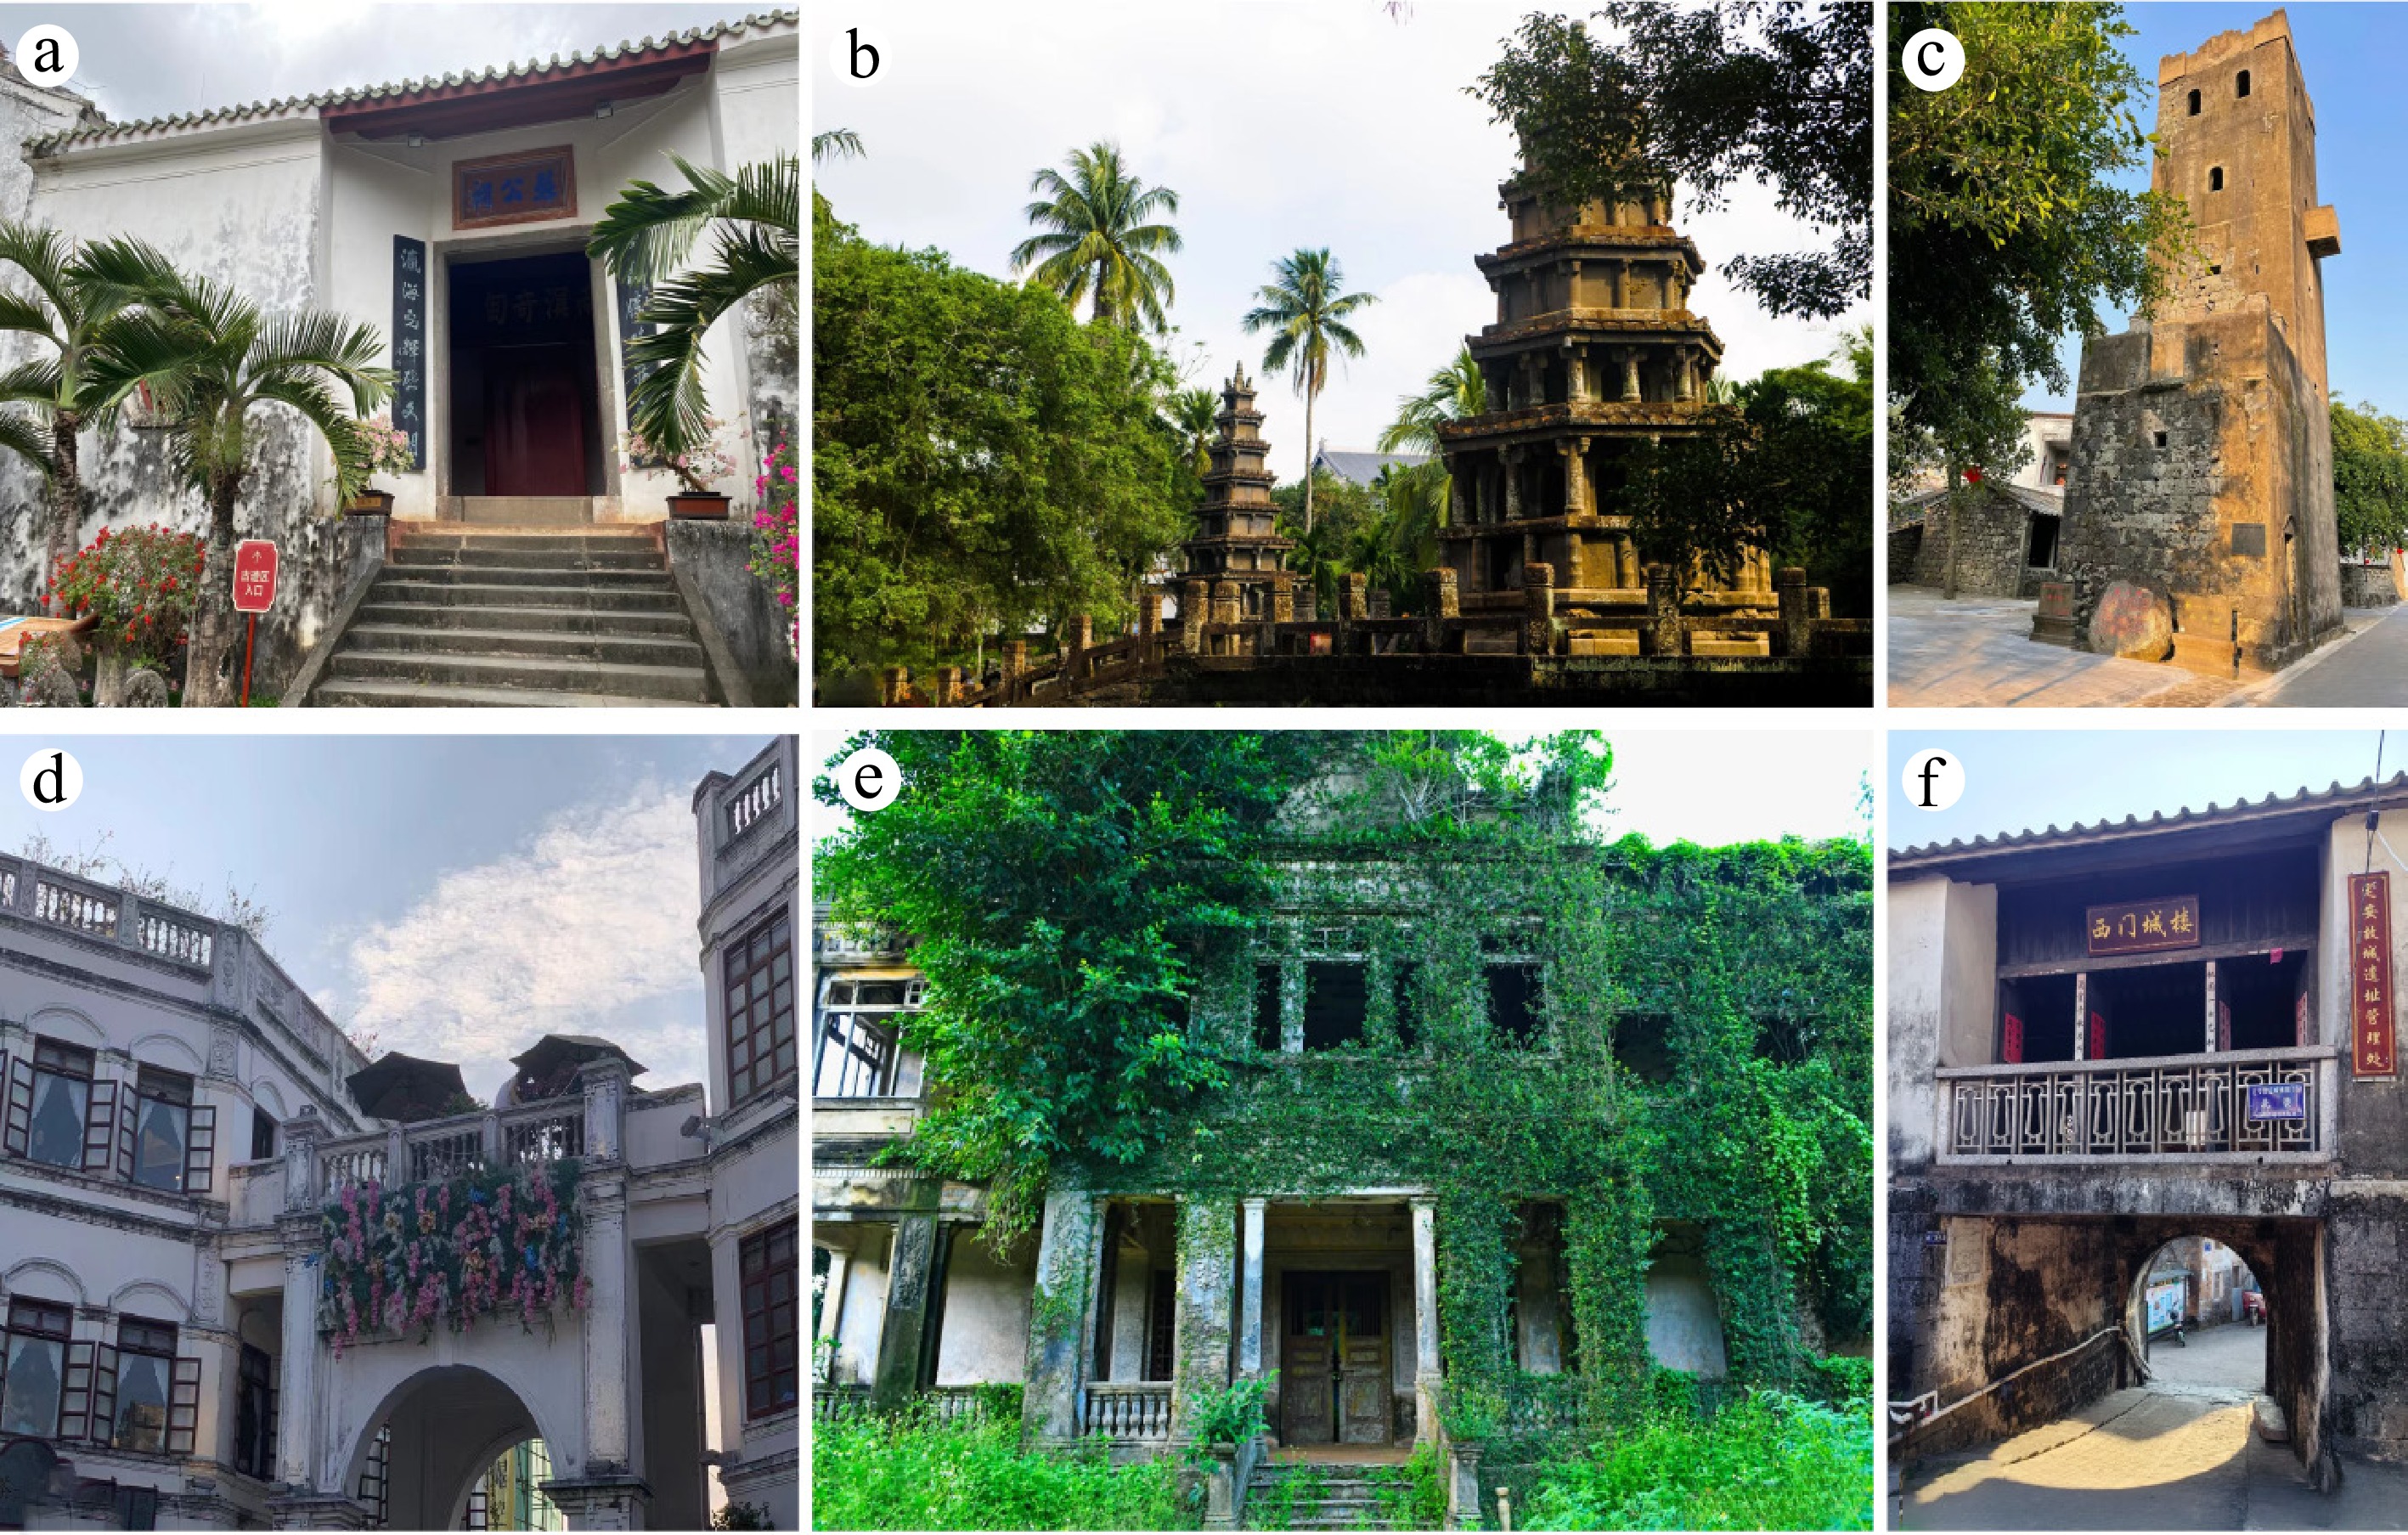
Figure 2.
Ancient masonry of different functional types in Hainan. (a) Five ancestral hall (garden building). (b) Meilang twin pagodas (religious building). (c) Fuxing building (defensive building). (d) Haikou old arcade street (house building). (e) Lin Hong Gao Wai Lou (monumental building). (f) Ding'an ancient city wall (defensive building).
-
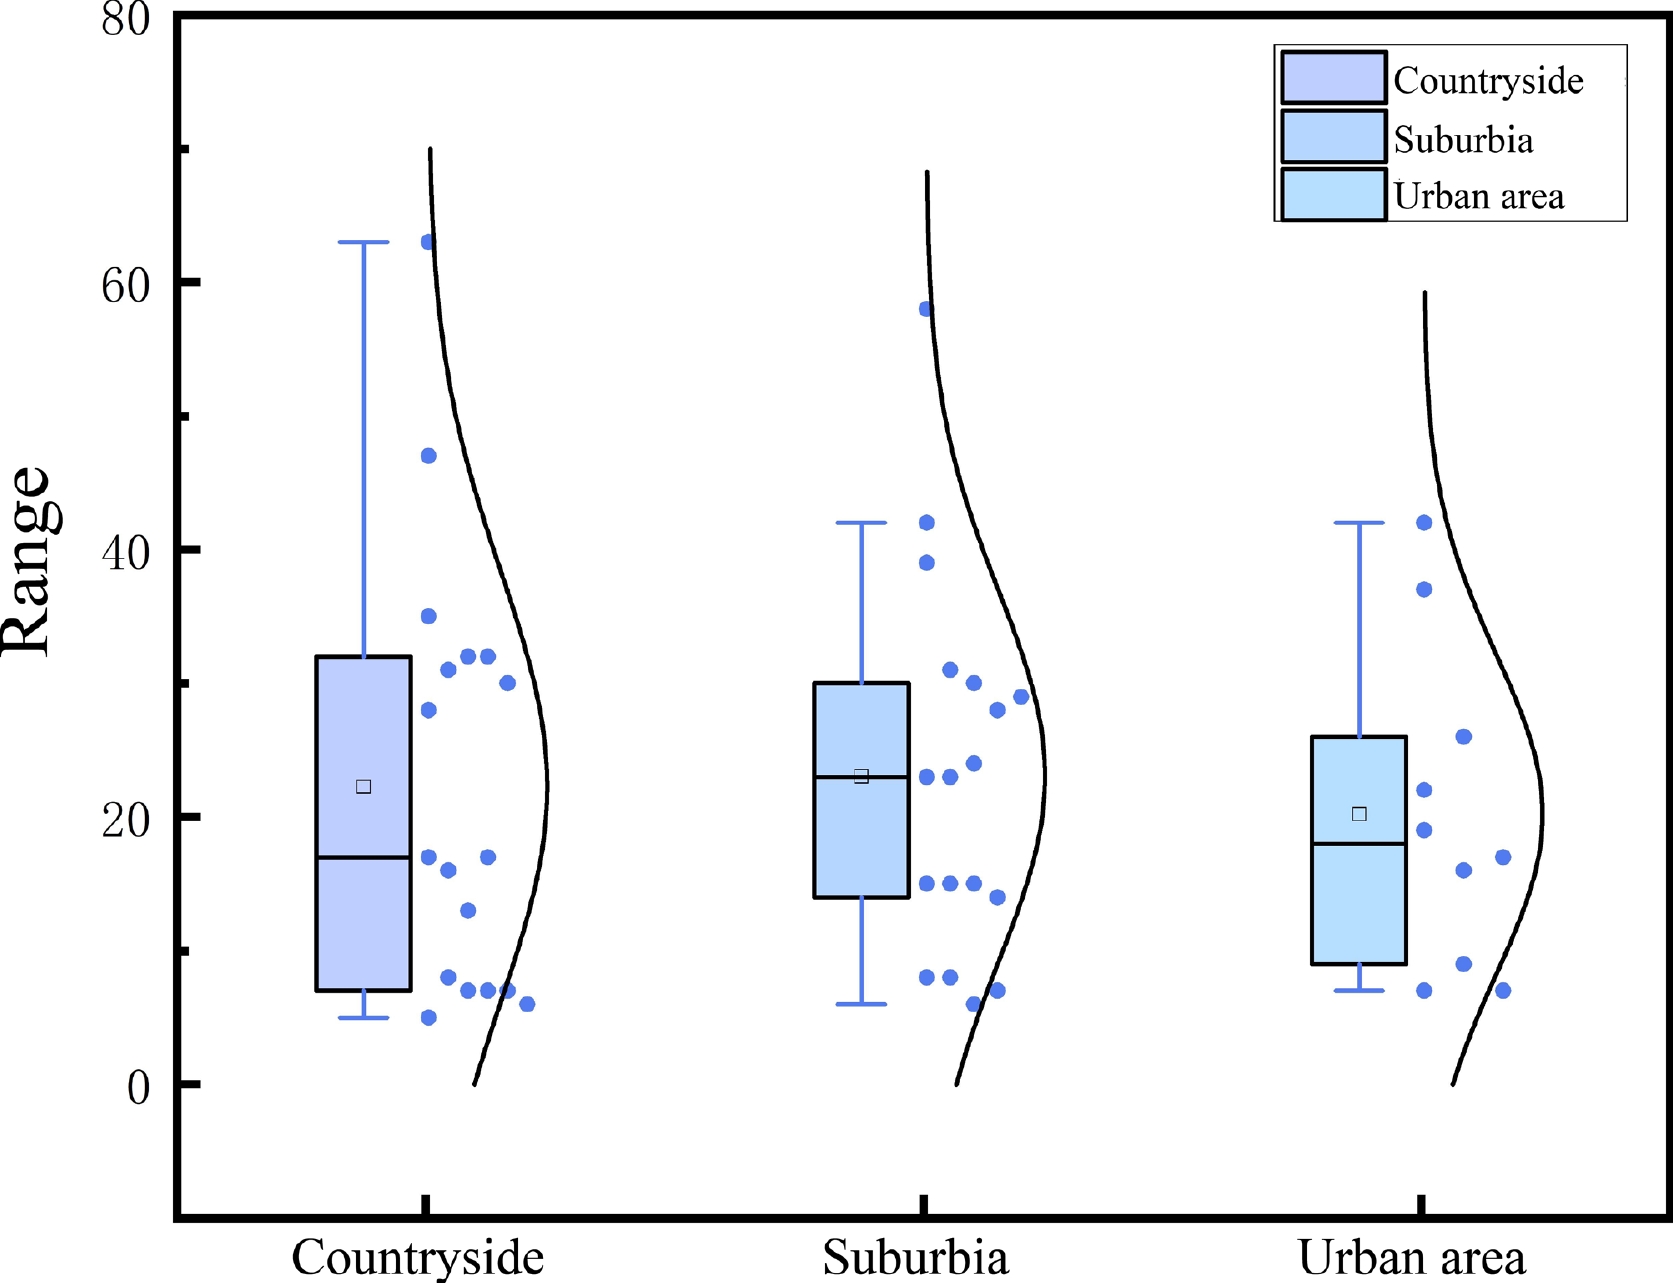
Figure 3.
Box plots of species richness of ancient masonry in different regions.
-
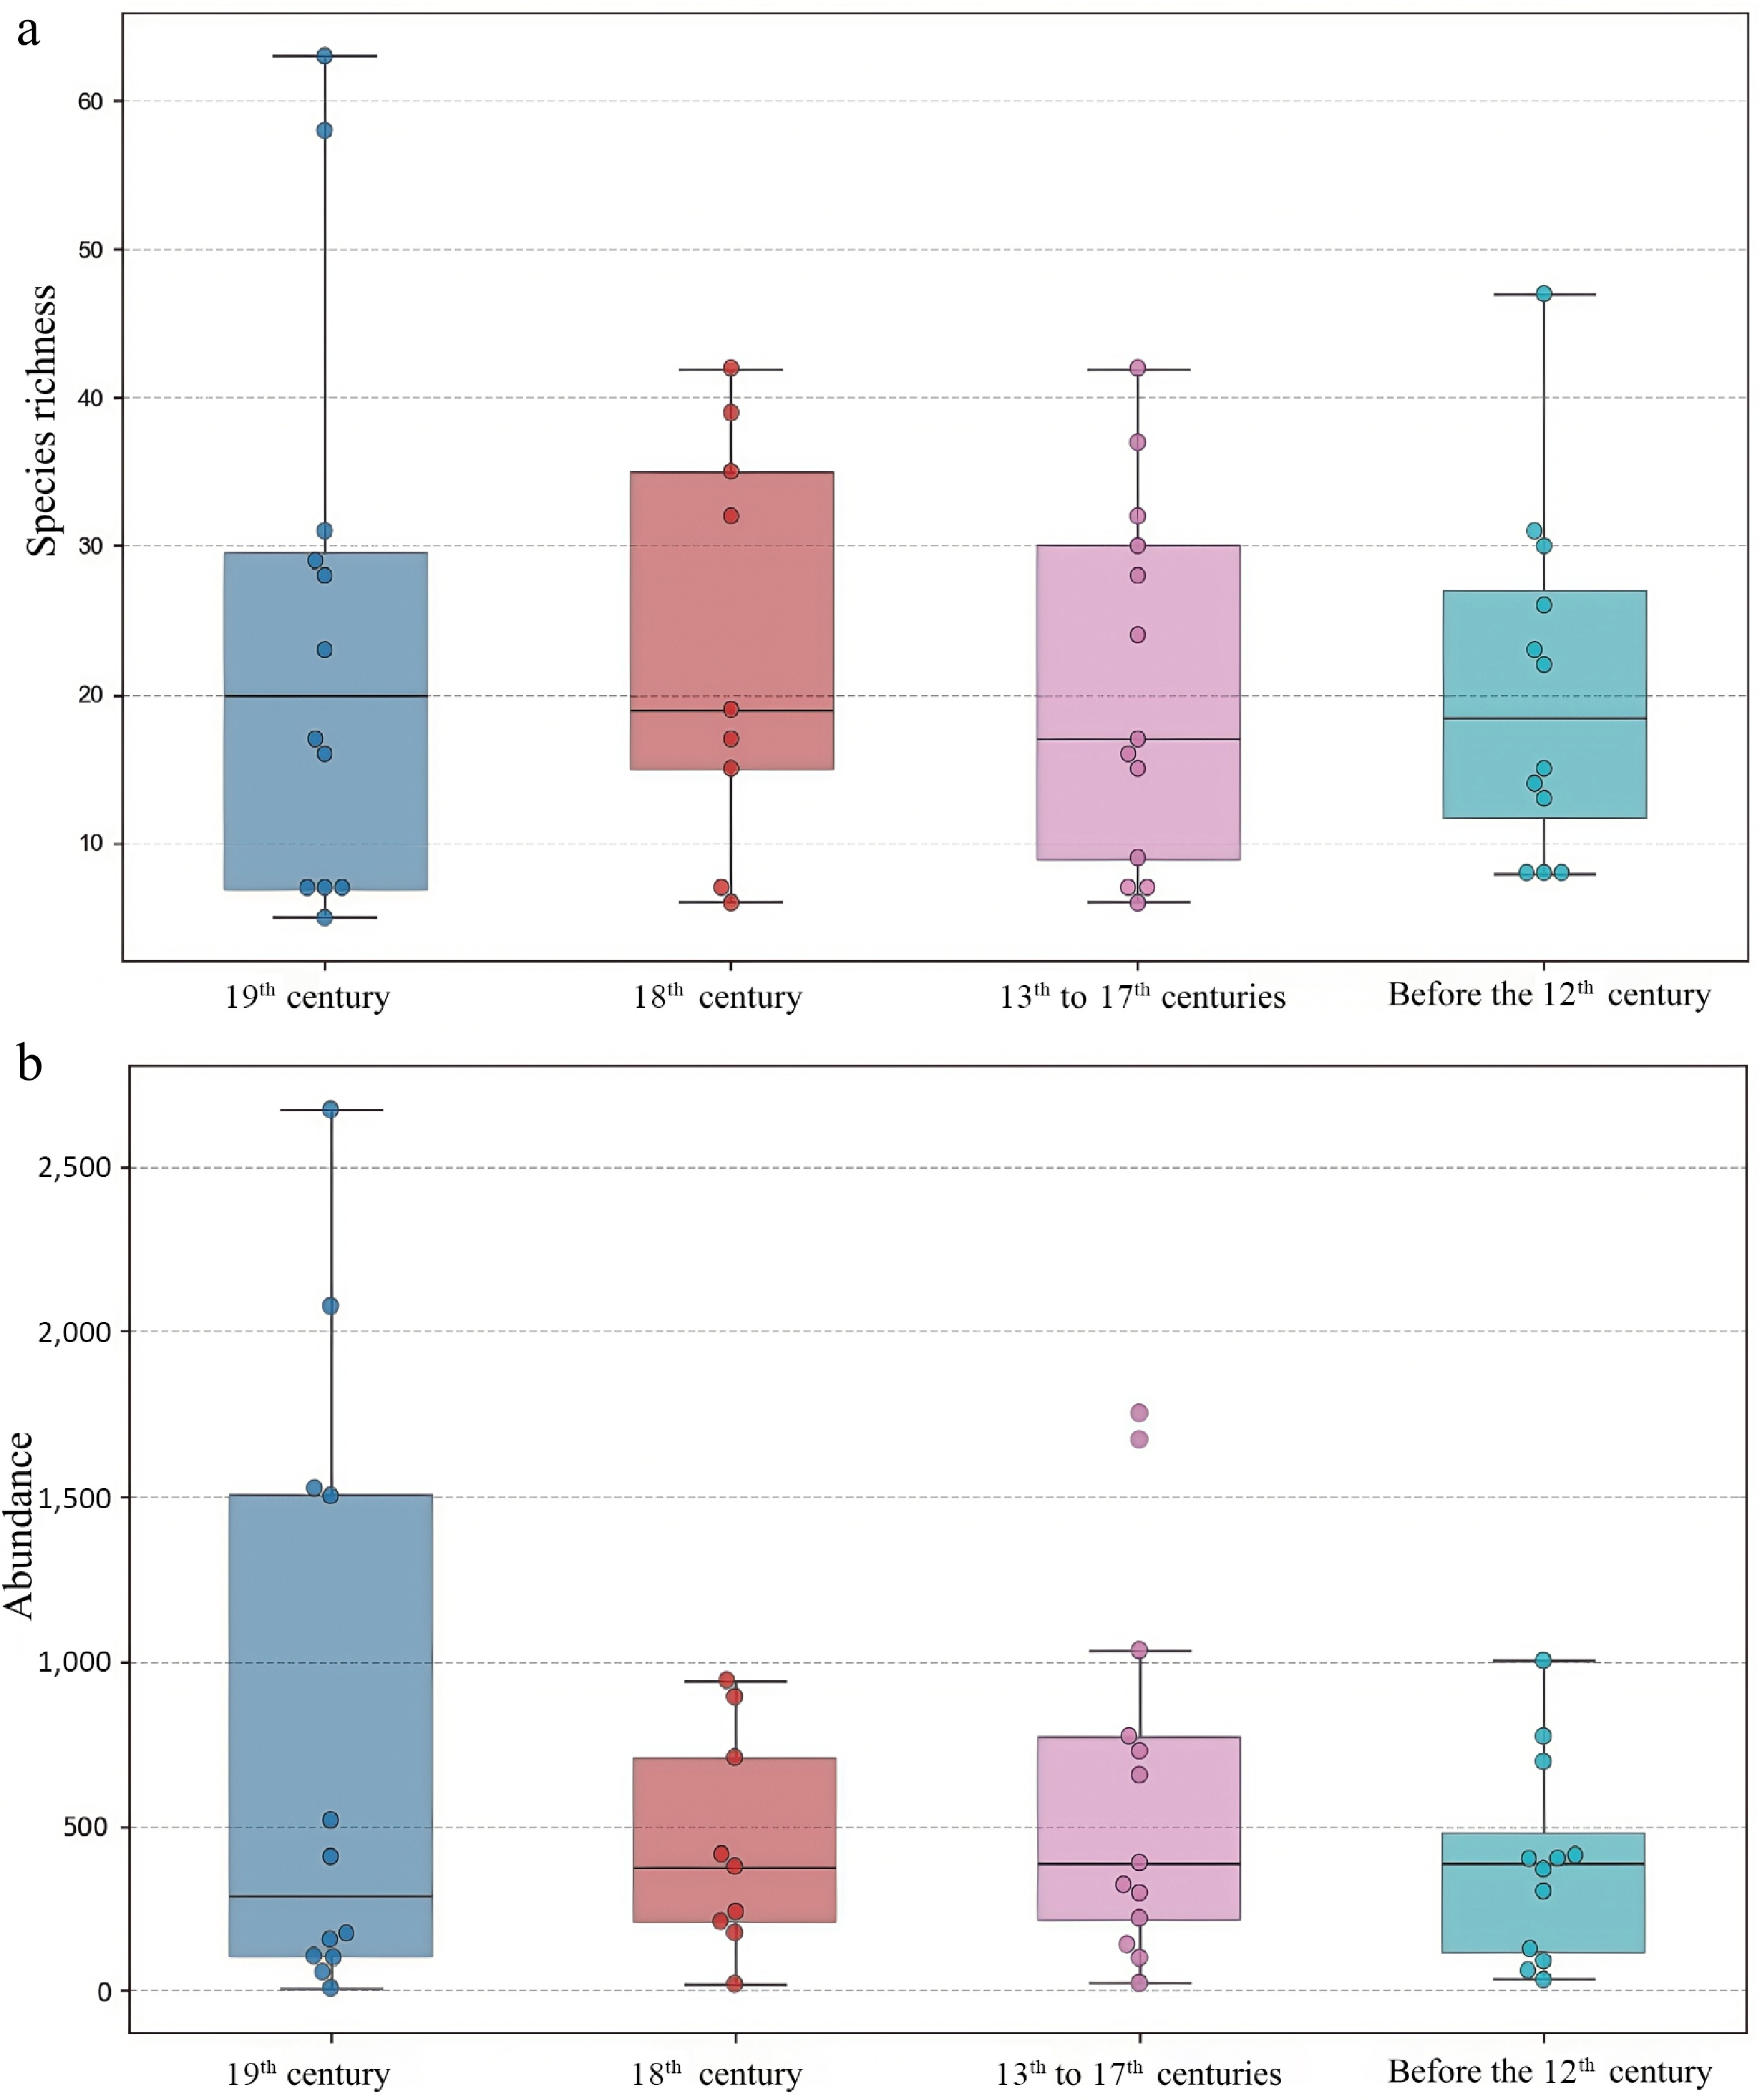
Figure 4.
Box plots of species richness of ancient masonry across different historical periods.
-
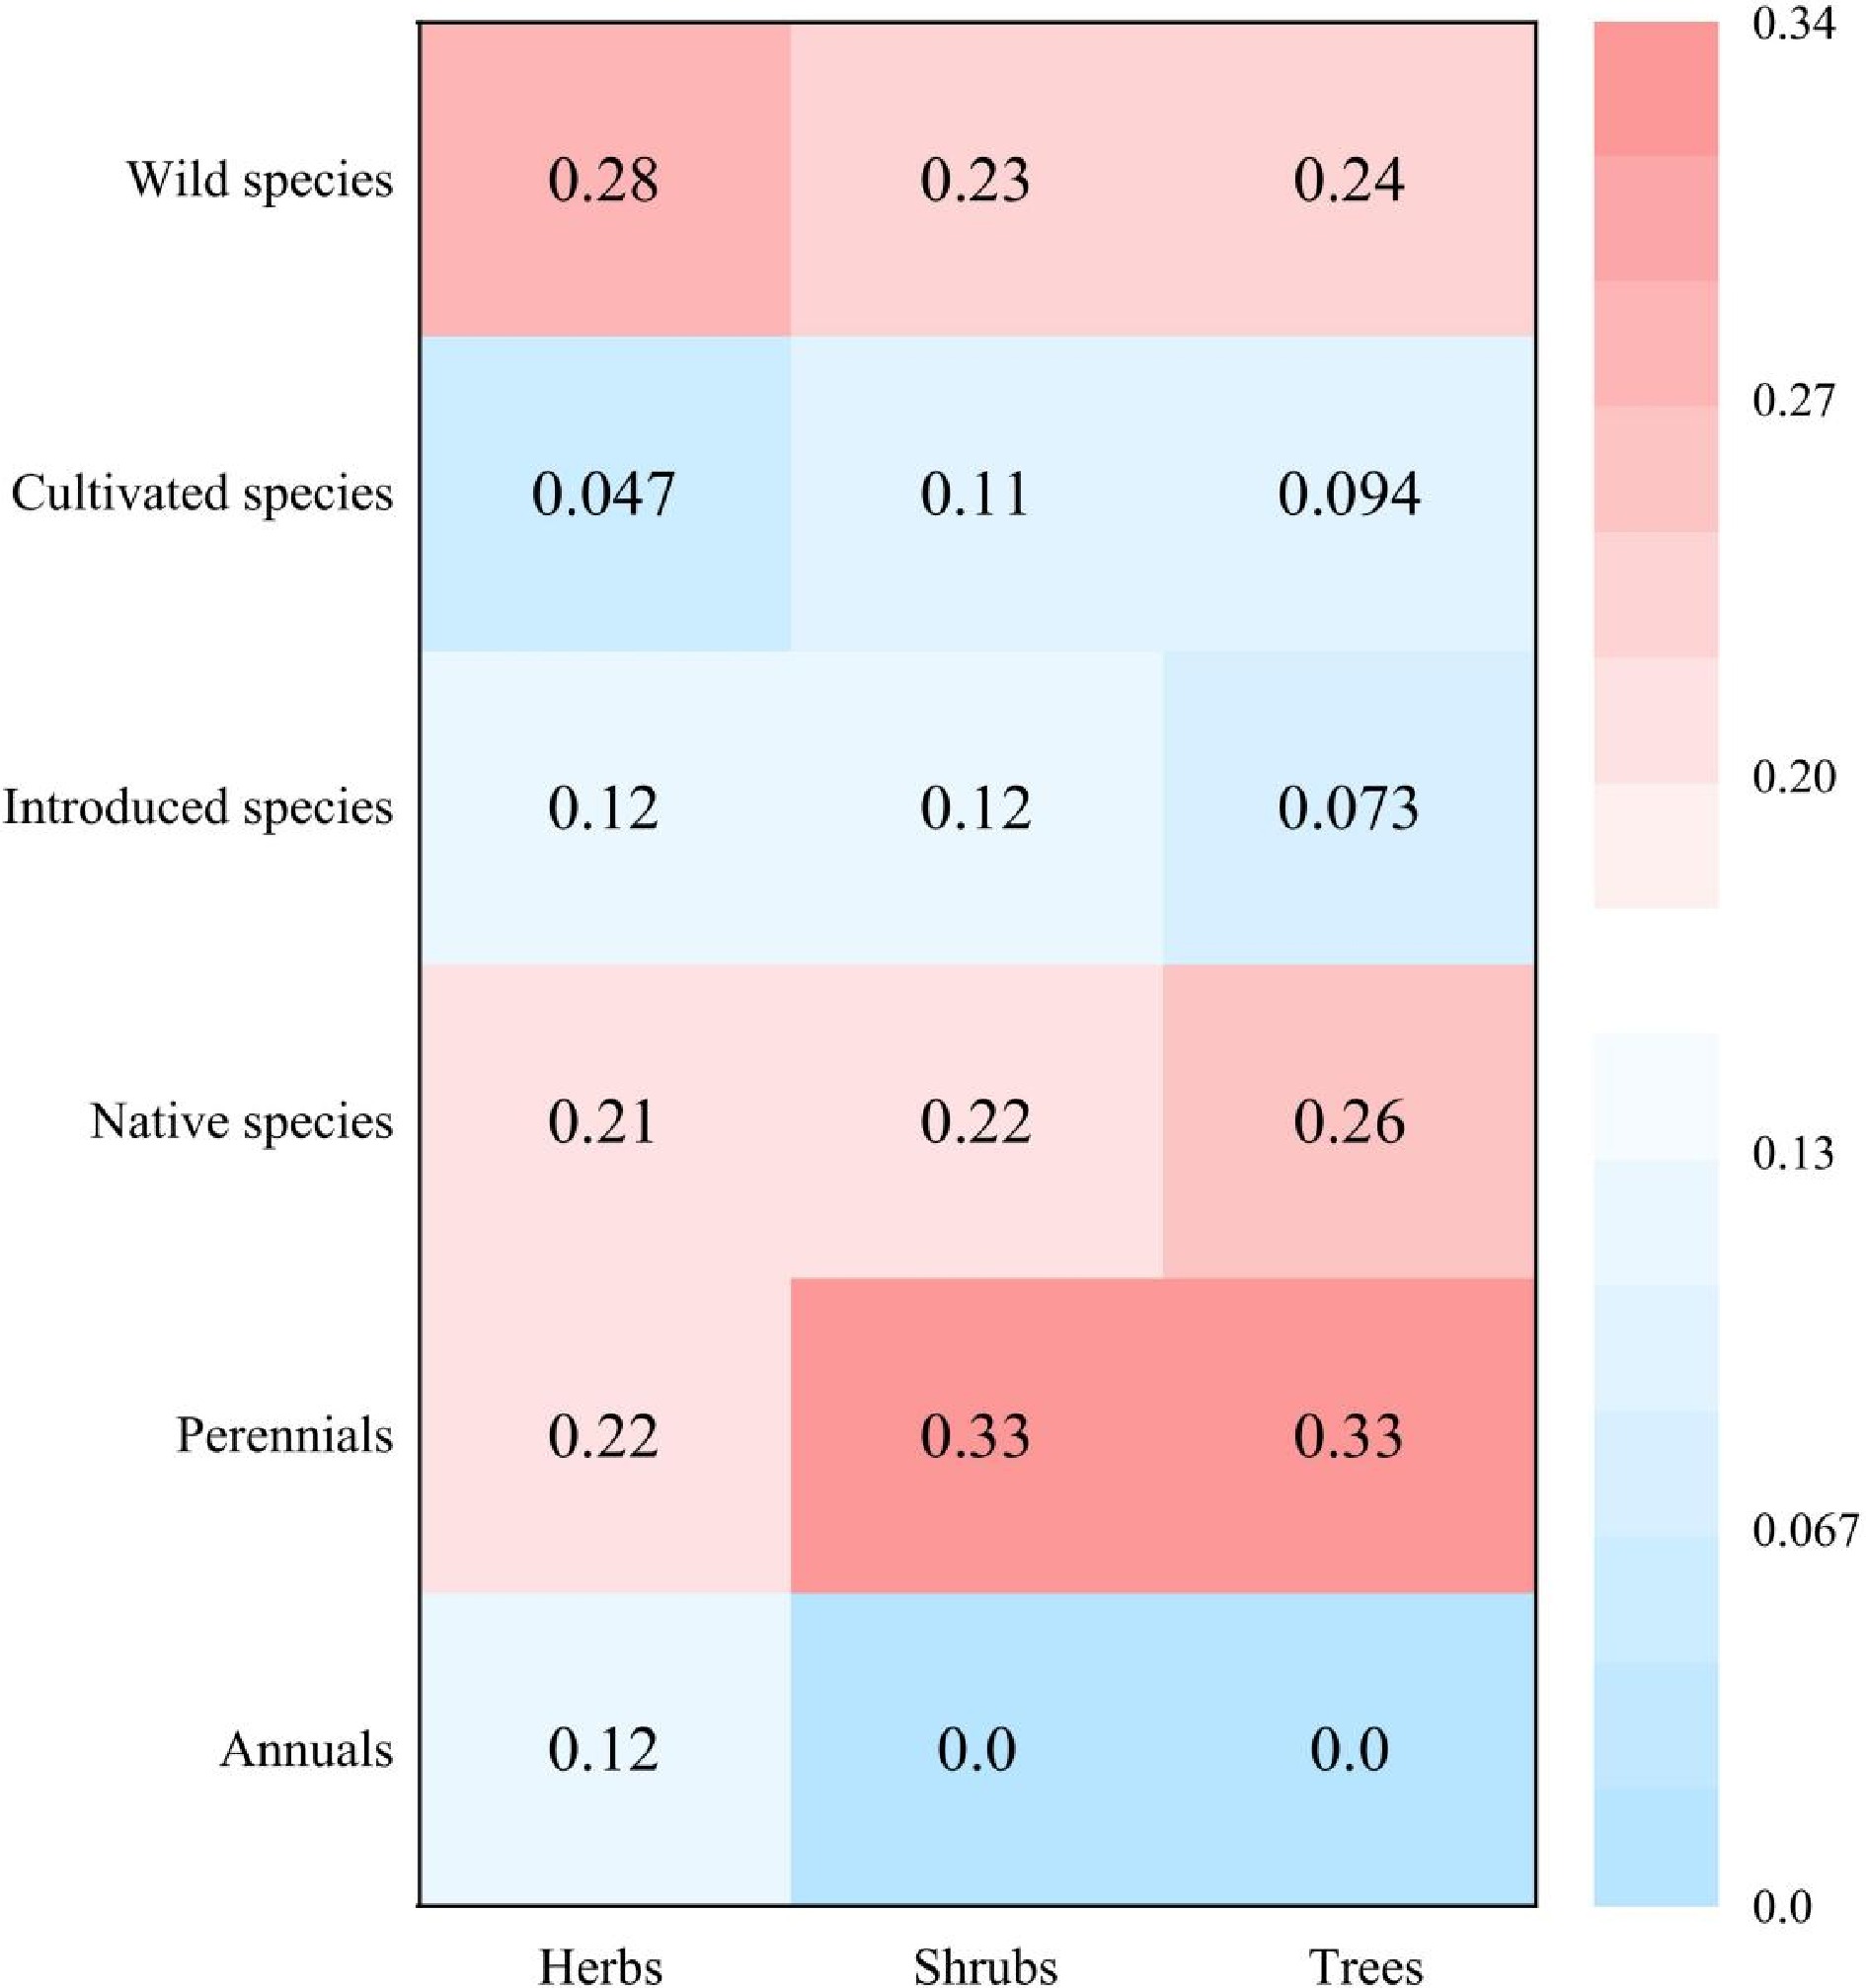
Figure 5.
Heat map of the percentage of the total species richness (considering only the mathematical totals, i.e. the sum of the species richness of each type on the y-axis) of the different species type established on the basis of herbs, shrubs, and trees.
-
Region M SD F p-value Countryside 22.280 16.157 0.126 0.882 Suburbia 23.060 13.901 Urban area 20.200 12.007 Table 1.
One-way ANOVA analysis of species richness of epiphytes in different regions.
-
Different factors Species richness Abundance Intercept Negative*** Negative*** Height of ancient building Negative** NA Longitude Positive*** Positive*** Latitude Positive*** Positive Area of ancient building Negative*** Negative*** Building age Negative*** Negative*** Surrounding population density NA Positive*** Rate of increase in the general
public revenue budget of the governmentPositive*** Positive*** Number of commercial outlets Positive*** Positive*** Number of tourists per day Positive** Negative*** Annual passenger traffic Negative*** Negative*** Number of repairs per year NA NA Green coverage of surrounding areas Positive** NA Adjusted R2 0.4429 0.5916 Akaike information criterion (AIC) −506.31 −710.11 p-value *** *** Significance codes: 0, ***; 0.001, **; 0.01, *; 0.05, .; 0.1, 1. NA represents that the variable was not added to the model. Sample size N = 44. Values are standardized coefficients (β) and their significance. Table 2.
Regression model results for epiphytes of ancient masonry.
-
Family Percentage
(no. of plants)Species Percentage
(no. of plants)Moraceae 22.84% (5,849) Ficus pumila 19.05% (4,879) Urticaceae 15.44% (3,955) Pilea microphylla 14.82% (3,795) Polypodiaceae 11.21% (2,872) Phymatosorus scolopendria 8.79% (2,252) Nephrolepis 7.44% (1,905) Nephrolepis auriculata 7.44% (1,905) Adiantaceae 5.68% (1,455) Adiantum caudatum 5.68% (1,455) Compositae 5.62% (1,439) Eremochloa ciliaris 2.99% (767) Pteridaceae 4.37% (1,120) Pyrrosia adnascens 2.39% (612) Rubiaceae 3.76% (963) Paederia scandens 2.33% (597) Vitaceae 2.97% (762) Eupatorium odoratum 1.81% (463) Gramineae 2.83% (725) Ficus tinctoria 1.73% (444) Euphorbiaceae 1.74% (446) Basella alba 1.53% (393) Portulacaceae 1.63% (417) Boerhavia diffusa 1.37% (350) Basellaceae 1.53% (393) Pteris ensiformis 1.36% (348) Nyctaginaceae 1.38% (353) Digitaria ciliaris 1.13% (290) Solanaceae 1.29% (330) Bidens pilosa 1.06% (272) Crassulaceae 1.10% (281) Solanum procumbens 1.02% (262) Thelypteridaceae 0.91% (232) Phyllanthus urinaria 0.94% (242) Sinopteridaceae 0.88% (225) Cayratia japonica 0.91% (232) Cyperaceae 0.56% (144) Cyclosorus parasiticus 0.89% (228) Araceae 0.55% (140) Cissus repens 0.88% (225) Oxalidaceae 0.55% (140) Total 94.27% (24,146) 78.13% (20,011) Table 3.
Statistics of dominant families and species of epiphyte in Hainan Province.
-
Different factors Herbs Shrubs Trees Annual Perennial Native species Introduced species Cultivated species Wild species ornamental value Edible value Intercept Negative*** Negative*** Negative*** Negative*** Negative*** Negative*** Negative*** Negative*** Negative*** Negative*** Negative*** Height of ancient building Negative. NA NA NA Negative** Negative*** NA NA Negative** Negative** Negative** Longitude Positive*** Positive** Positive*** Positive*** Positive*** Positive*** Positive** Positive* Positive*** Positive*** Positive*** Latitude Positive*** Positive*** Positive Positive. Positive*** Positive*** Positive*** Positive*** Positive*** Positive*** Positive. Area of ancient building Positive*** Positive. NA Negative*** Positive Negative*** NA NA Negative*** Negative* Negative** Building age Positive*** NA Negative*** Negative*** Negative** Negative*** NA NA Negative*** Negative*** Negative** Rate of increase in the general public revenue budget of the Government Positive*** Positive*** Positive*** Positive*** Positive*** Positive*** Positive*** Positive*** Positive*** Positive*** Positive*** Number of commercial outlets Positive*** Positive*** Positive*** NA Positive*** Positive*** Positive* Positive* Positive*** Positive*** Positive*** Number of tourists per day Positive** NA NA Positive* Positive* Positive** Positive* Positive Positive** Positive** Positive* Annual passenger traffic Positive*** Negative*** Negative*** Negative*** Negative*** Negative*** Negative*** Negative*** Negative*** Negative*** Negative*** Green coverage of surrounding areas Positive** NA NA Positive** Positive Positive** NA NA Positive* Positive* Positive* Adjusted R2 0.4521 0.4173 0.5355 0.4389 0.4548 0.5268 0.3436 0.3657 0.476 0.4394 0.4901 Akaike information criterion(AIC) −330.79 −71.68 −103.33 −115.8 −394.17 −433.93 −104.67 −53.67 −457.71 −331.77 −166.87 p−value *** *** *** *** *** *** *** *** *** *** *** Significance codes: 0, ***; 0.001, **; 0.01, *; 0.05, .; 0.1, 1. NA represents that the variable was not added to the model. Sample size N = 44. Values are standardized coefficients (β) and their significance. Table 4.
Regression model results for Epiphytes species richness of ancient masonry by category.
-
ifferent factors Herbs Shrubs Trees Annual Perennial Native species Introduced species Cultivated species Wild species ornamental value Edible value Intercept Negative*** Positive Negative*** Negative*** Negative*** Negative*** Negative*** Negative*** Negative*** Negative*** Negative*** Longitude Positive*** NA Positive*** Positive*** Positive*** Positive*** Positive*** Positive*** Positive*** Positive*** Positive*** Area of ancient building Negative*** NA NA Negative*** Negative** Negative*** Negative*** Negative* Negative*** Negative** NA Building age Negative* Positive** Positive. NA Negative* Negative** Negative* Negative Negative** Negative* Negative*** Surrounding population density Positive*** Positive. Positive* Positive*** Positive*** Positive*** Positive** Positive* Positive*** Positive*** Positive*** Rate of increase in the general public revenue budget of the Government Positive*** NA Positive* Positive*** Positive*** Positive*** Positive*** Positive*** Positive*** Positive*** Positive*** Number of commercial outlets Positive*** Positive*** Positive*** Positive*** Positive*** Positive*** Positive*** Positive*** Positive*** Positive*** Positive*** Number of tourists per day Negative* NA Negative** NA Negative*** Negative** NA NA Negative*** Negative** NA Annual passenger traffic Negative*** NA Negative. Negative*** Negative*** Negative*** Negative*** Negative*** Negative*** Negative*** Negative*** Adjusted R2 0.5766 0.3467 0.6212 0.5493 0.5622 0.6392 0.4343 0.4236 0.5998 0.5660 0.6198 Akaike information criterion(AIC) −504.79 −54.15 −124.43 −177.79 −517.11 −576.16 −136.83 −59.38 −633.66 −458.5 −226.94 p−value *** *** *** *** *** *** *** *** *** *** *** Significance codes: 0, ***; 0.001, **; 0.01, *; 0.05, .; 0.1, 1. NA represents that the variable was not added to the model. Sample size N = 44. Values are standardized coefficients (β) and their significance. Table 5.
Regression model results for Epiphytes abundance of ancient masonry by category.
Figures
(5)
Tables
(5)