-
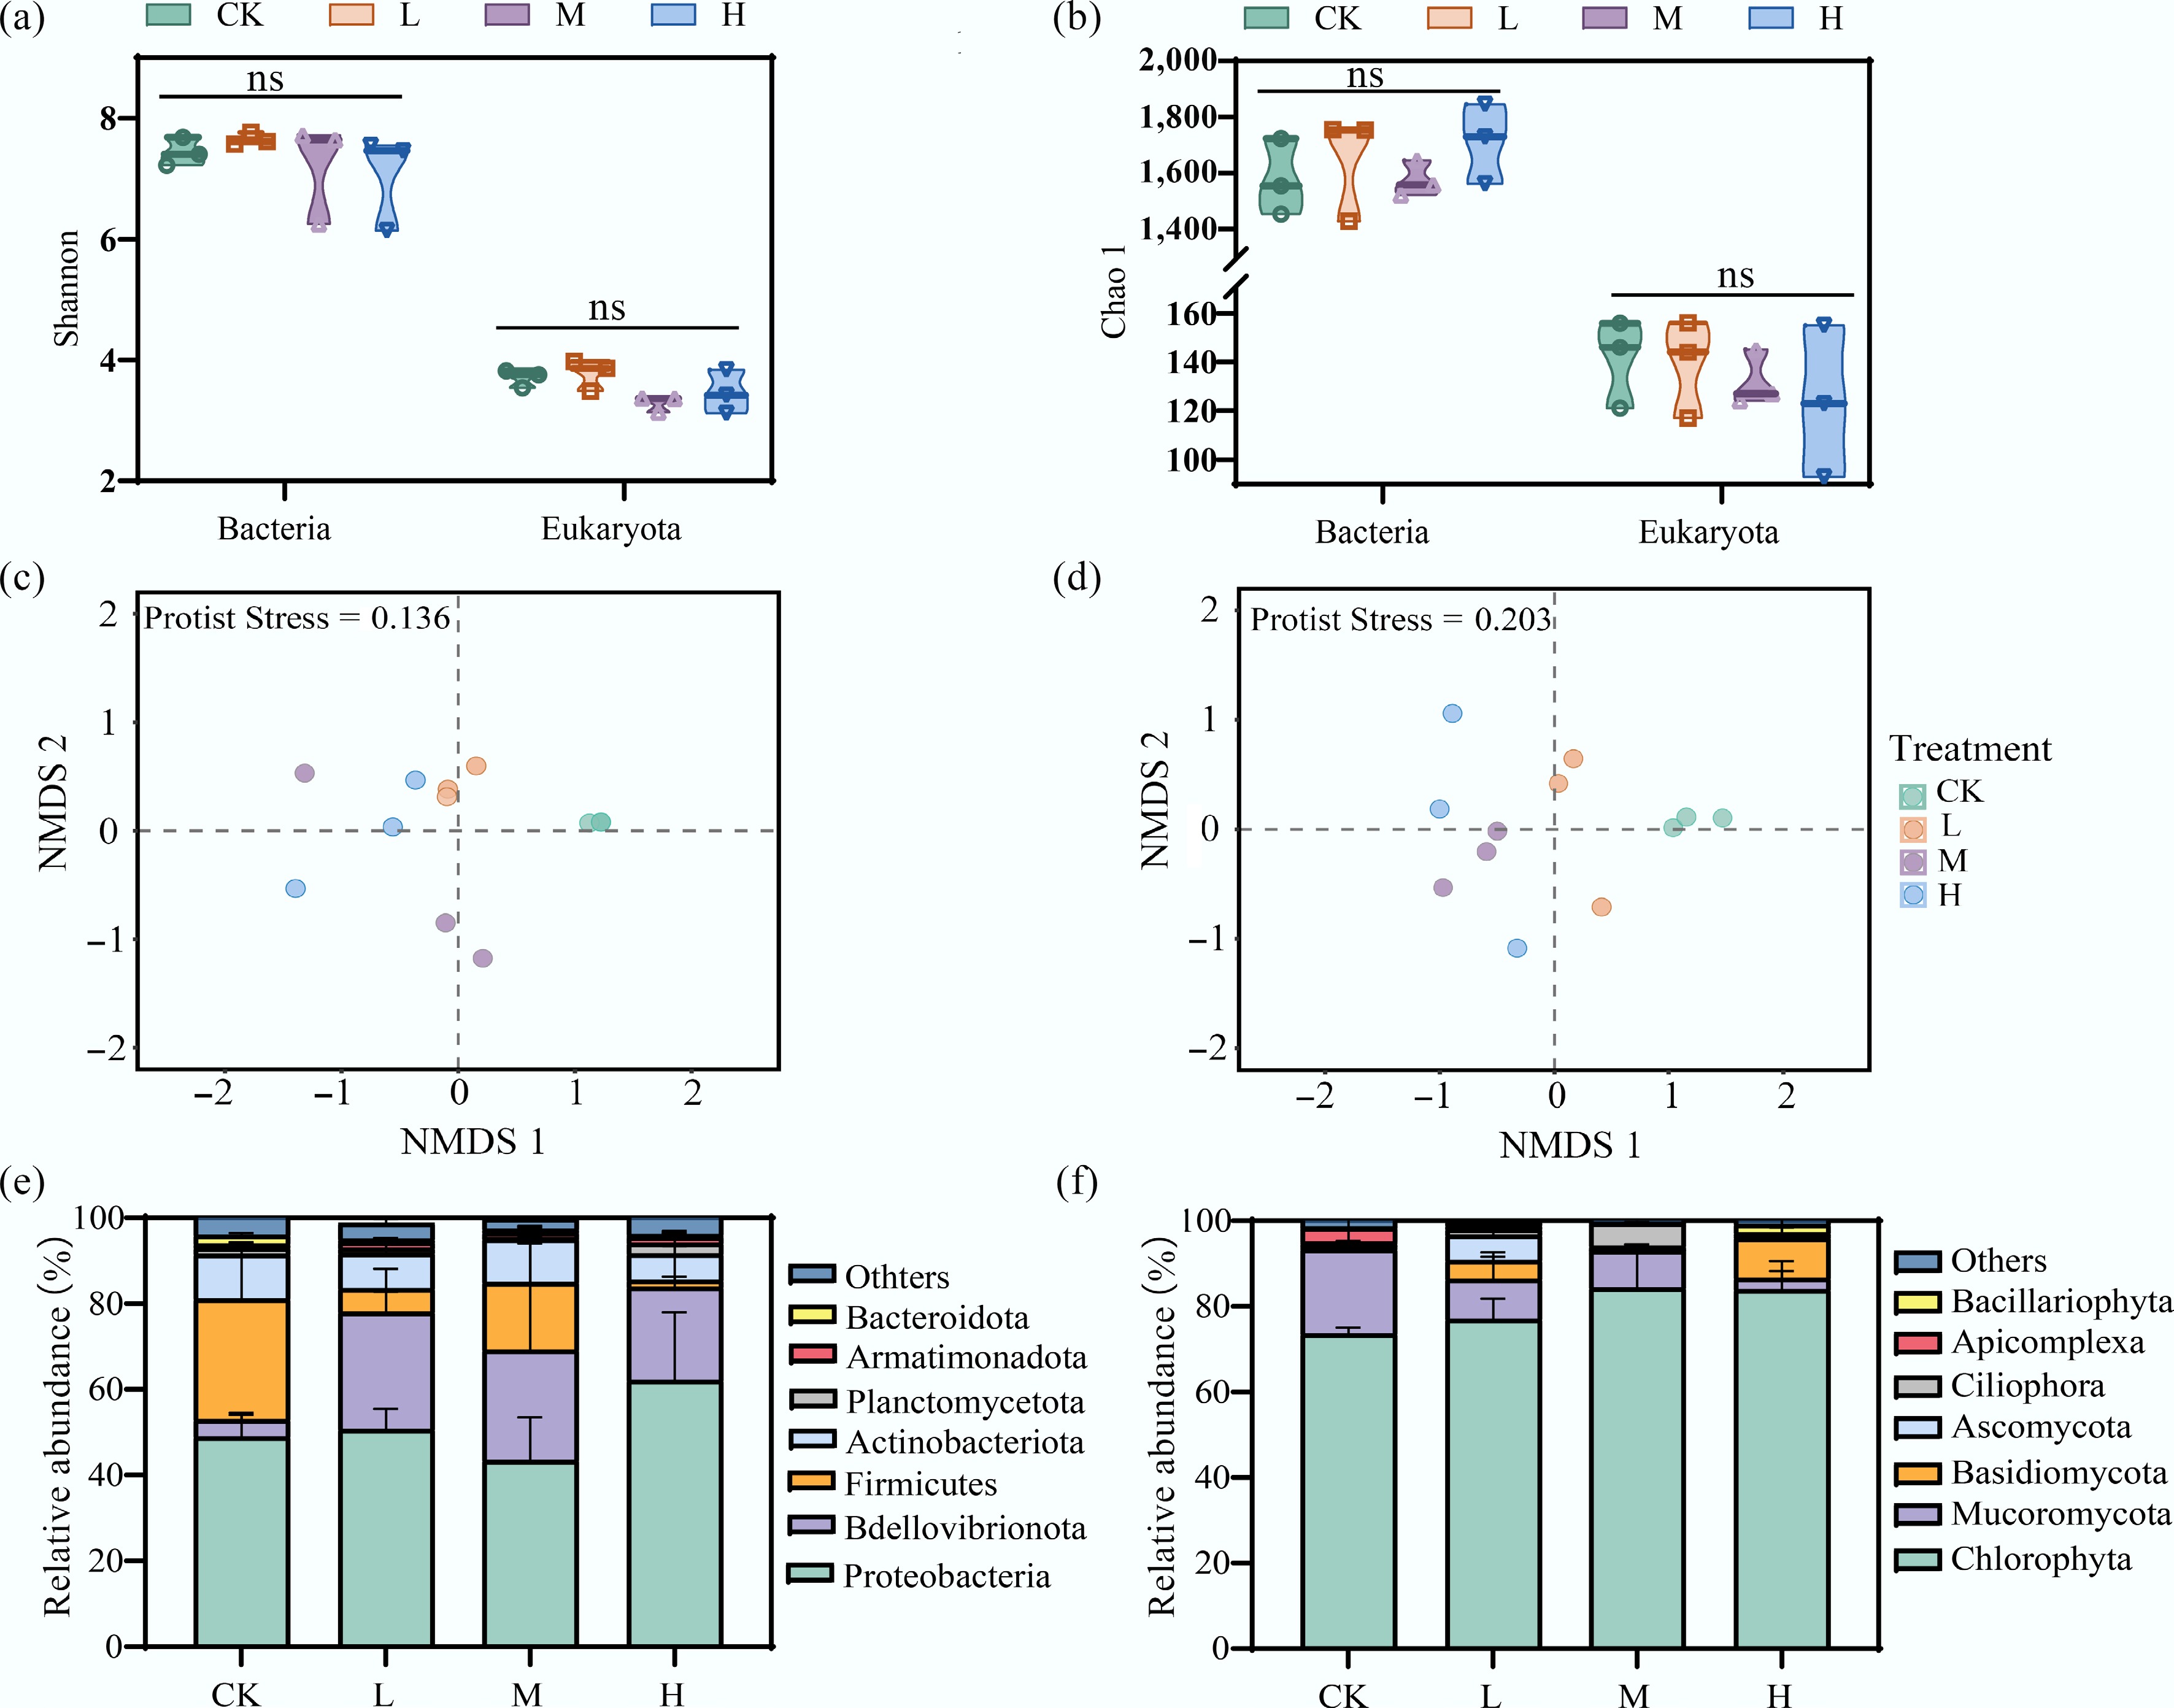
Figure 1.
HAP alters the community structure but not the alpha diversity of periphyton. (a), (b) Alpha diversity indices (Shannon and Chao1) of bacterial and eukaryotic communities across treatments. 'ns' indicates no significant difference. Non-metric multidimensional scaling (NMDS) ordination showing changes in the (c) overall bacterial, and (d) eukaryotic community structure. Relative abundance of dominant (e) bacterial, and (f) eukaryotic phyla.
-
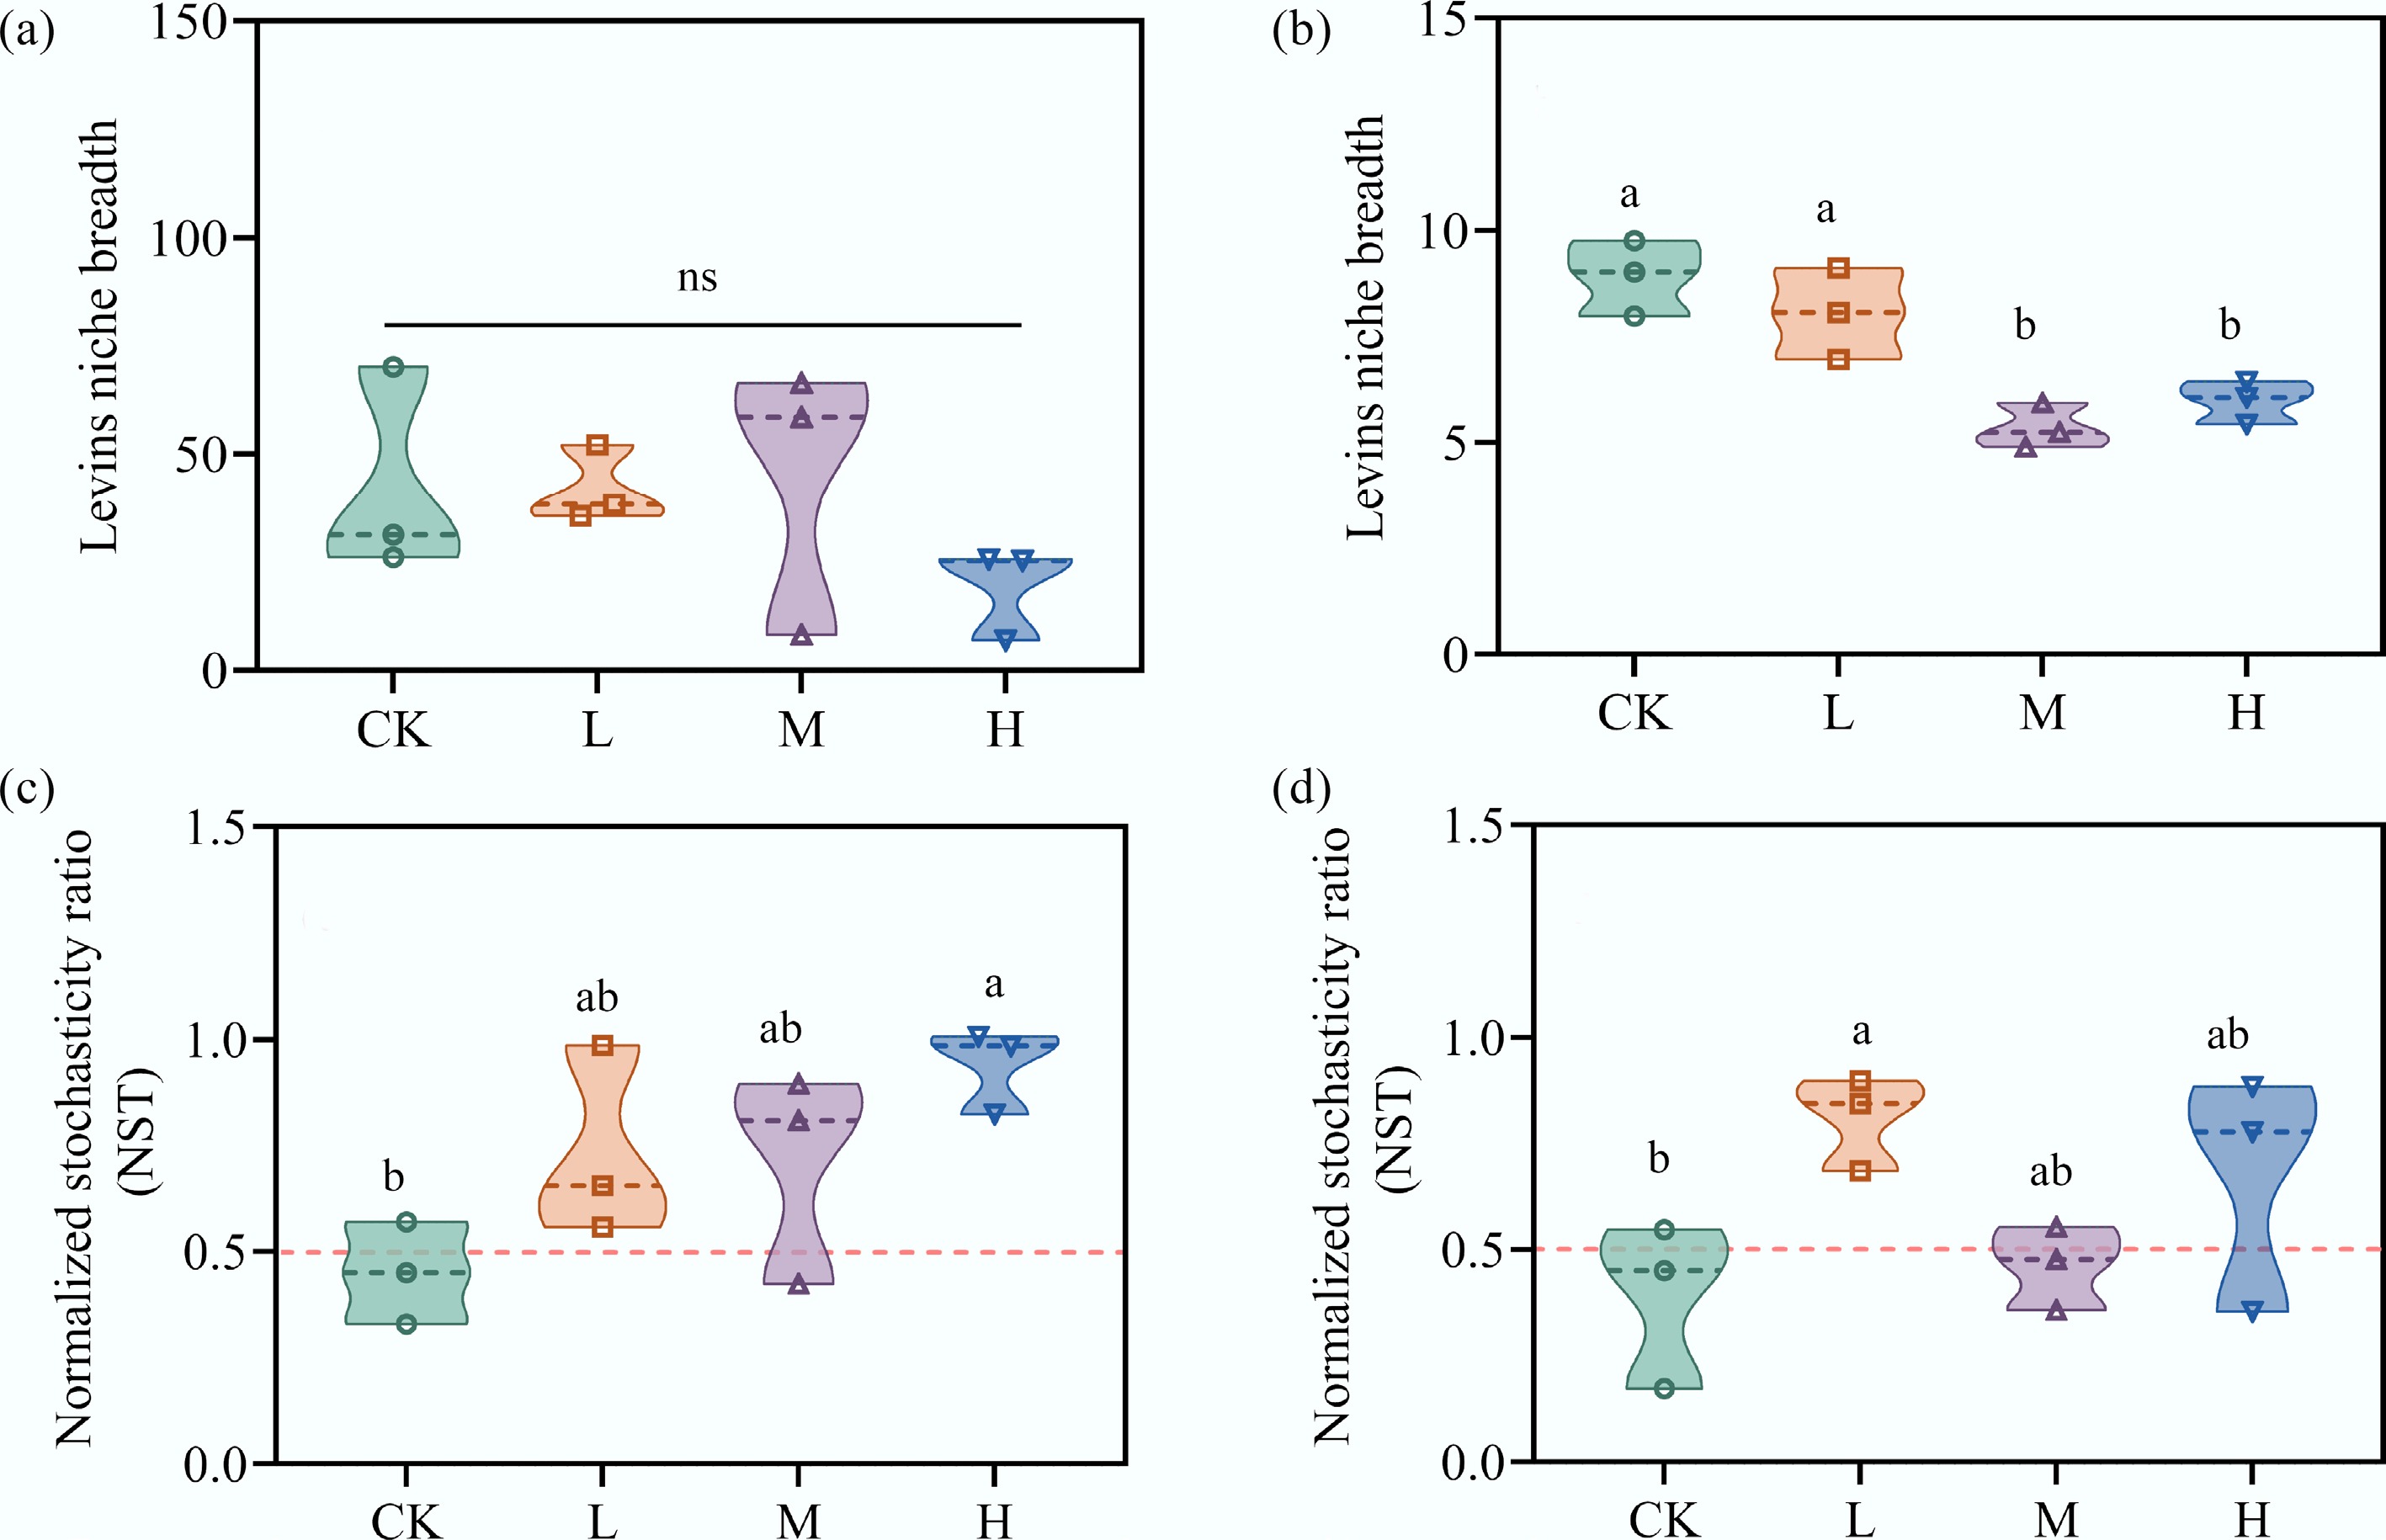
Figure 2.
HAP narrows species' niche breadth and increases stochasticity in community assembly. The average Levins' niche breadth of (a) bacterial, and (b) eukaryotic communities. The normalized stochasticity ratio (NST) of (c) bacterial, and (d) eukaryotic communities. An NST > 0.5 indicates the dominance of stochastic processes.
-
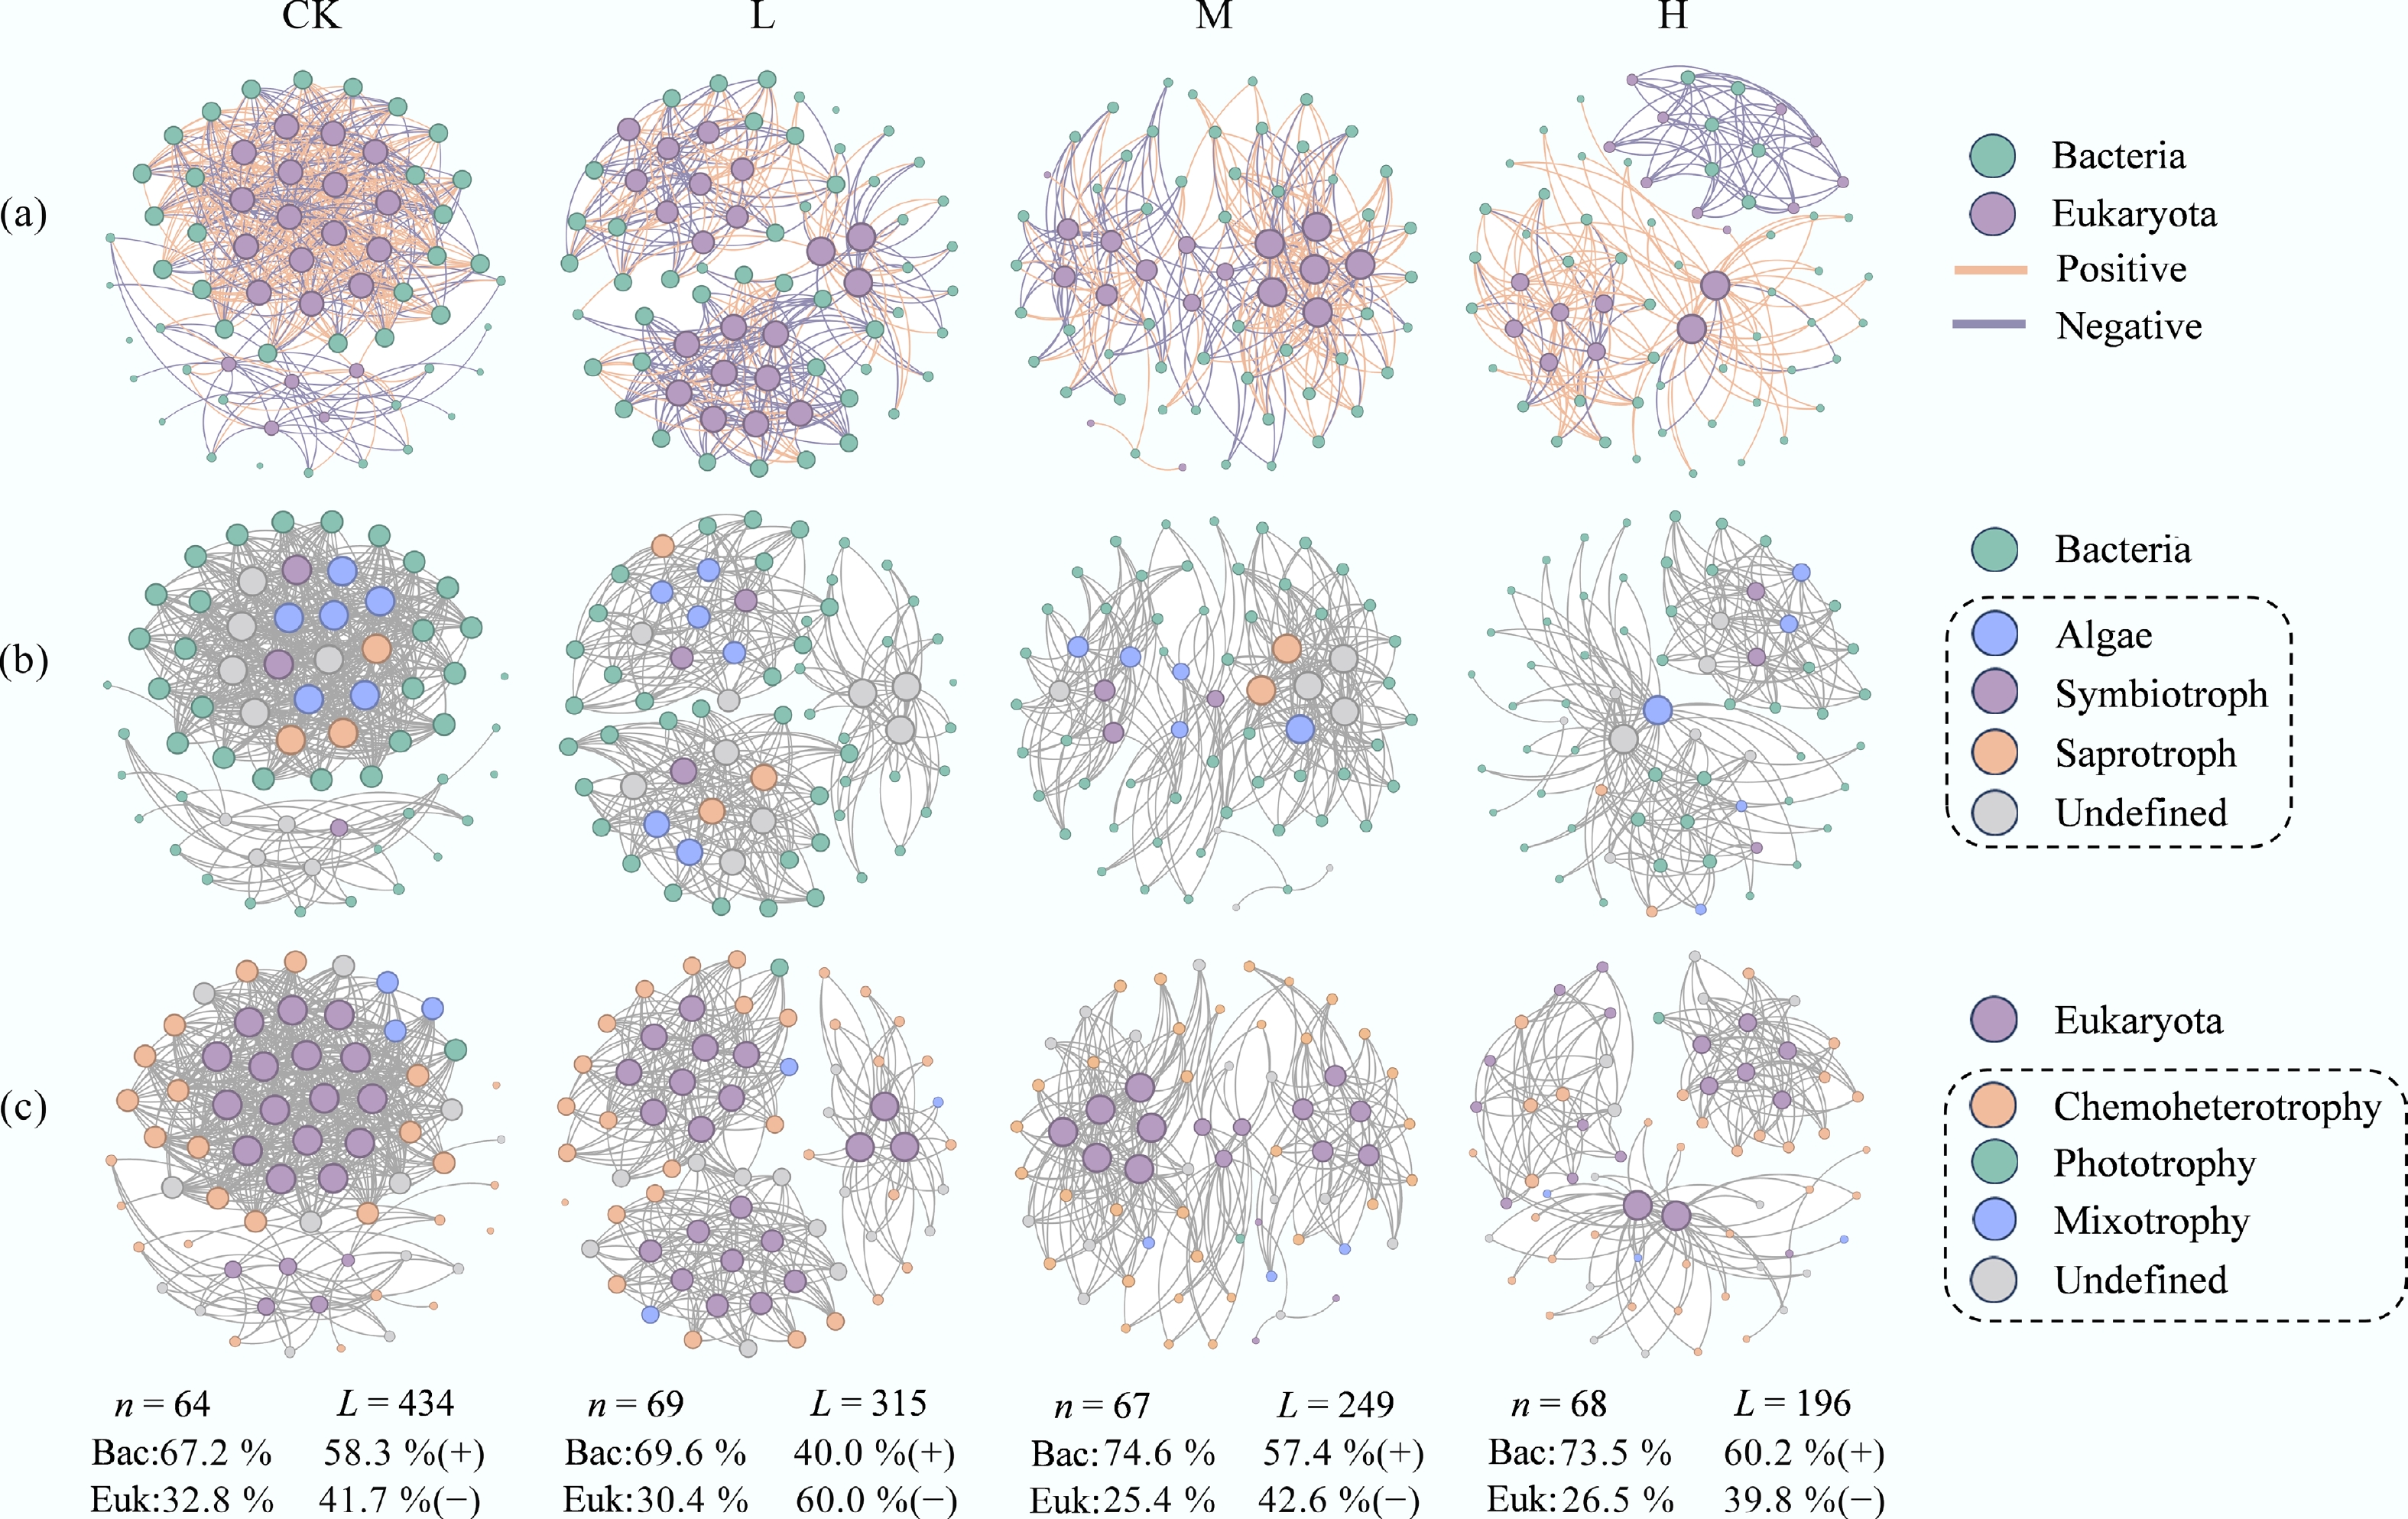
Figure 3.
HAP simplifies the architecture of bacteria-eukaryota interdomain networks. (a) Bipartite networks for each treatment. Node color represents taxonomy at the genus level, and size is proportional to node degree. Edges represent significant positive (green) and negative (red) correlations. (b), (c) Major trophic modes of (b) eukaryota, and (c) bacteria are annotated by the FUNGuild and FAPROTAX databases, respectively.
-
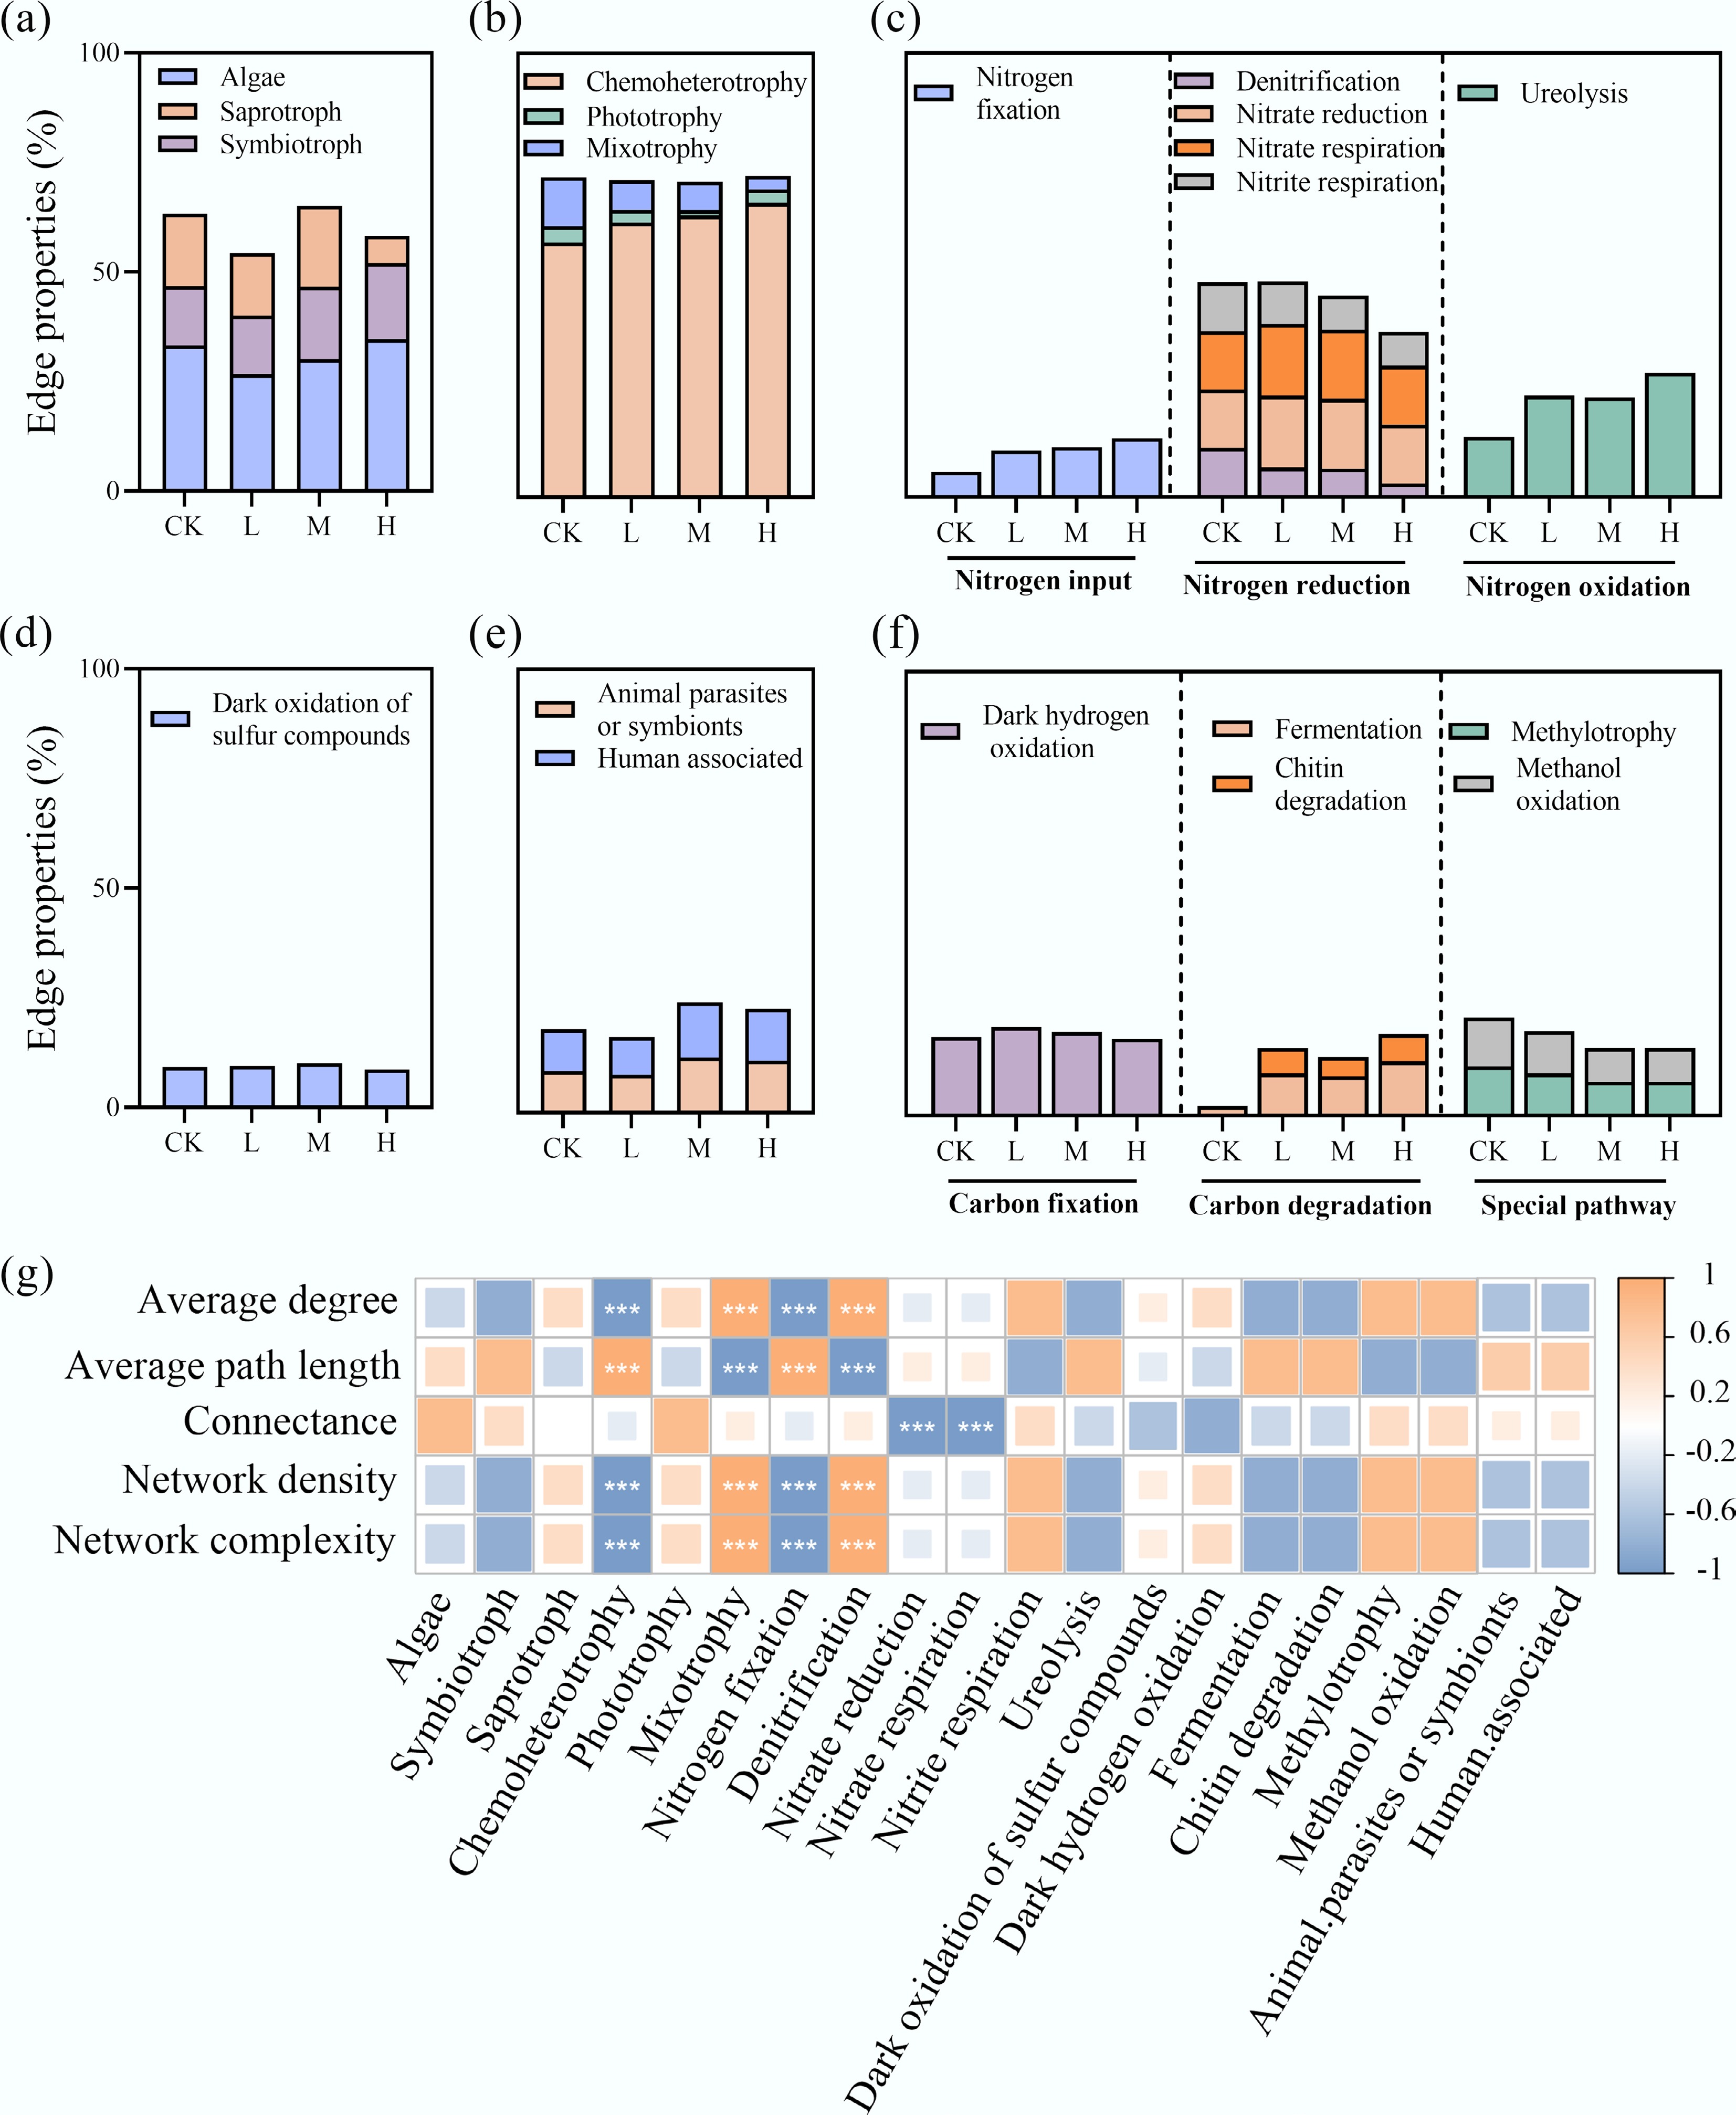
Figure 4.
HAP induces a functional reorganization of the periphyton network. The proportion of connections (edges) associated with different (a) bacterial ecological functional groups, and (b)–(f) eukaryotic trophic modes in the interdomain networks. (g) Correlation analysis between the connection proportions of key functional groups and overall network complexity indices.
-
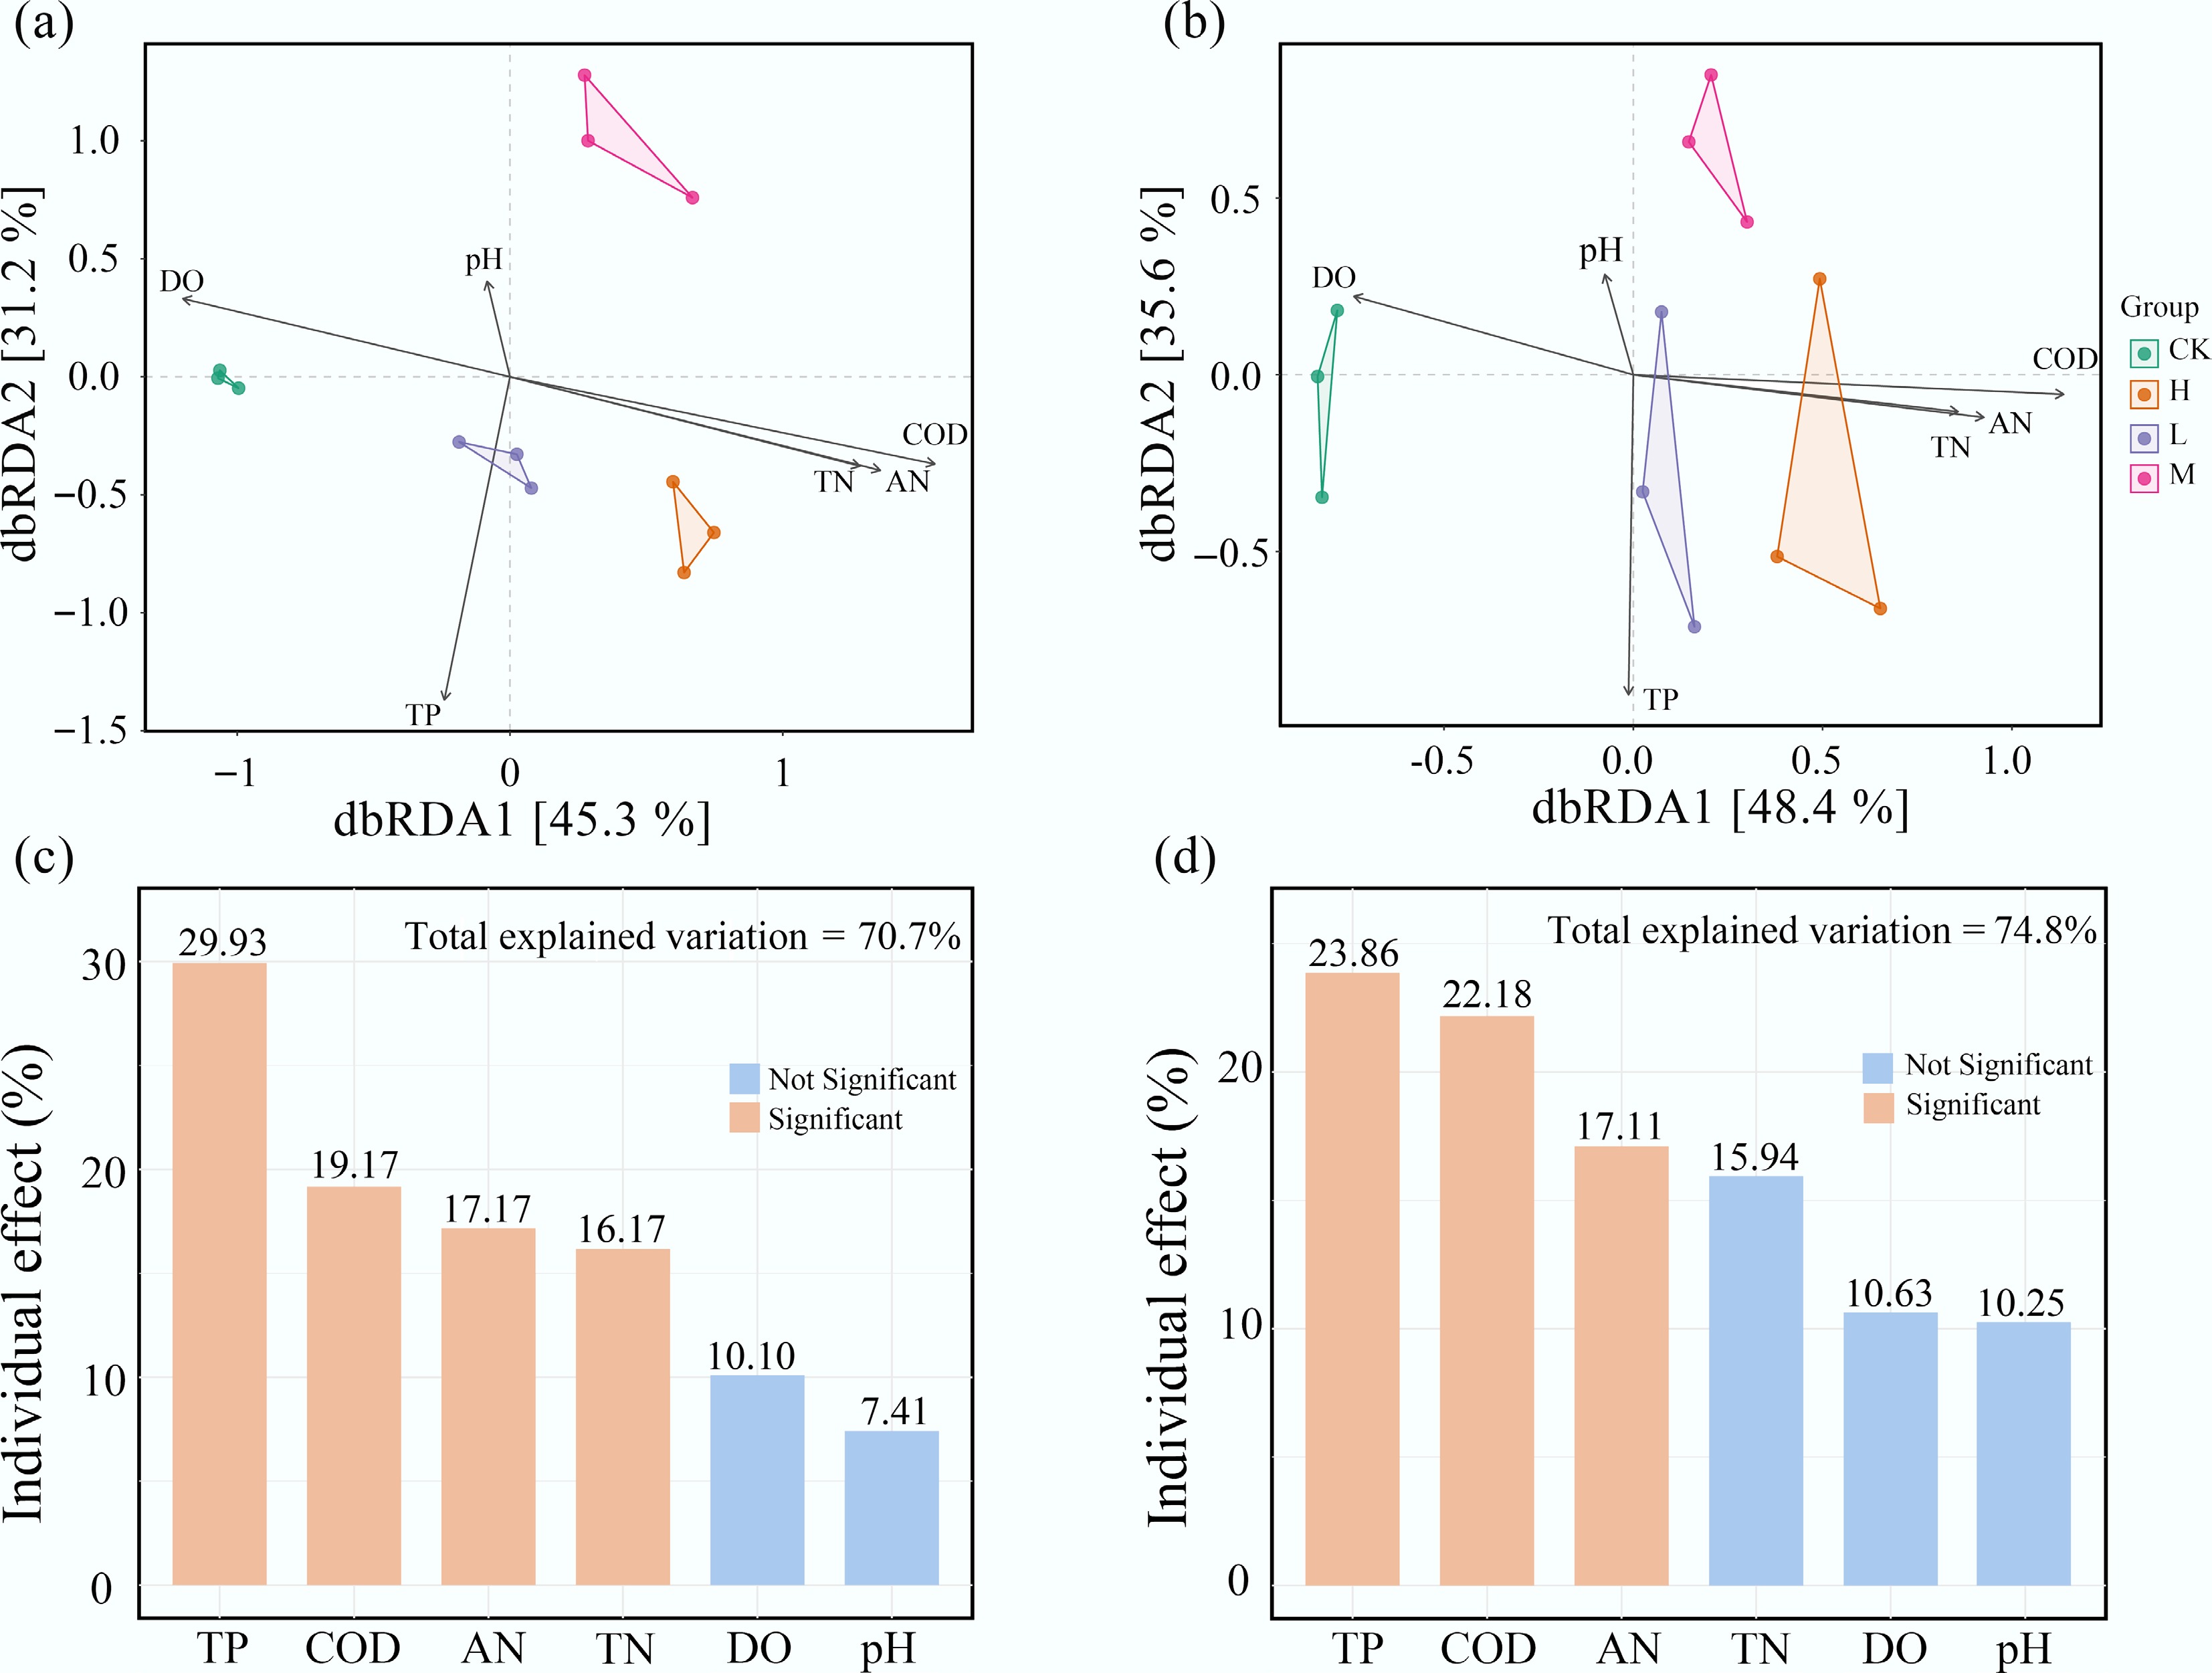
Figure 5.
Water nutrient levels are the primary environmental drivers of periphyton community composition. Distance-based redundancy analysis (dbRDA) of (a) bacterial, and (b) eukaryotic communities. The individual impact of each environmental factors on (c) bacteria, and (d) eukaryota is calculated based on the 'rdacca.hp' package.
-
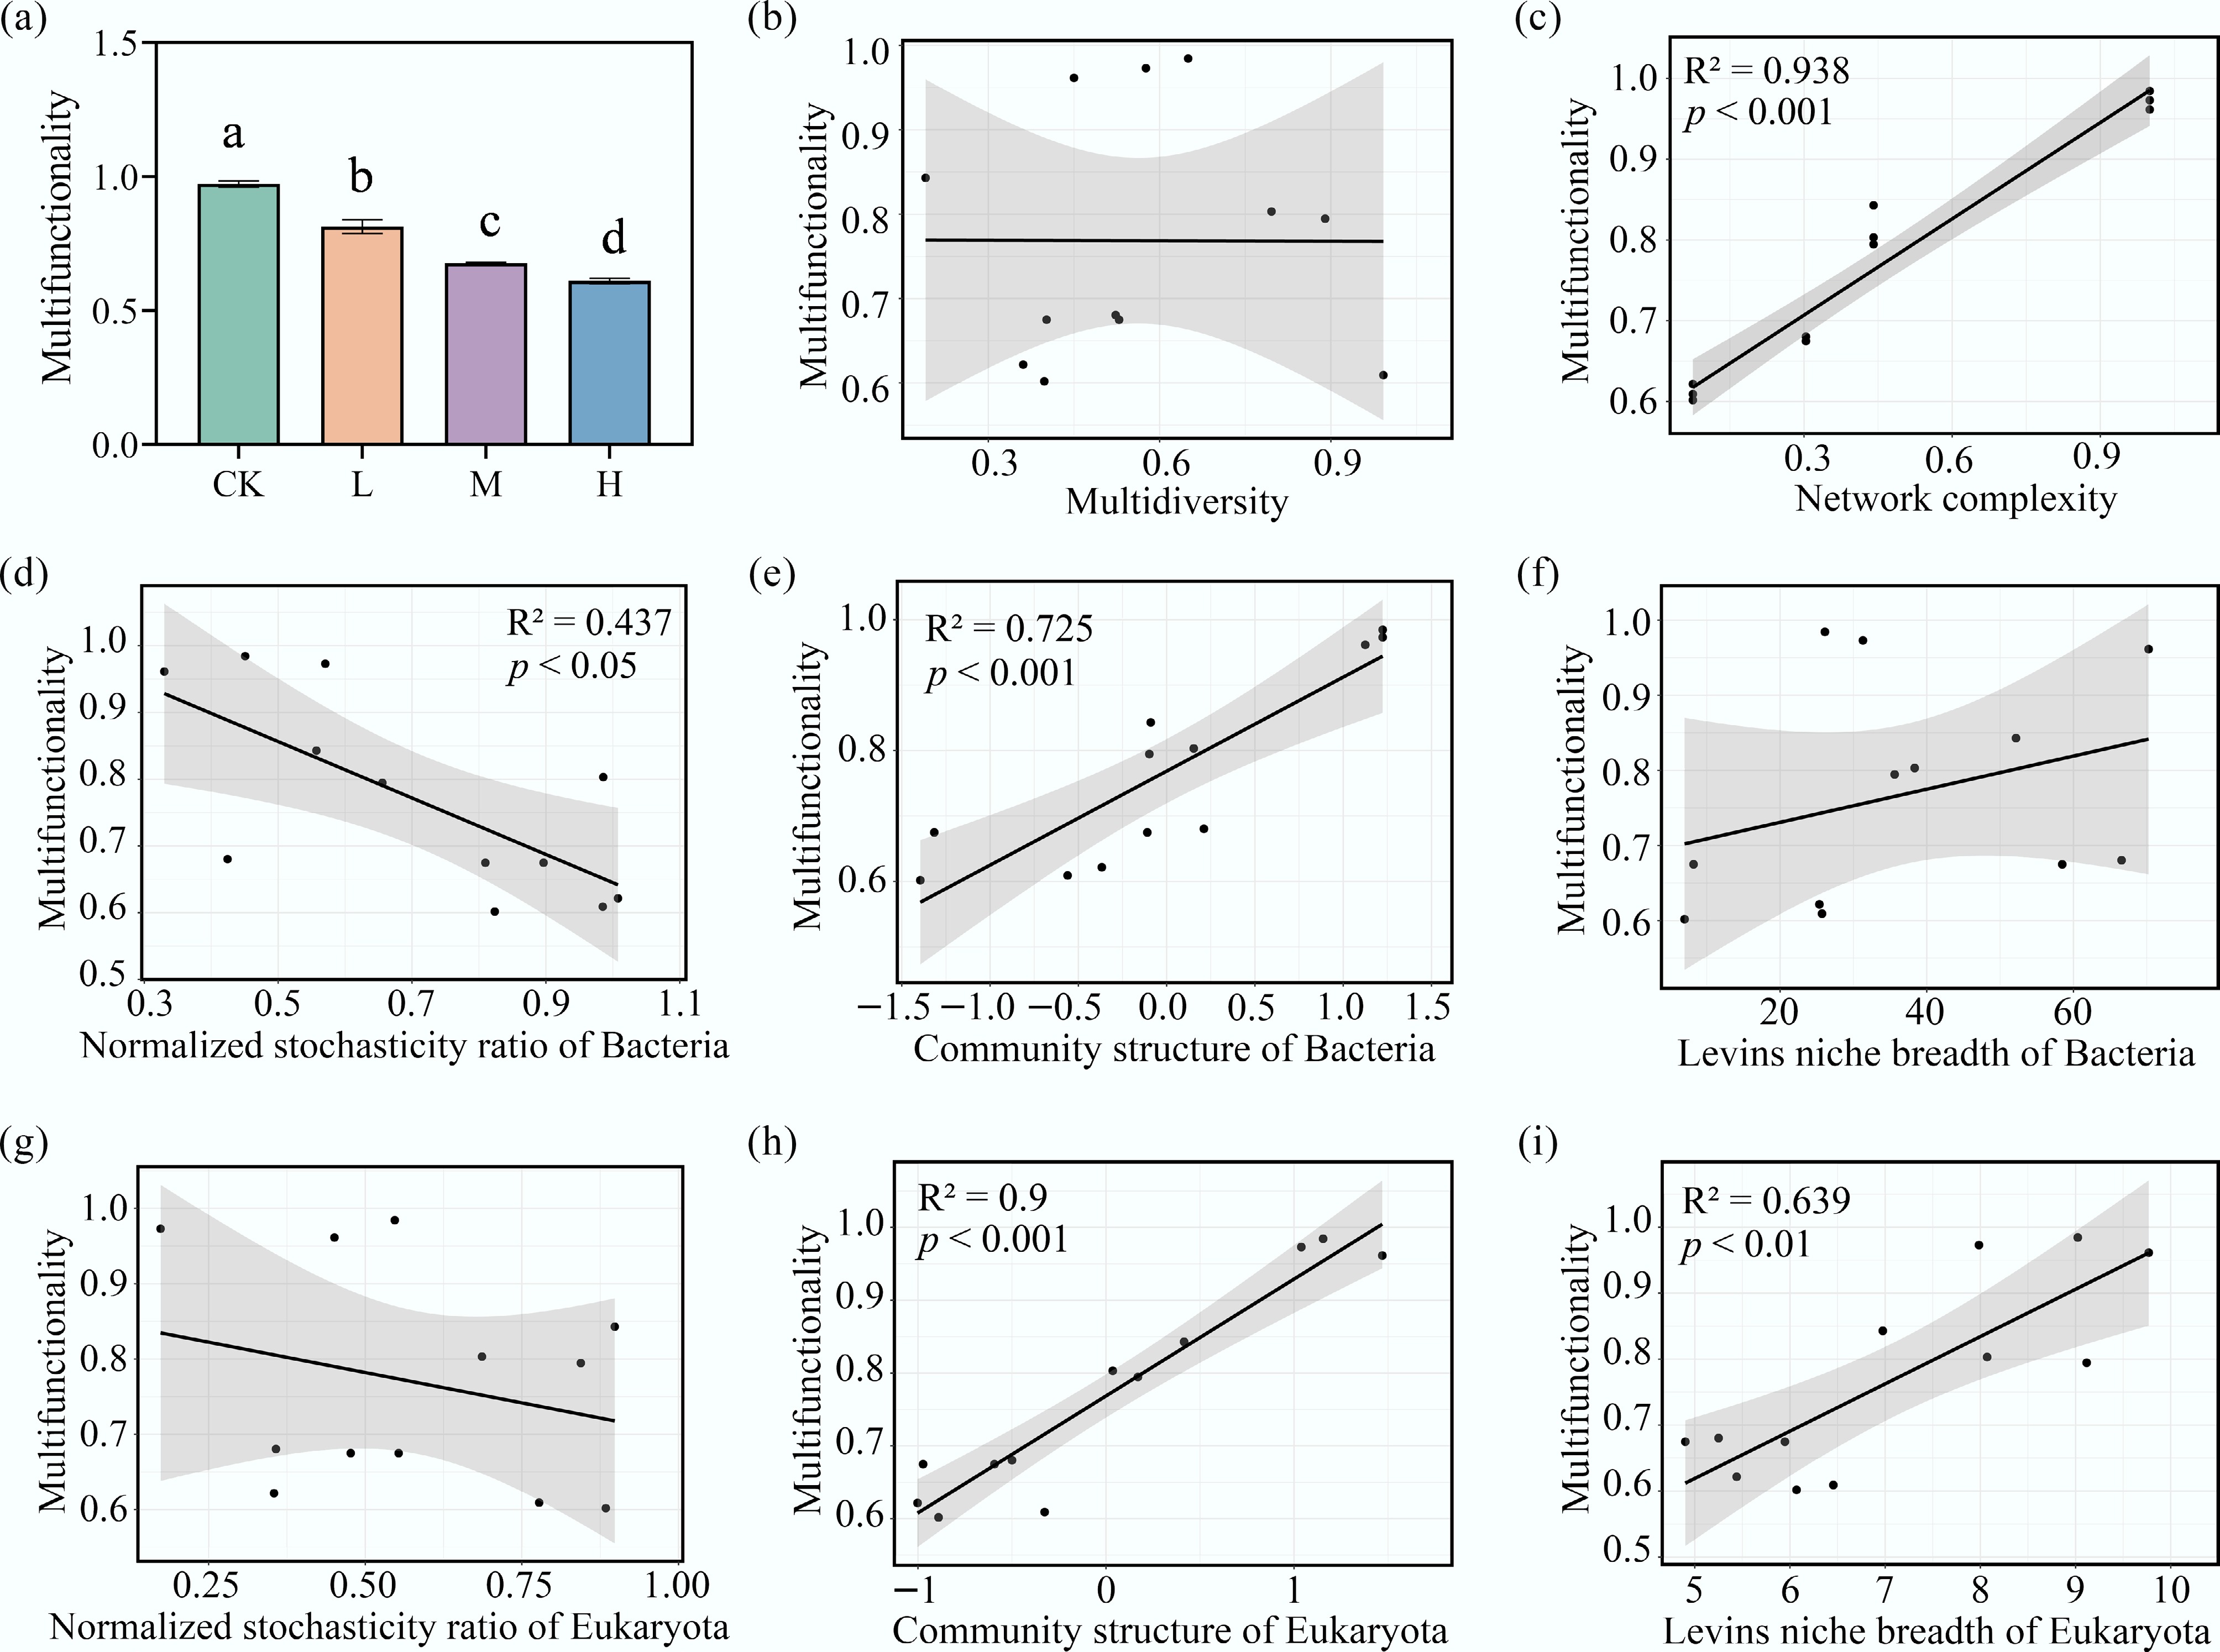
Figure 6.
Key microbial properties driving the decline of ecosystem multifunctionality under HAP stress. (a) The ecosystem multifunctionality (MF) index across treatments. Linear relationships between MF and the (b) multidiversity, (c) the network complexity, the normalized stochasticity ratio (NST) of (d) bacteria, and (g) eukaryota, the community structure (PCoA axis1) of (e) bacteria, and (h) eukaryota, and the Levins' niche breadth of (f) bacteria, and (i) eukaryota.
Figures
(6)
Tables
(0)