-
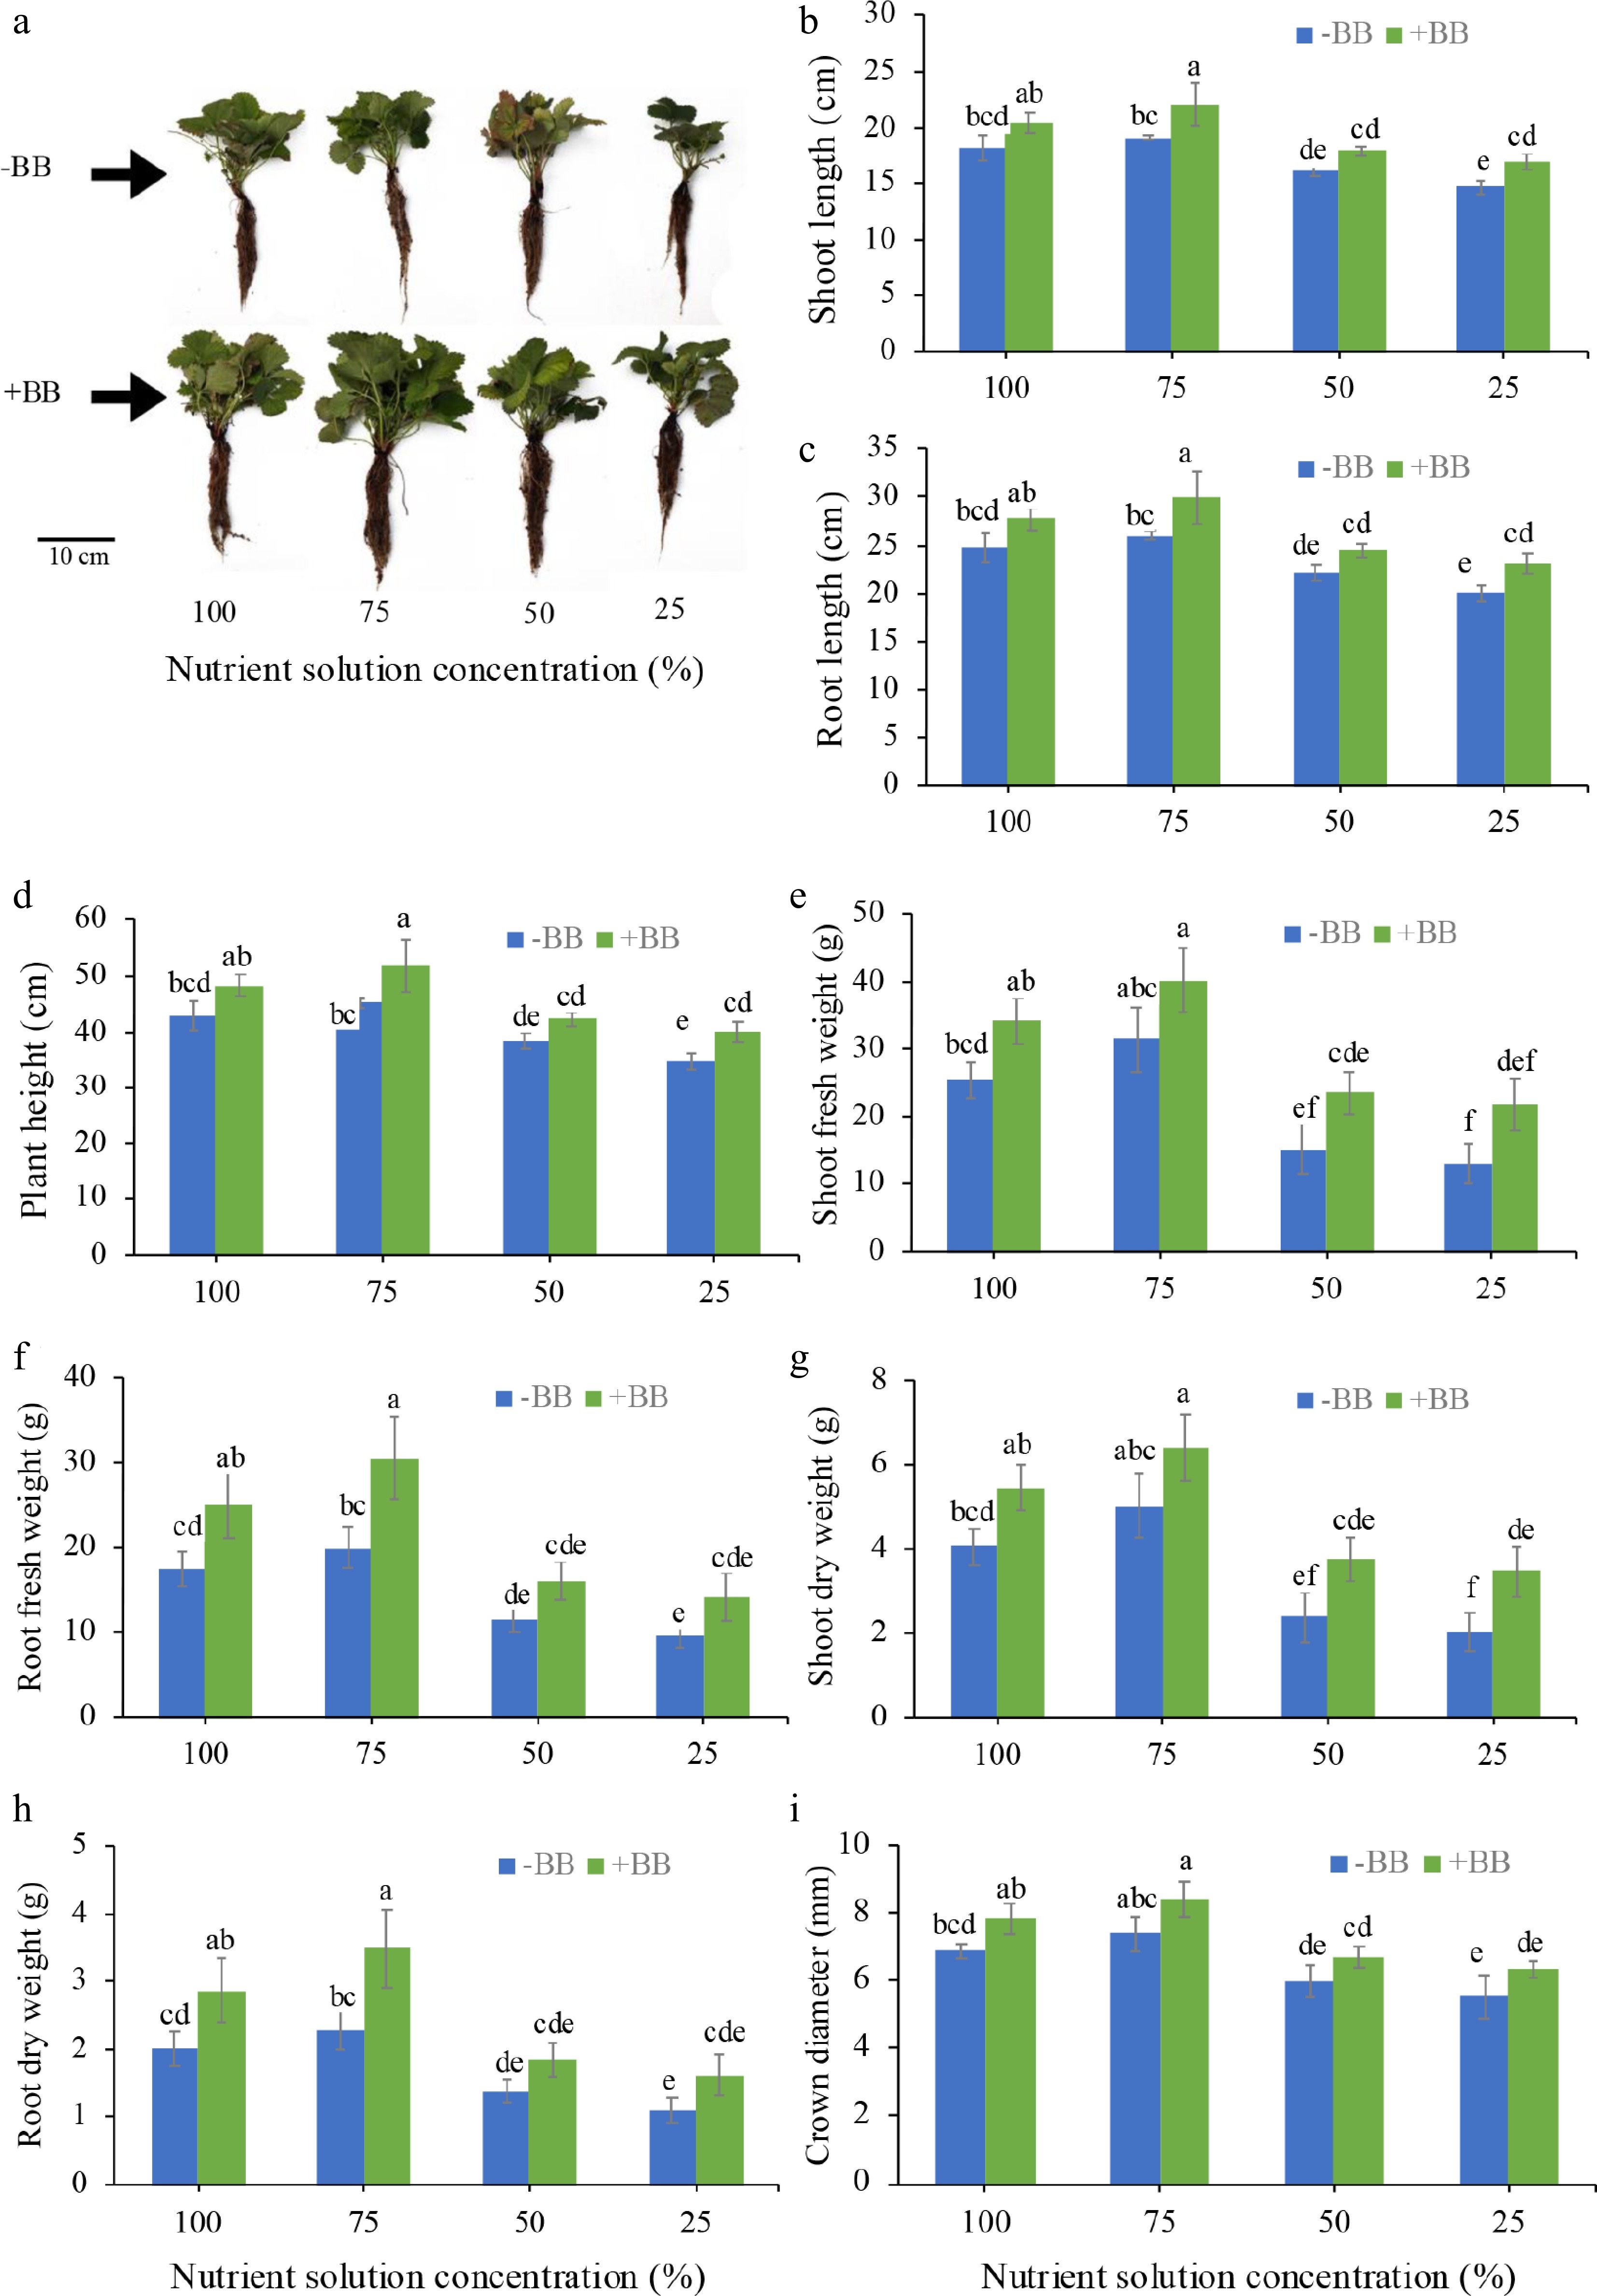
Figure 1.
Effects of B. bassiana on the morphological growth characters of strawberry plants grown in hydroponics at different nutrient concentrations. (a) Representative photographs of strawberry plants with and without BB at 100%, 75%, 50%, and 25% nutrient solution concentration, (b) shoot length, (c) root length, (d) plant height, (e) shoot fresh weight, (f) root fresh weight, (g) shoot dry weight, (h) root dry weight, and (i) crown diameter, subjected to 100%, 75%, 50%, and 25% nutrient solution respectively. Only bars with different letters are significantly different (lsd, p < 0.05). −BB, plant treated without B. bassiana; +BB, plant treated with B. bassiana; NS, nutrient solution.
-
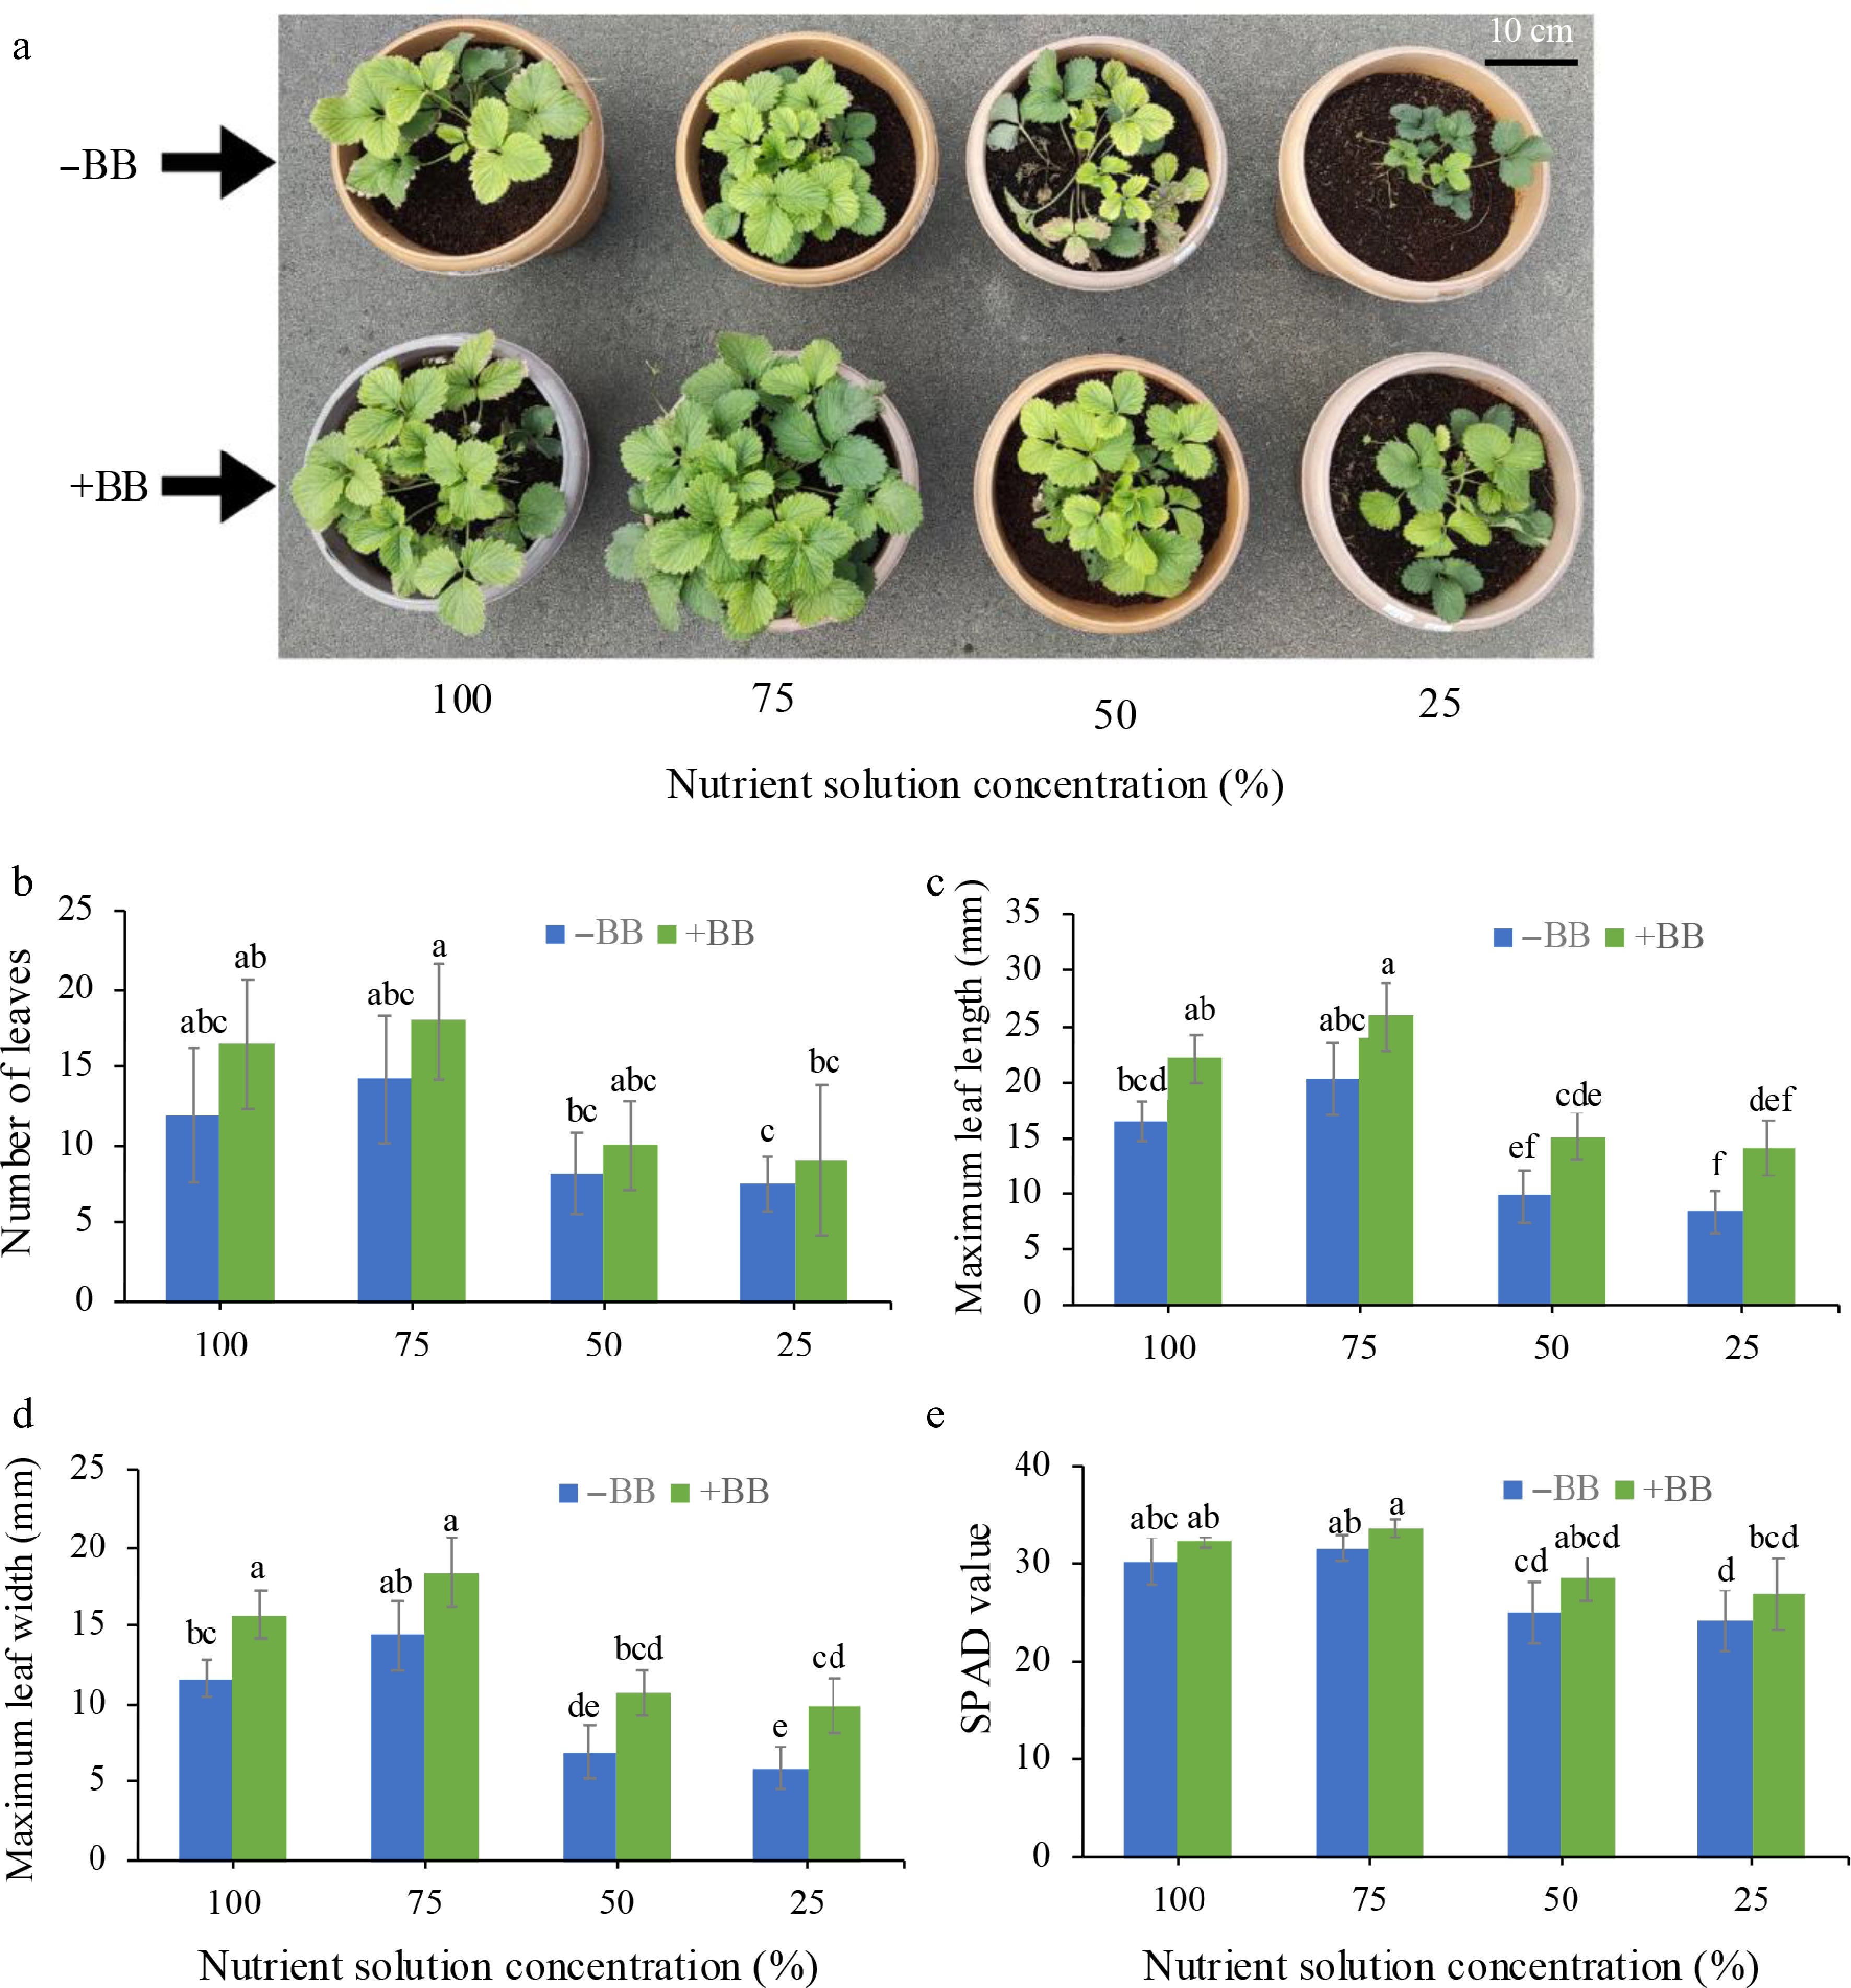
Figure 2.
Effects of B. bassiana on strawberry leaf growth-associated attributes at different nutrient concentrations. (a) Representative photographs of strawberry leaf growth with and without BB at 100%, 75%, 50%, and 25% nutrient solution concentration. (b) Number of leaves per plant, (c) maximum leaf length, (d) maximum leaf width, and (e) SPAD value, subjected to 100%, 75%, 50%, and 25% nutrient solution respectively. Only bars with different letters are significantly different (lsd, p < 0.05). −BB, plant treated without B. bassiana; +BB, plant treated with B. bassiana; NS, nutrient solution.
-
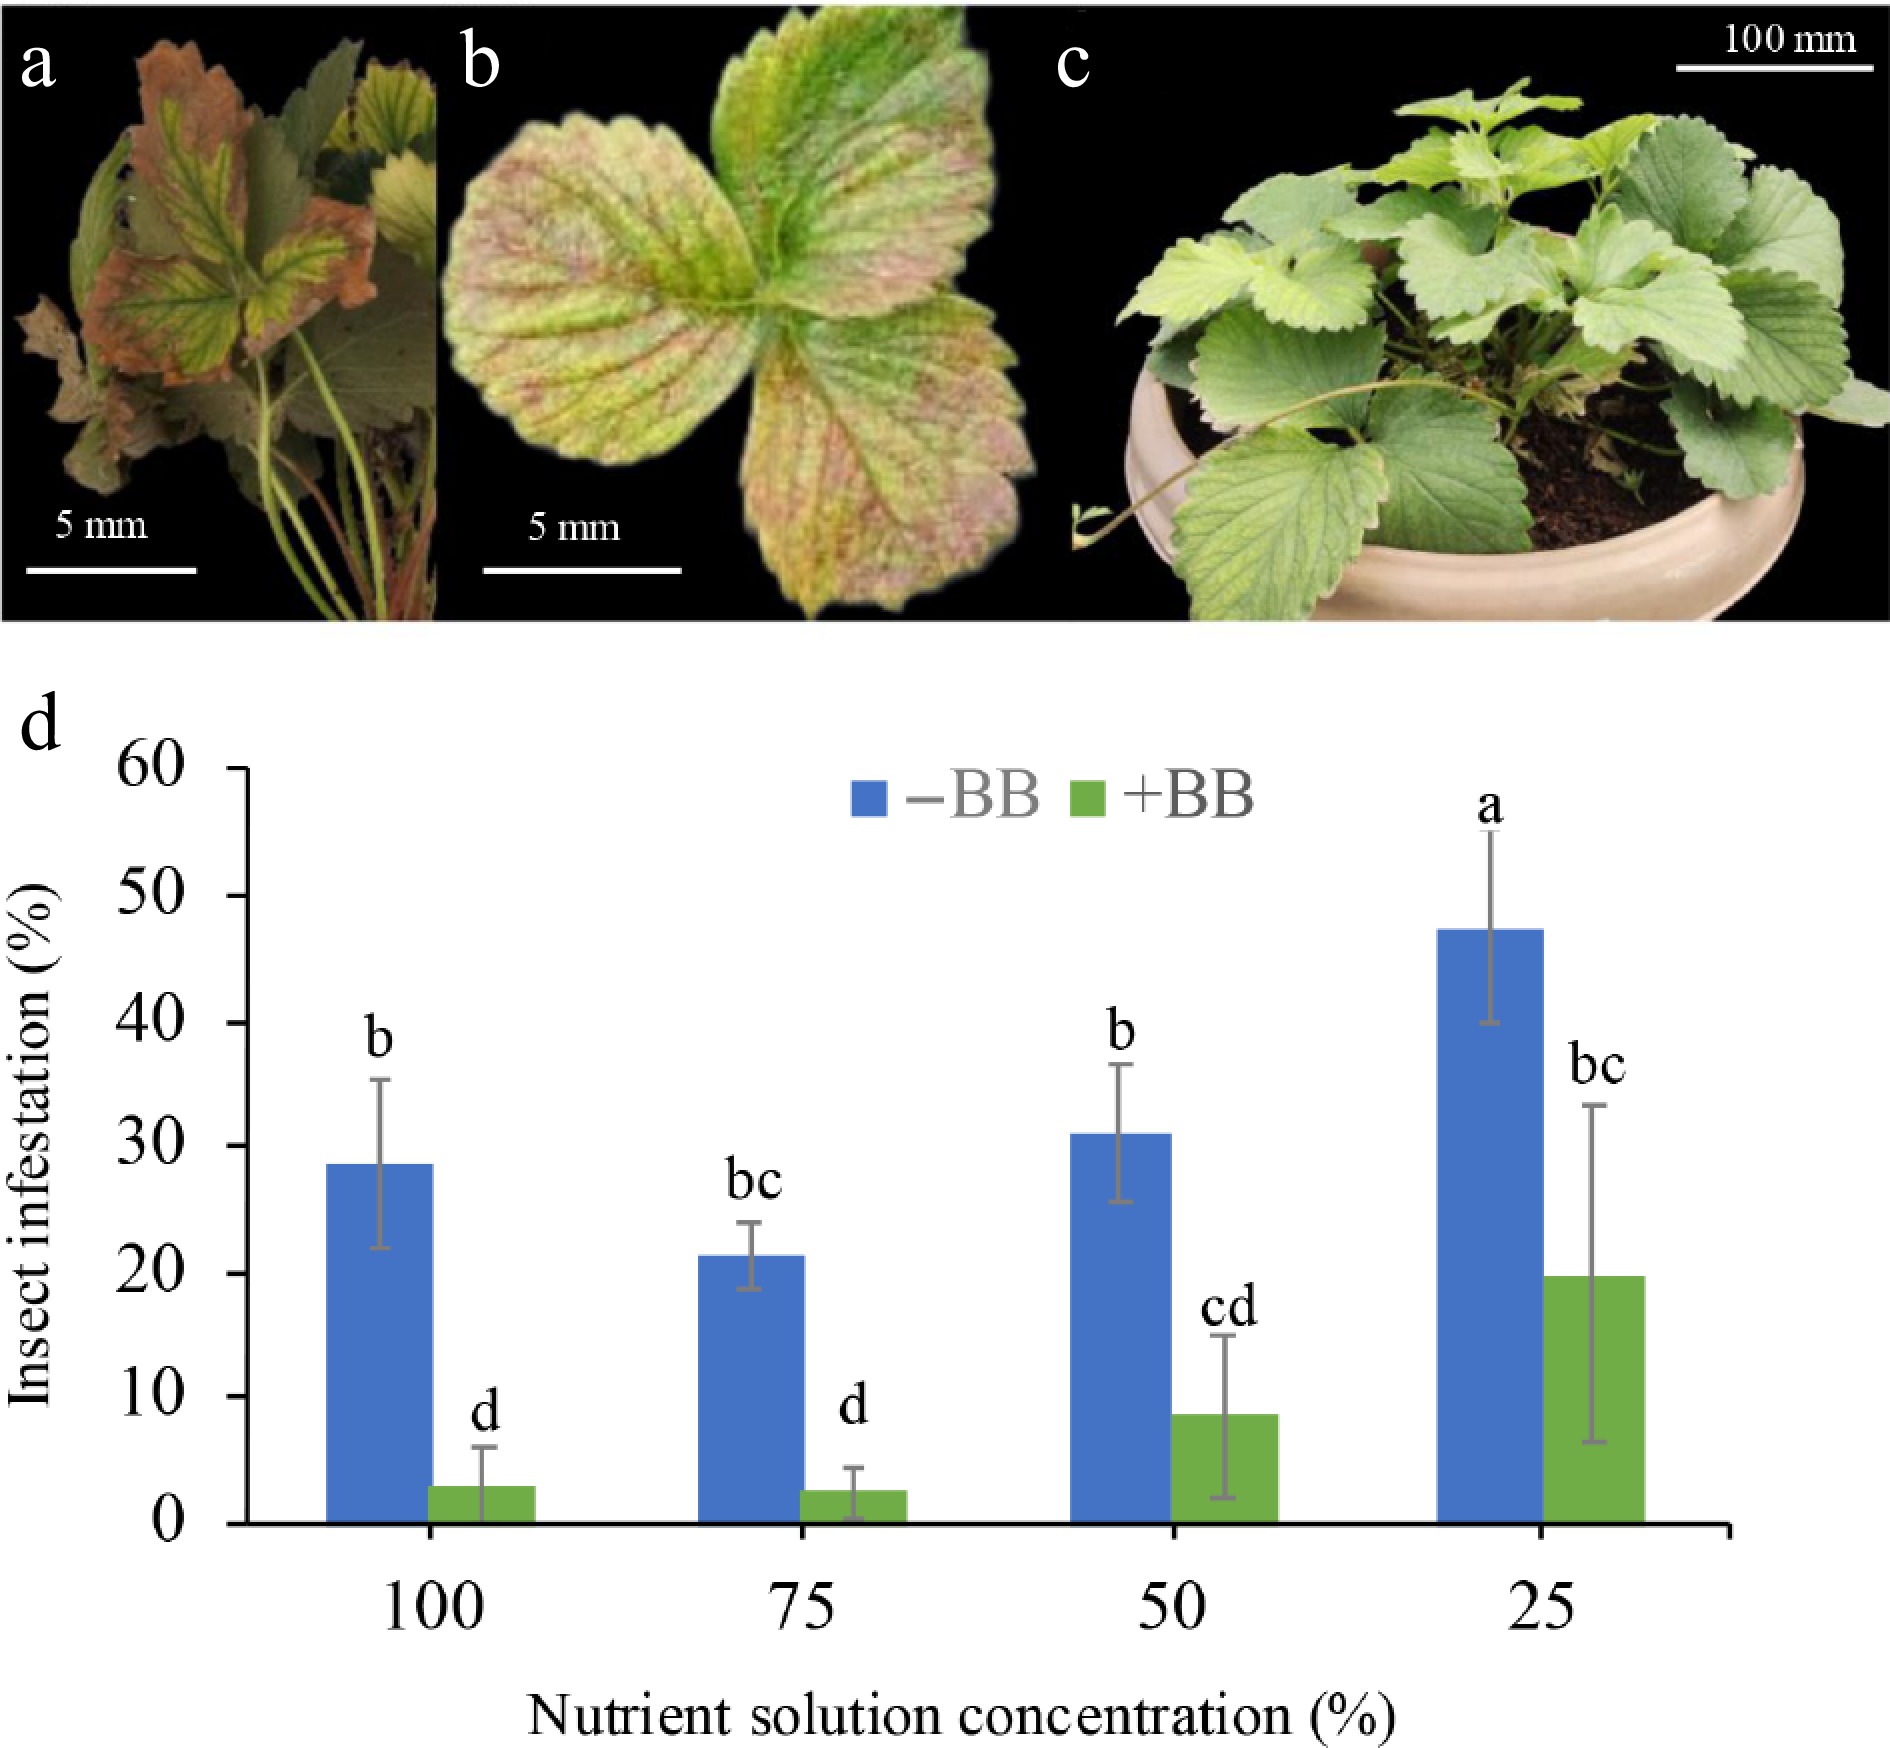
Figure 3.
Different insect infestations in strawberry leaves in comparison with fresh leaves. (a) Spider mite infestation, (b) leaf roller-infested leaves, (c) non-infested fresh leaves, and (d) effects of B. bassiana on insect infestation as percent of infested leaves of strawberry plants at 100%, 75%, 50%, and 25% nutrient solution concentrations. Only bars with different letters are significantly different (lsd, p < 0.05). −BB, plant treated without B. bassiana; + BB, plant treated with B. bassiana.
-
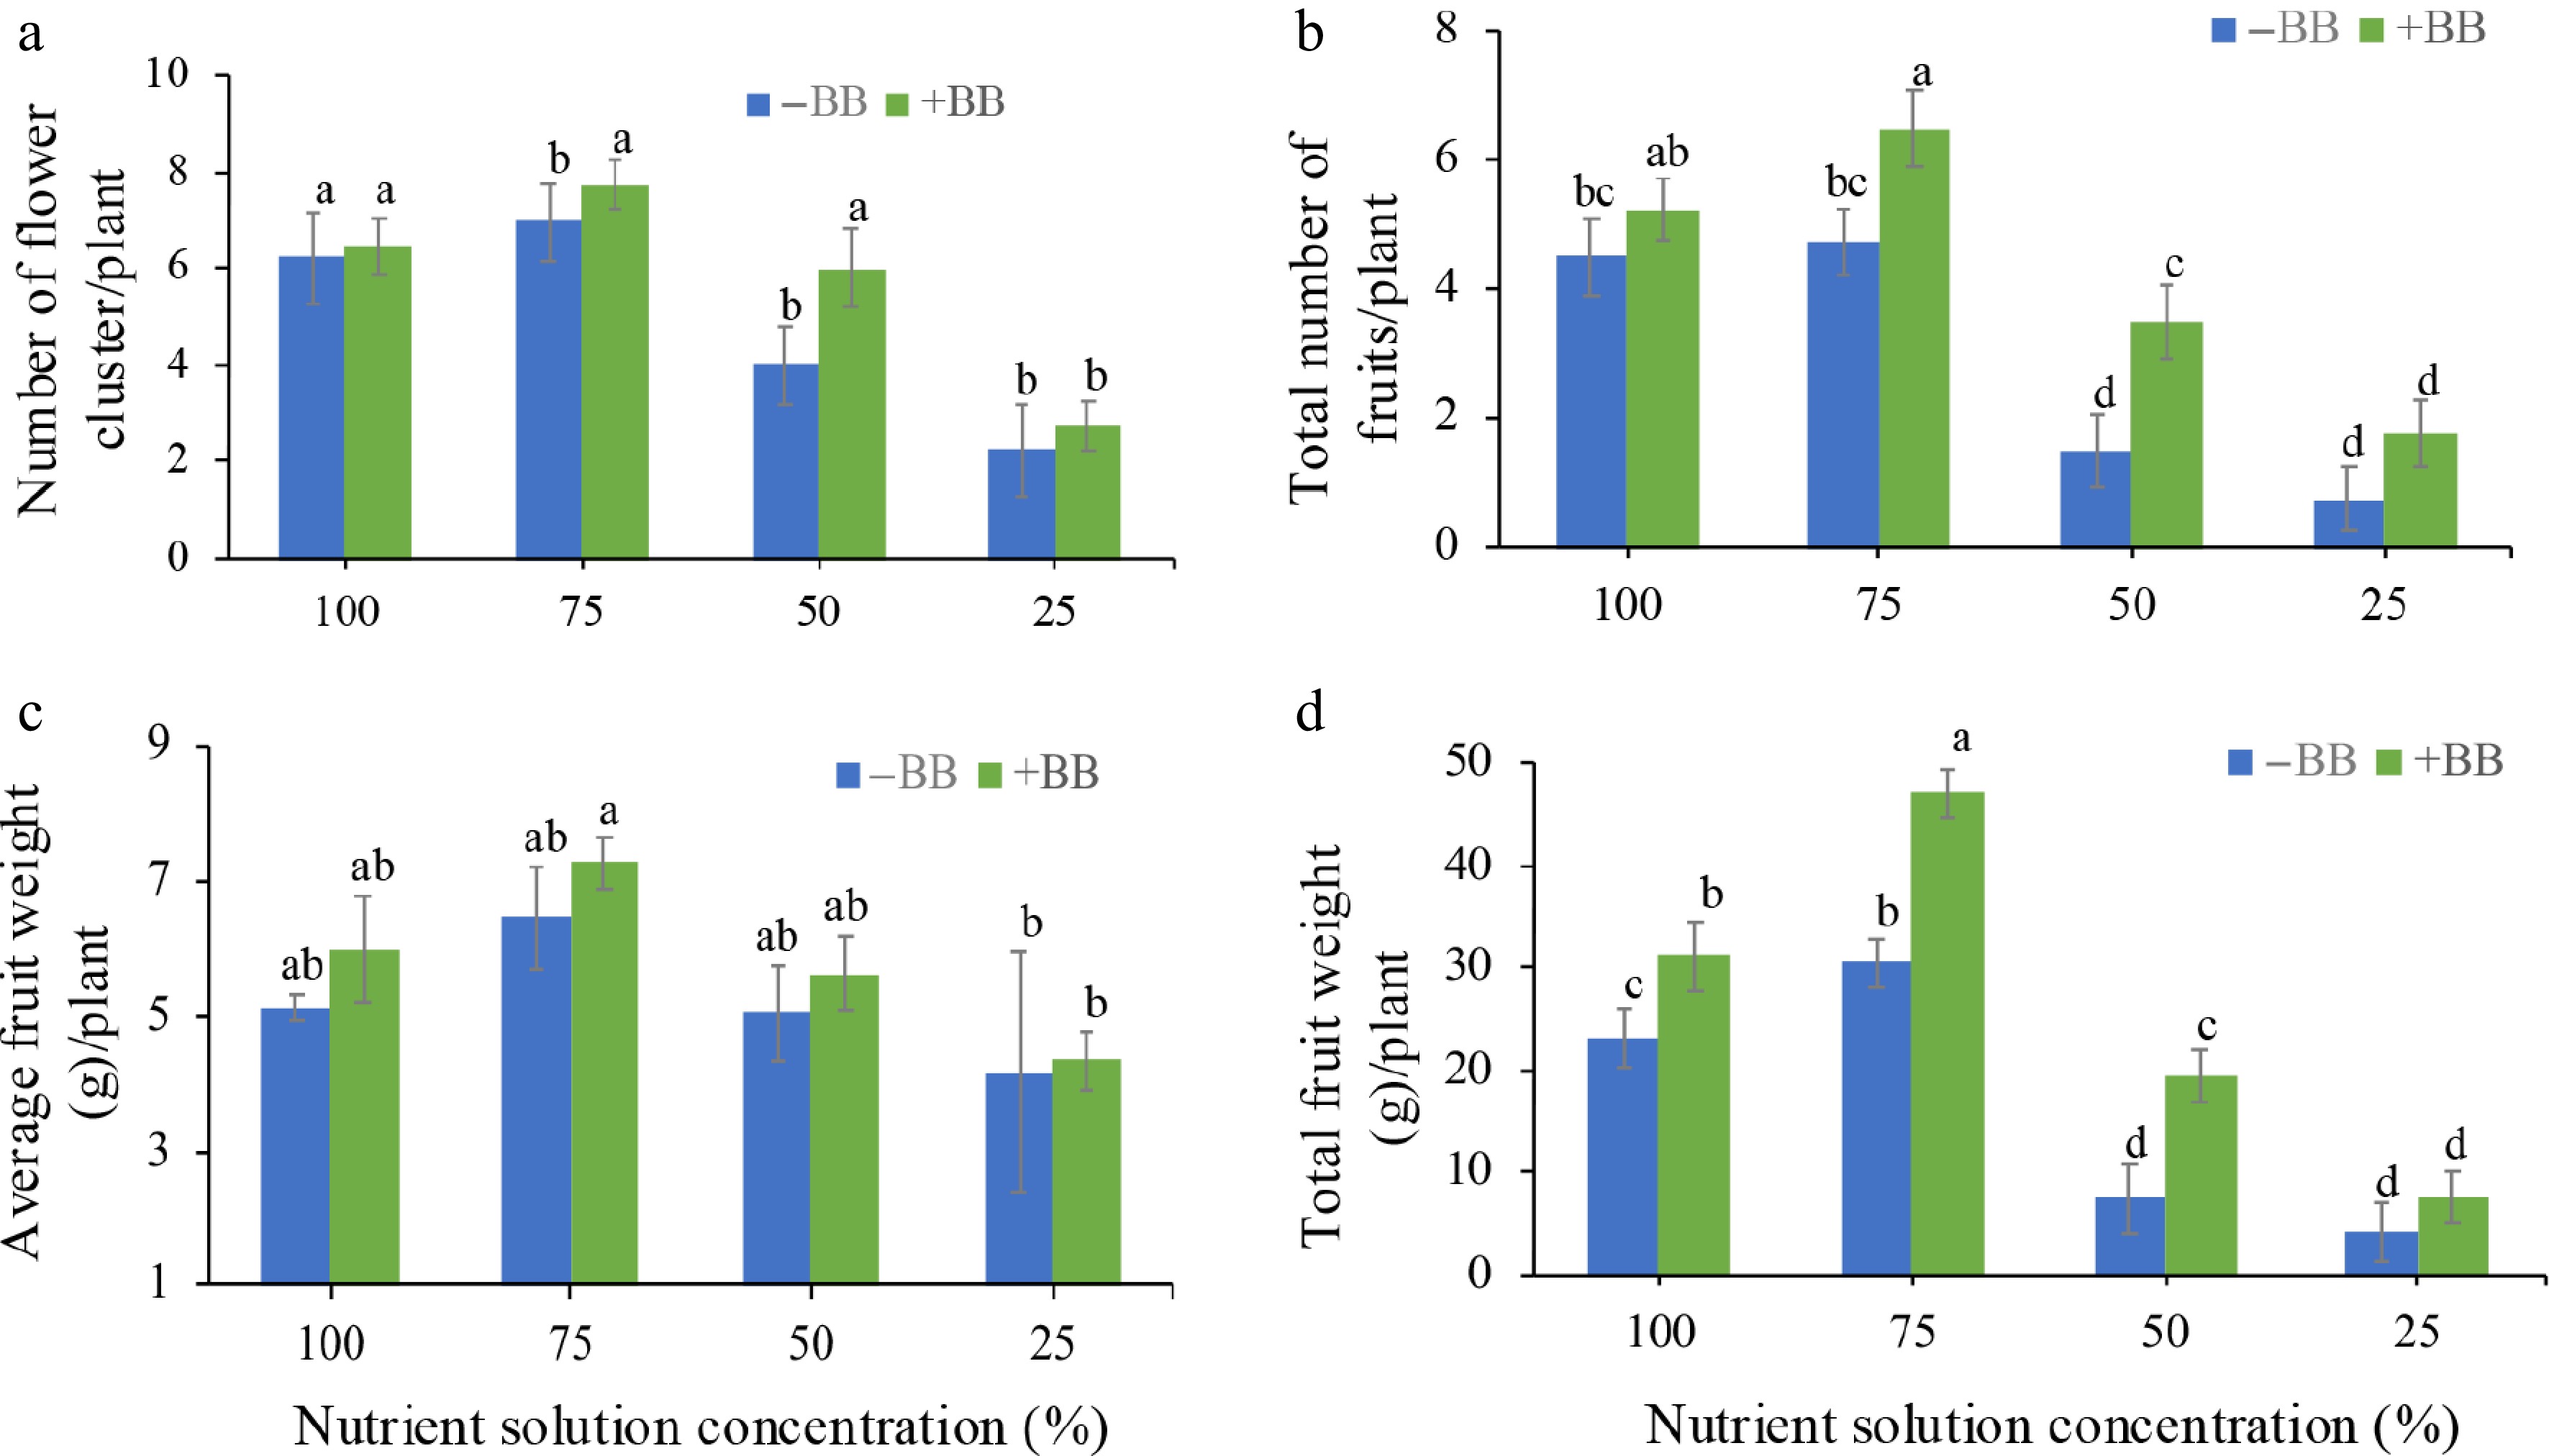
Figure 4.
Effects of B. bassiana on strawberry flower and fruit production-associated attributes at different nutrient concentrations. (a) Number of flower clusters per plant, (b) total number of fruits per plant, (c) average fruit weight per plant, and (d) total fruit weight per plant subjected to 100%, 75%, 50%, and 25% nutrient solution respectively. Only bars with different letters are significantly different (lsd, p < 0.05). −BB, plant treated without B. bassiana; +BB, plant treated with B. bassiana.
-
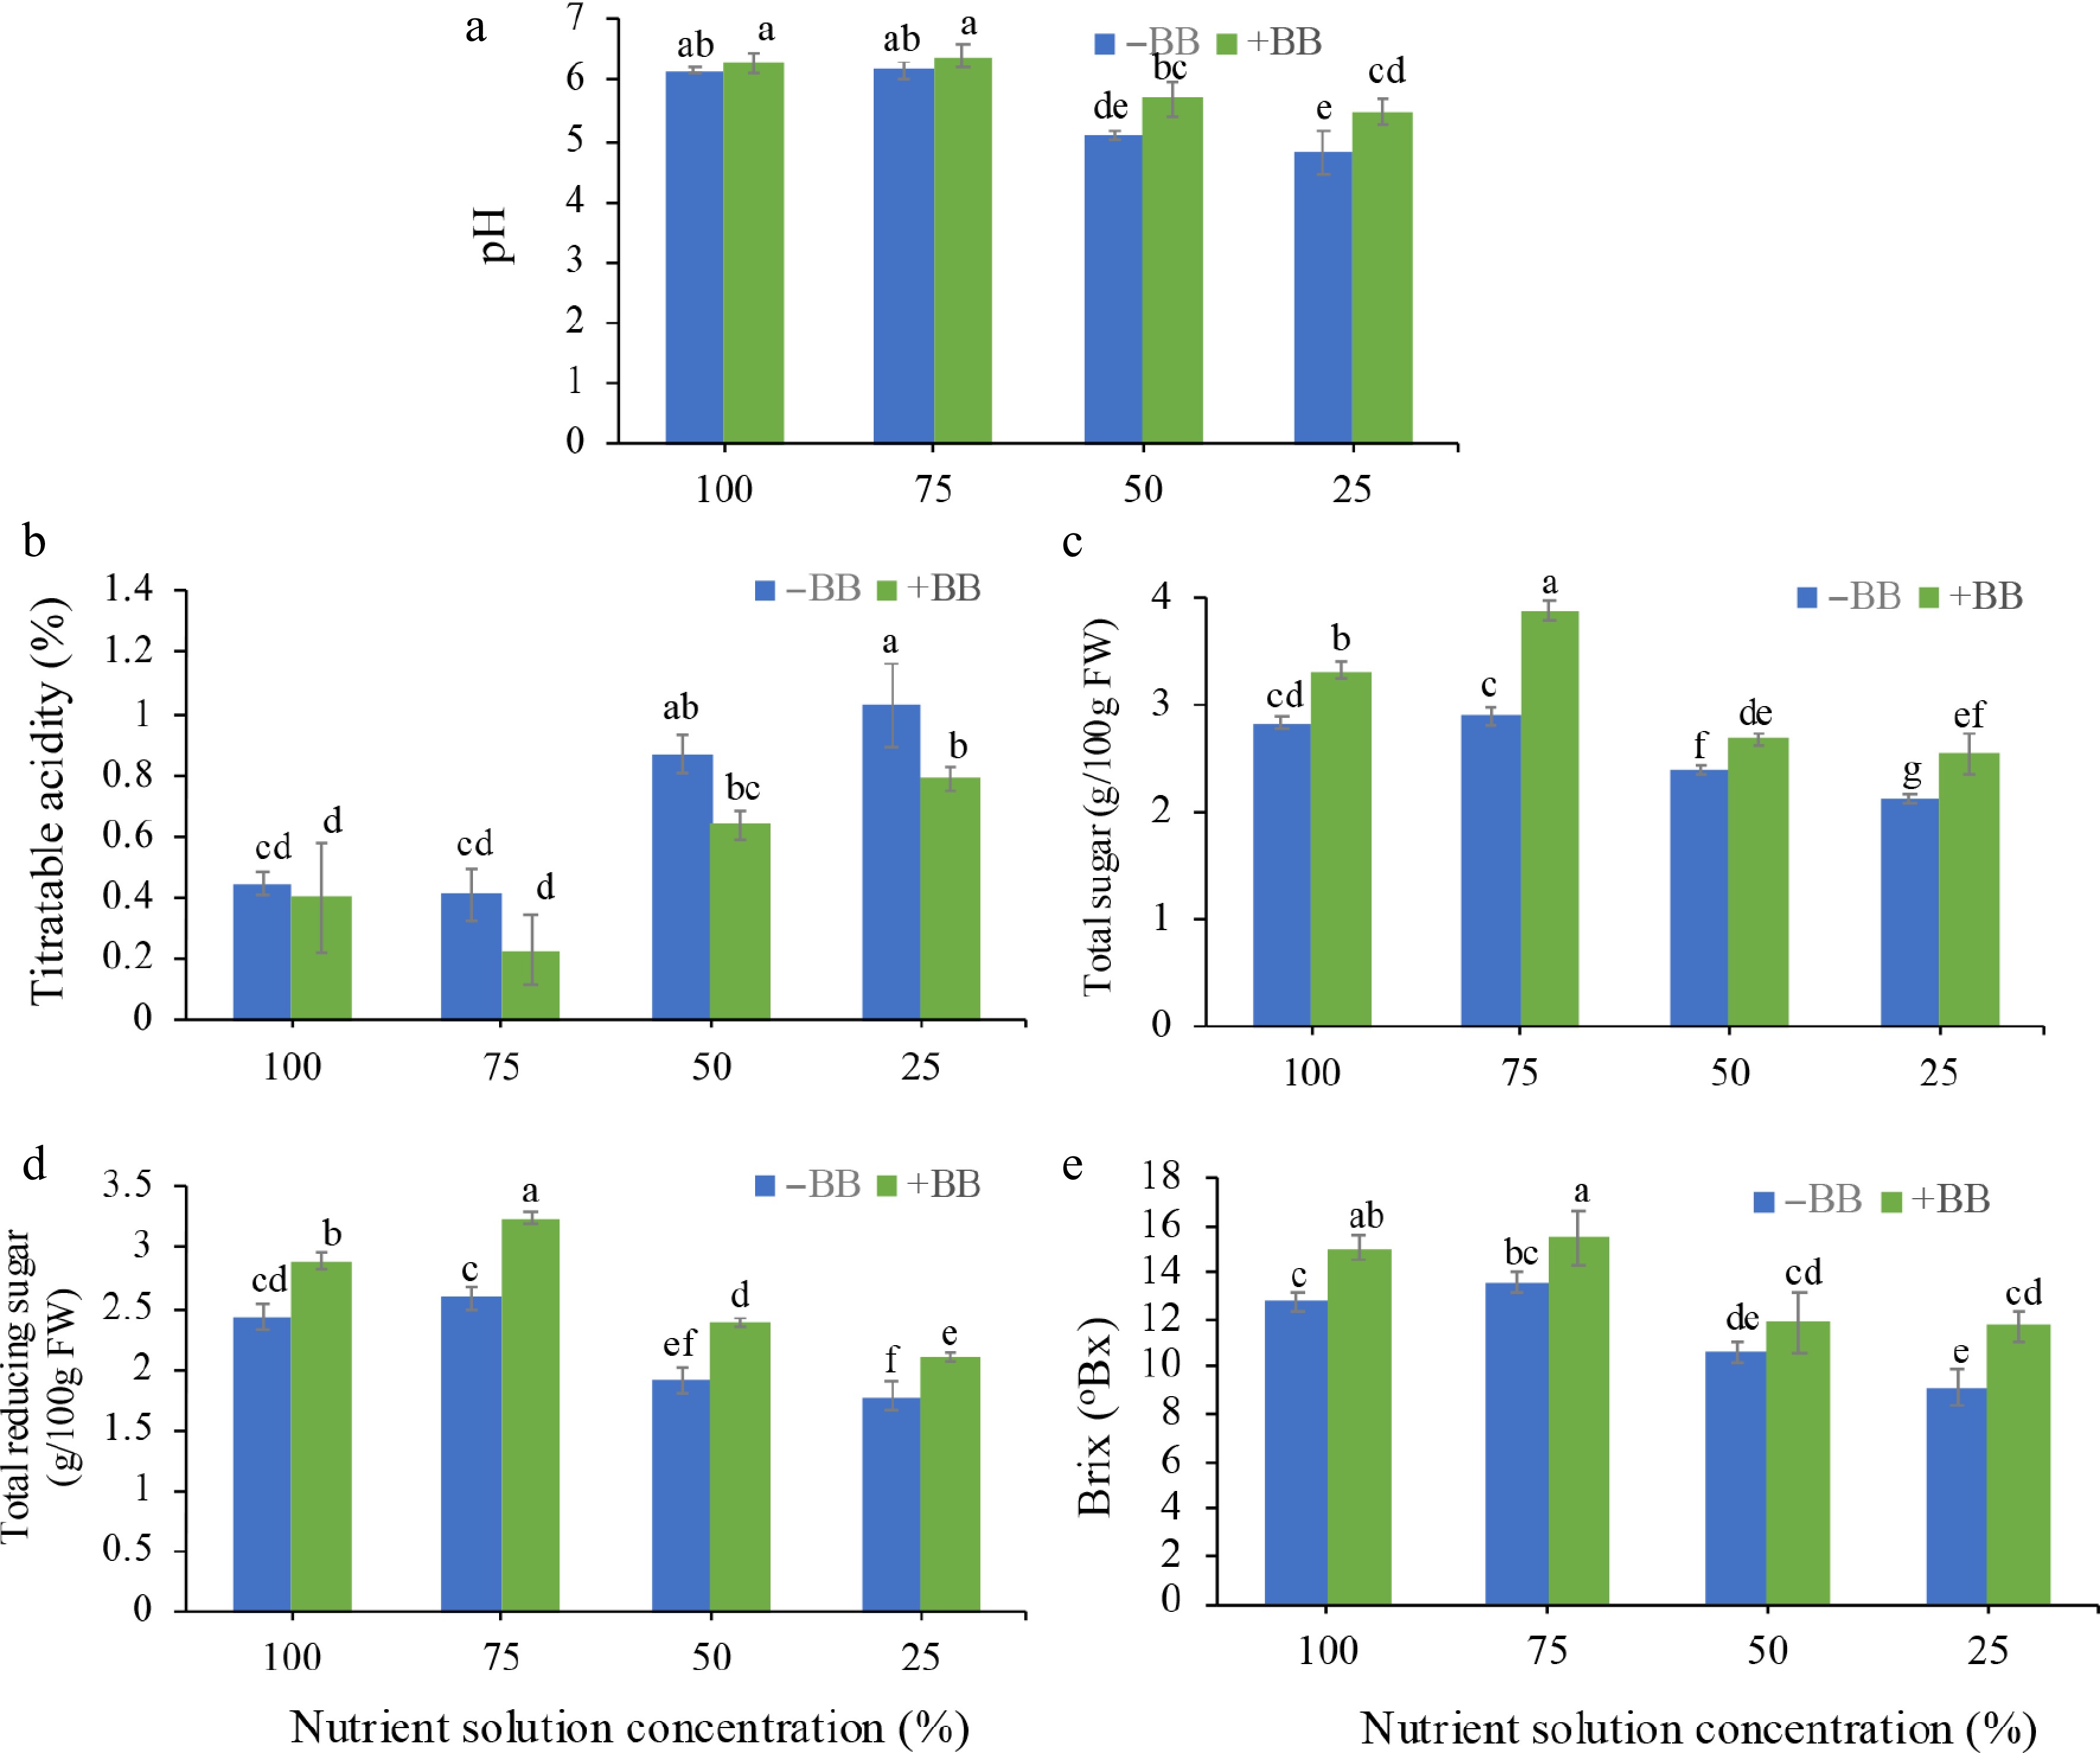
Figure 5.
Effects of B. bassiana acidity and sugar content of strawberry fruits at different nutrient concentrations. (a) pH, (b) titratable acidity, (c) total sugar, (d) total reducing sugar, and (e) Brix subjected to 100%, 75%, 50%, and 25% nutrient solution respectively. Only bars with different letters are significantly different (lsd, p < 0.05). −BB, plant treated without B. bassiana; +BB, plant treated with B. bassiana; FW, Fresh weight.
-
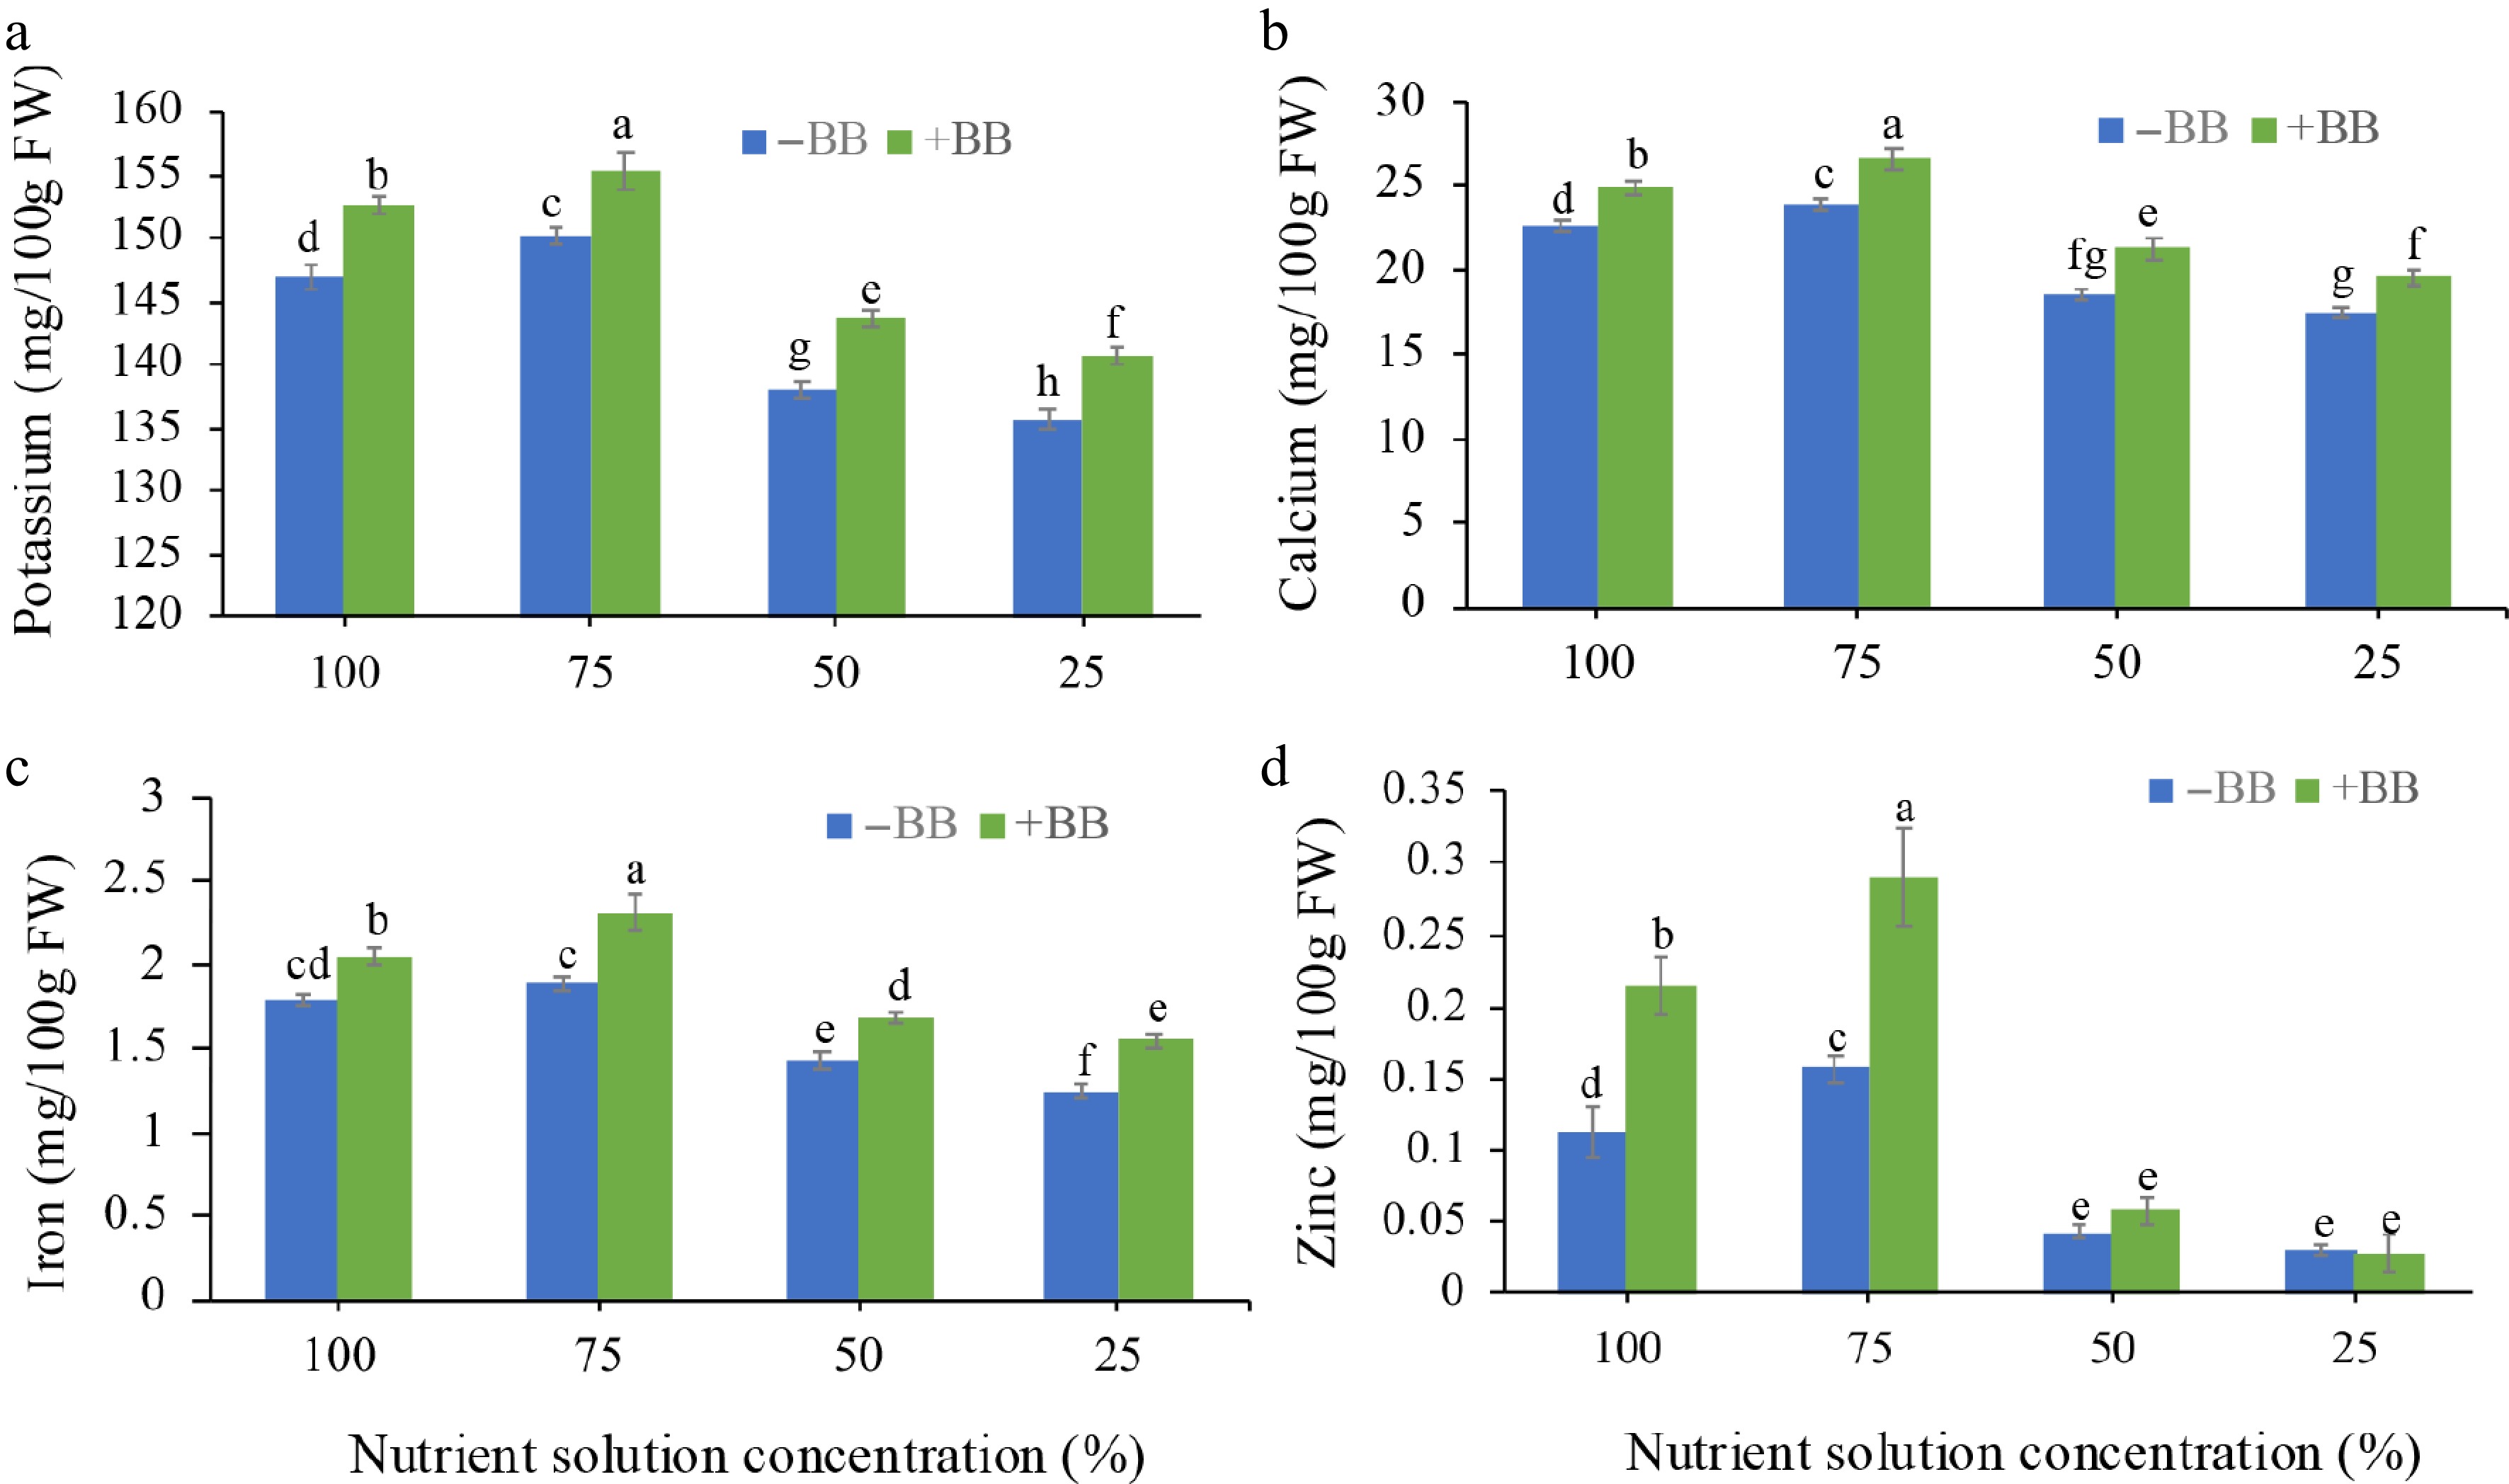
Figure 6.
Effects of B. bassiana minerals content of strawberry fruits at different nutrient concentrations. (a) Potassium, (b) calcium, (c) iron, and (d) zinc subjected to 100%, 75%, 50%, and 25% nutrient solution respectively. Only bars with different letters are significantly different (lsd, p < 0.05). −BB, plant treated without B. bassiana; +BB, plant treated with B. bassiana; FW, Fresh weight.
-
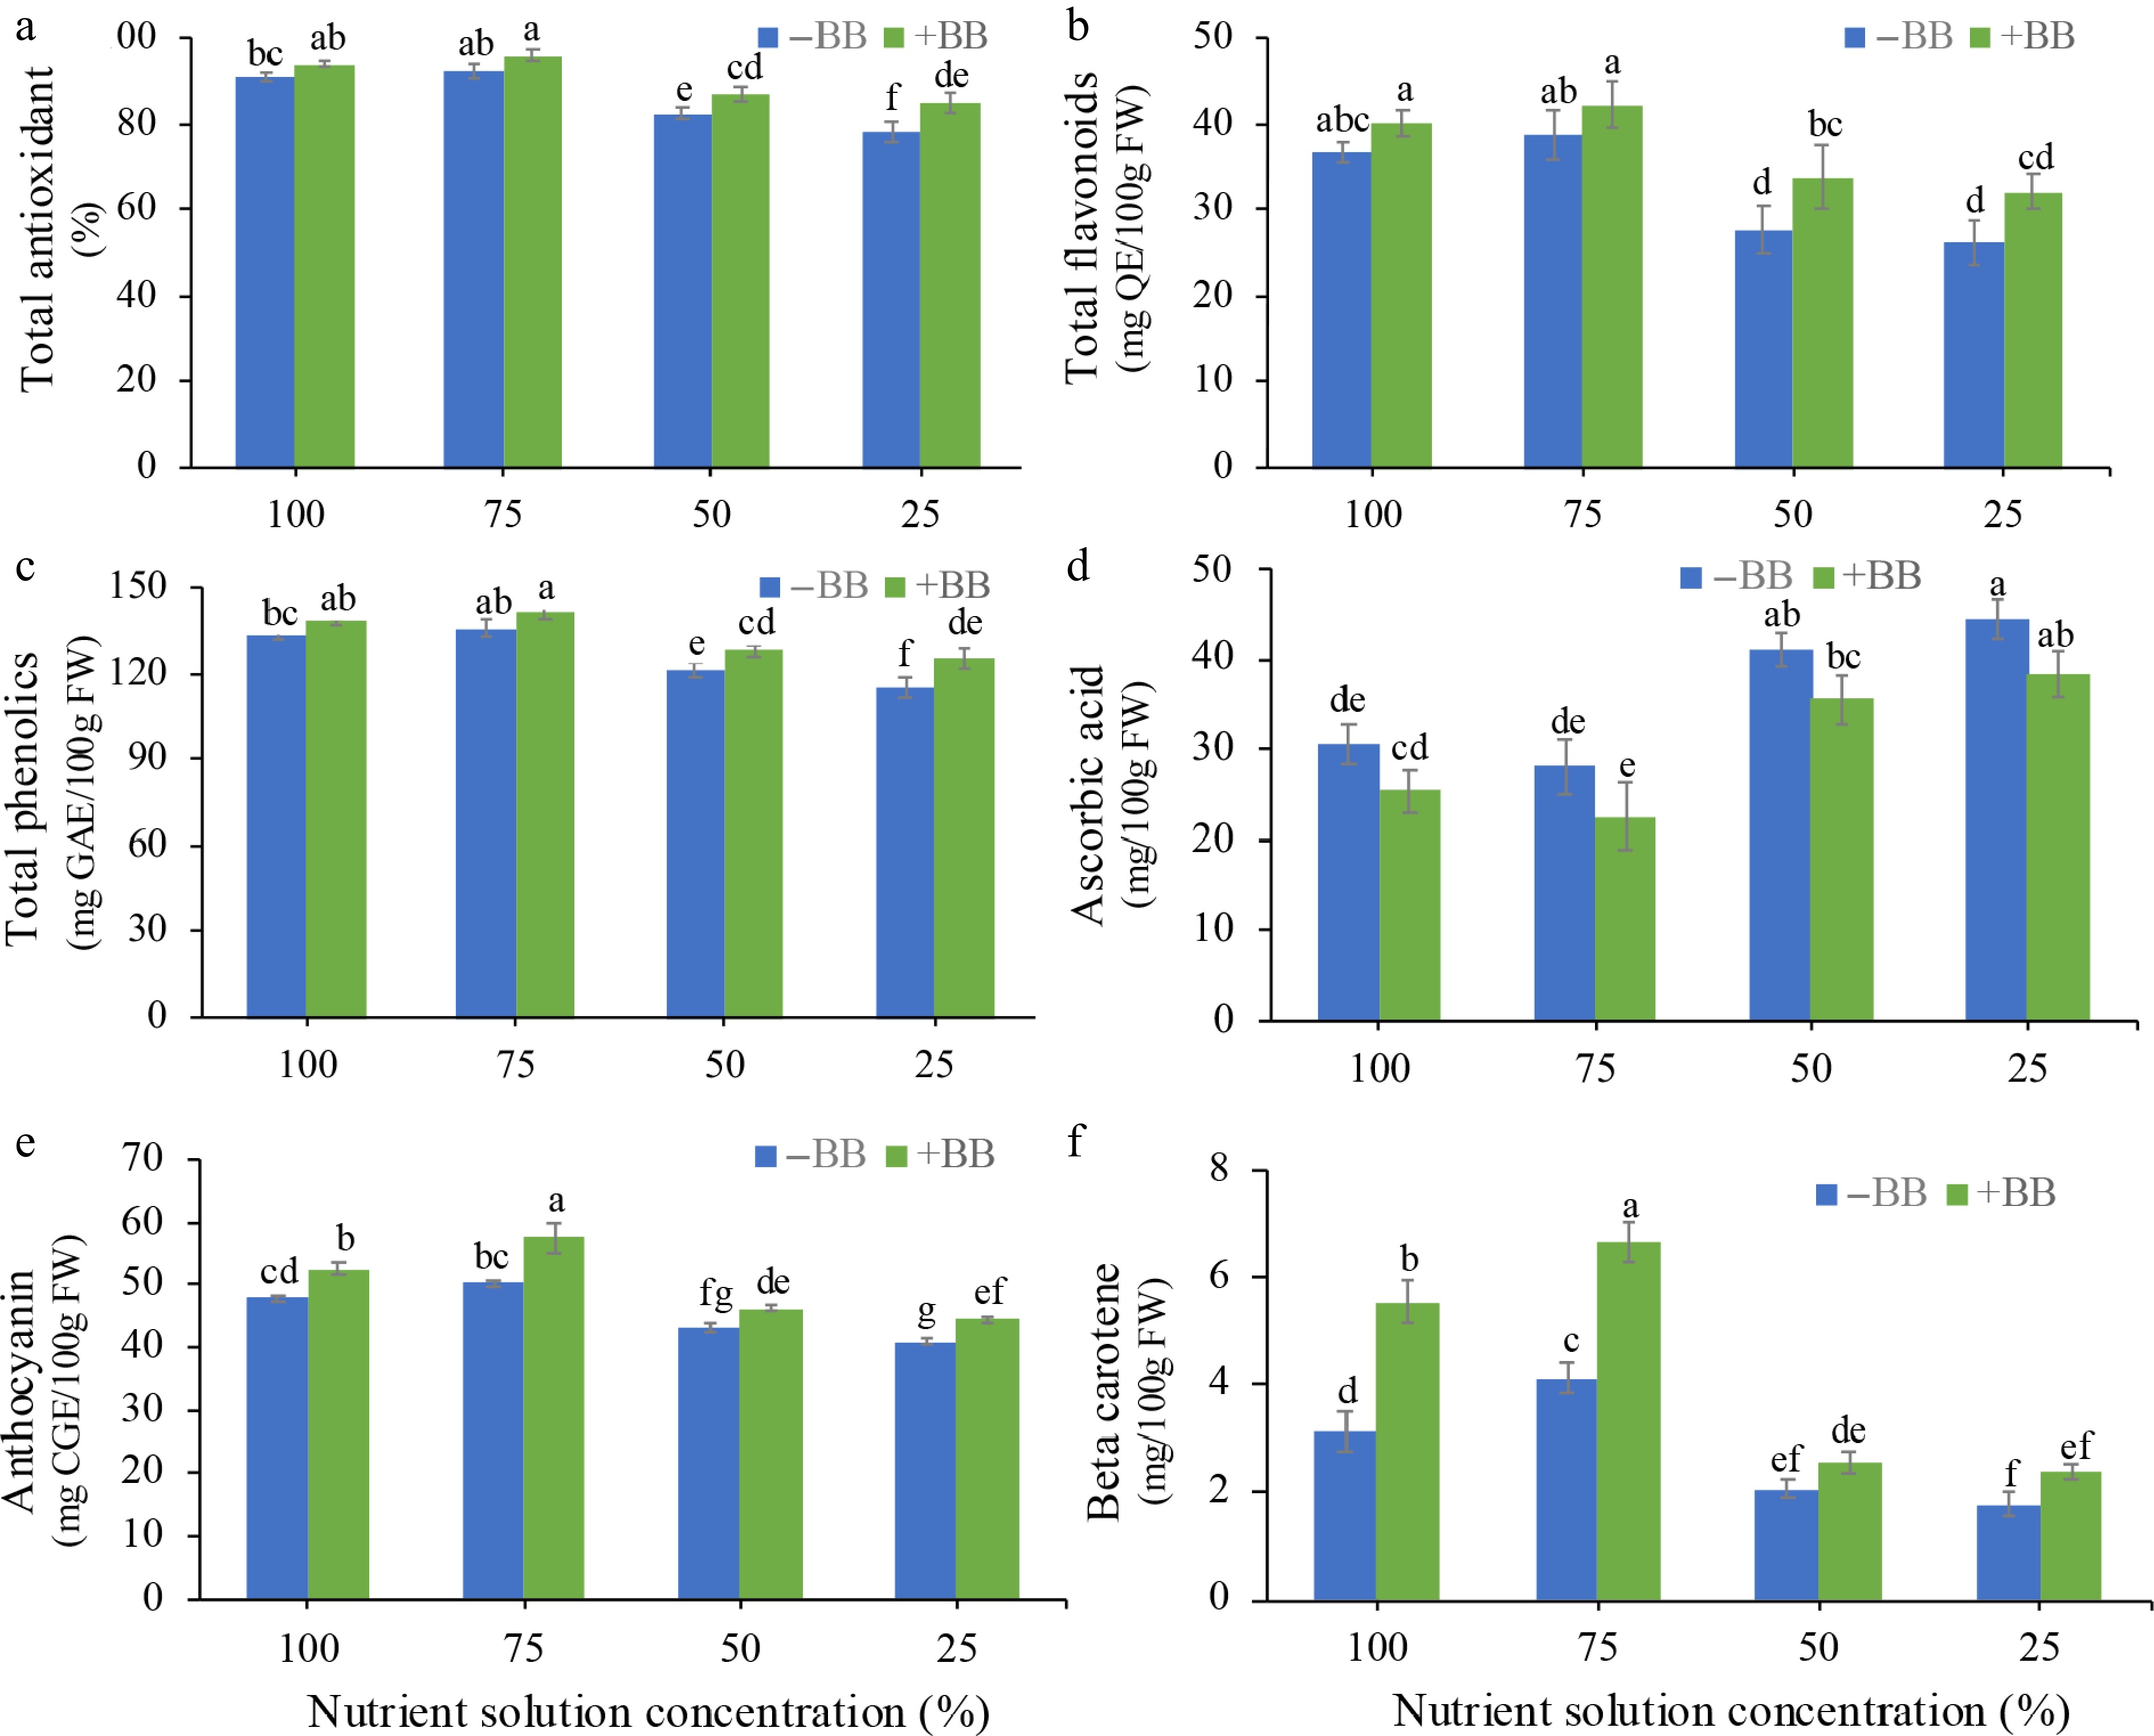
Figure 7.
Effects of B. bassiana phytochemical levels of strawberry fruits at different nutrient concentrations. (a) Total antioxidant, (b) total flavonoid content, (c) total phenolic content, (d) ascorbic acid, (e) anthocyanin, and (f) beta carotene subjected to 100%, 75%, 50%, and 25% nutrient solution respectively. Only bars with different letters are significantly different (lsd, p < 0.05). −BB, plant treated without B. bassiana; +BB, plant treated with B. bassiana; FW, Fresh weight; GAE, gallic acid equivalent; QE, quercetin equivalent; CGE, cyanidin-3-glucoside equivalent.
-
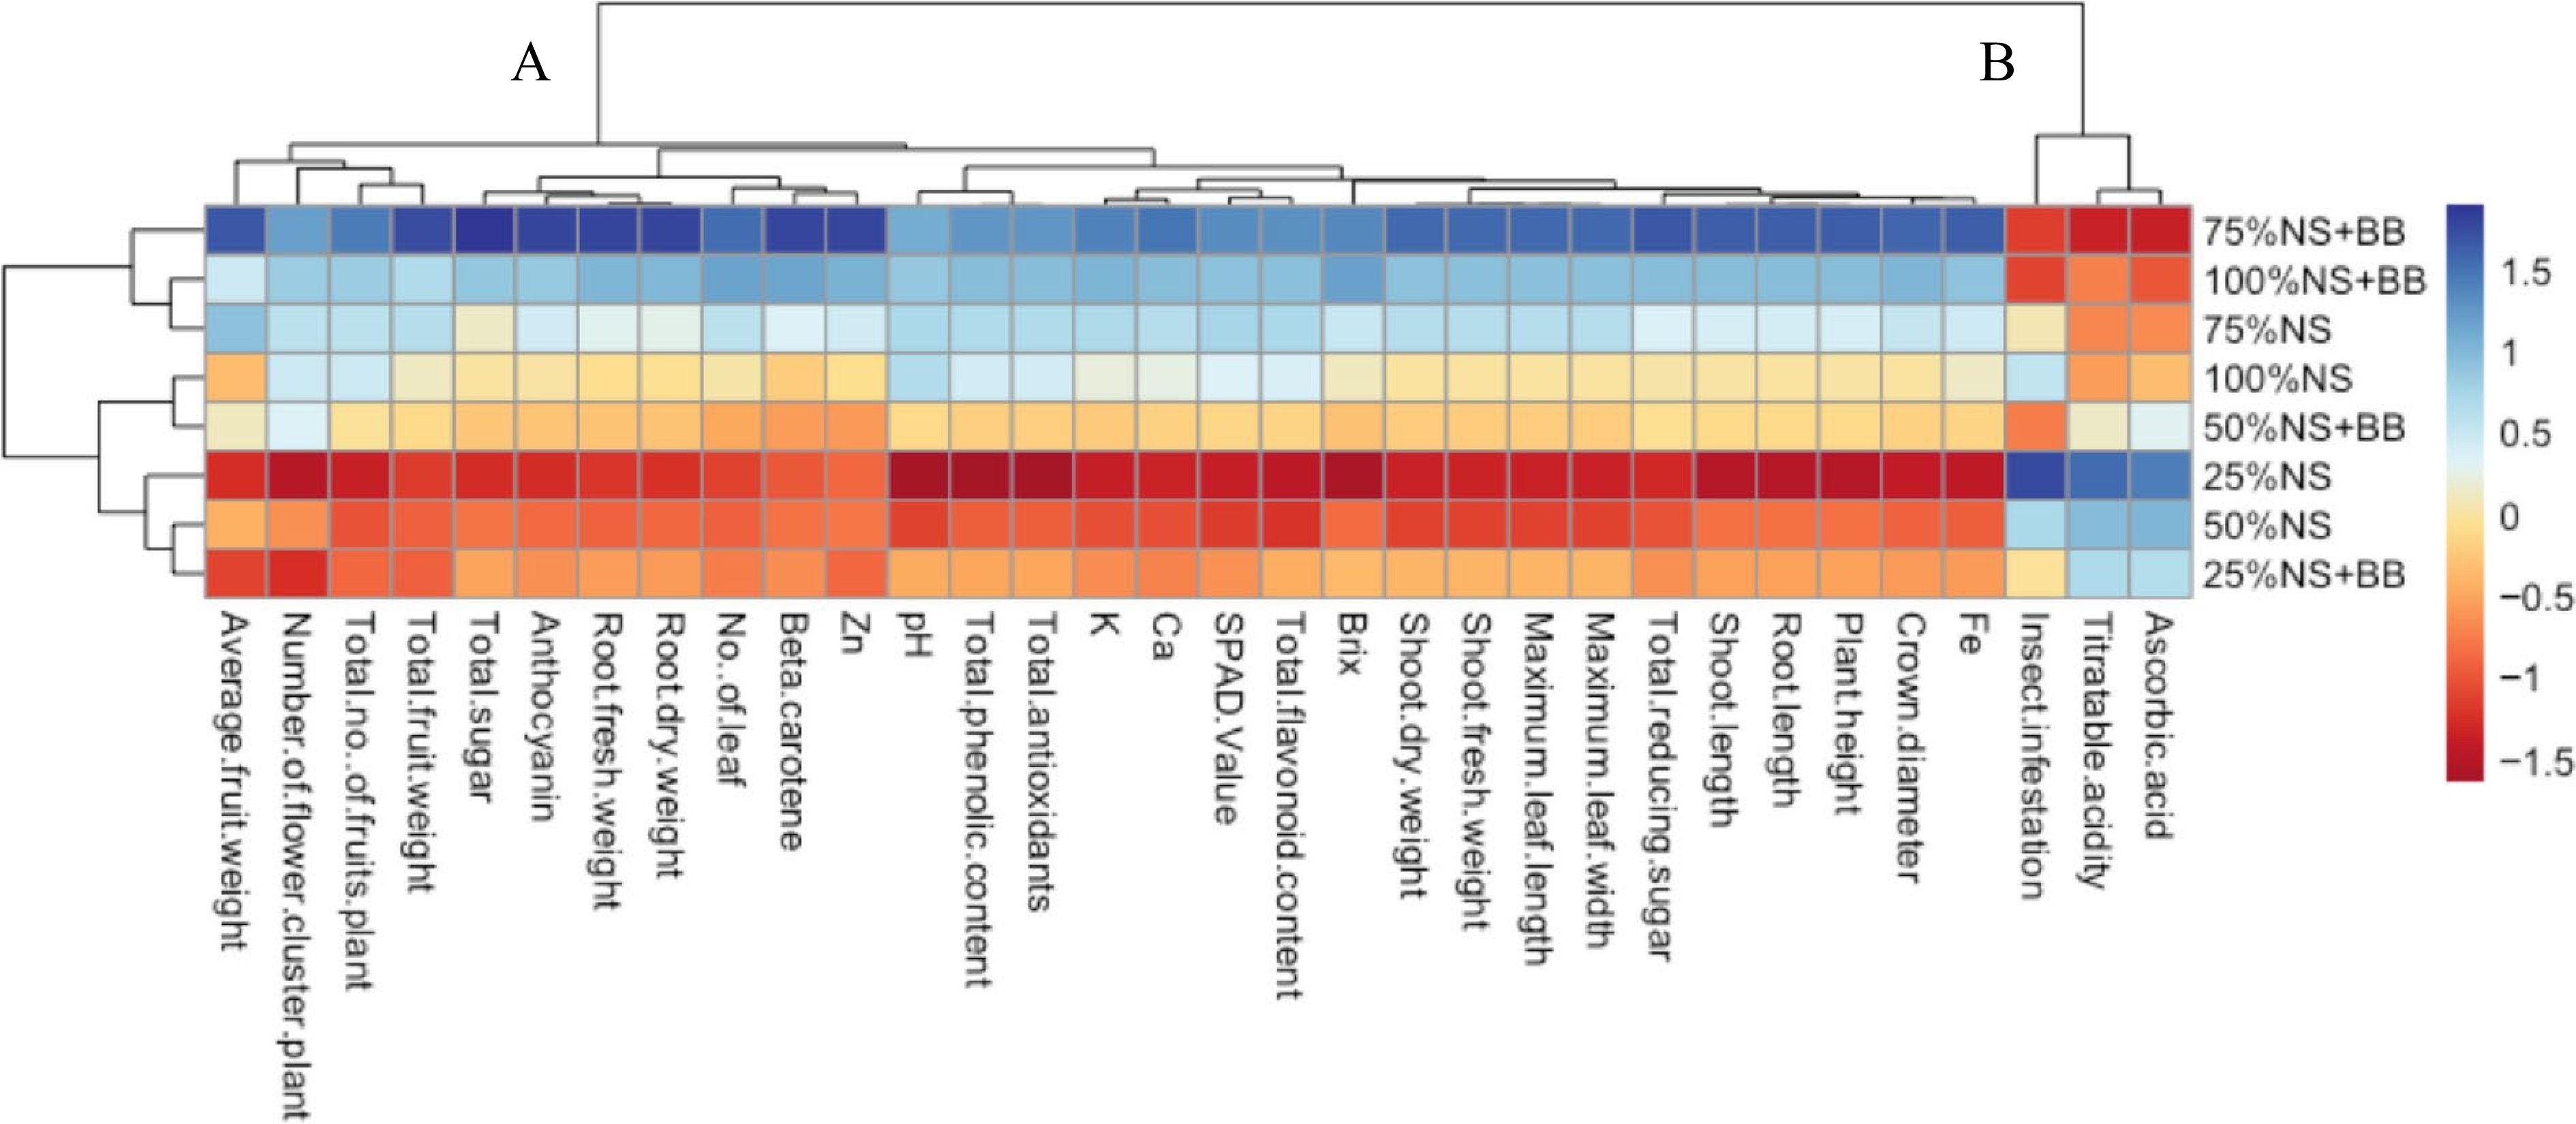
Figure 8.
Clustering heatmap visualizing treatments-variable interaction at a glance. Normalized mean values of different parameters were used to prepare the heatmap. The parameters were grouped into two (A and B) distinct clusters. The color scale indicates the relationship of the normalized mean values of different parameters with different treatments.
-
Nutrient solution concentration BB inoculation % root colonization 100% NS −BB Not detected +BB 45.83 ± 4.17a 75% NS −BB Not detected +BB 58.34 ± 4.81ab 50% NS −BB Not detected +BB 41.67 ± 4.81b 25% NS −BB Not detected +BB 37.50 ± 4.17b Means ± SEMs with the same letter are not significantly different (lsd, p < 0.05). NS, nutrient solution; −BB, plant treated without B. bassiana; +BB, plant treated with B. bassiana. Table 1.
Strawberry root colonization percentage by B. bassiana.
Figures
(8)
Tables
(1)