-
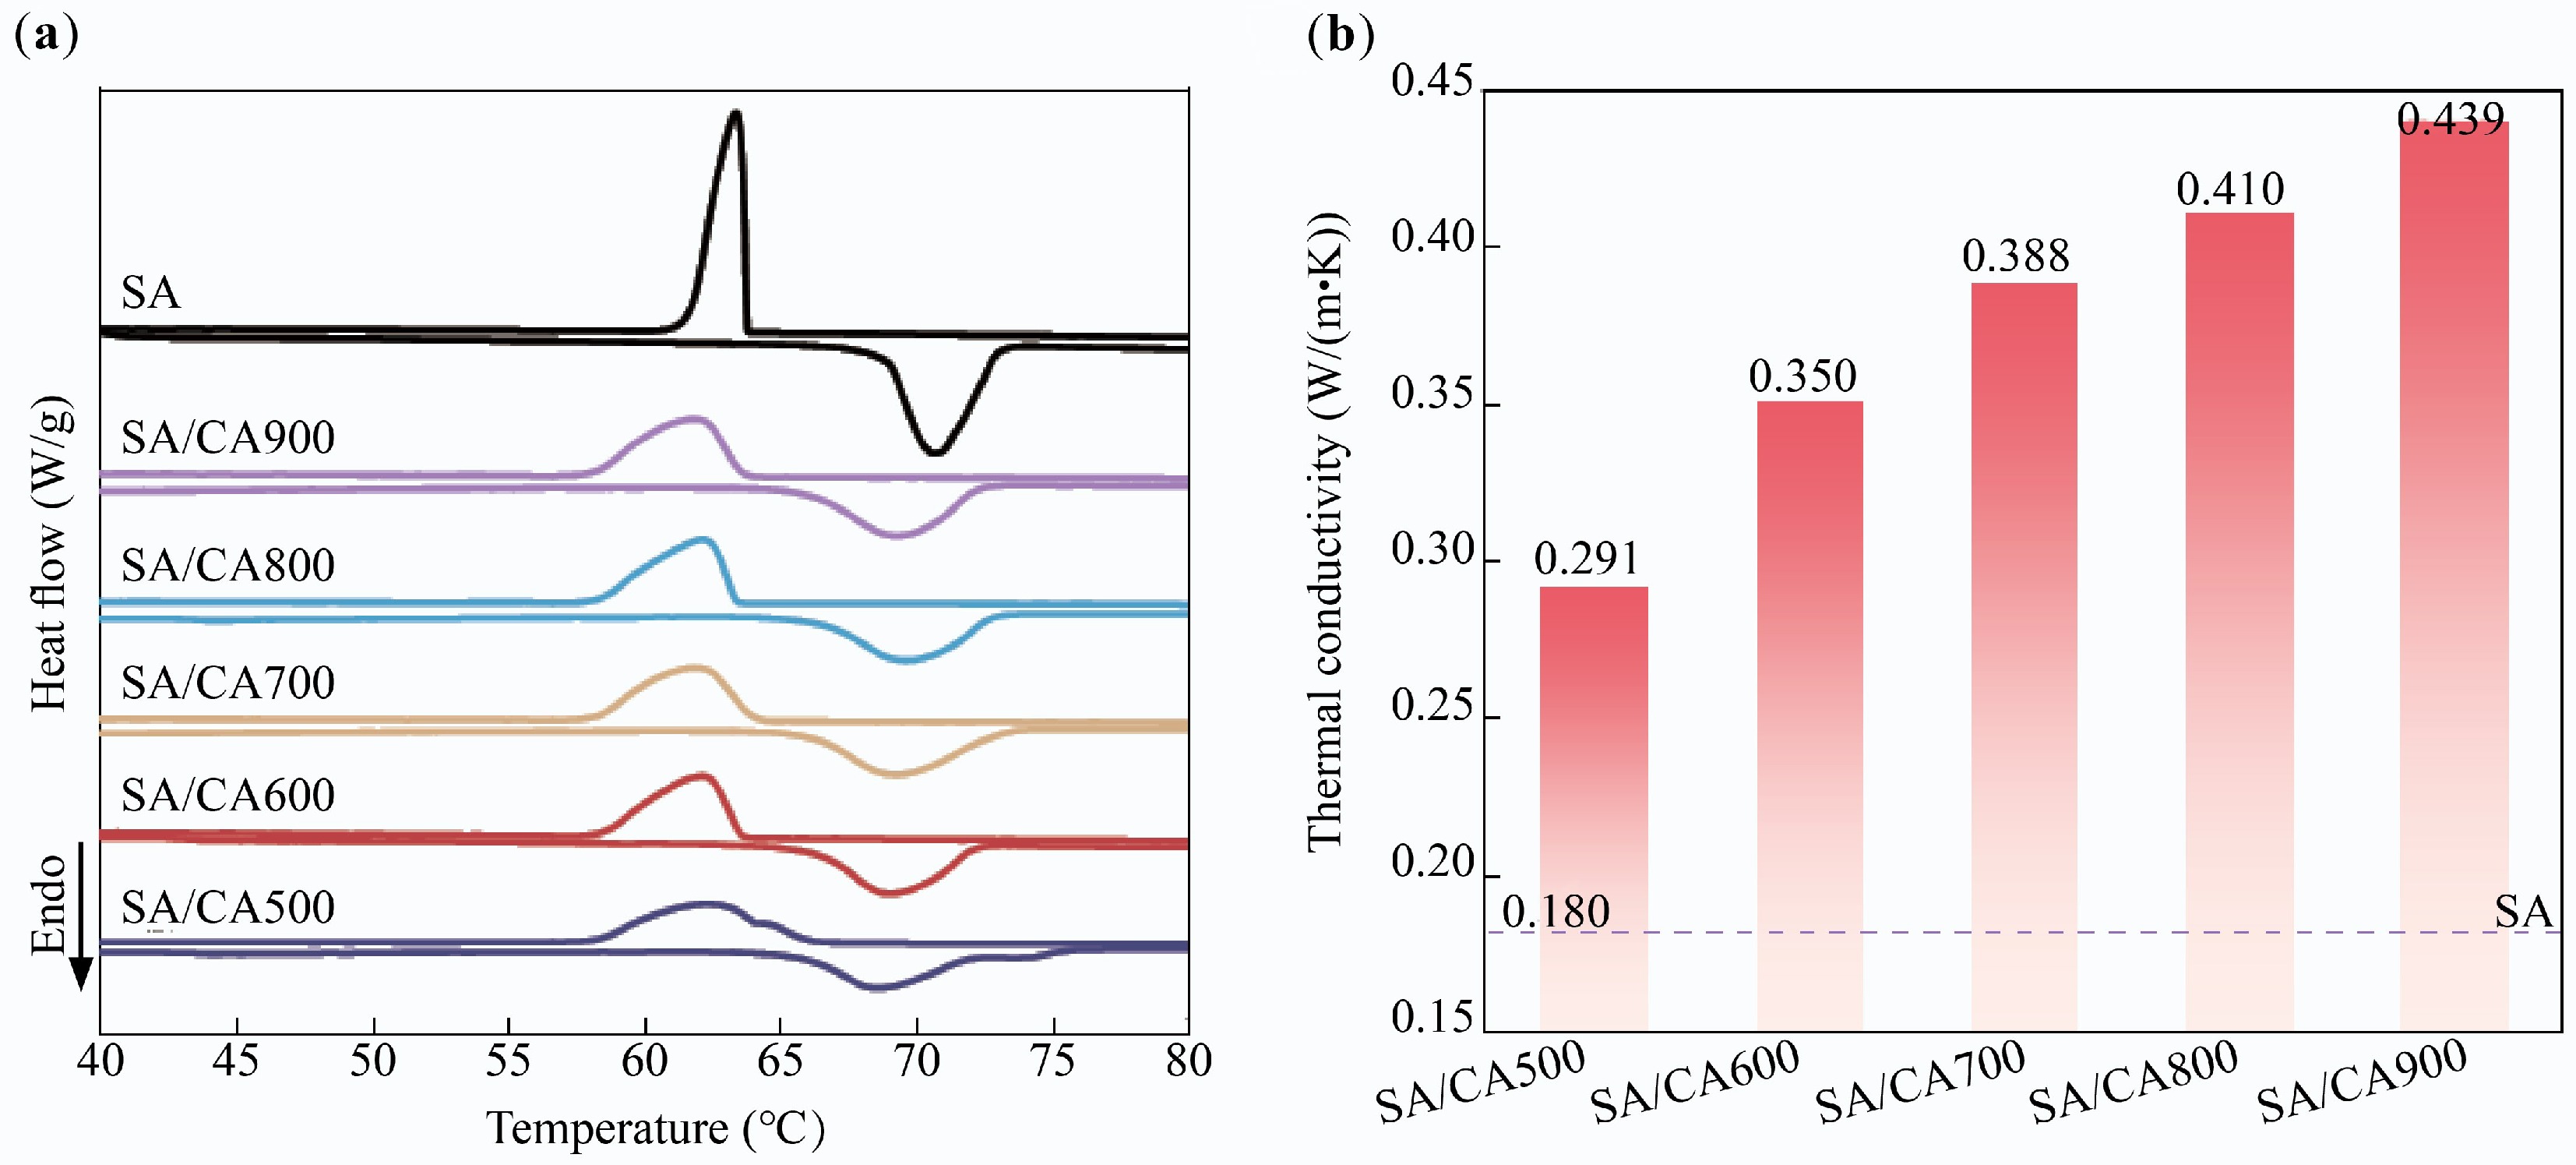
Figure 1.
(a) DSC curves, and (b) thermal conductivity of SA/CAX.
-
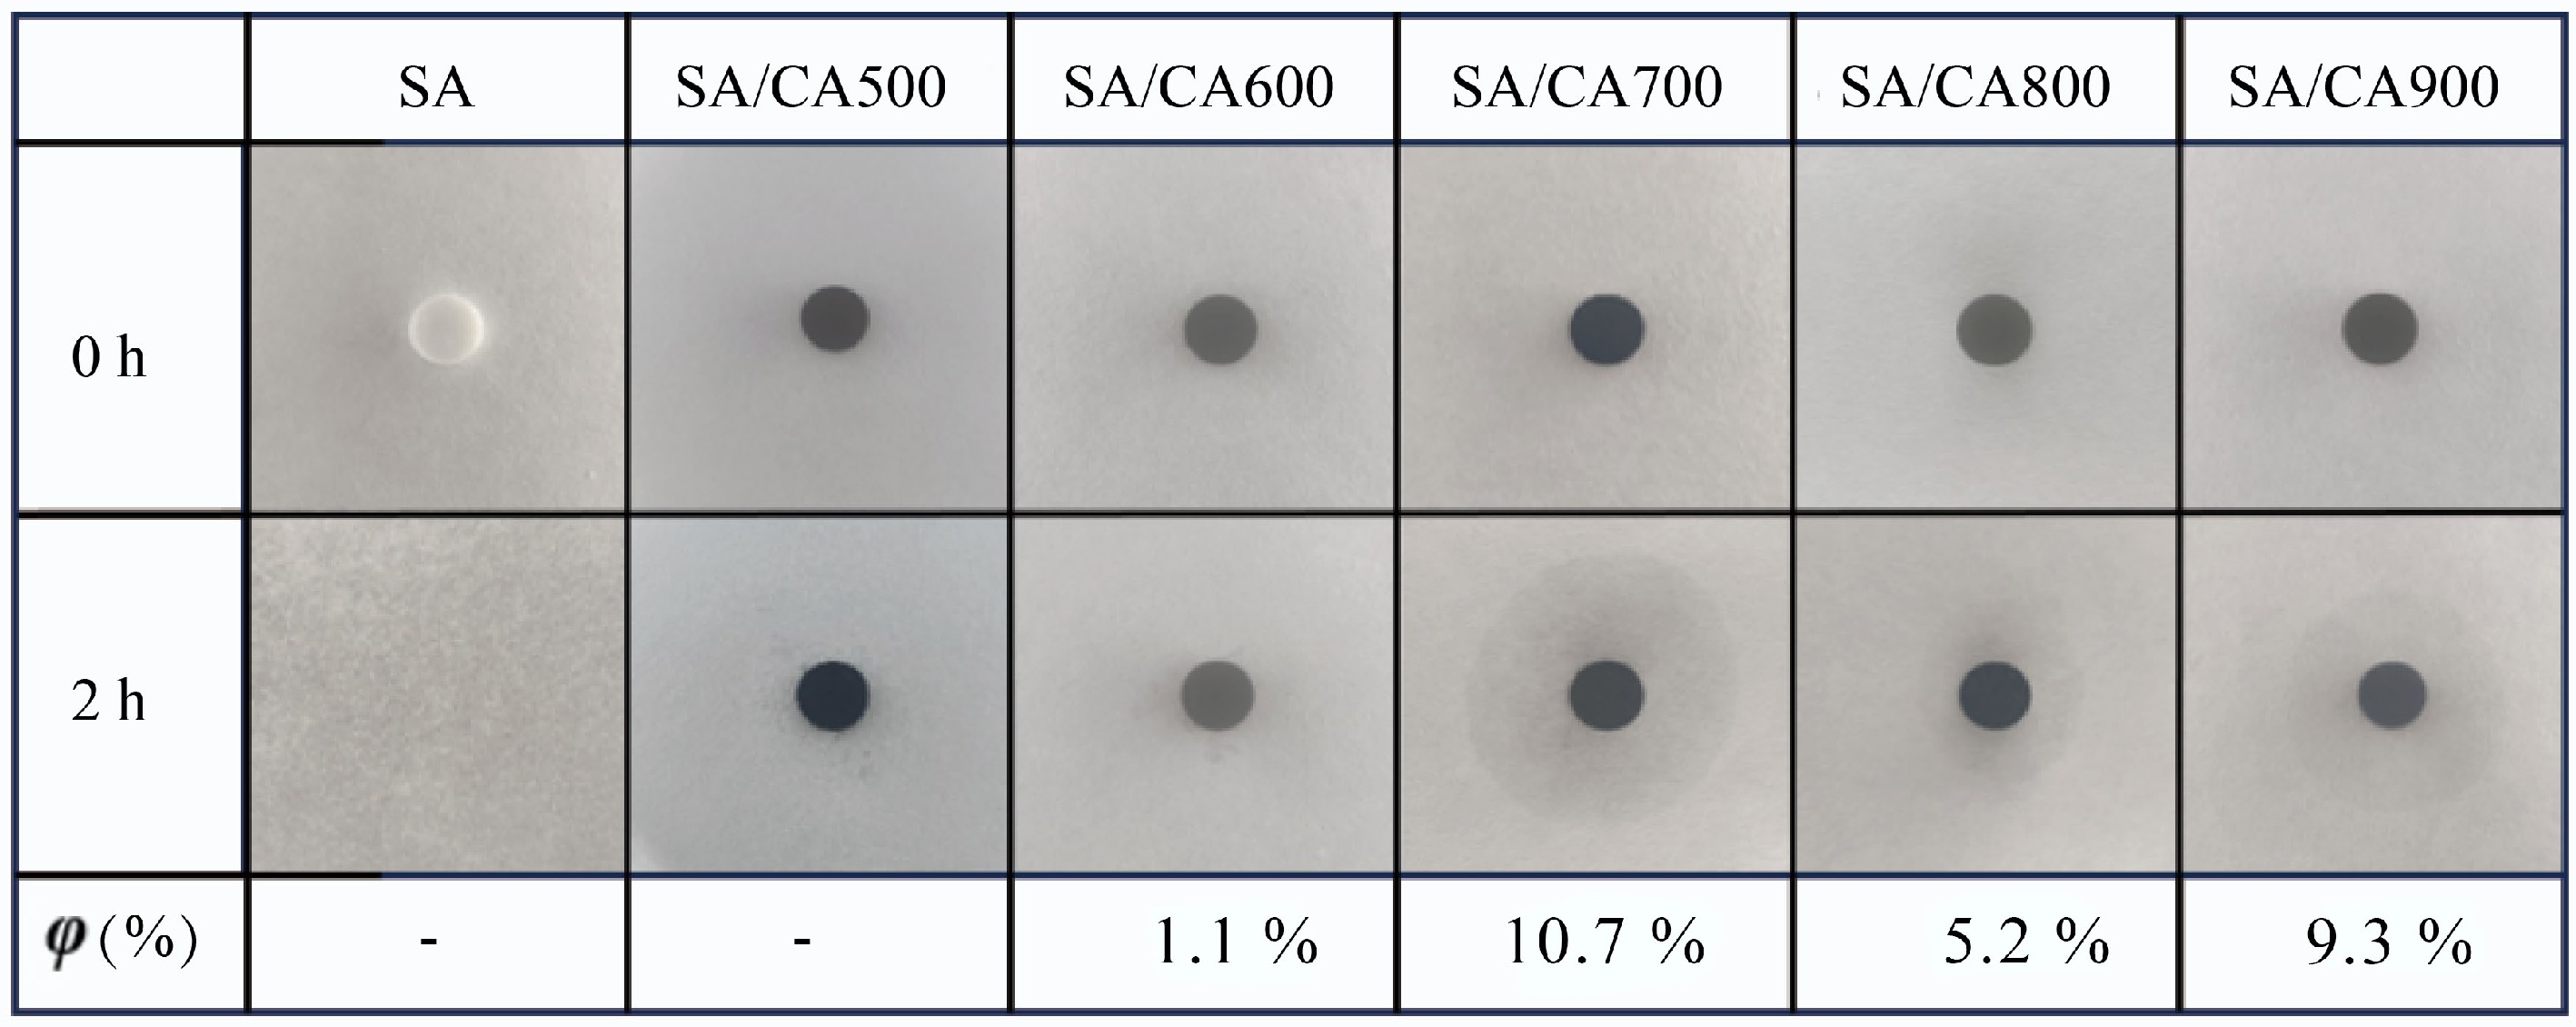
Figure 2.
Shape stability of SA and SA/CAX.
-
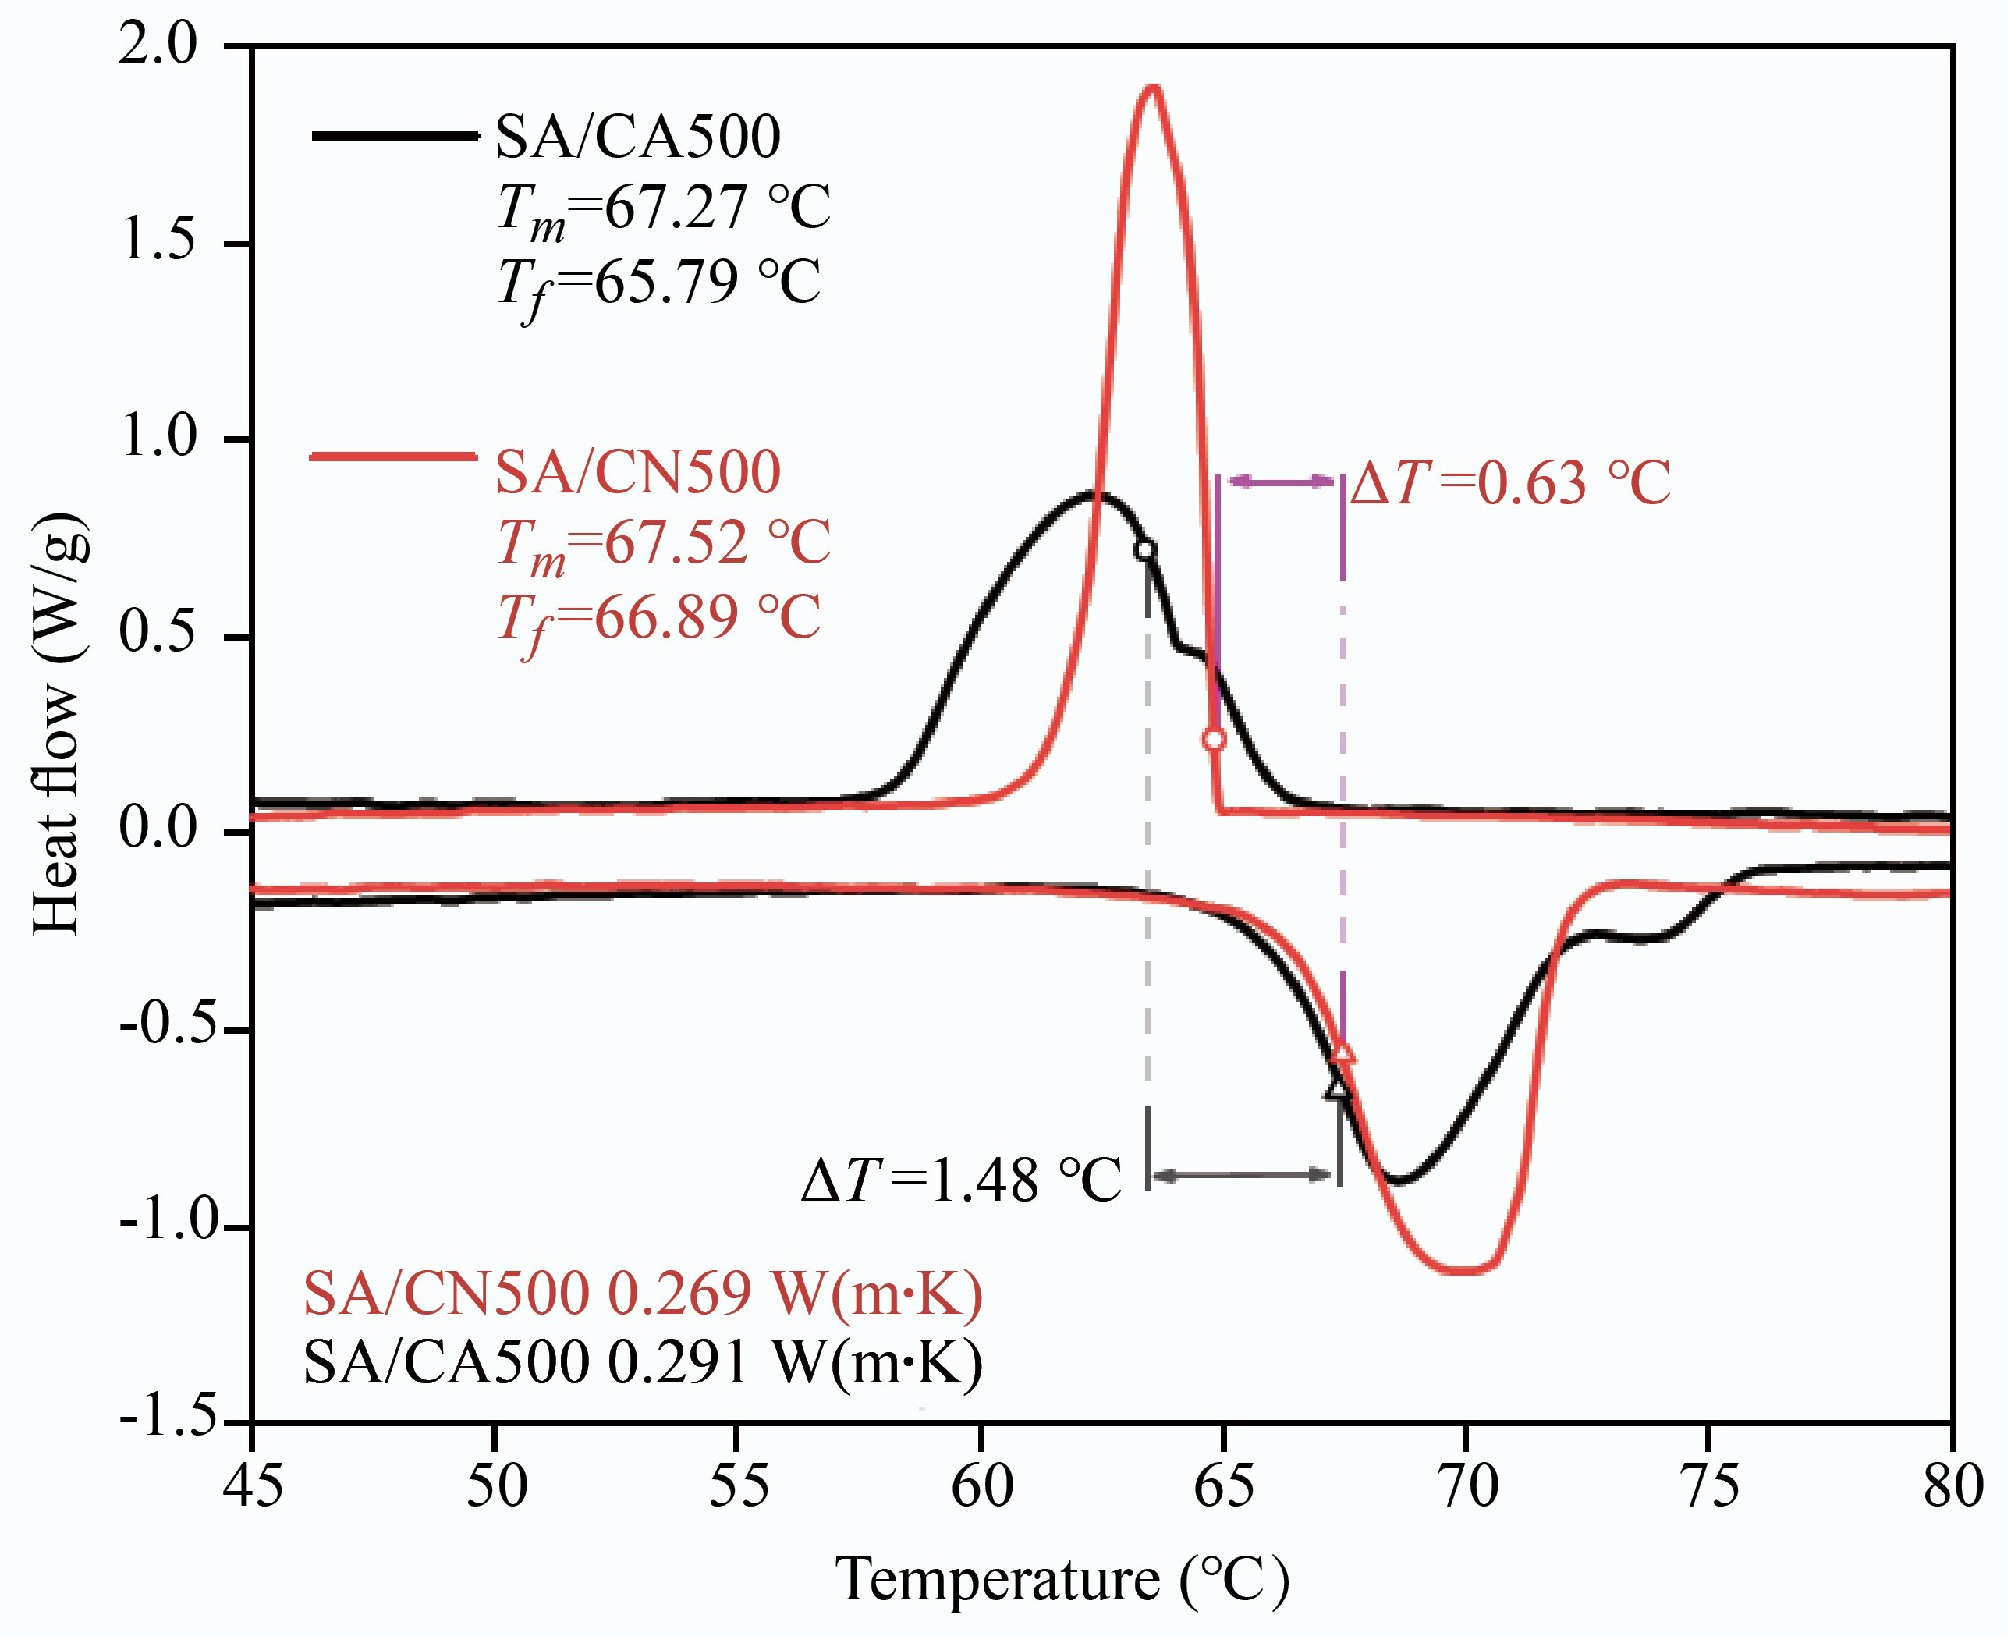
Figure 3.
DSC curves and thermal conductivity of SA/CN500 and SA/CA500.
-
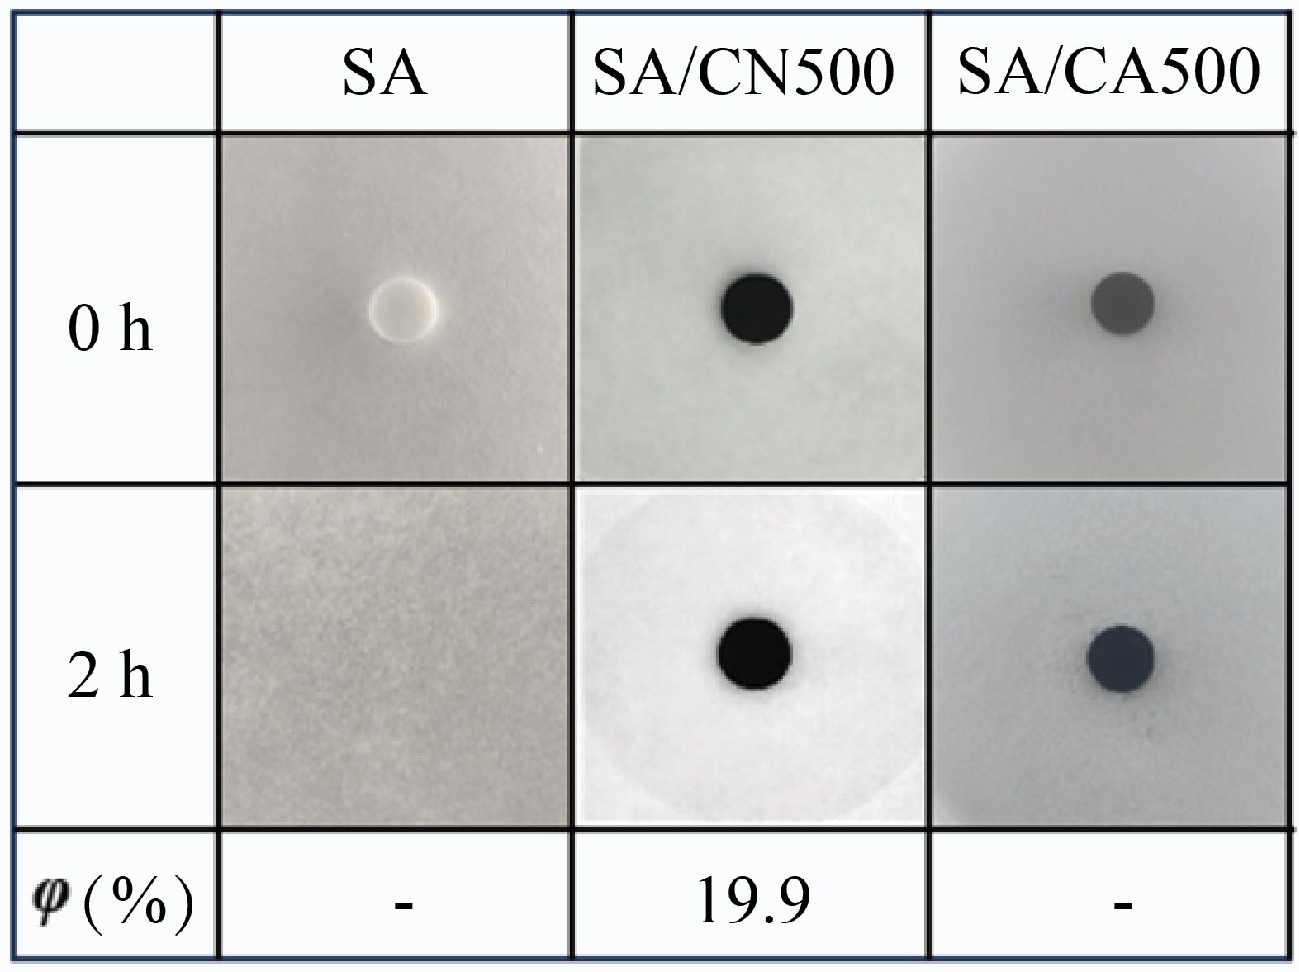
Figure 4.
Shape stability of SA/CN500 and SA/CA500.
-
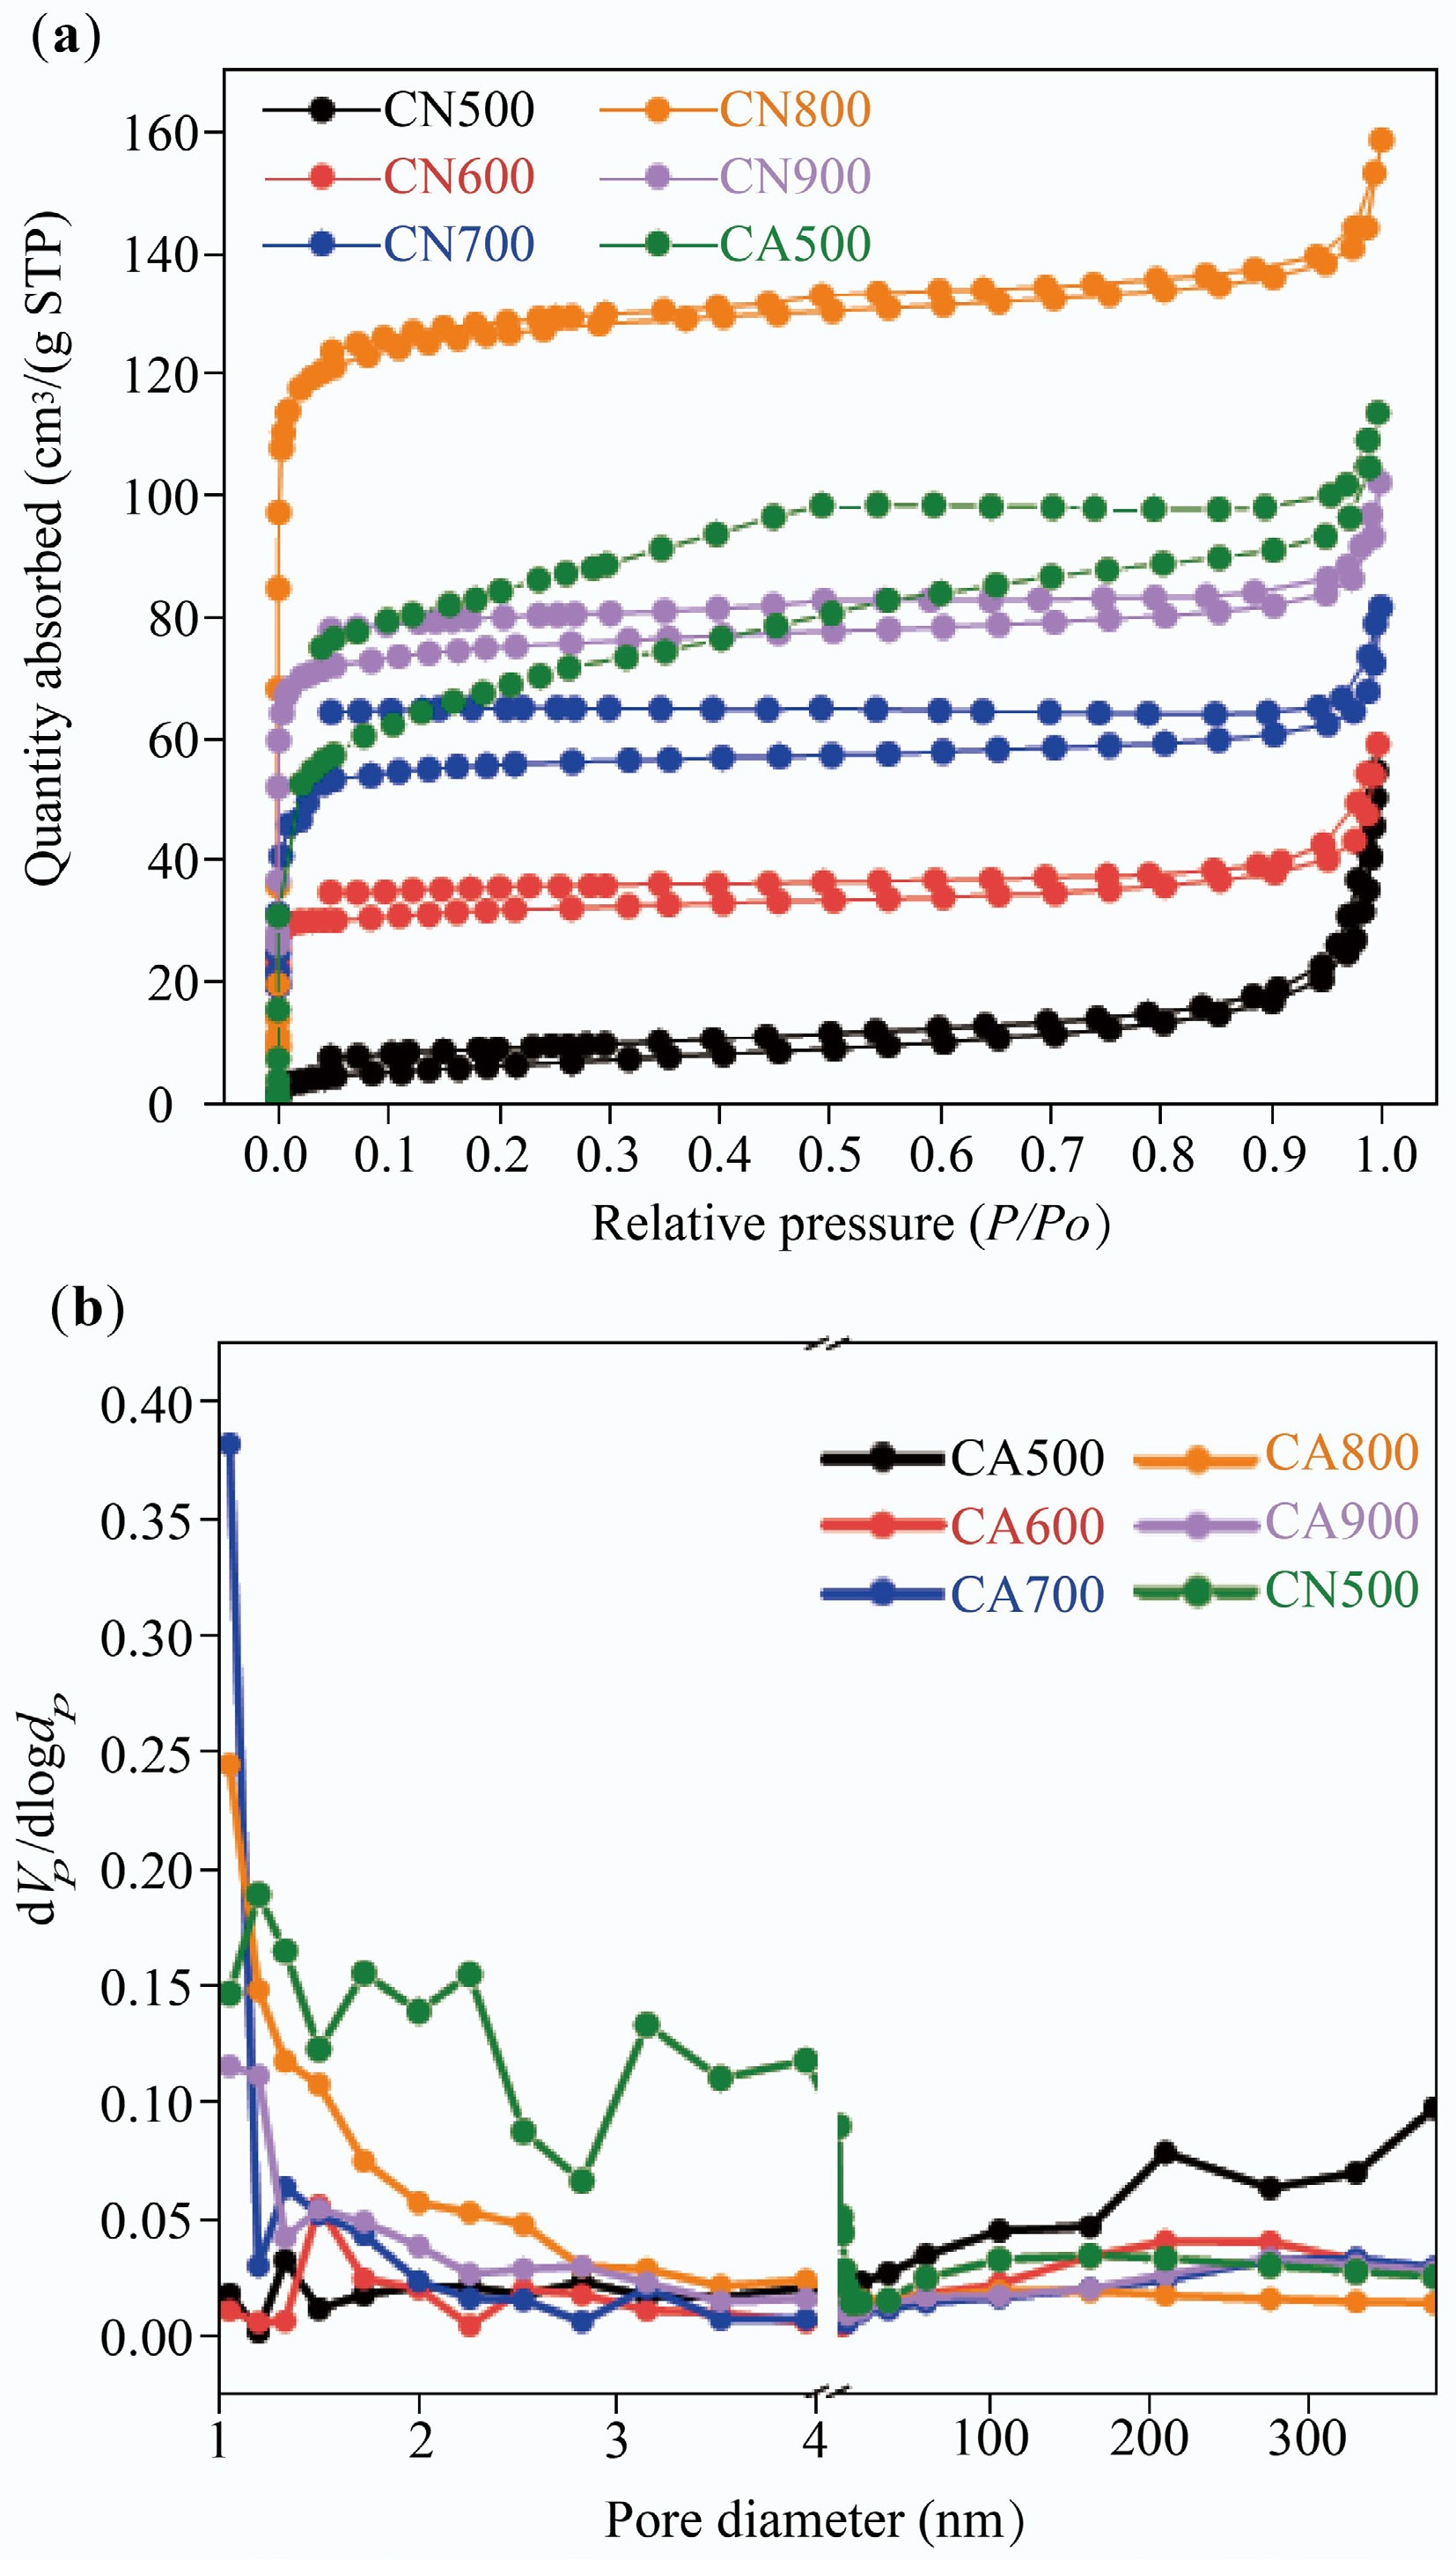
Figure 5.
(a) N2 absorption-desorption isotherm, and (b) pore diameter distribution of CAX.
-
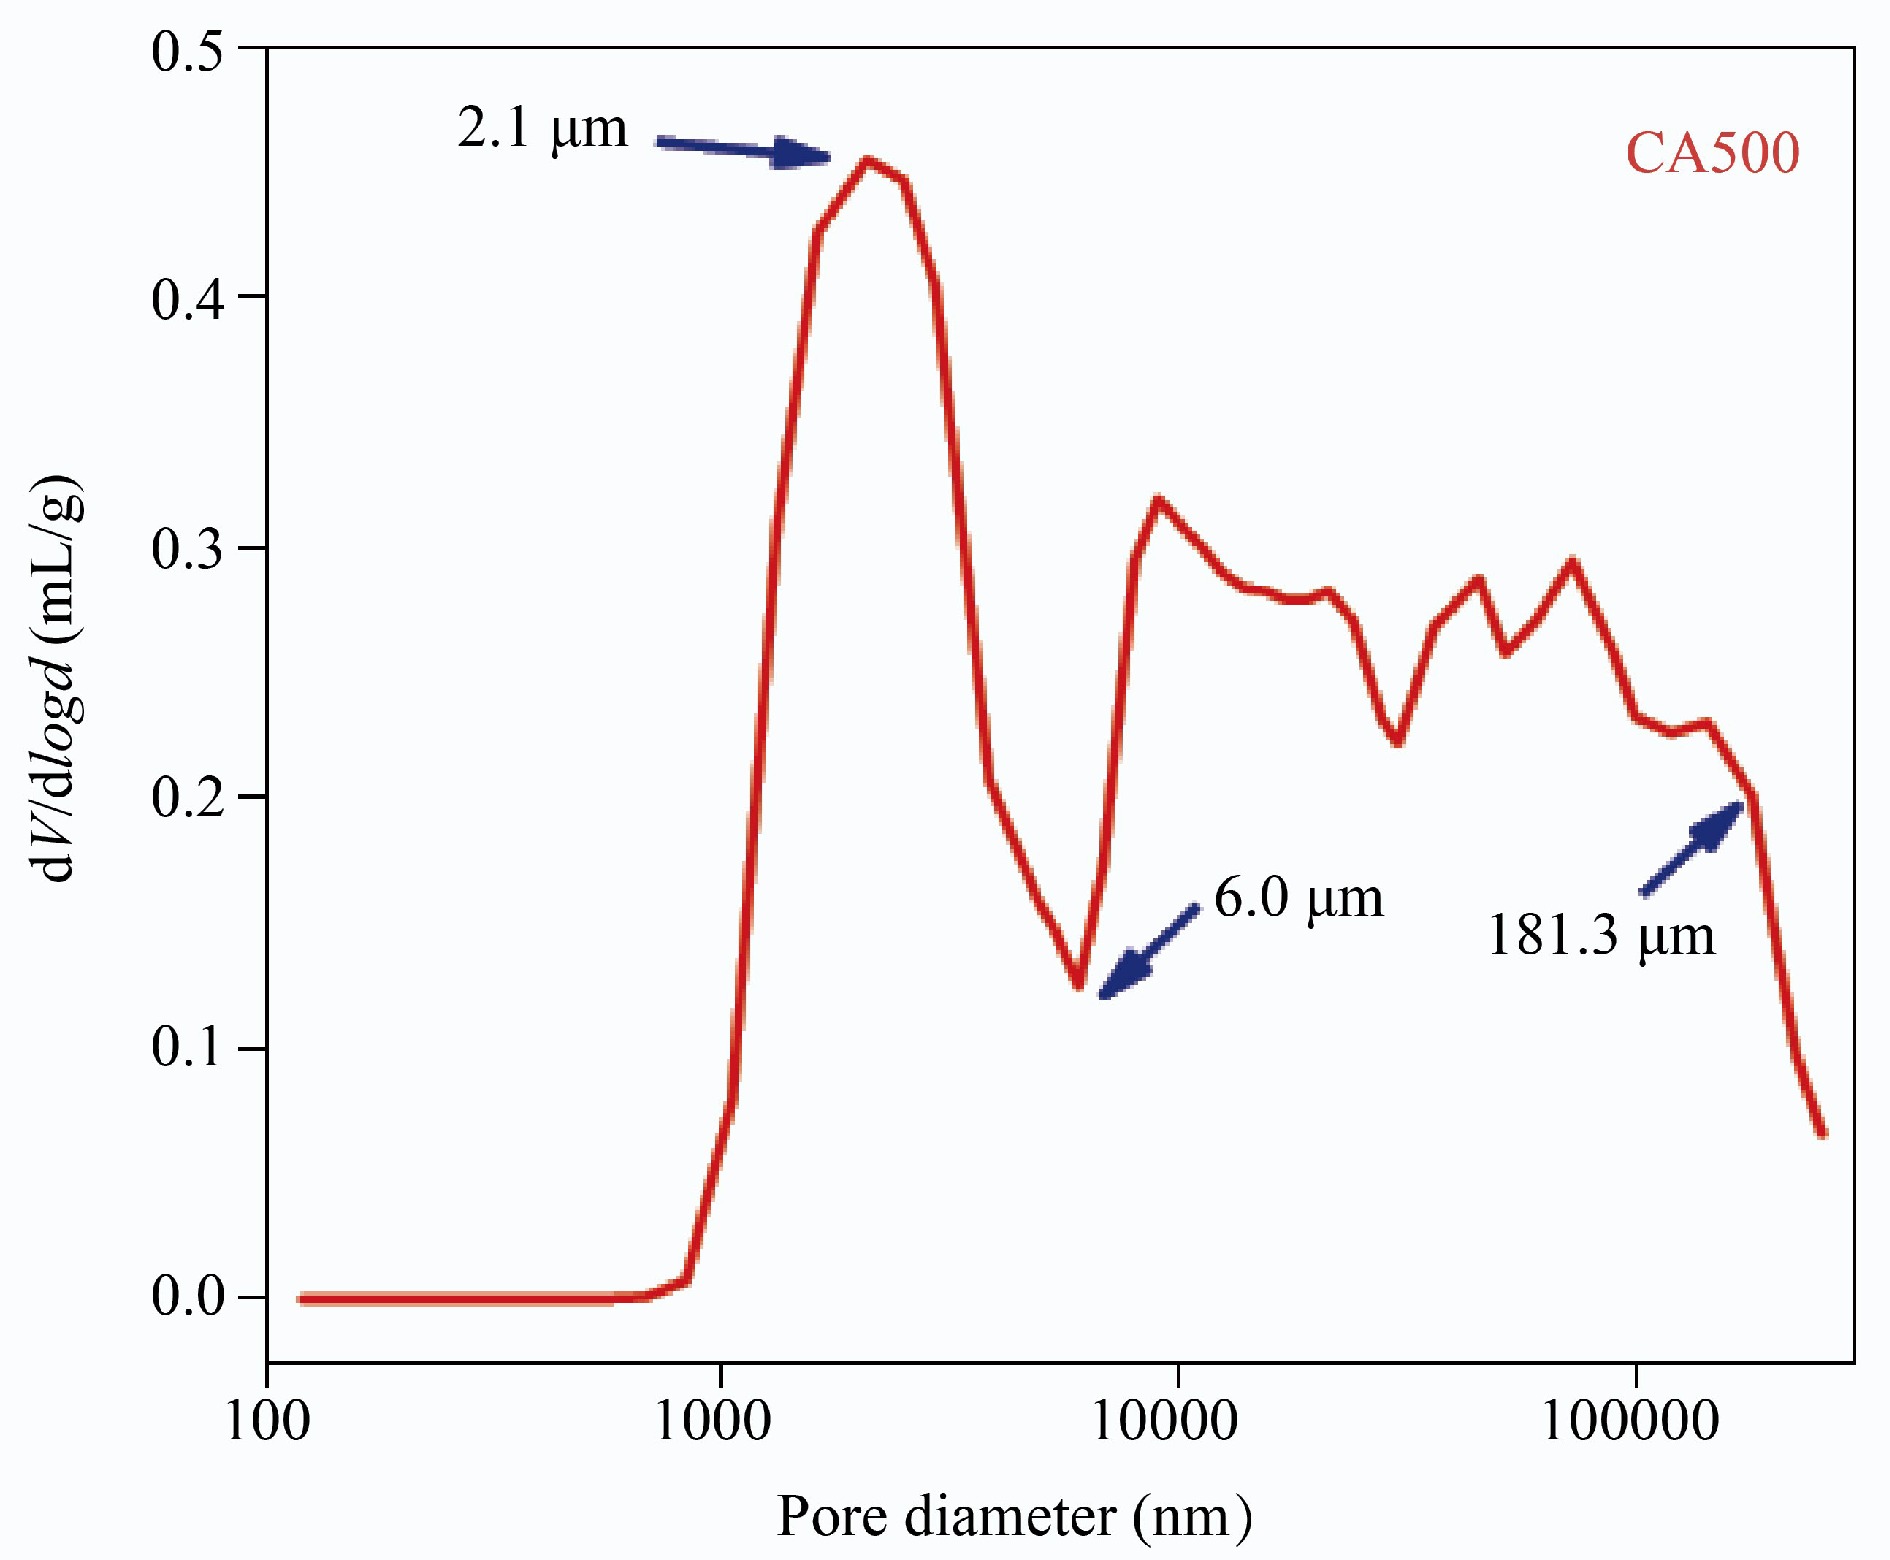
Figure 6.
Pore diameter distribution measurement of CA500 in the range of 0.1 to 350 μm.
-
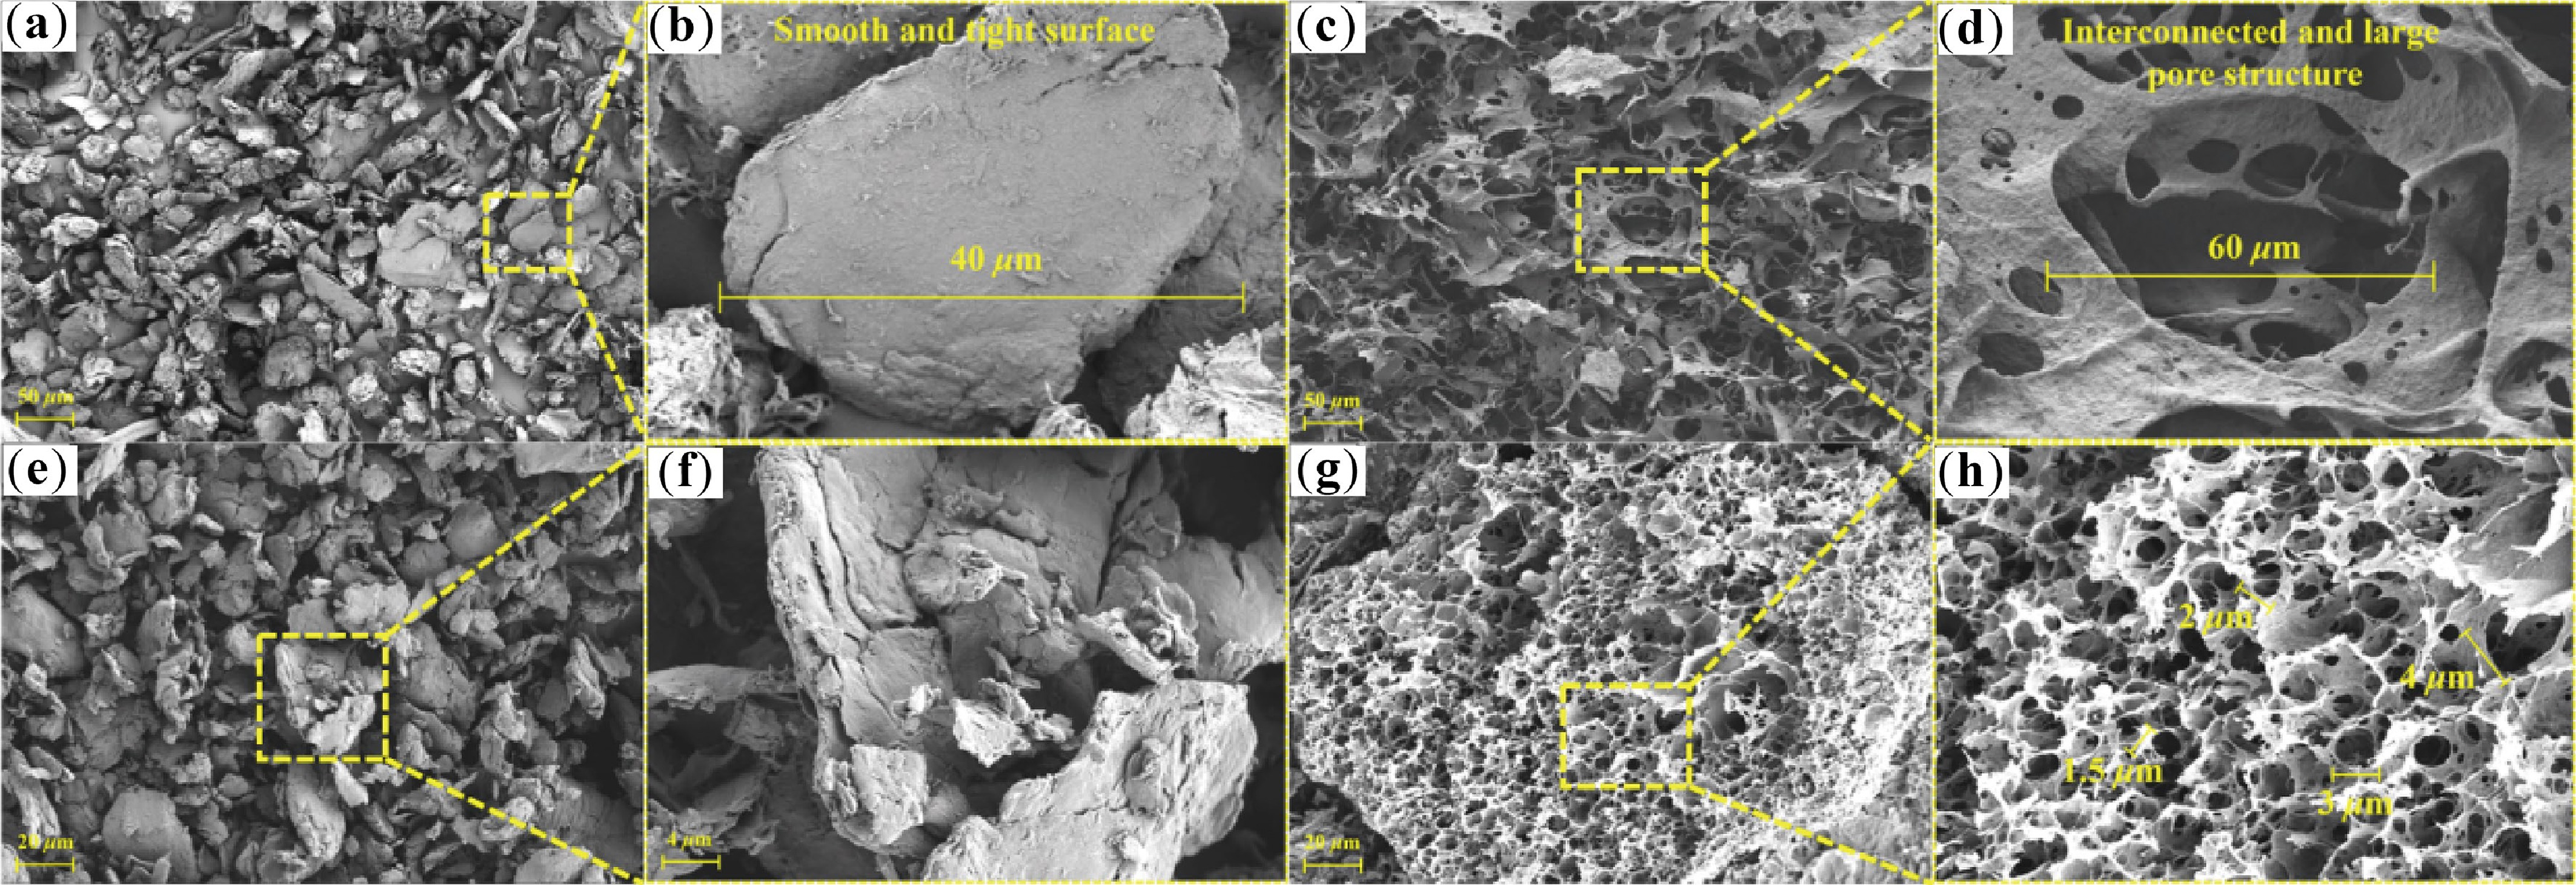
Figure 7.
(a), (b) SEM images of chitin, (c), (d) chitin aerogel, (e), (f) CN500, and (g), (h) CA500.
-
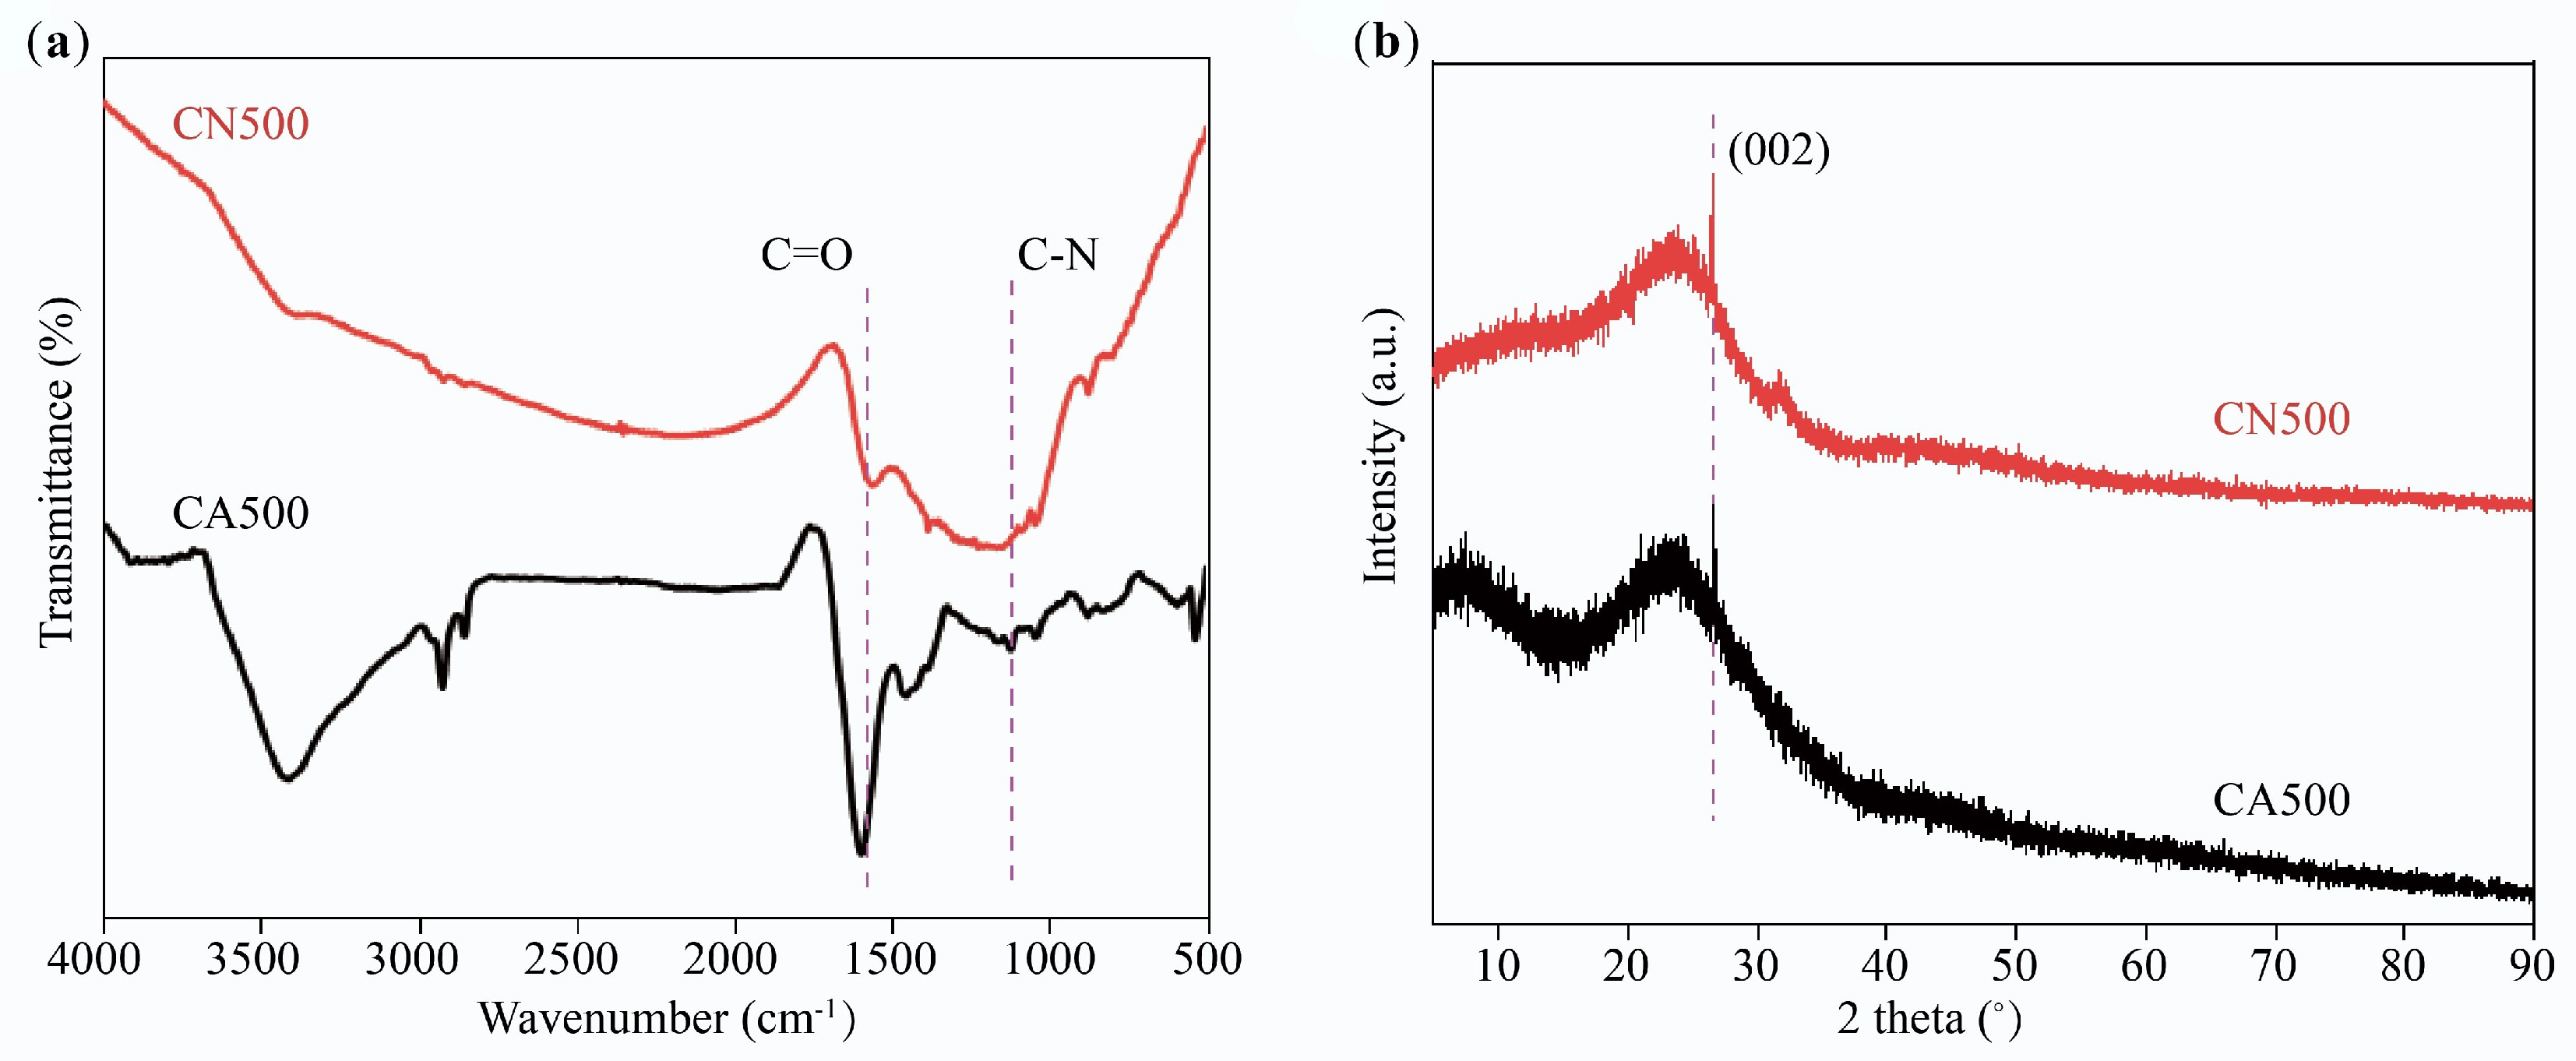
Figure 8.
(a) FTIR spectra, and (b) XRD patterns of CN500 and CA500.
-
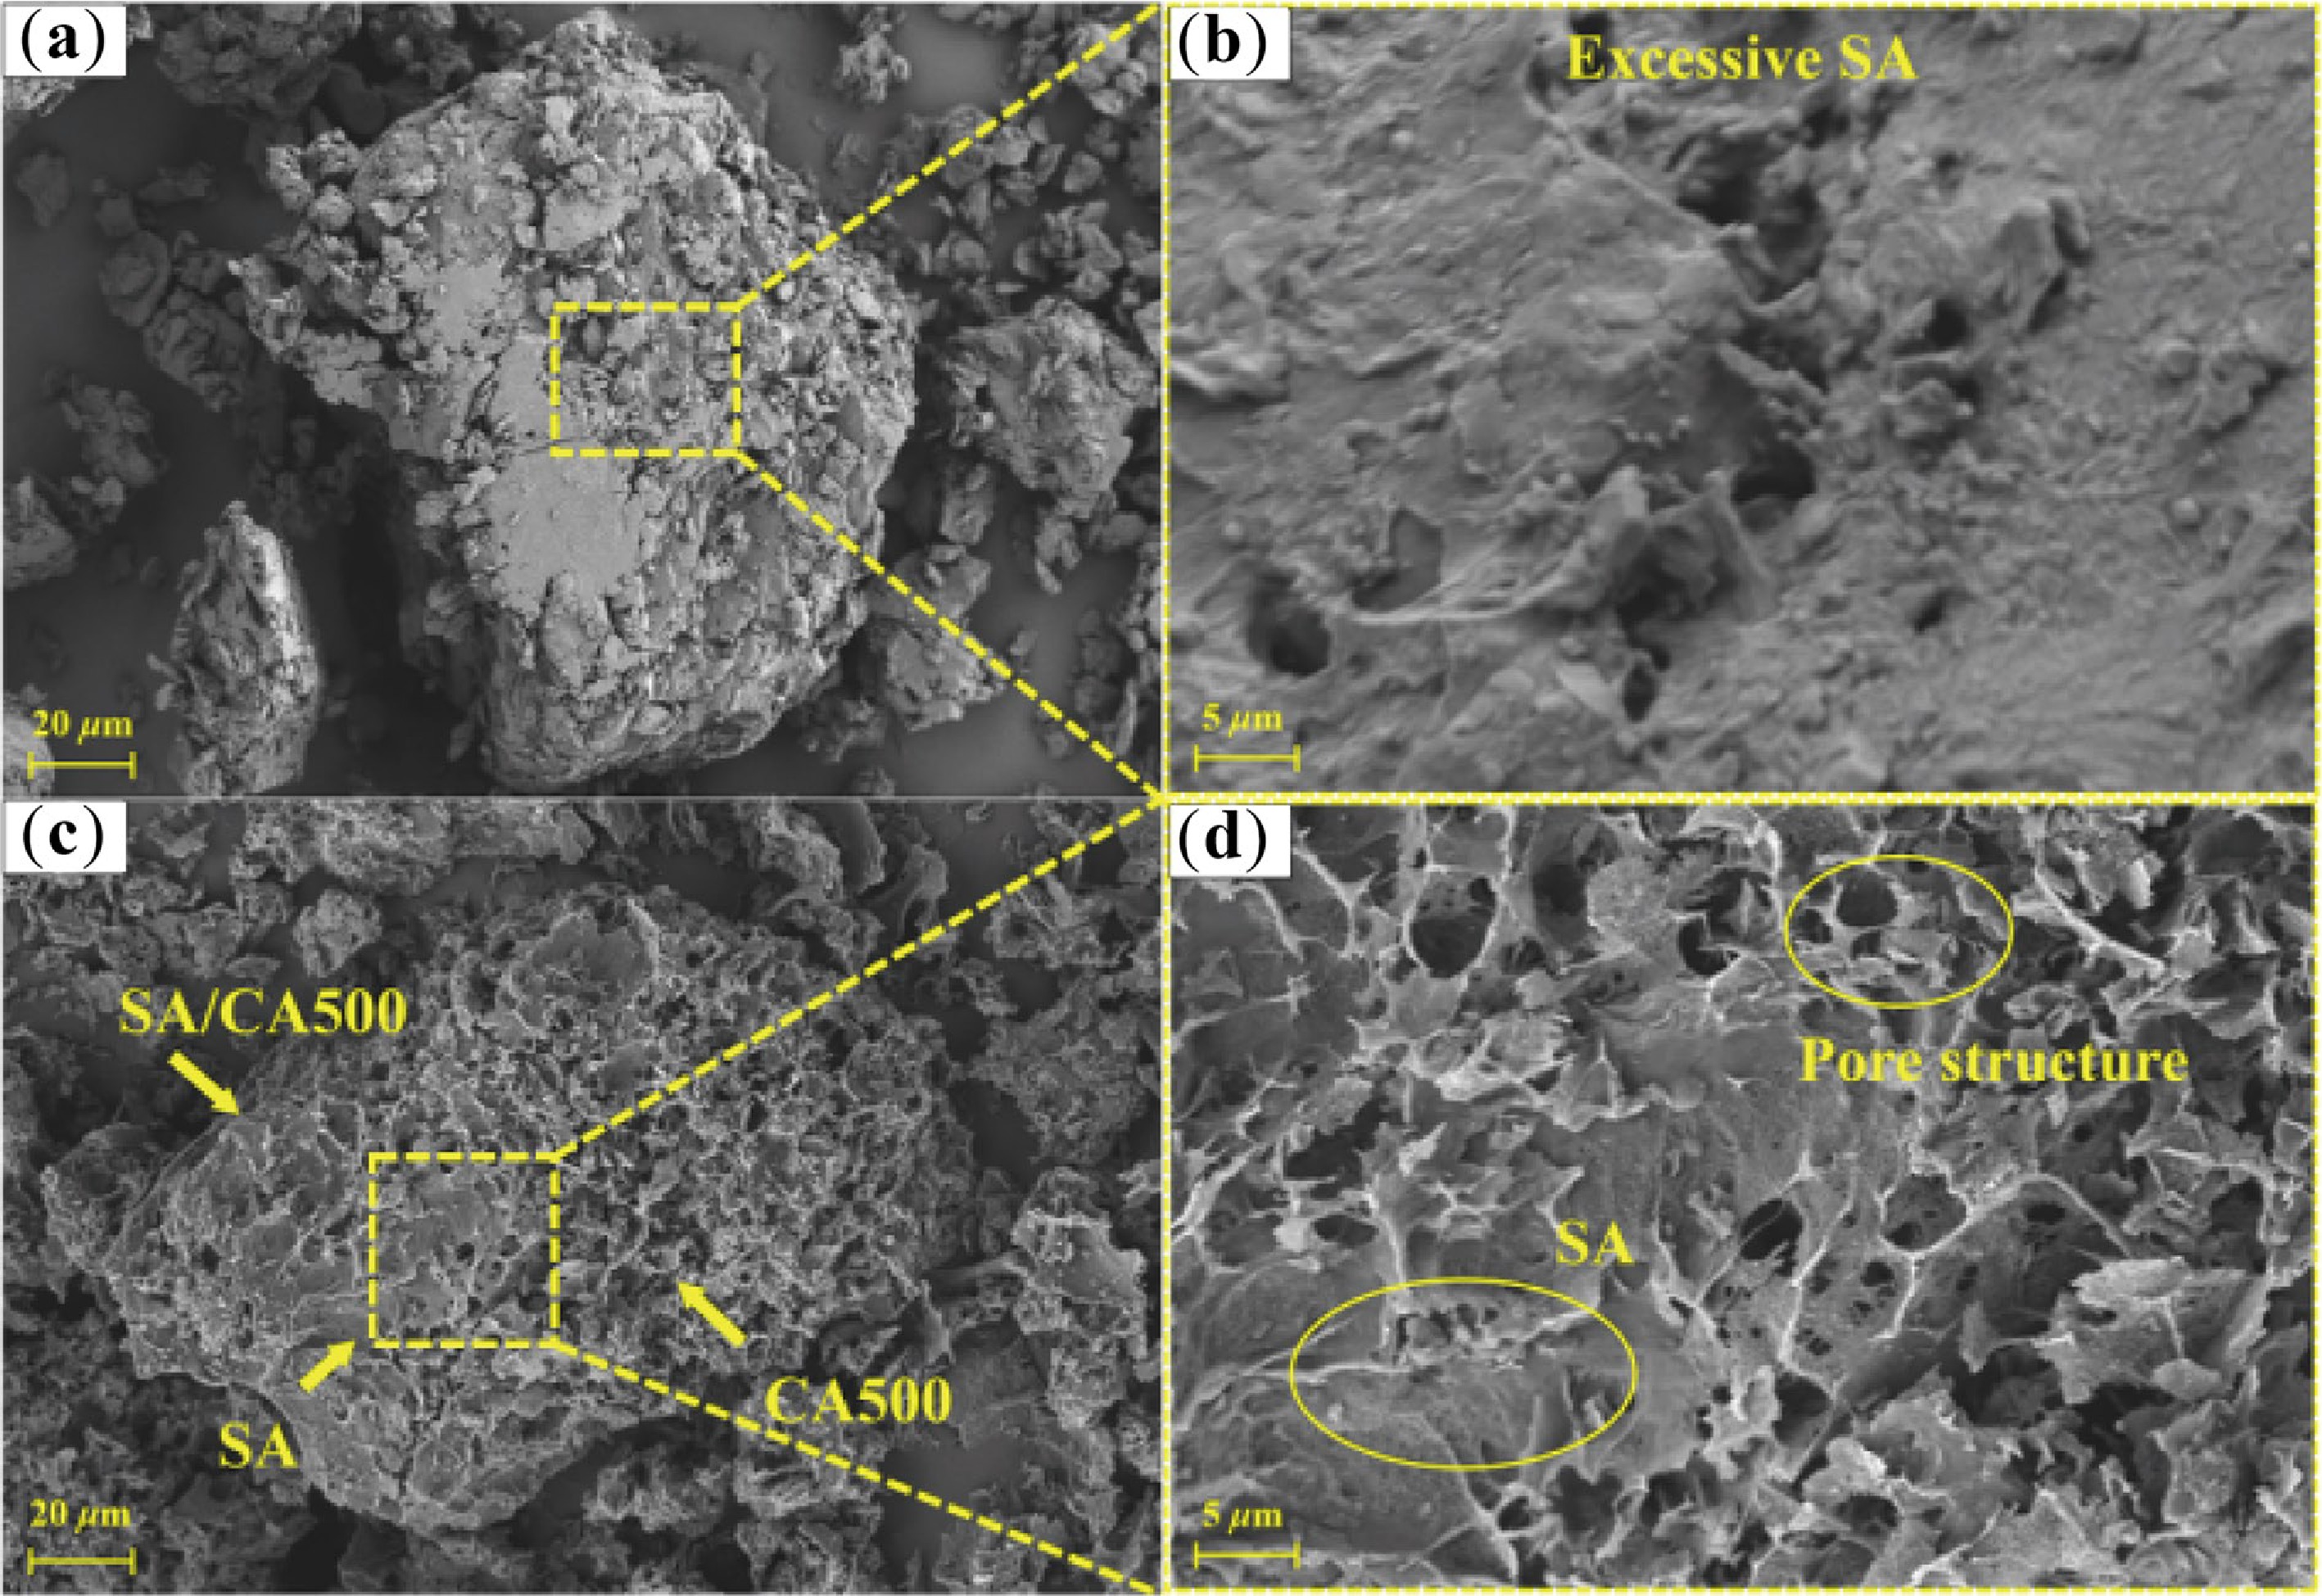
Figure 9.
SEM images of (a), (b) SA/CN500, and (c), (d) SA/CA500.
-
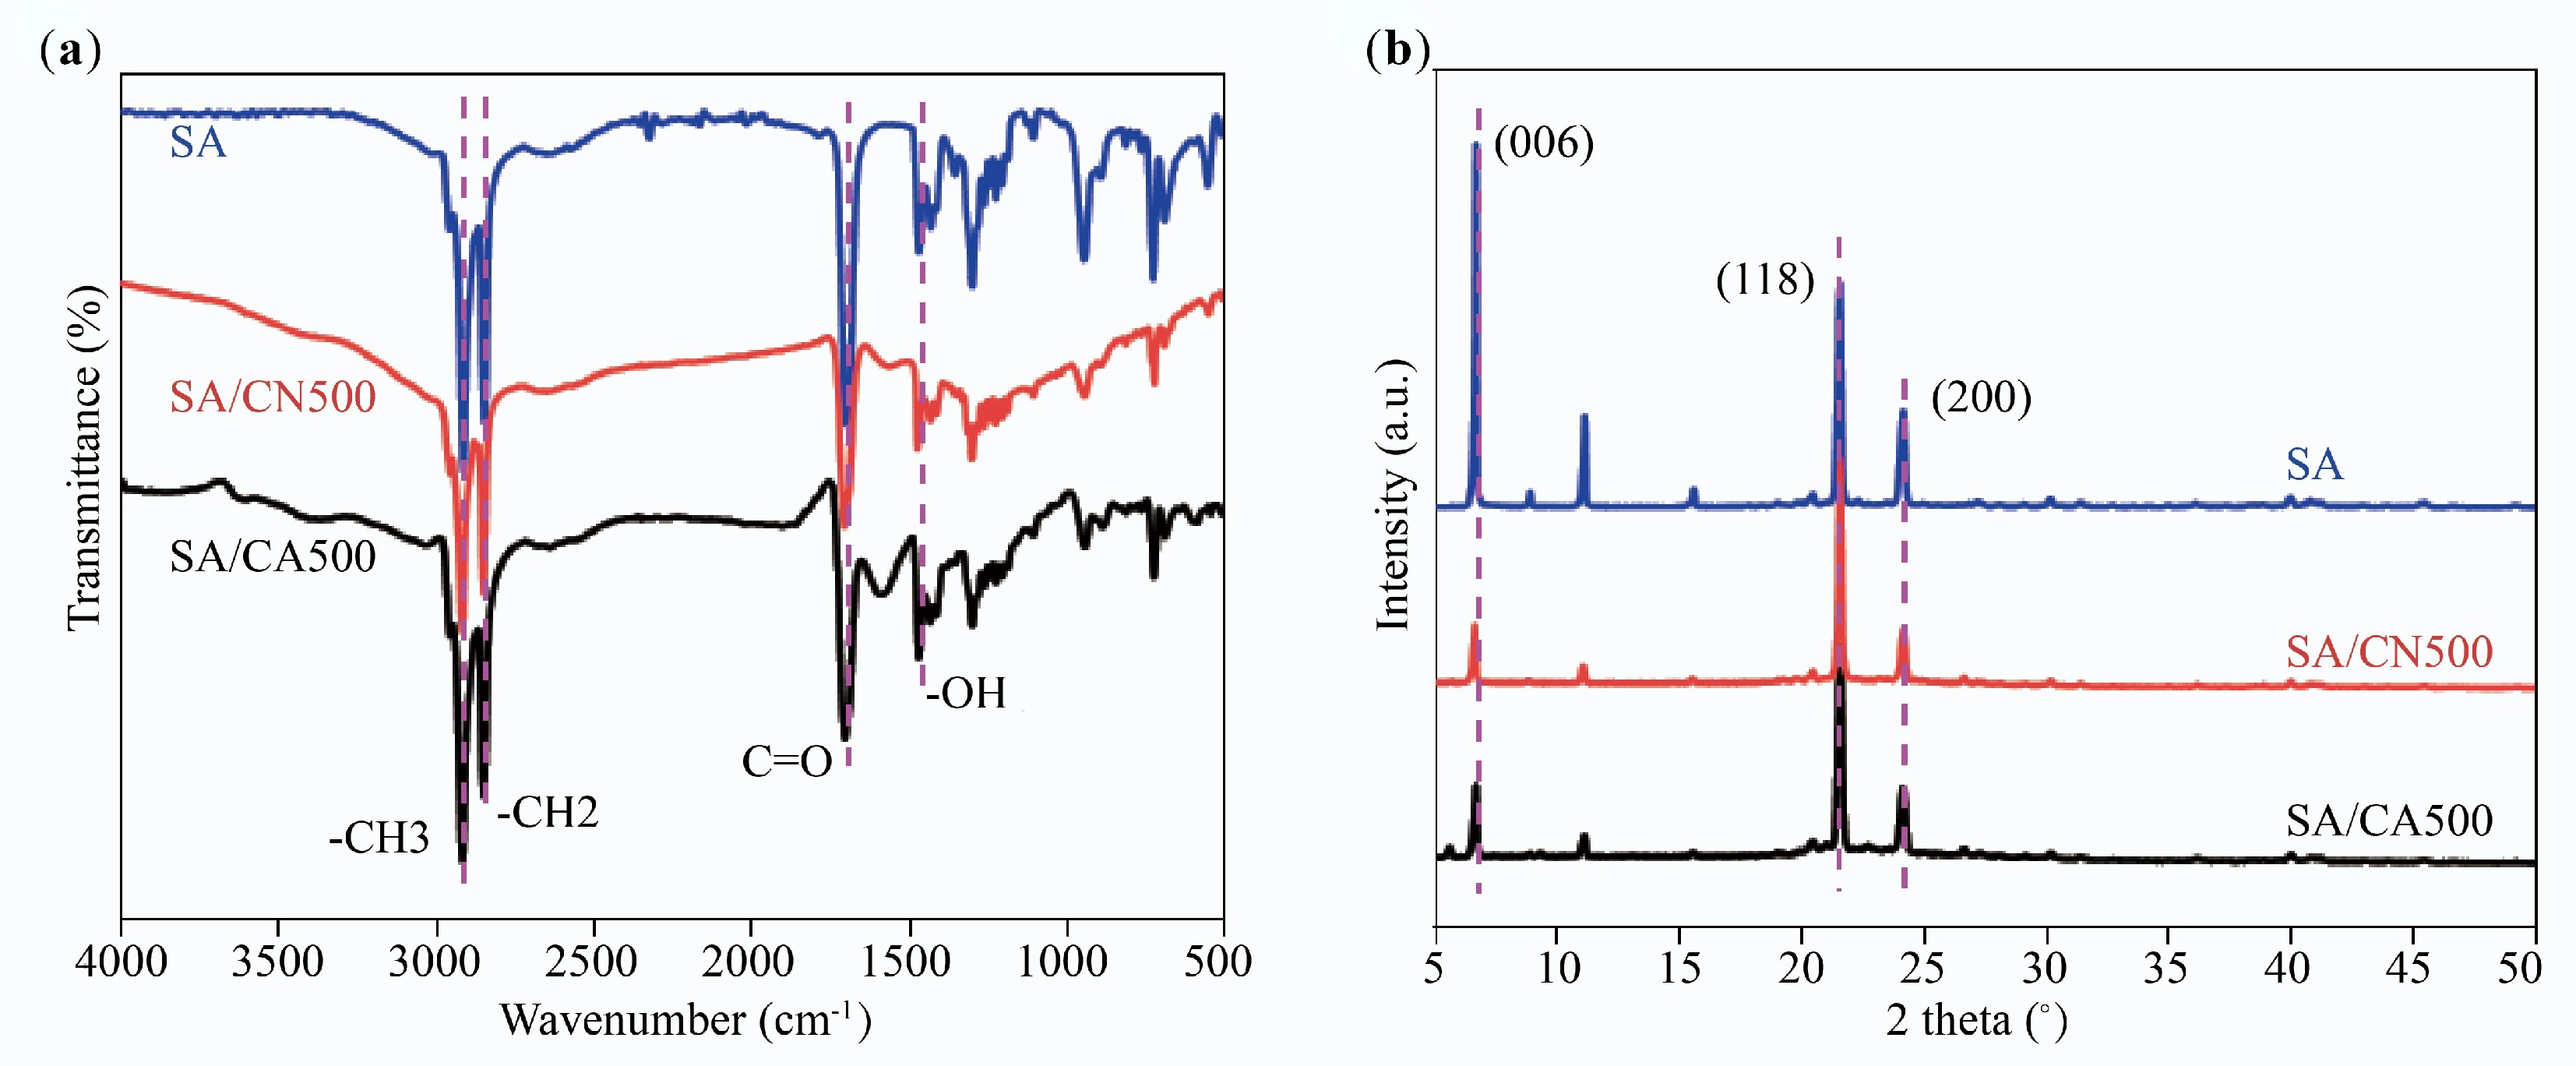
Figure 10.
(a) FTIR spectra, and (b) XRD patterns of SA/CN500 and SA/CA500.
-
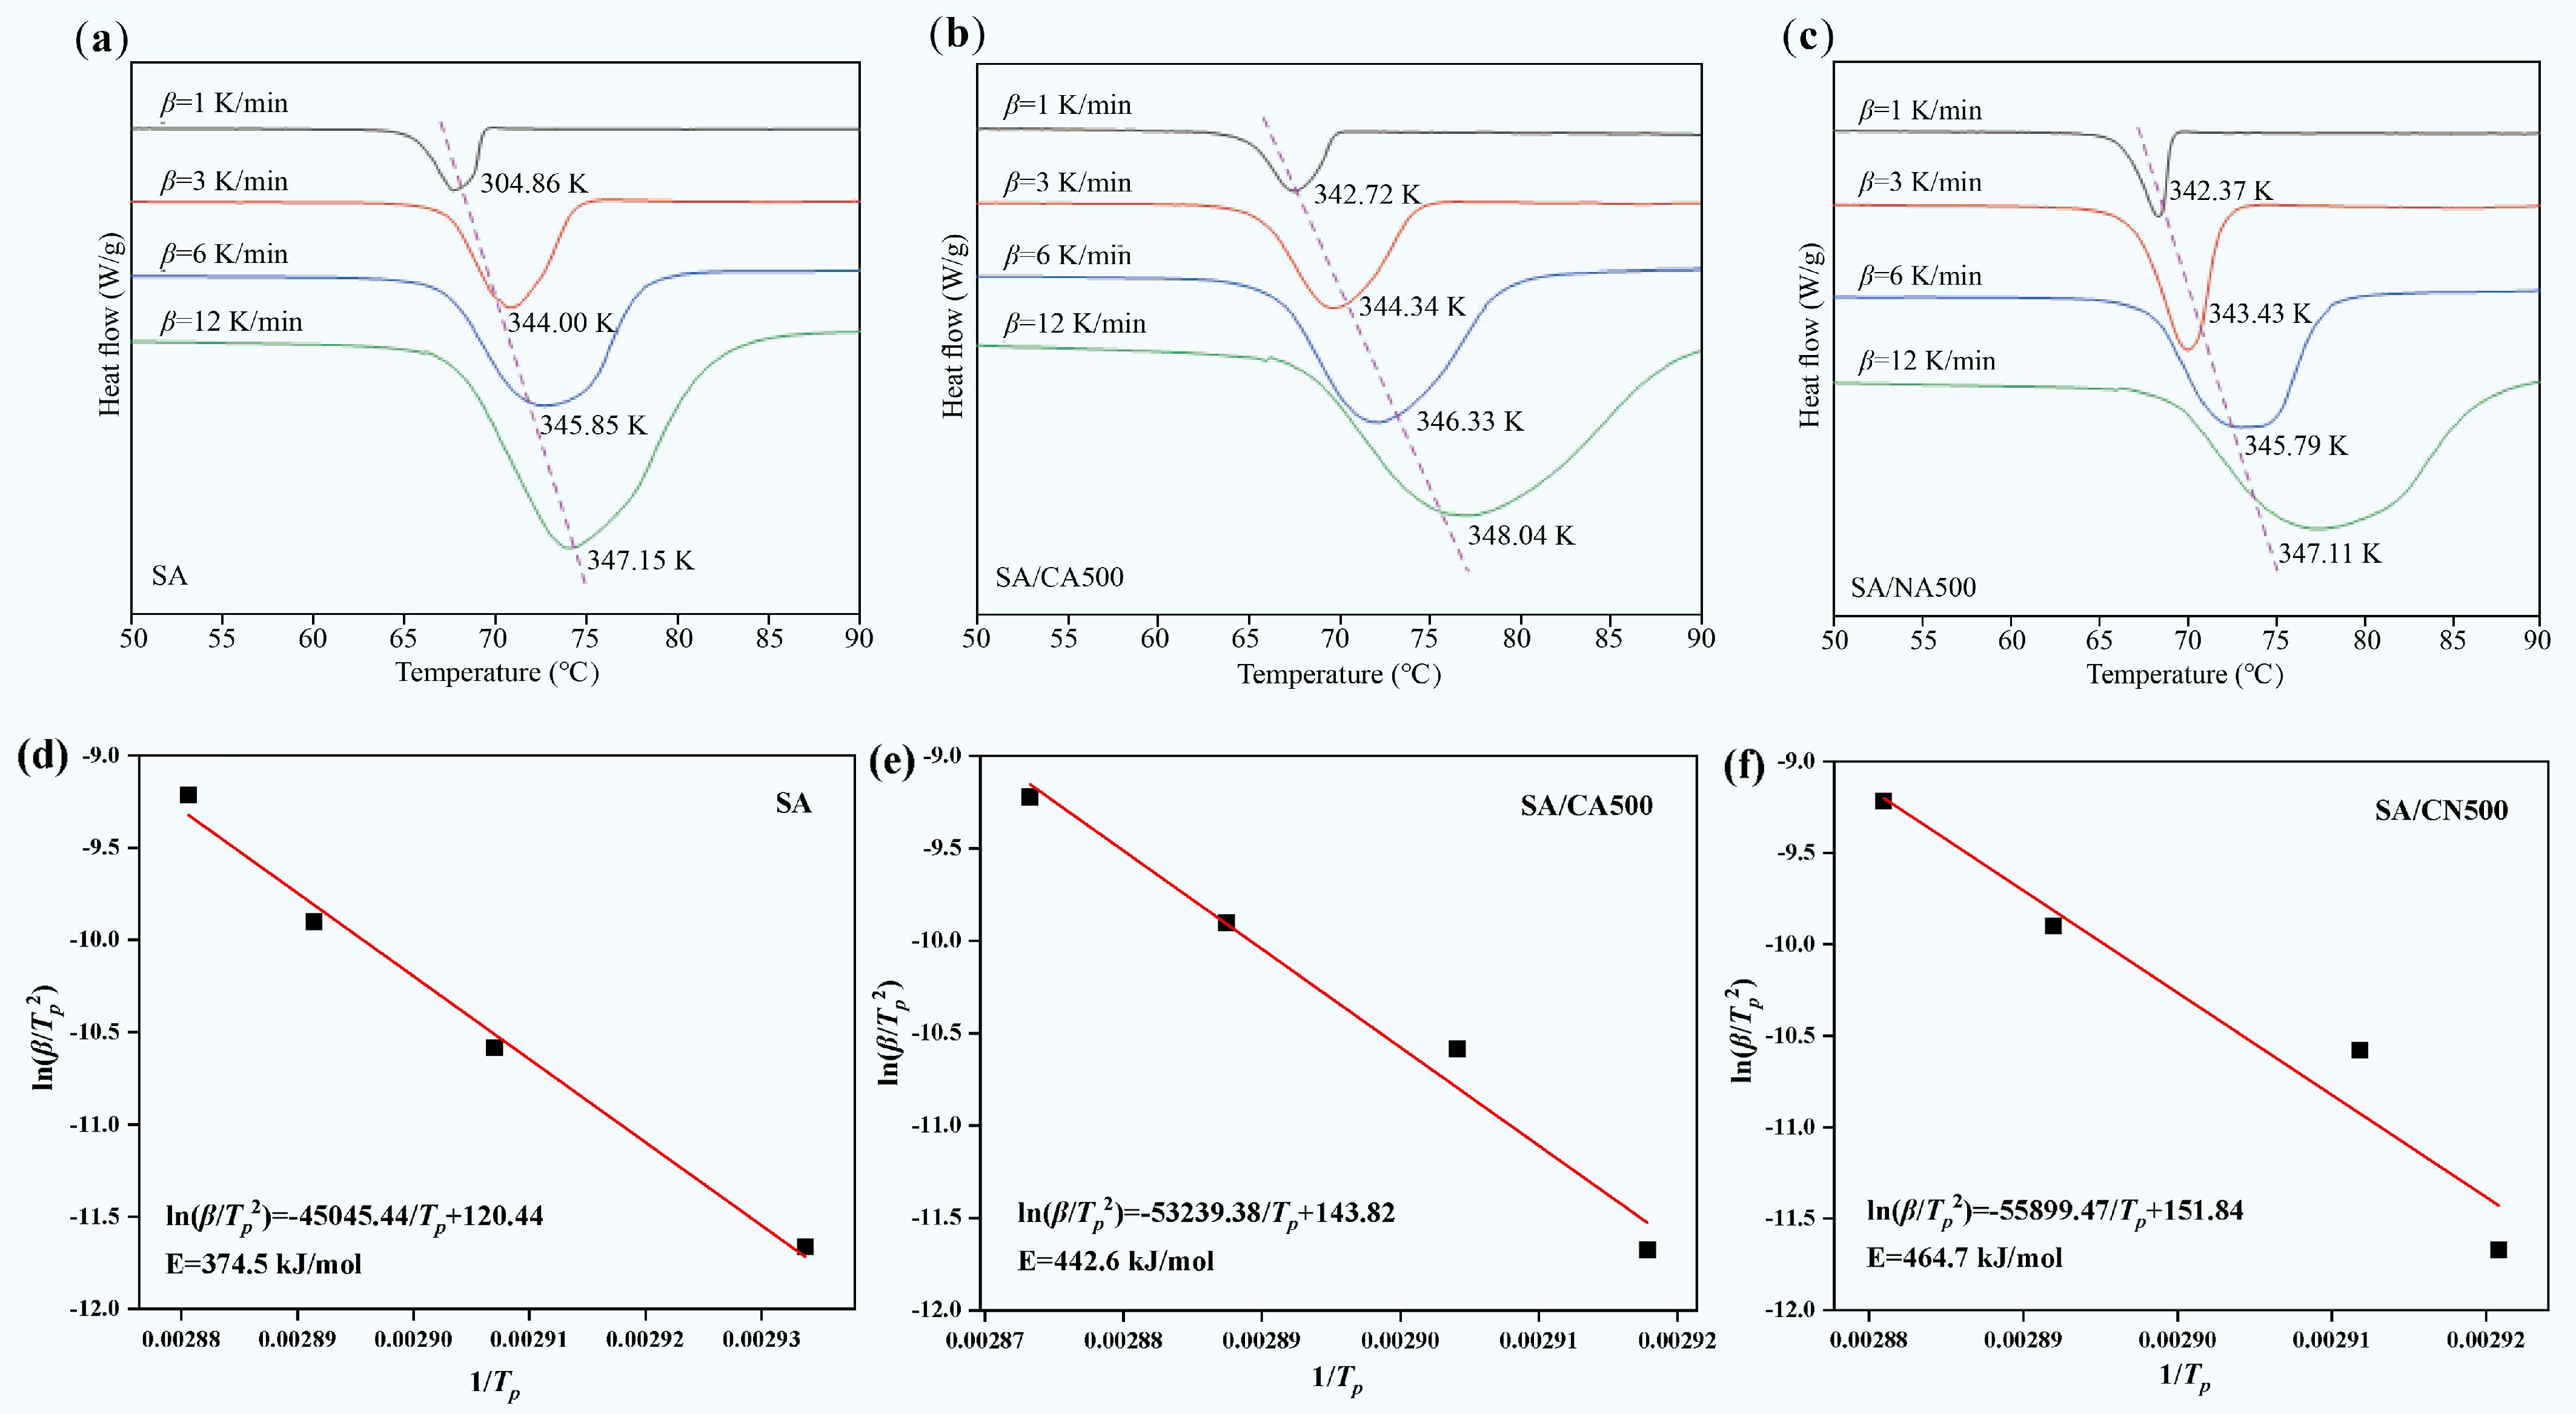
Figure 11.
(a)−(c) DSC curves with different heating rates, and (d)−(f) linear fitting of Kissinger equation for SA, SA/CA500, and SA/CN500.
-
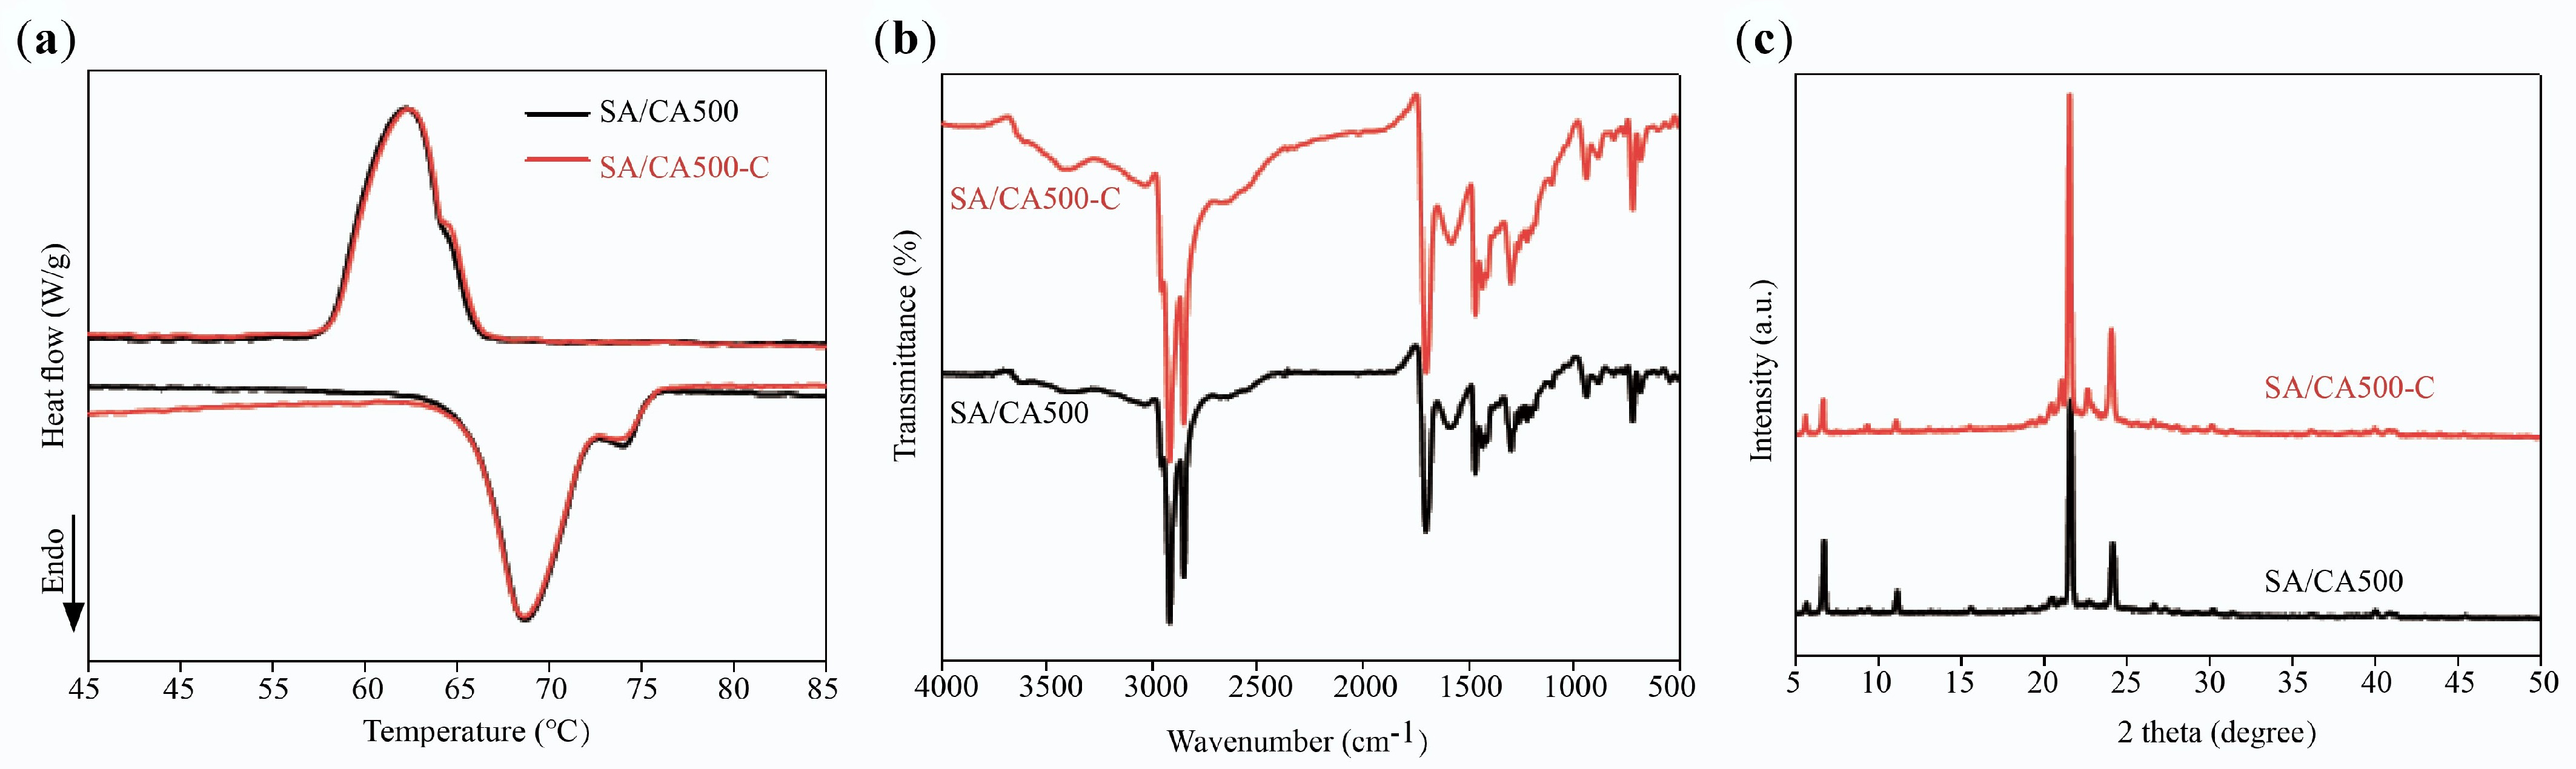
Figure 12.
(a) DSC curves, (b) FTIR Spectra, and (c) XRD patterns of SA/CA500 and SA/CA500-C.
-
Sample Tm/Tf (°C) ΔHm/ΔHf (J/g) ΔT (°C) SA 68.53/65.01 221.65/220.11 3.52 SA/CA500 67.27/65.79 117.66/116.77 1.48 SA/CA600 67.21/66.80 119.47/117.03 0.41 SA/CA700 67.51/66.47 122.03/119.46 1.04 SA/CA800 67.22/66.99 123.11/118.07 0.23 SA/CA900 67.42/66.07 125.42/121.71 1.35 Table 1.
Thermal properties of SA and SA/CAX
-
Sample SA ratio
(wt%)Tm/Tf (°C) ΔHm/ΔHf
(J/g)ΔT (°C) Ref. SA/CN500 60 67.52/66.89 114.26/112.58 0.63 This study SA/CA500 60 67.27/65.79 117.66/116.77 1.48 This study cSA/PSC 30 50.20/51.00 70.60/67.00 − [28] SA/MFC 58 61.00/51.00 100.00/99.00 10.00 [29] SA/CSC15 35 52.52/52.05 76.69/76.00 0.47 [30] SA/CF − 67.80/67.30 99.6/101.5 0.50 [31] SA/CMS 40 68.2/64.5 84.91/67.71 3.70 [32] Table 2.
Thermal properties of SA/CN500, SA/CA500, and reported SSPCM
-
Sample SBET (m2/g) Vtotal (cm3/g) Da (nm) CA500 20.97 0.059 11.29 CA600 37.60 0.044 4.64 CA700 138.21 0.077 4.88 CA800 470.98 0.215 1.81 CA900 186.03 0.102 2.20 CN500 240.59 0.162 2.70 Table 3.
Specific surface area, pore volume, and average pore diameter of supports
-
Sample SA SA/CA500 SA/CN500 E (kJ/mol) 347.5 442.6 464.7 r2 0.9915 0.9784 0.9435 Table 4.
Values of E and R2 of SA, SA/CA500, and SA/CN500
Figures
(12)
Tables
(4)