-
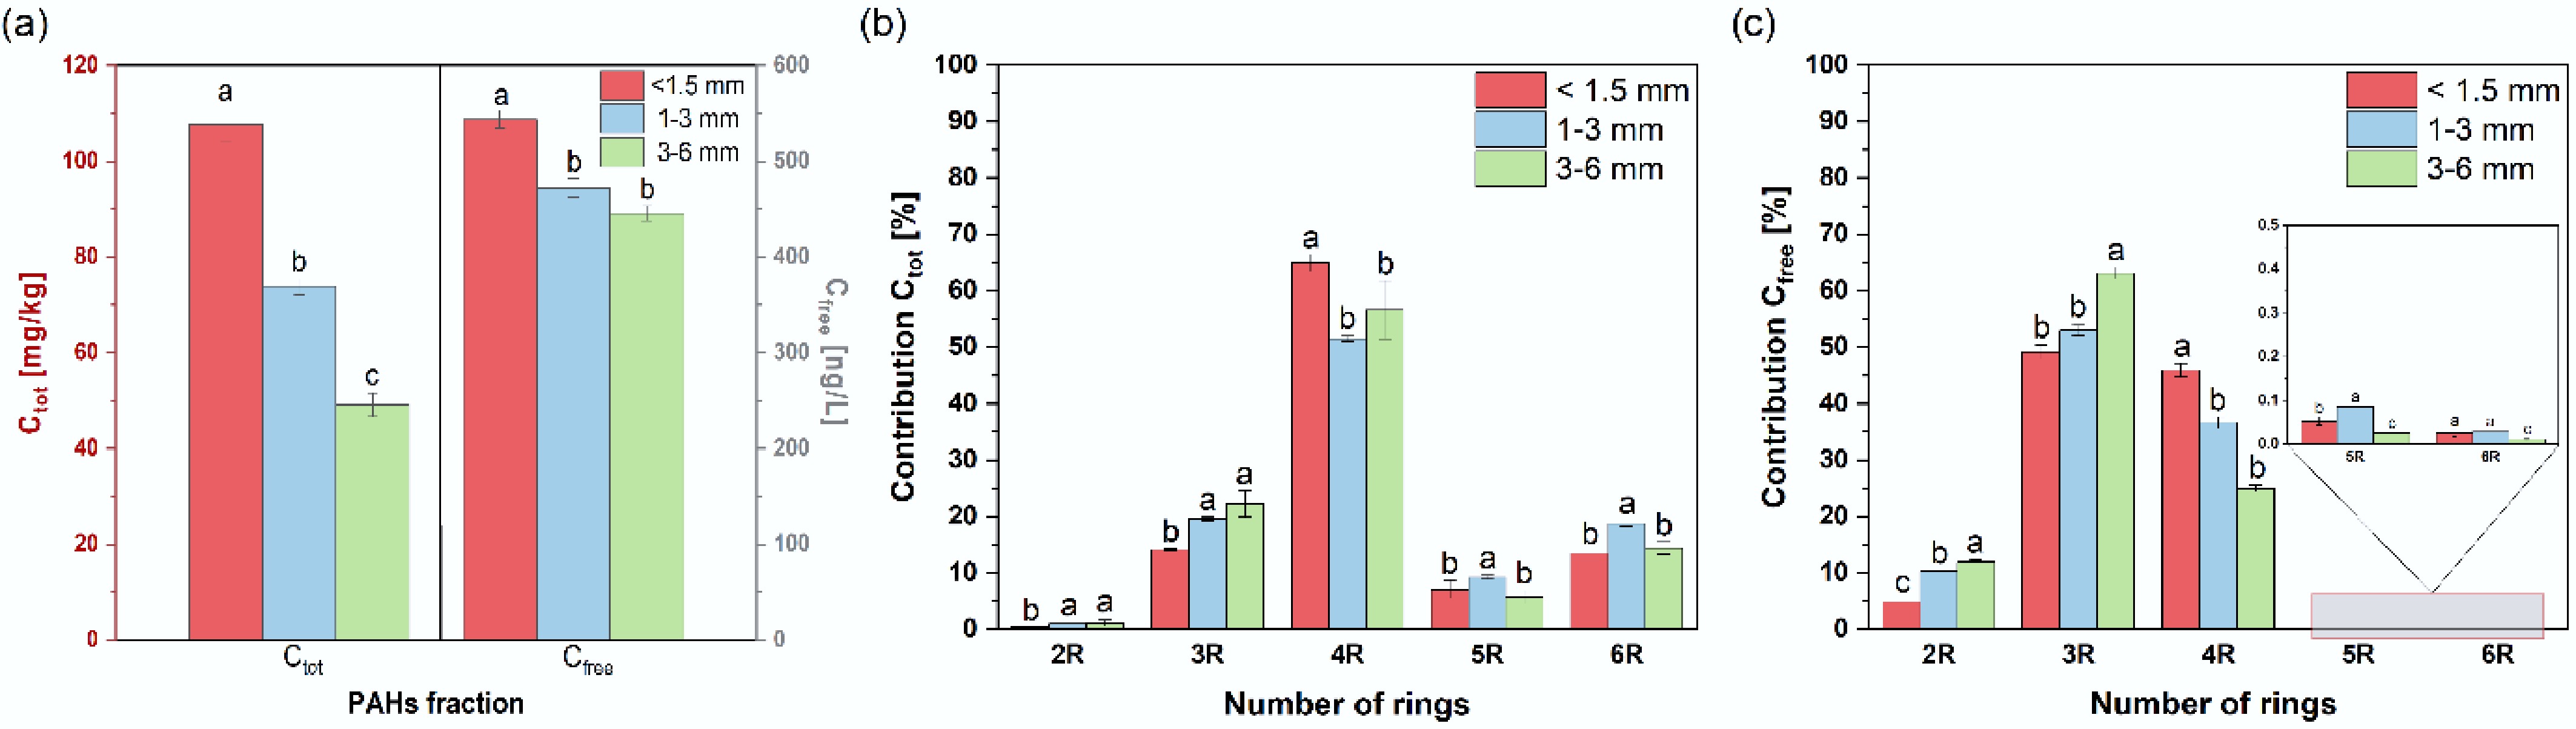
Figure 1.
The Ctot Σ16 PAHs and Cfree Σ16 content in (a) granular rubber, (b) contribution of Ctot Σ16 PAHs, and (c) Cfree Σ16 PAHs based on the number of rings. Dashed bars represent n-BC amendment. Error bars represent the standard deviation of the mean (n = 3). The letters indicate significant differences among particle sizes (p ≤ 0.05).
-
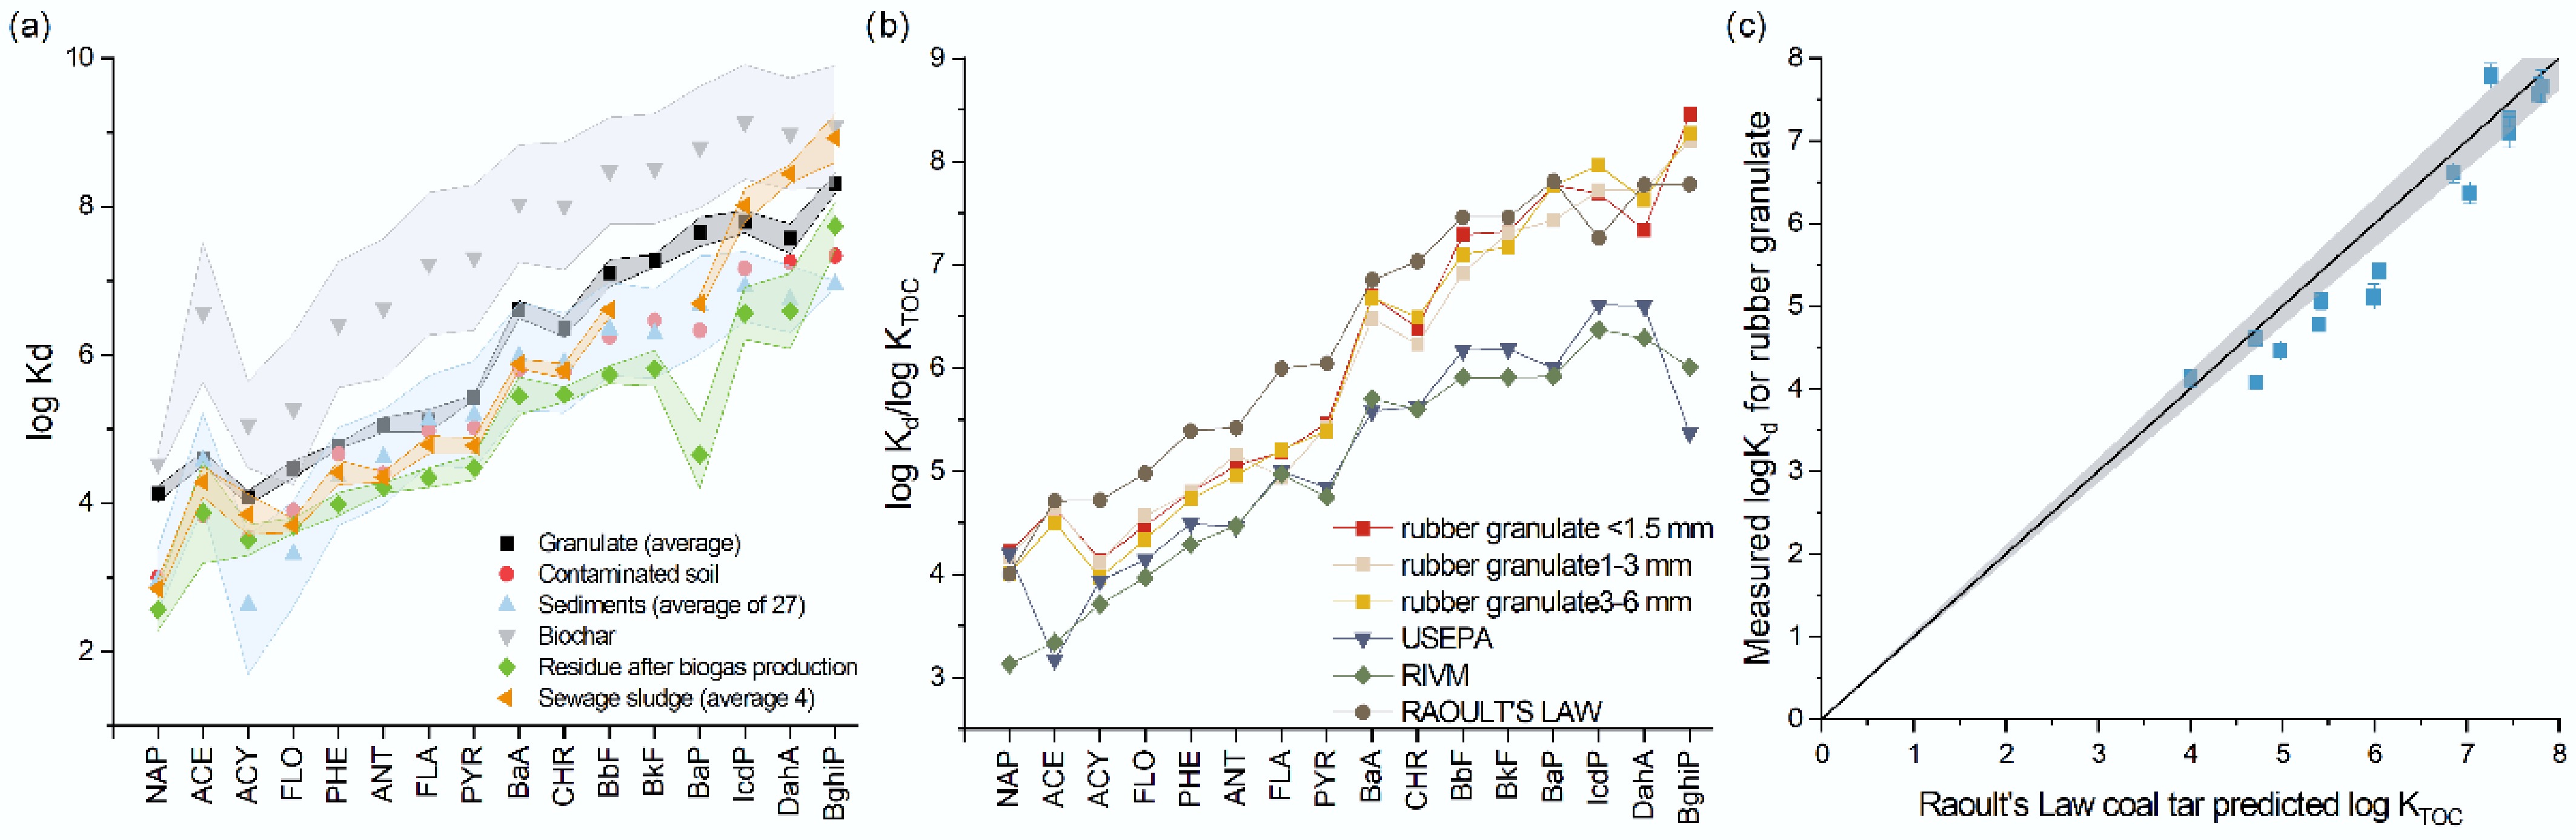
Figure 2.
(a) Distribution coefficients (log Kd) of selected PAHs in various materials. Shaded areas represent standard errors of the mean (n = 3). (b) Comparison of normalized sorption coefficients (log Kd/log KTOC) of selected PAHs for rubber granulate fractions (< 1.5, 1–3, and 3–6 mm) with standard partitioning models (USEPA, RIVM, Raoult's Law). (c) Correlation between measured log Kd values for rubber granulate and log KTOC values predicted using Raoult's Law for coal tar. Shaded area represents 5% confidence area.
-
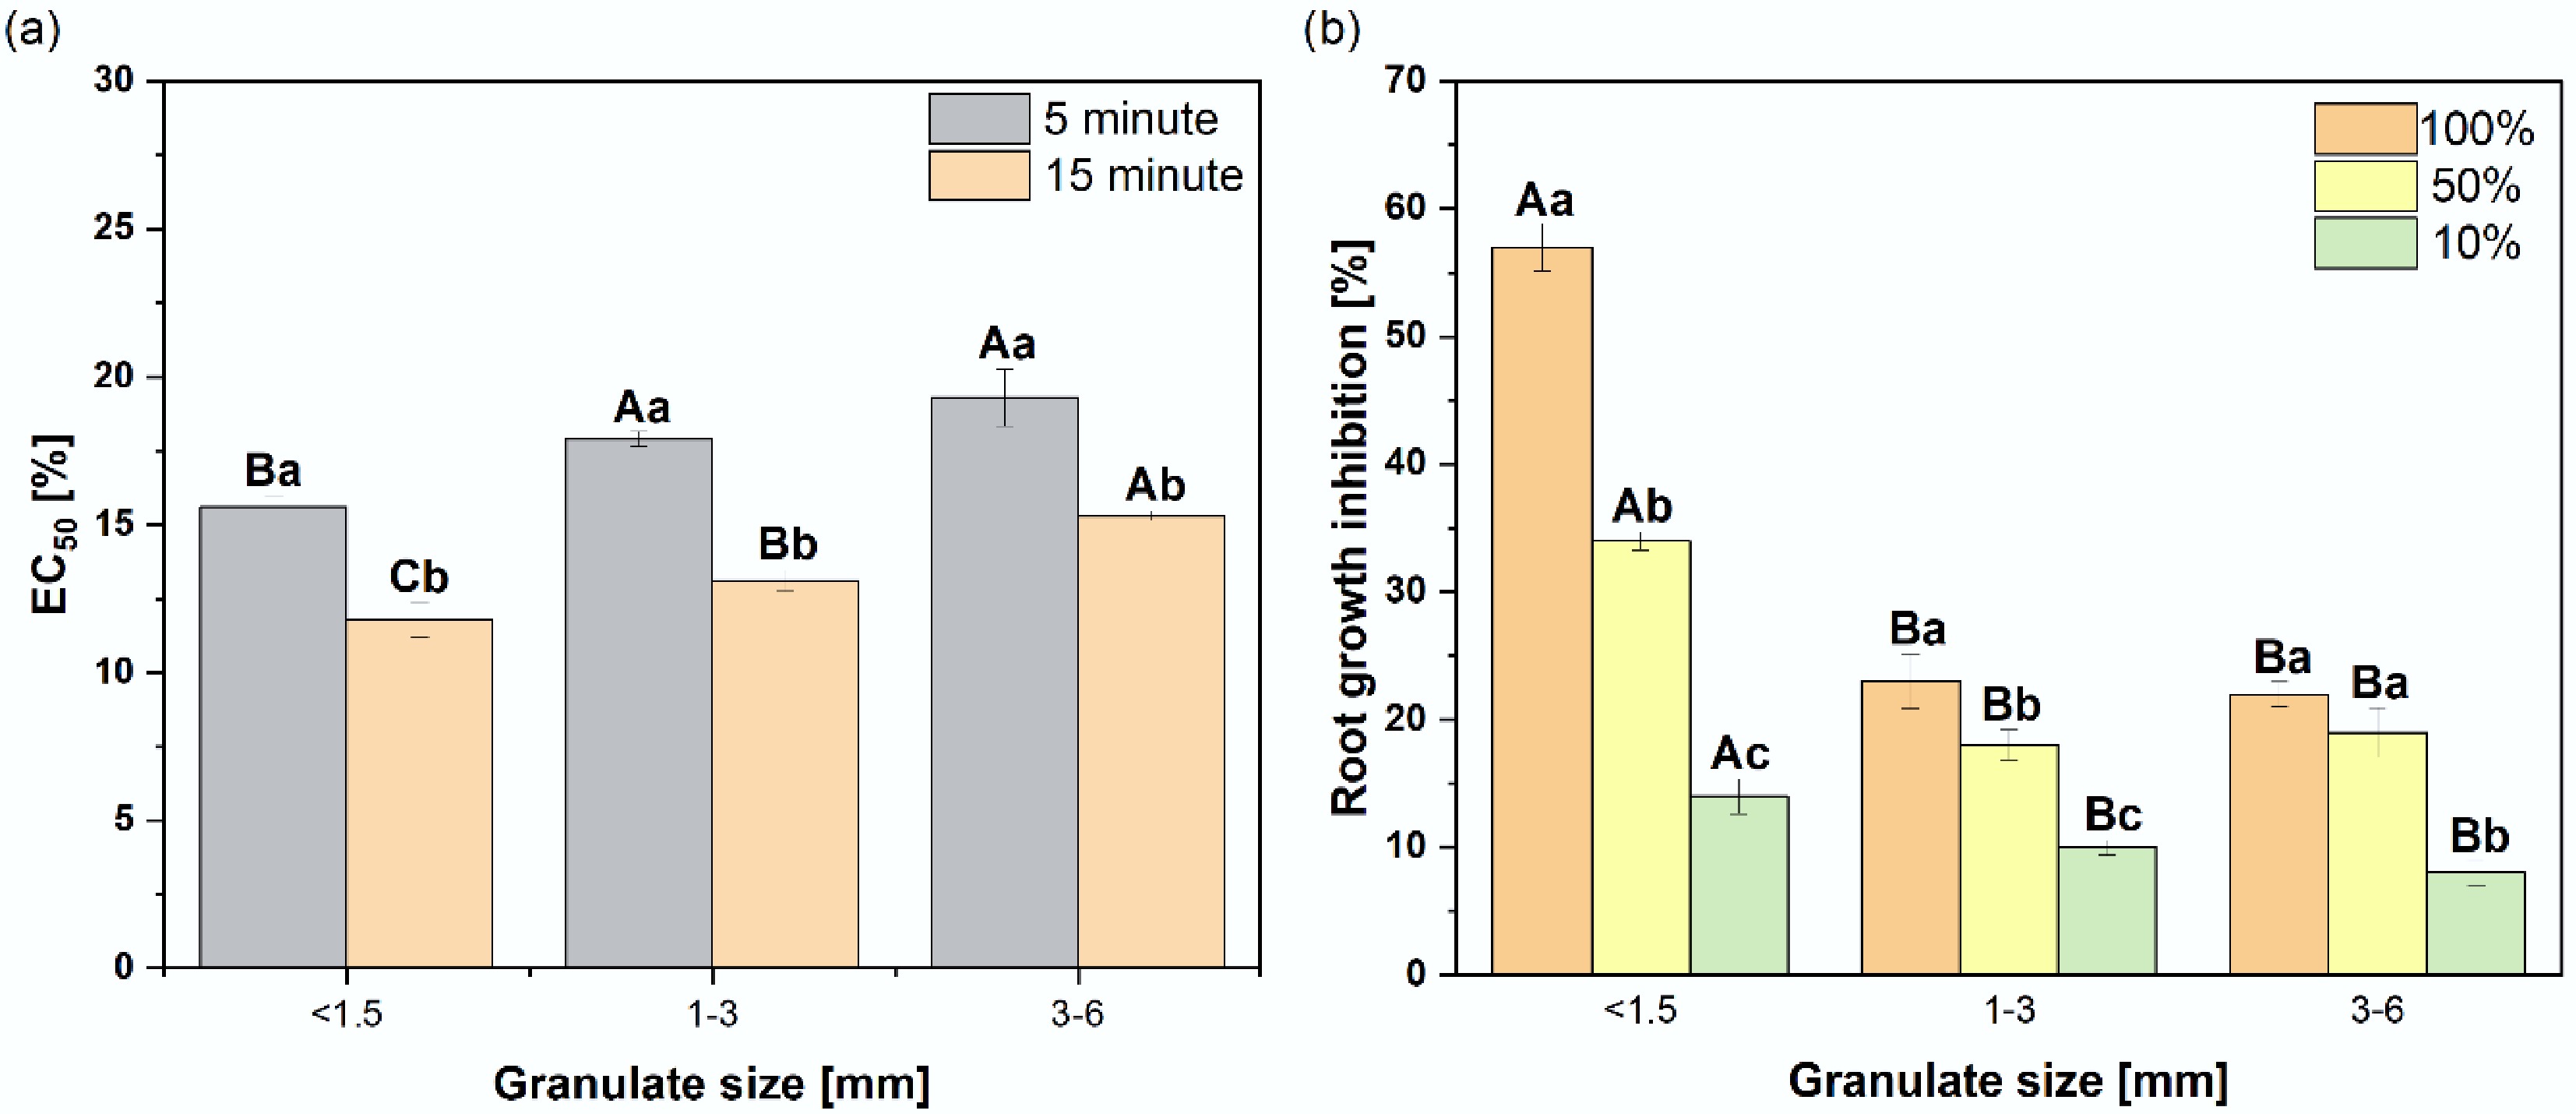
Figure 3.
Ecotoxicity of leachates from rubber granulate of different size fractions. EC50 values for Aliivibrio fischeri after 5 and 15 min of (a) exposure and (b) root growth inhibition of Lepidium sativum exposed to three leachate concentrations (100%, 50%, 10%). Error bars represent the standard deviation of the mean (n = 3). Capital letters indicate significant differences among particle sizes for a given exposure time or extract concentration, whereas lowercase letters indicate significant differences between different exposure times or concentrations within the same particle size (p ≤ 0.05).
-
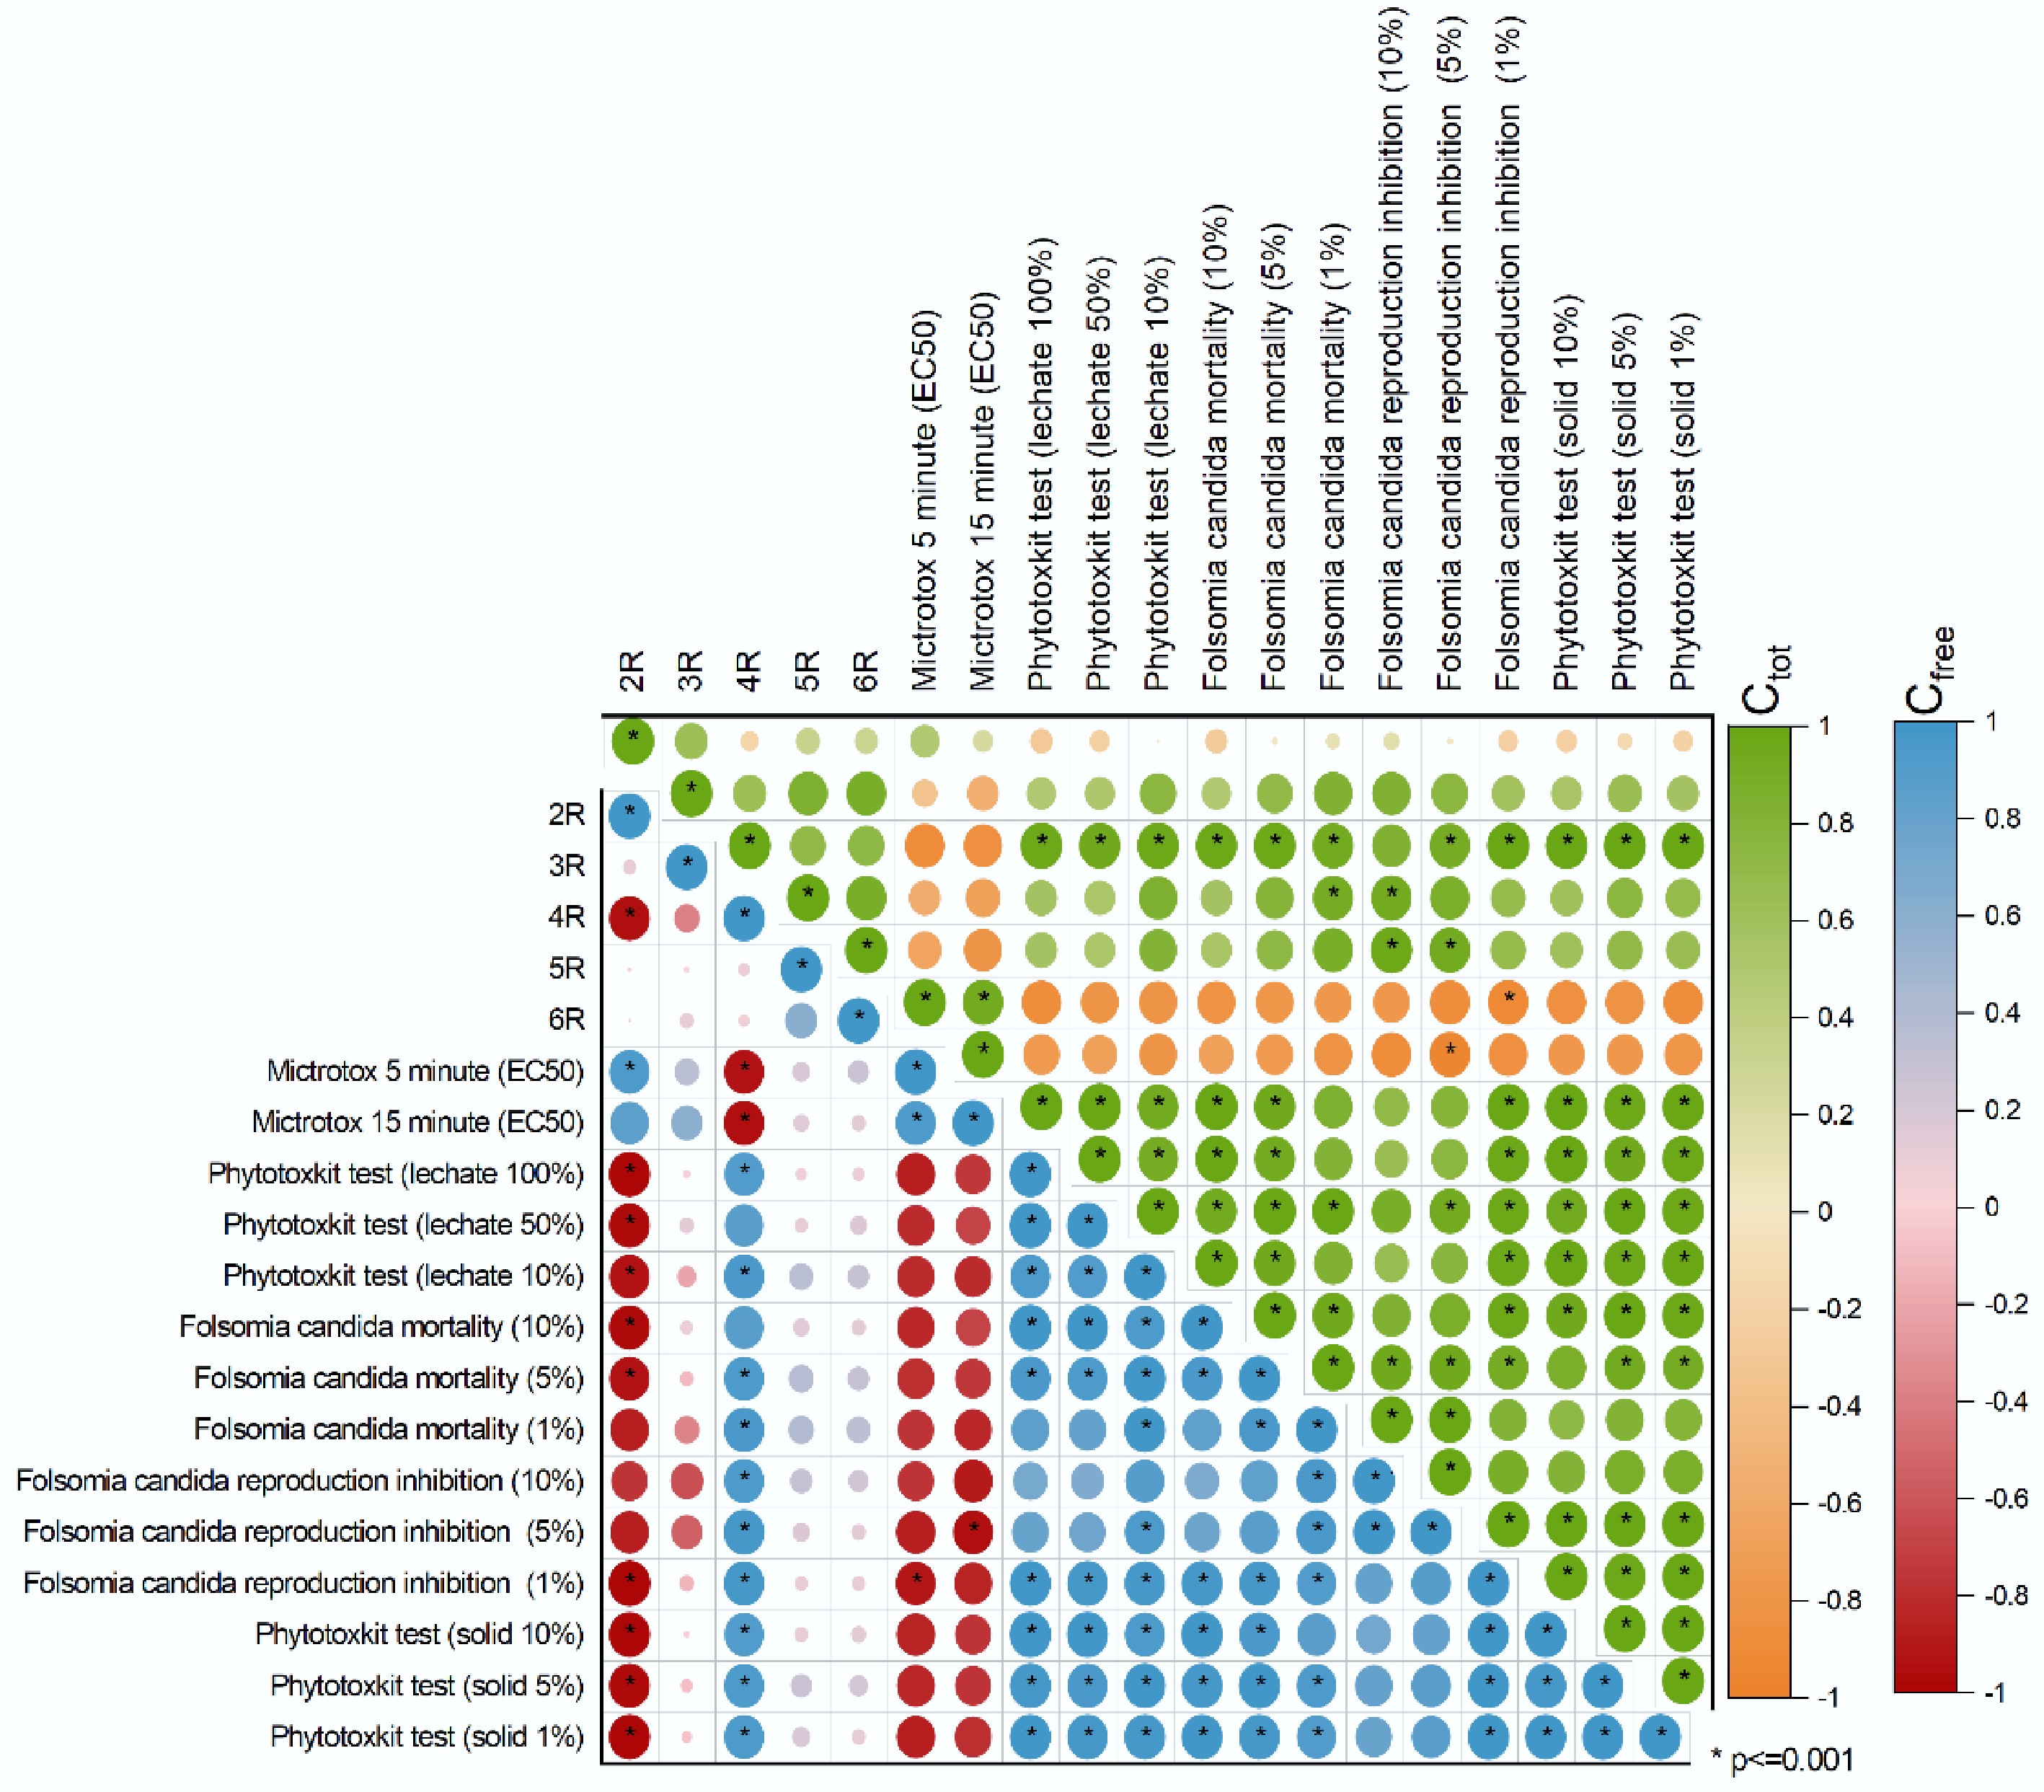
Figure 4.
Correlation matrix between Ctot (top green–orange panel) and Cfree (bottom blue–red panel) PAH concentrations, grouped by number of aromatic rings, and endpoints of ecotoxicity tests. Ecotoxicological responses include Microtox (EC50), Phytotoxkit (root growth inhibition of Lepidium sativum), and Folsomia candida mortality and reproduction inhibition for both leachate and solid-phase tests. Significant correlations (p ≤ 0.001) are marked with *.
-
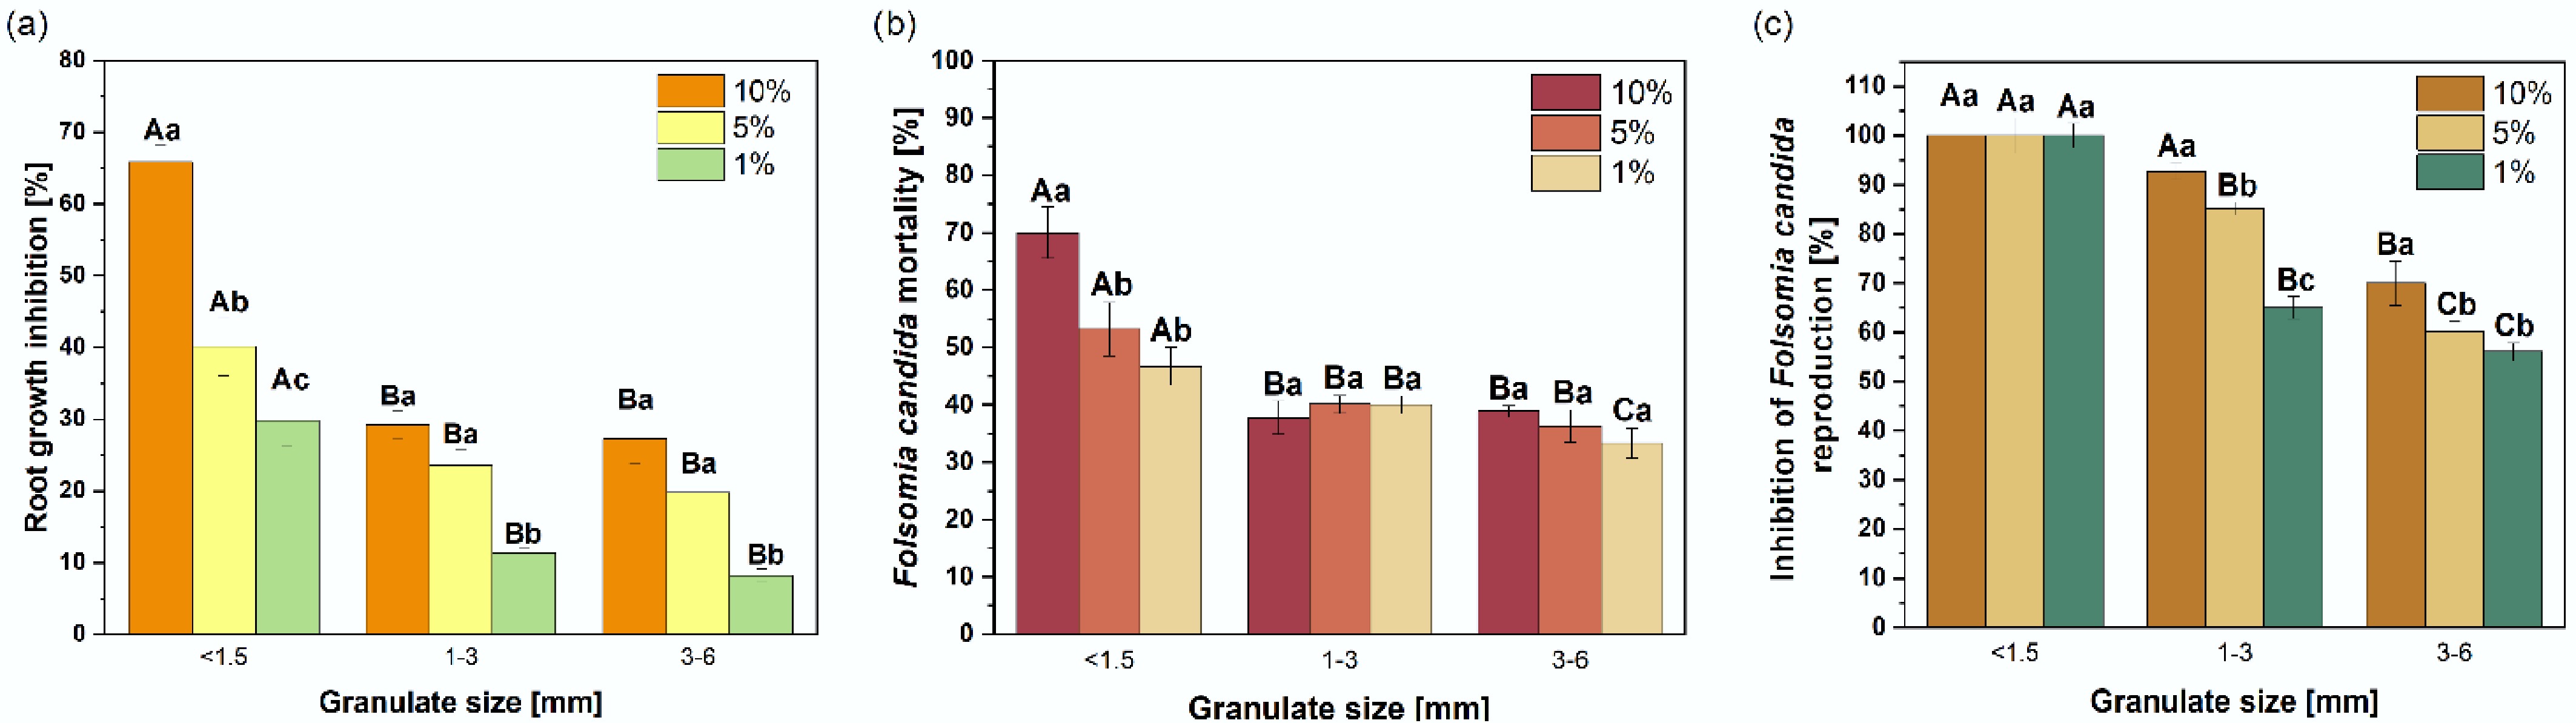
Figure 5.
Ecotoxicity of the solid phase of rubber granulate with different size fractions. Root growth inhibition of (a) Lepidium sativum, (b) mortality, and (c) reproduction inhibition of Folsomia candida in soils amended with rubber granulate at three amendment levels (1%, 5%, 10%). Error bars represent the standard deviation of the mean (n = 3). Capital letters indicate significant differences among different particle sizes for a concentration, whereas lowercase letters indicate significant differences between different concentrations within the same particle size (p ≤ 0.05).
-
Parameter Granulate size (mm) < 1.5 1–3 3–6 C (%) 74.66 A 81.65 A 77.25 A H (%) 6.88 A 6.74 A 7.61 A N (%) 2.57 A 0.67 B 0.68 B O (%) 5.65 A 4.42 B 8.07 C S (%) 0.44 A 0.46 A 0.30 B ASH (%) 9.80 A 6.06 B 6.09 B H/C 1.11 A 0.99 A 1.18 A O/C 0.06 A 0.04 B 0.08 A (O + N)/C 0.09 A 0.05 B 0.09 A C/N 33.89 A 142.17 B 133.19 B SBET (m2/g) 0.07 − − Vmicro (cm3/g) 0.000033 − − Smicro (m2/g) 0.0860 − − pH 5.87 A 7.42 B 7.48B Different letters in rows mean statistically significant differences (p ≤ 0.05) between rubber granulate fractions. Table 1.
Physicochemical properties and elemental composition of studied rubber granulate fractions
-
Element Concentration (mg/L) < 1.5 mm 1–3 mm 3–6 mm Zn 103.447 ± 0.8 18.119 ± 0.1 13.078 ± 0.1 Cu 27.573 ± 0.2 0.009 ± 0.000 0.006 ± 0.0 Cr 1.459 ± 0.3 nd nd Ni 0.080 ± 0.0 0.005 ± 0.0 0.004 ± 0.0 Cd 0.048 ± 0.0 nd nd Pb 0.02 ± 0.0 0.02 ± 0.0 nd Co 0.380 ± 0.0 0.079 ± 0.0 0.073 ± 0.0 Table 2.
Potentially toxic elements concentration in studied granulate rubber
Figures
(5)
Tables
(2)