-
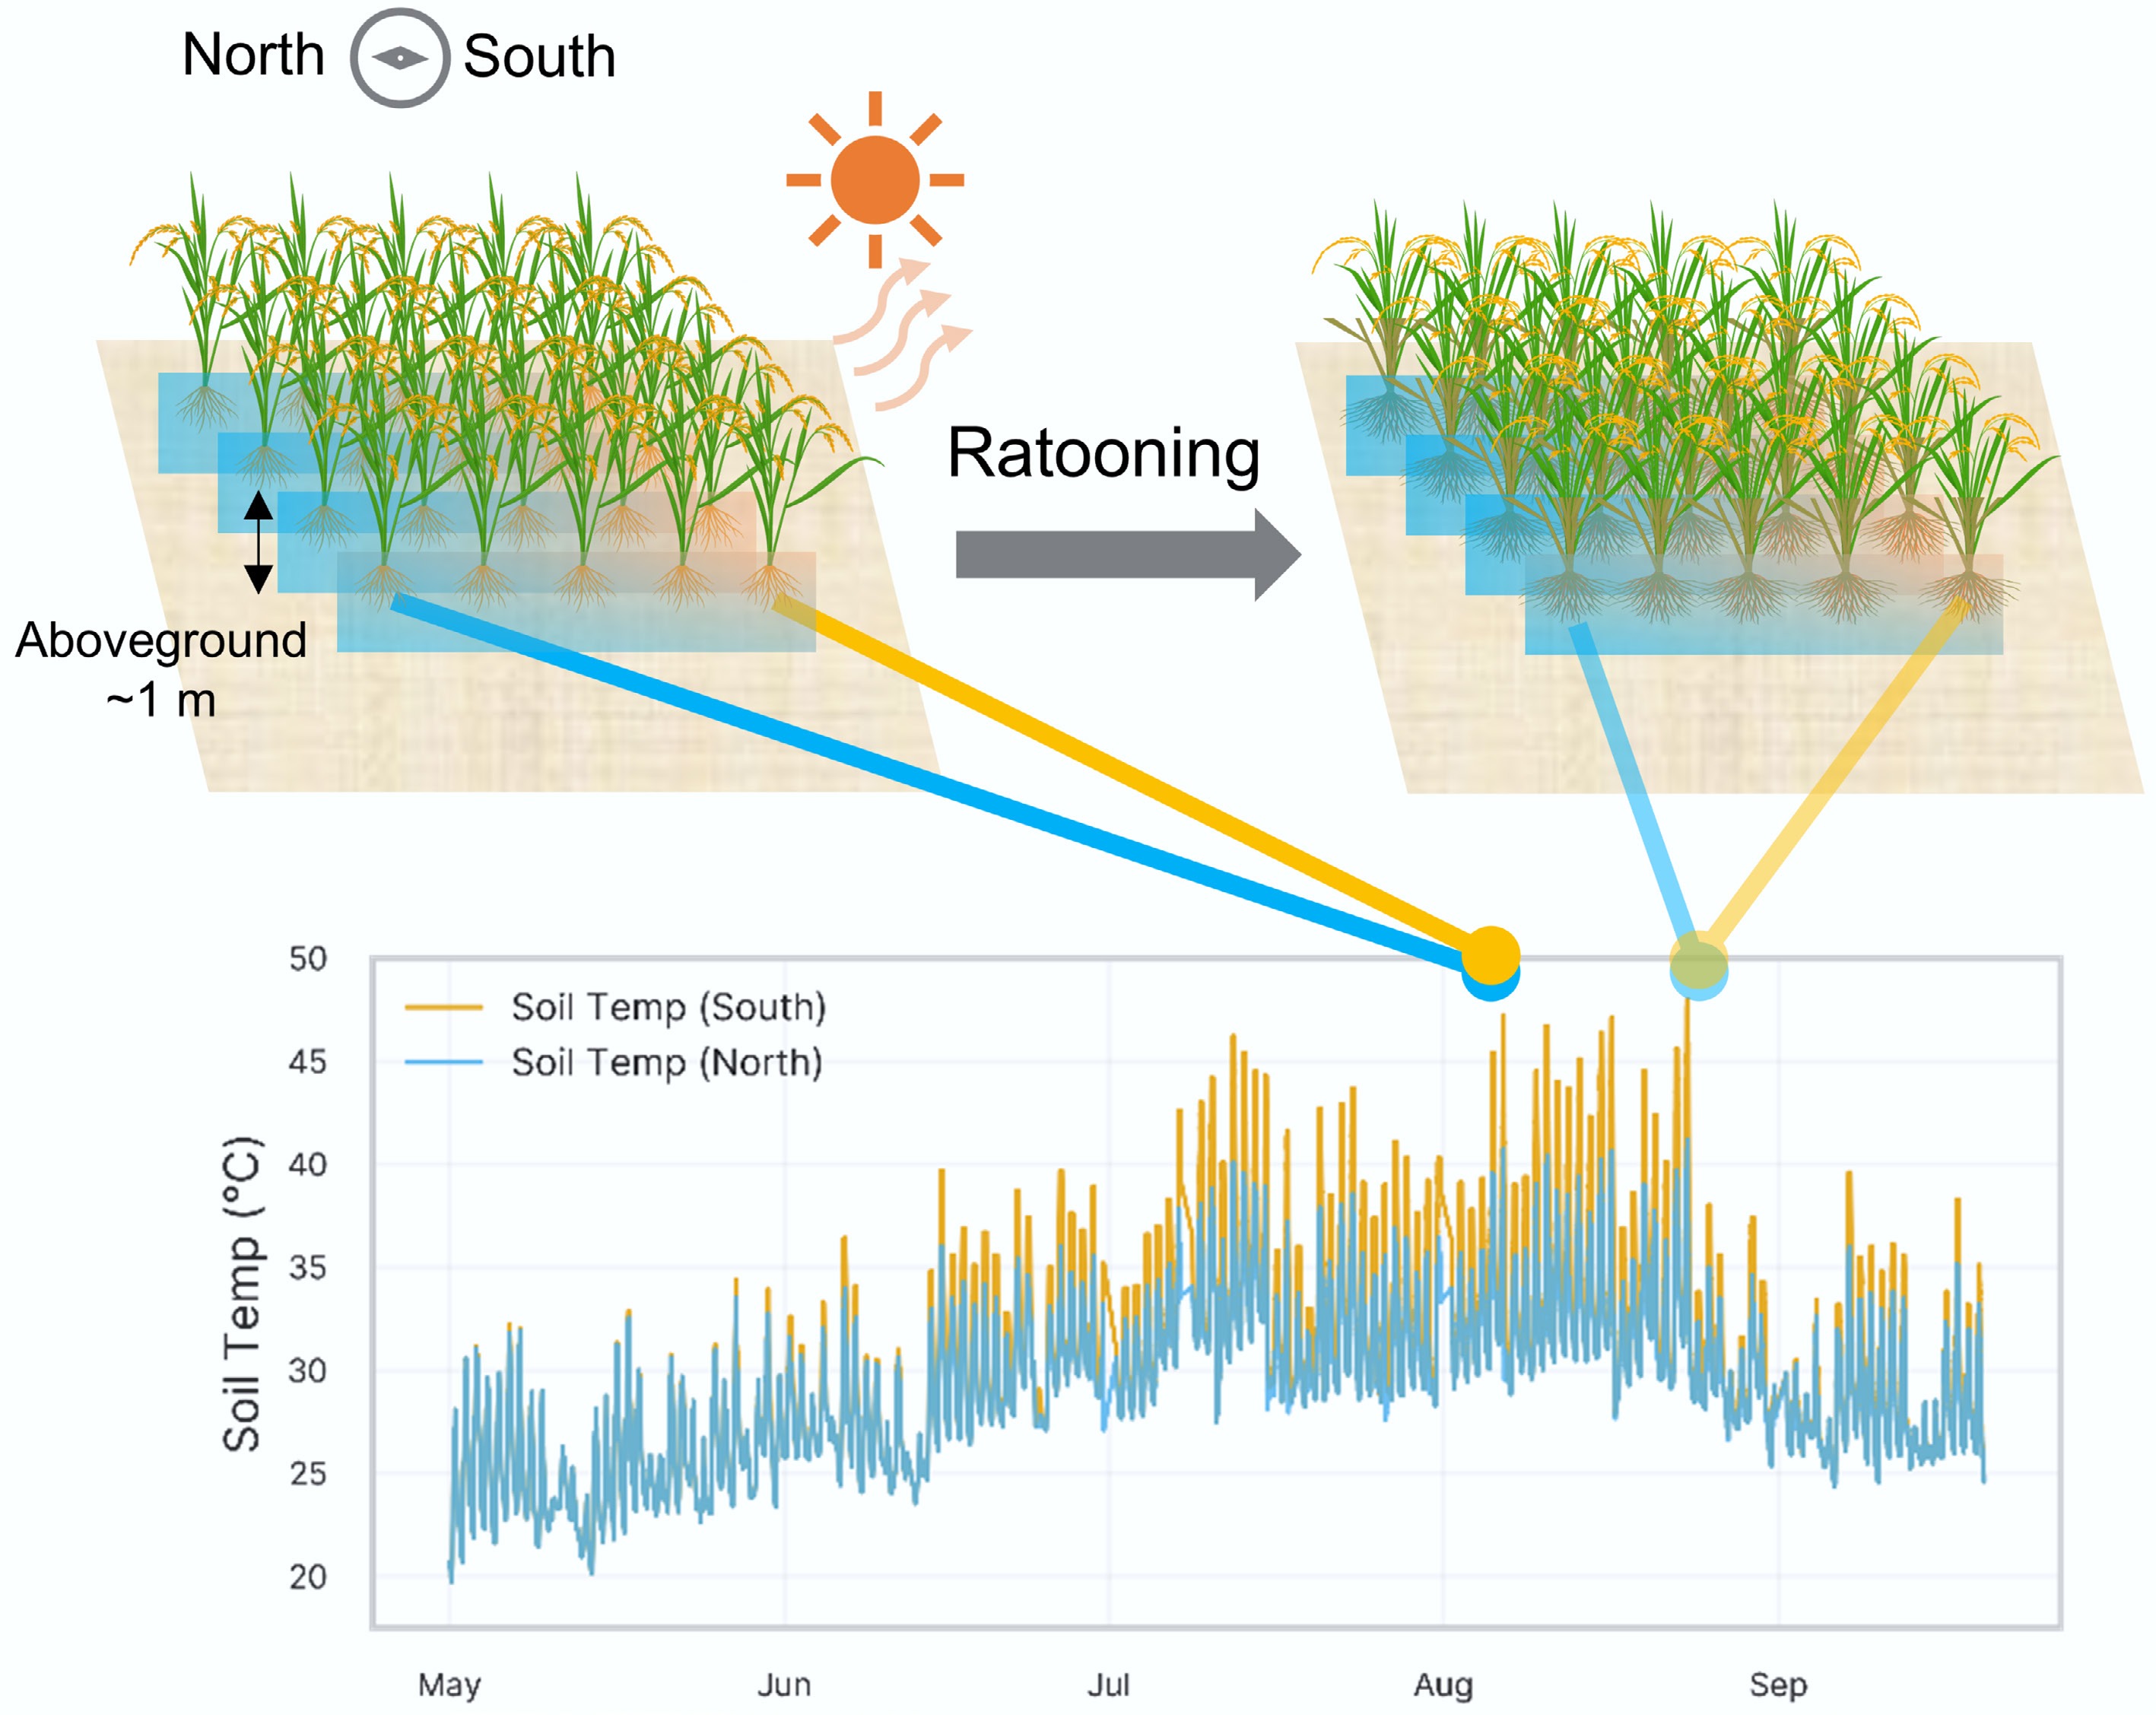
Figure 1.
Experimental design of soil warming gradient.
-
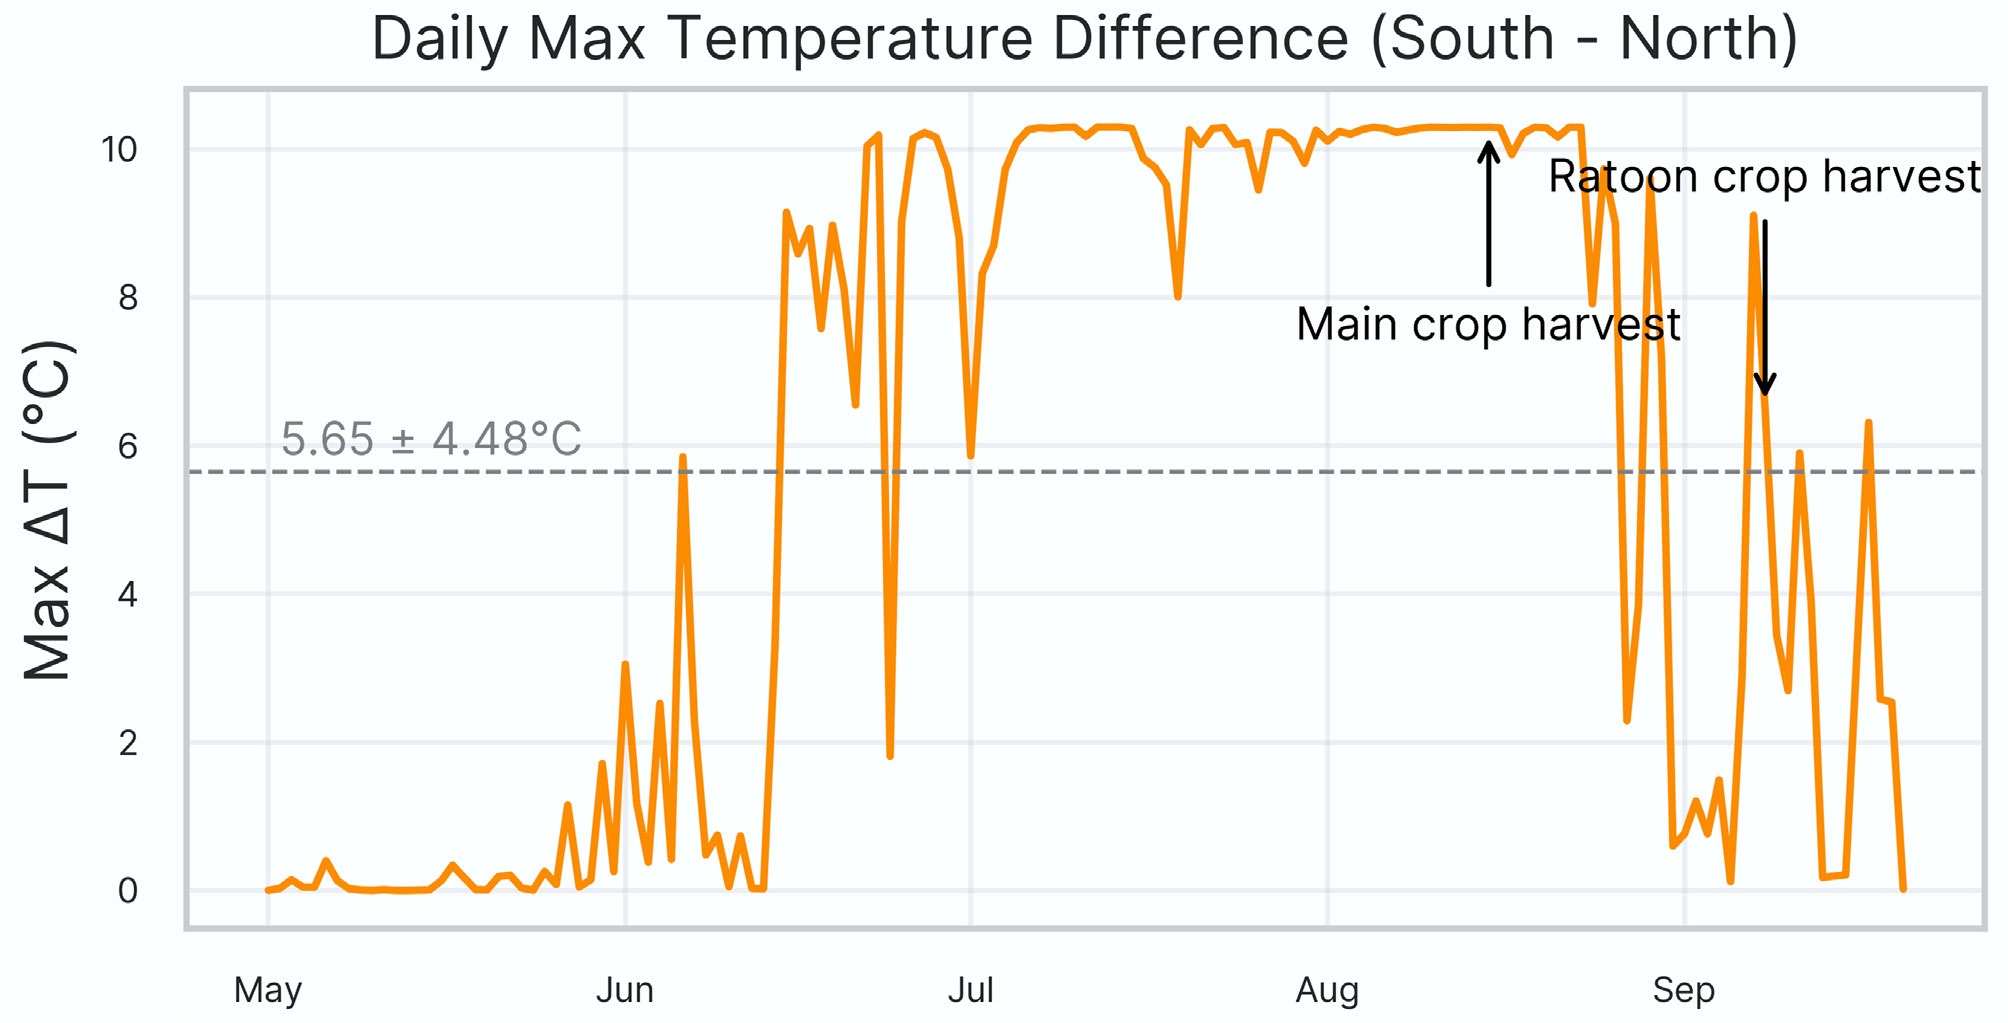
Figure 2.
Daily maximum temperature difference (ΔT) between the south- and north-facing sides of tanks throughout the experimental period.
-
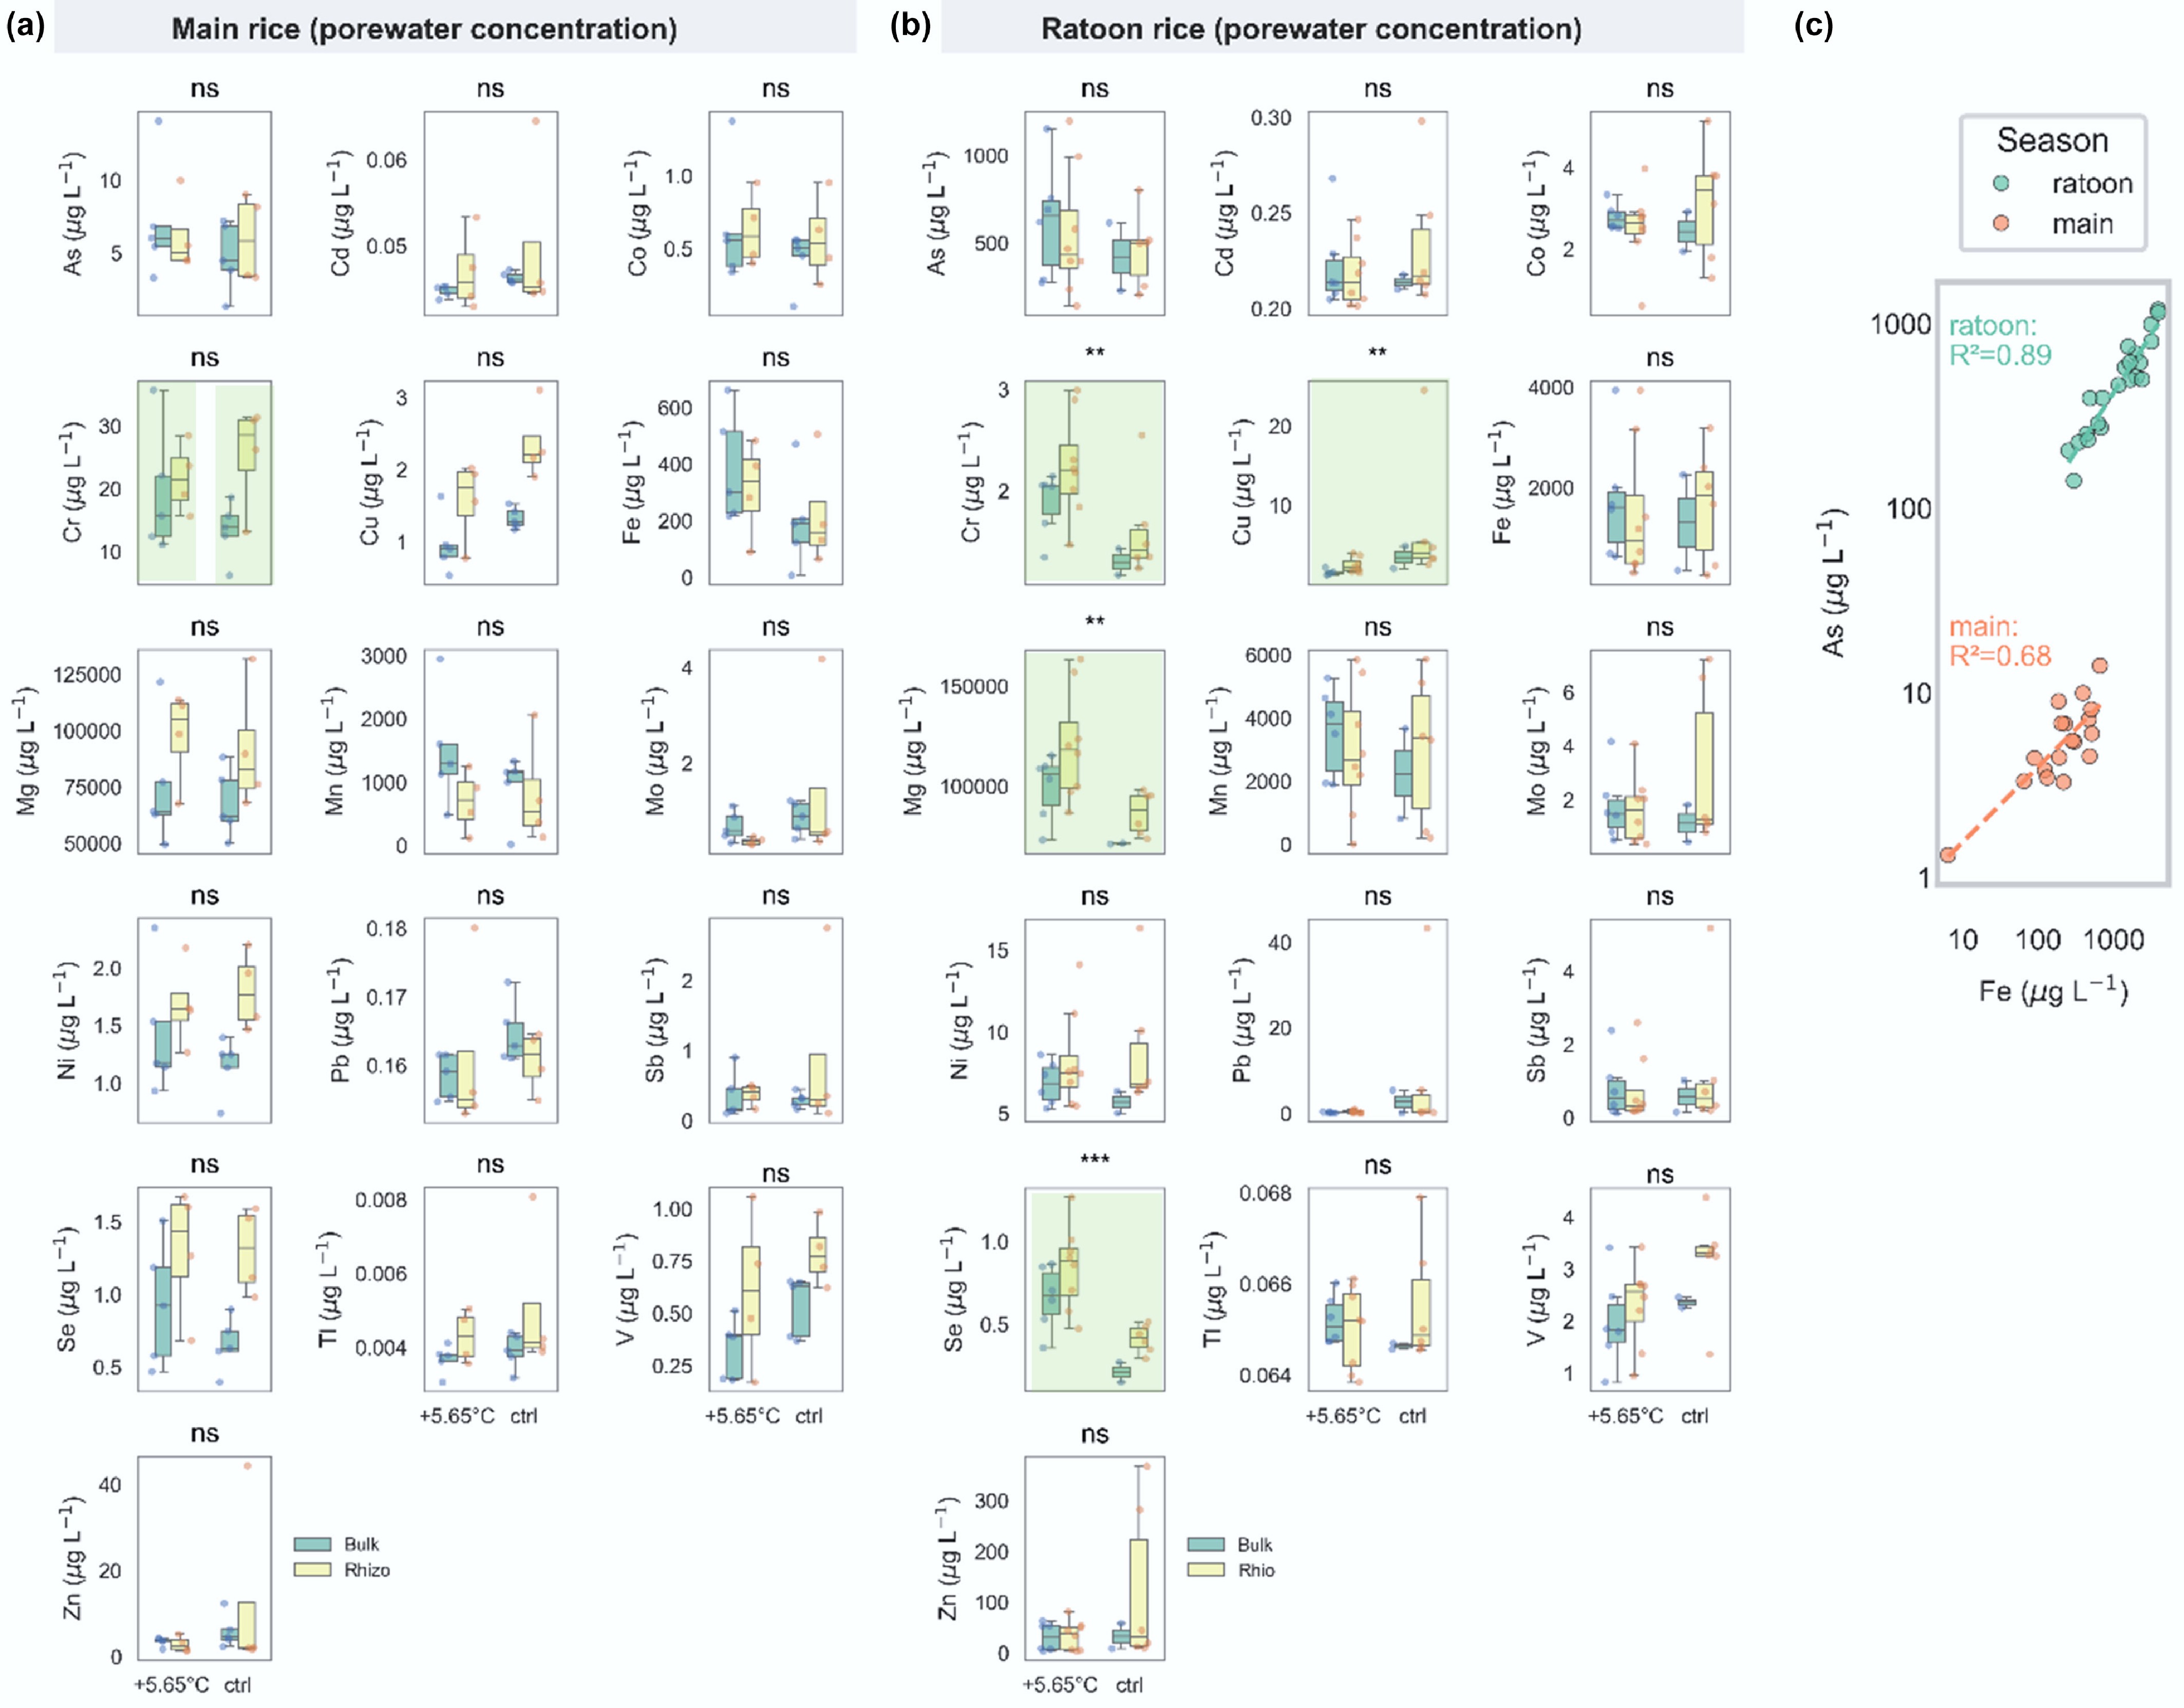
Figure 3.
Porewater elemental concentrations in root- and bulk-zones across main-ratoon cropping season. (a), (b) Boxplots compare porewater concentrations (μg L−1) of trace elements in root zone and bulk soil compartments between warmed (+5.65 °C on seasonal average), and control plots during (a) the main crop stage, and (b) the ratoon crop stage. Each point represents an individual sample; boxes indicate the median and interquartile range, with whiskers extending to 1.5× the IQR. Asterisks and 'ns' indicate not significant between control and +5.65 °C treatments by two-sided Mann–Whitney U test at p = 0.05 level.
-
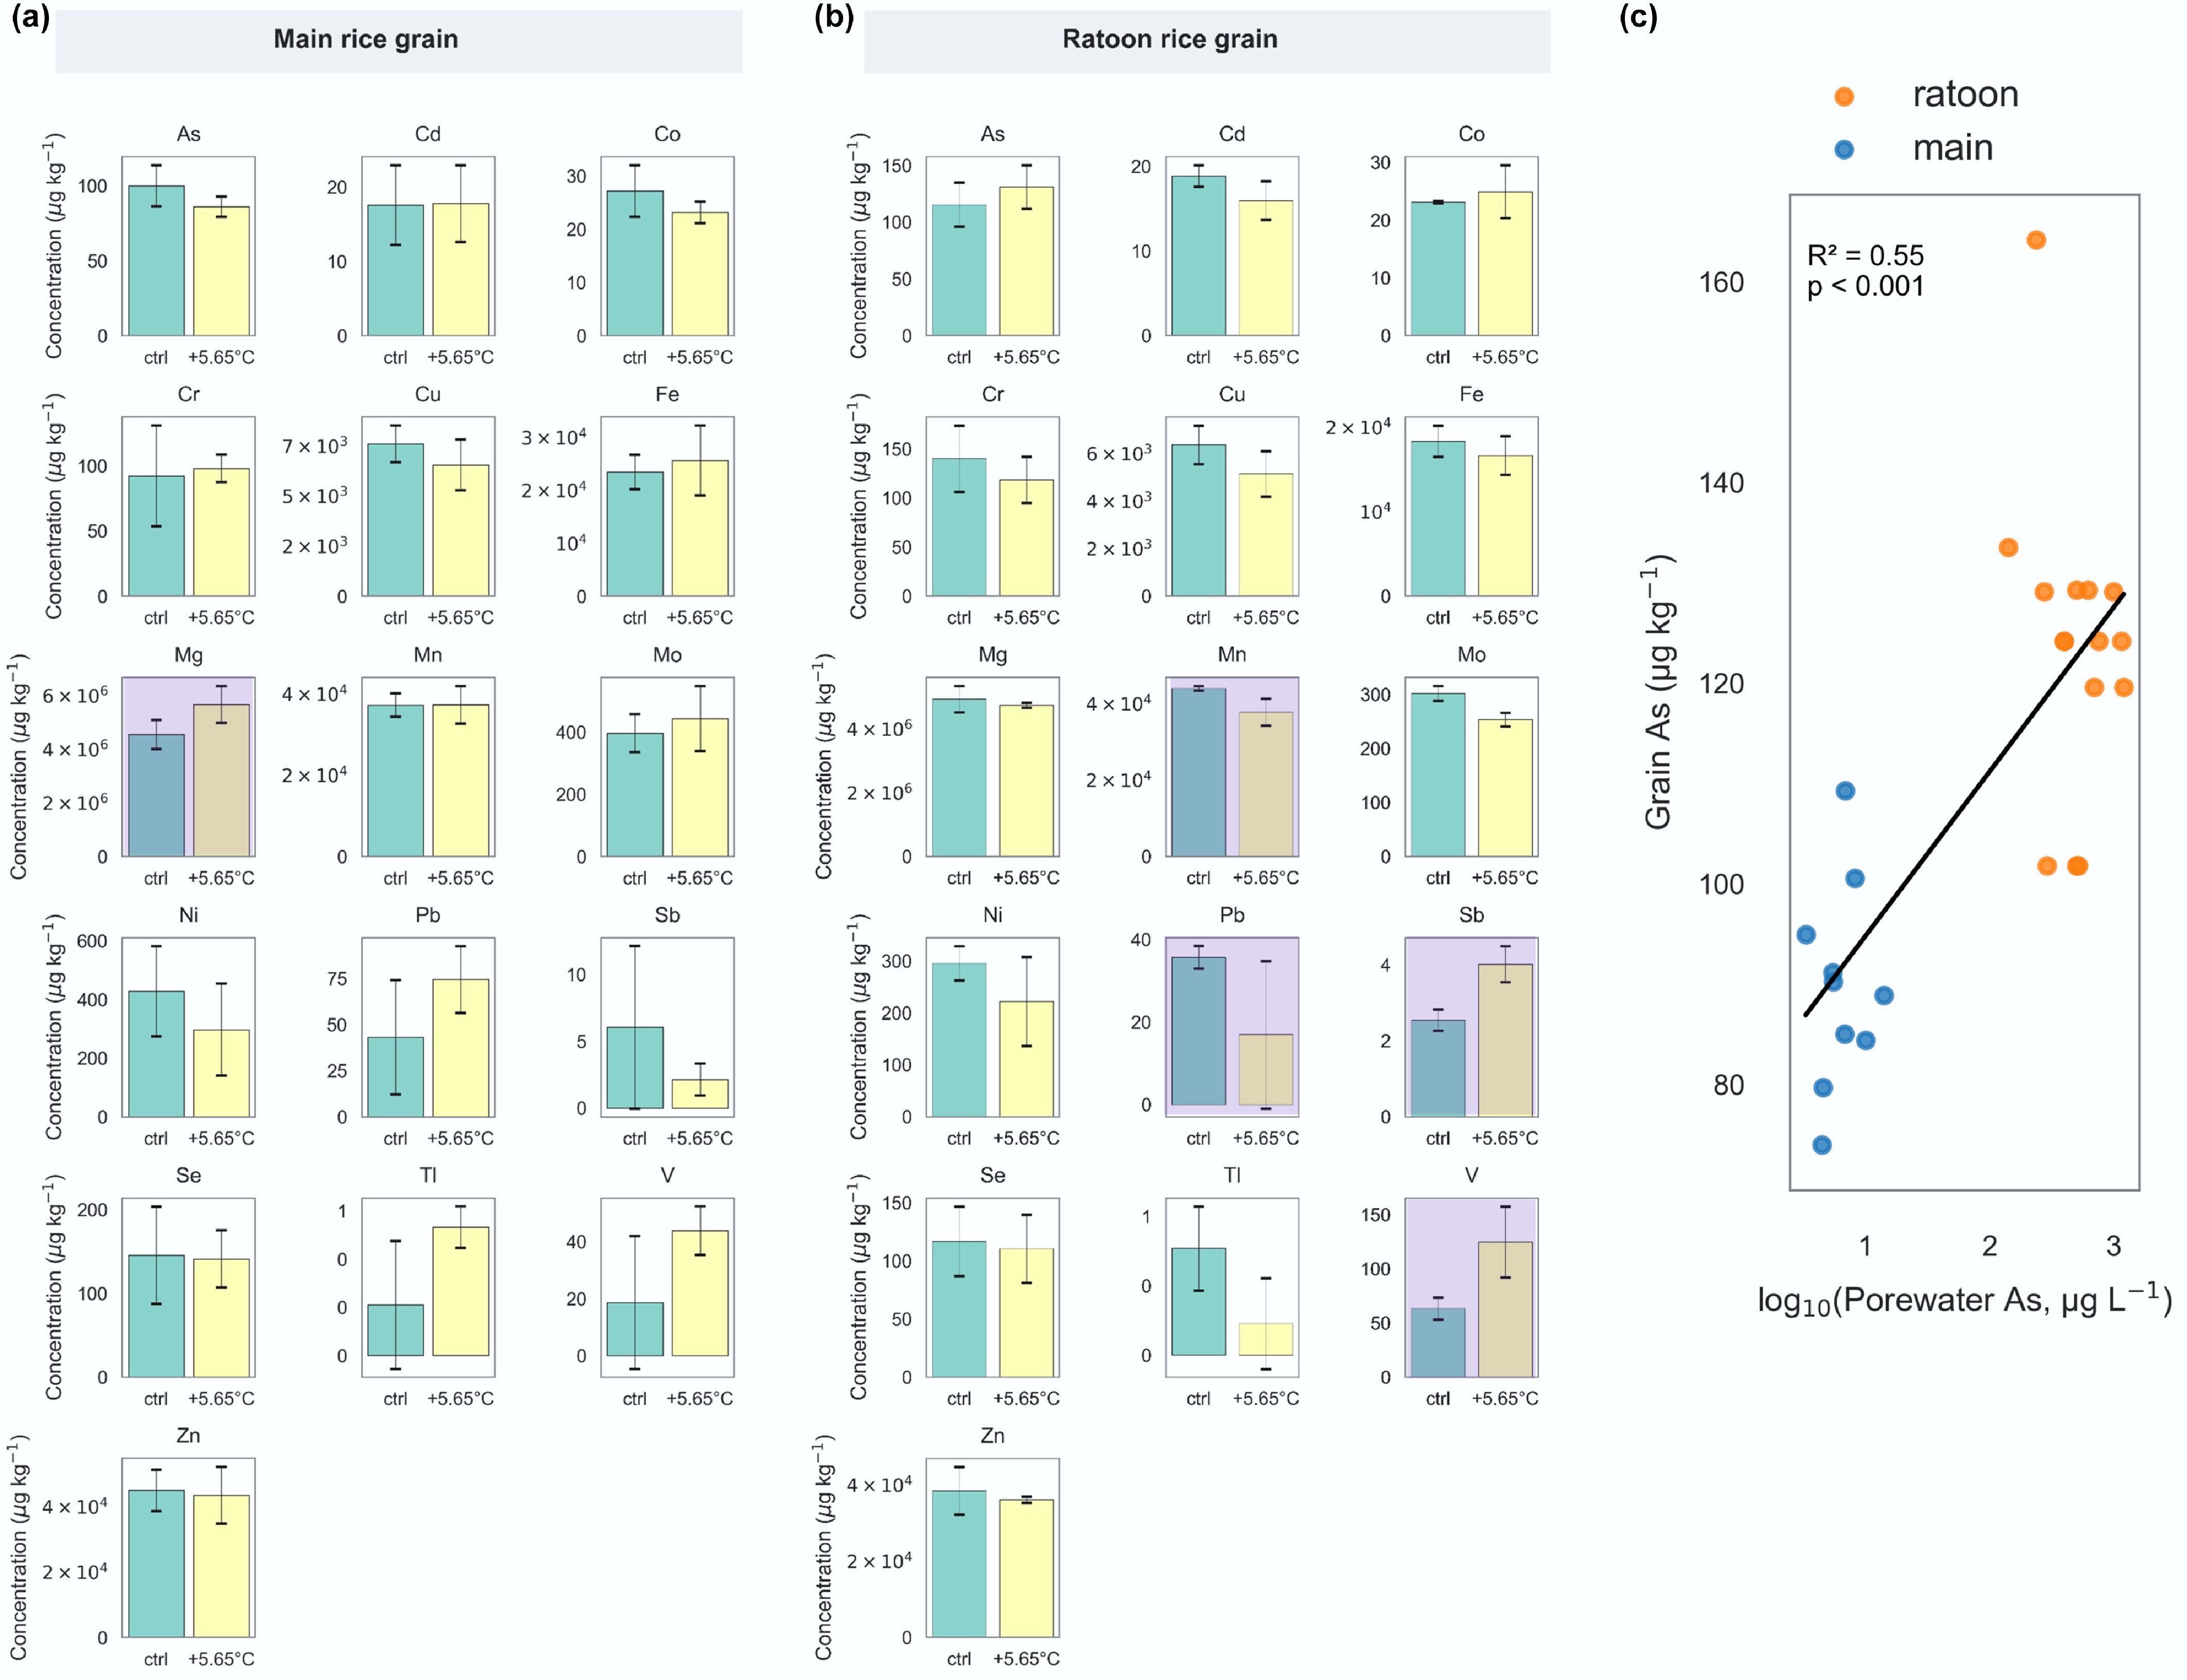
Figure 4.
Elemental concentrations in rice grains grown under contrasting soil temperature regimes. (a), (b) Bar charts show the mean concentrations (μg kg−1 or mg kg−1) of individual elements in rice grains collected from the control and +5.65 °C plots during the main and ratoon crop stages. Error bars represent standard deviations across biological replicates (n = 3–4). Filled subplot charts indicate significant differences at p < 0.05. (c) Linear regression between porewater and rice grain As concentrations across both main and ratoon crop seasons.
-
Study Soil source Experimental
scenarioSoil warming Air warming Number
of varietiesSoil As
(mg kg−1)Key finding Muehe et al., 2019 [1] Paddy field, California, USA Pot study; fixed-temperature incubation +5 °C 33/27 °C vs.
38/33 °C (day/night)1 7.3/24.5 Elevated soil temperature increased porewater As (low As: 170→210 μg L−1; high As: 520→950 μg L−1) and increased grain
As (low As: 393→504 μg kg−1; high As: 821→1,039 μg kg−1). Microbial abundance declined at higher temperature.Yuan et al., 2021[2] Paddy soil, Liuyang, China Pot study; fixed-temperature Air T
dependentFixed 28/33 °C 1 50.8 Grain As increased by 18% (28°C: 2250 μg kg−1; 33°C: 2655 μg kg−1). Neumann et al., 2017[6] Paddy field, California, USA Pot study; fixed-temperature Gradient of
+6 °C (25.4, 26.1, 30.5, 31.4 °C)Fixed
~30.5/23.5 °C1 34 Only minor increases in porewater As (~50 → 100 μg L−1) and no detectable effect on grain As (~200 μg kg−1). Farhat et al., 2021[7] Paddy field, California, USA Pot study; fixed-temperature Air T
dependentFour treatments: 25.4/22.6 °C; 27.9/25.8 °C; 30.5/28.9 °C; 32.9/31°C (day/night) 1 7.7 Grain As (50–200 μg kg−1) increased linearly with increasing temperature. Wang et al., 2025[37] Paddy field, Nanjing, China Field experiment Air T
dependentAmbient vs. +2 °C 28 10 Across 10 seasons, grain As
(~240 μg kg−1) increased by
56 μg kg−1 under +2 °C warming.Arao et al., 2017[3] Paddy field, Ibaraki, Japan Field experiment Ambient Ambient
(22→29 °C seasonal shift)1 1.9 Elevated temperature increased grain As (100–240 μg kg−1). This study Paddy soil, Suzhou, China Controlled mesocosm 0–10 °C
(north-to-south gradient)Ambient
(Tmax > 40 °C)1 8.5 Soil As was the dominant
factor determining grain As.
In the main crop, grain As averaged 86.1 μg kg−1 (+5.65 °C) vs. 99.9 μg kg−1 (control). In the ratoon crop, grain As increased
to 131.0 μg kg−1 (+5.65 °C) and 115.5 μg kg−1 (control).Table 1.
Summary of key studies evaluating rice grain arsenic responses to soil or air warming
Figures
(4)
Tables
(1)