-
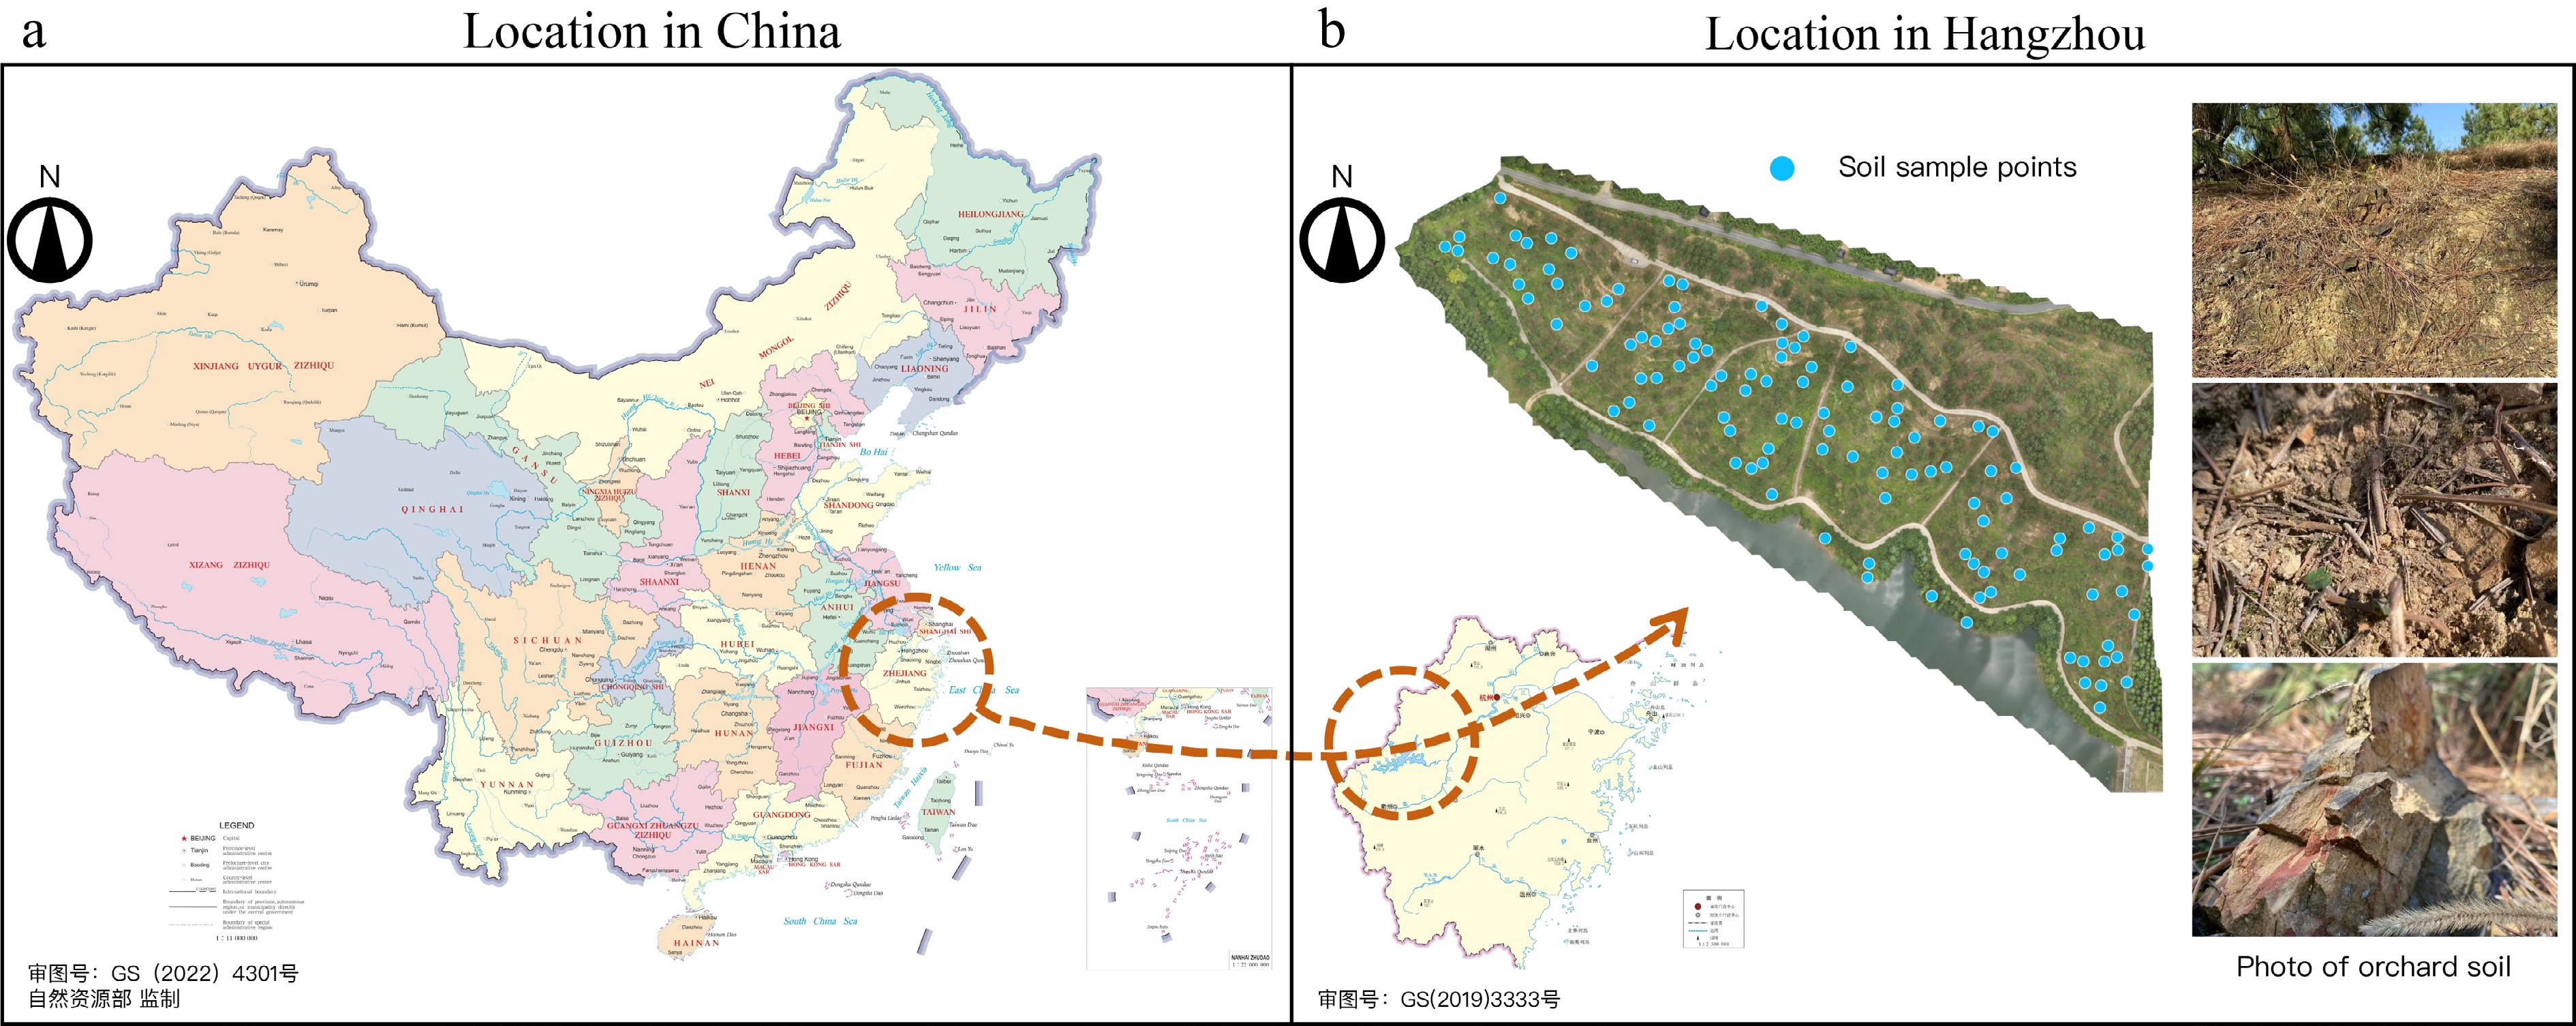
Figure 1.
(a) The experimental trial was in Changle State-owned Forest Farm, Hangzhou, Zhejiang Province, China. (b) The soil sampling points are the blue points, with a total of 115. The predominant soil is classified as red gravel soil. Source:
http://bzdt.ch.mnr.gov.cn/index.html -
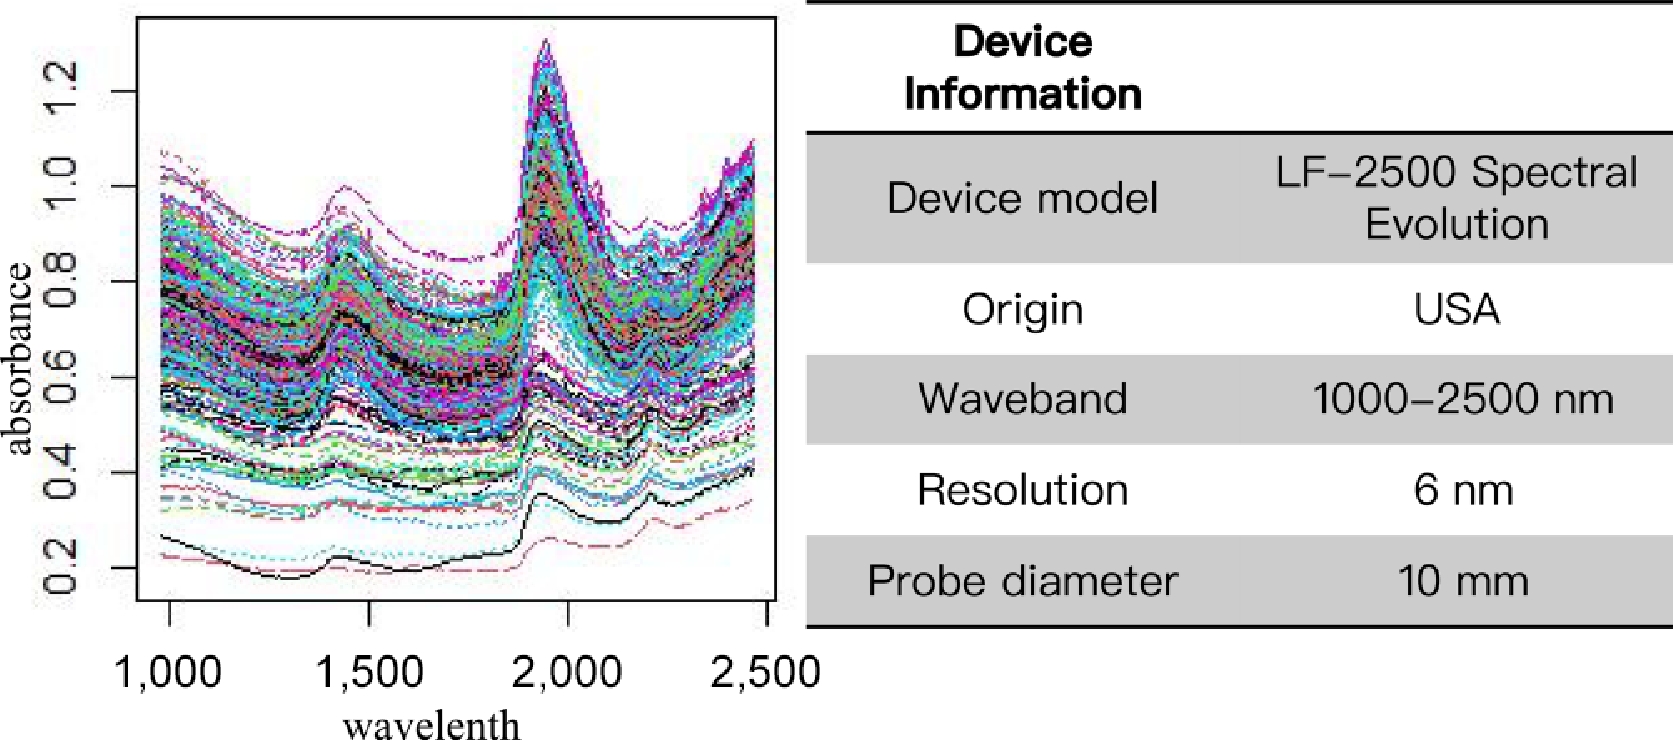
Figure 2.
(left) Visualization of the spectral data collected in the present study, and (right) basic information about the acquisition device. The measured near-infrared spectra cover the wavelength range 976.3–2,528.8 nm with a spectral resolution of 6 nm.
-
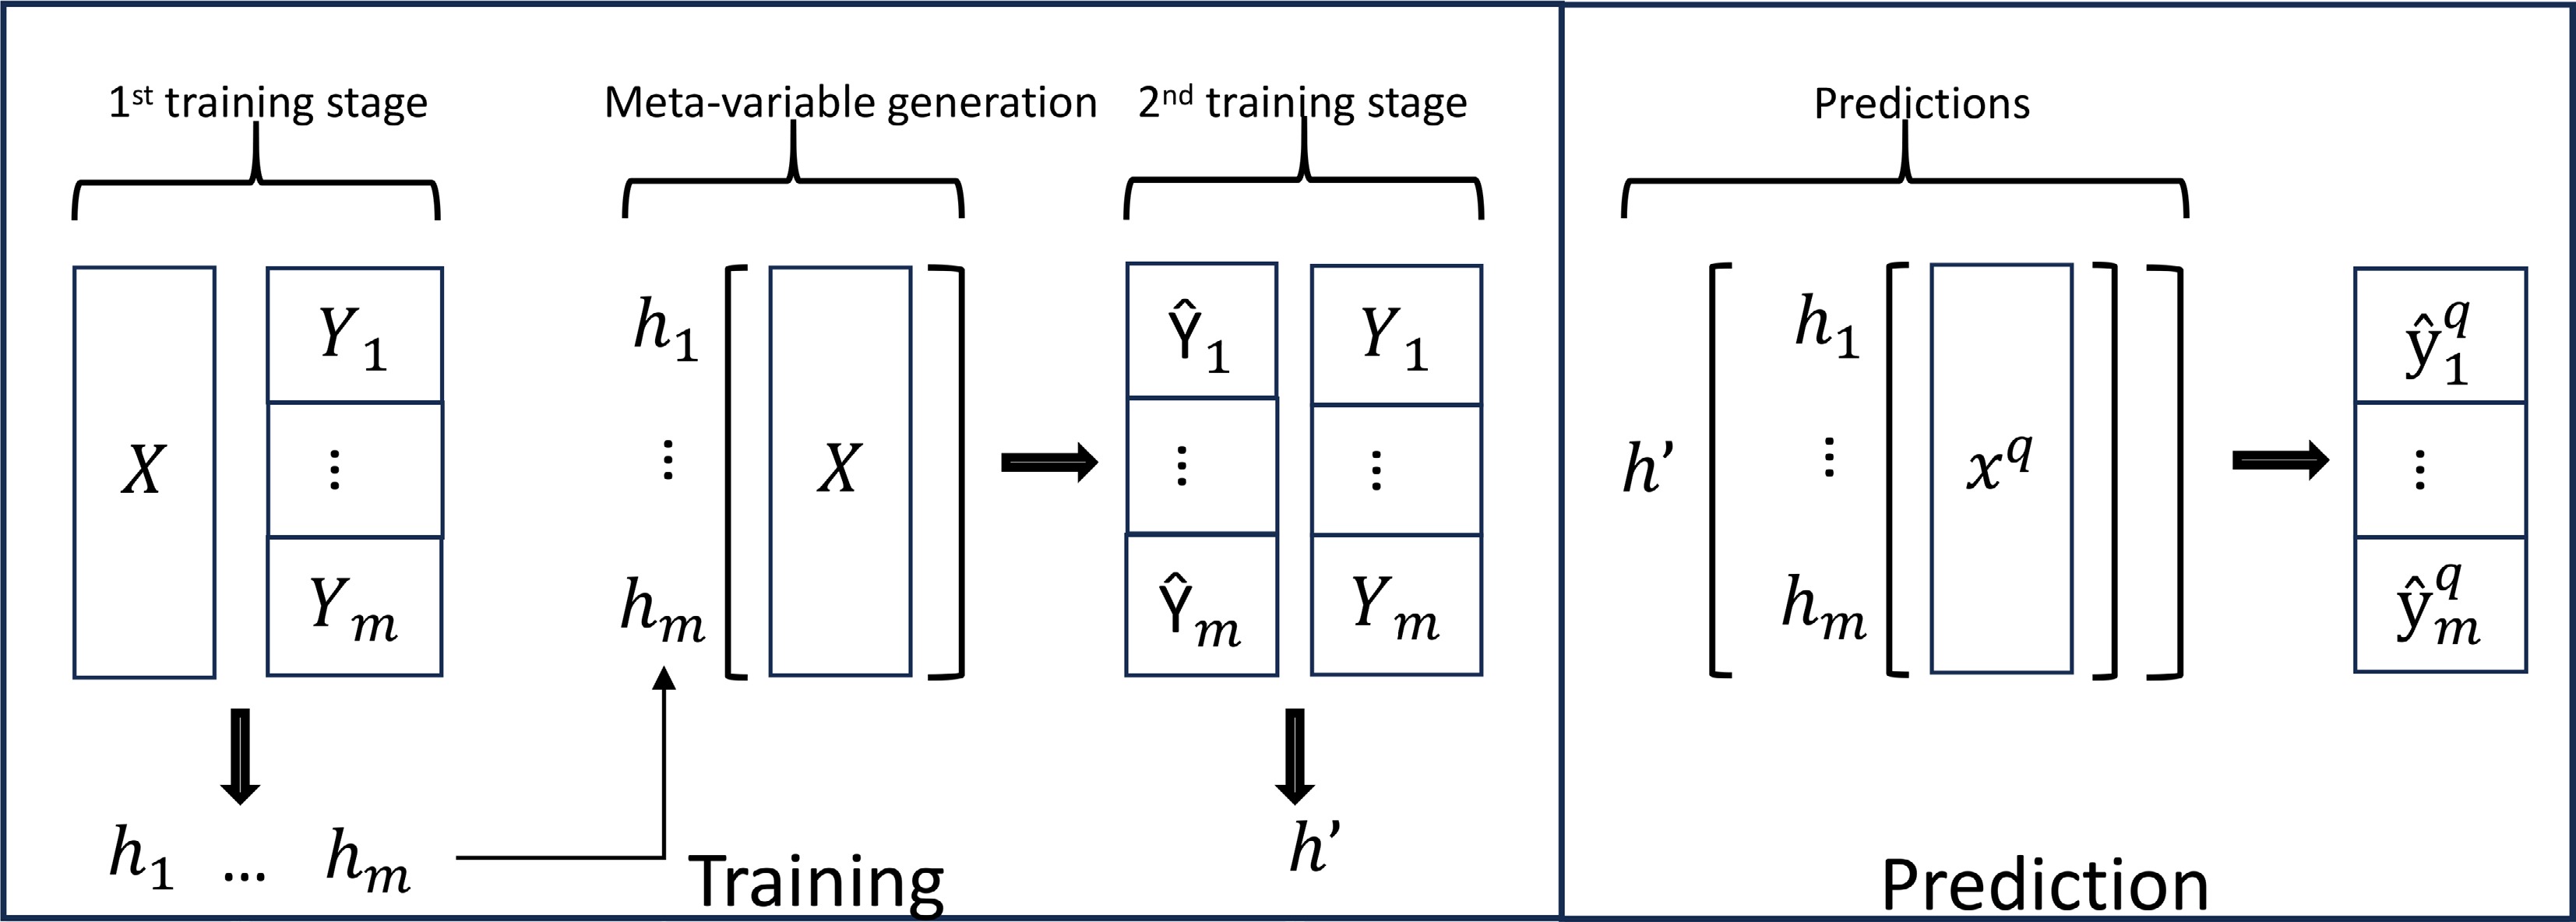
Figure 3.
The model consists of two parts, the base model (hj) and the meta-model (h'). Base model hj is created for each target first, and then the predicted values of the base model are used to create a meta-model h' using the neural network as the framework. When predicting an unknown value xq, the data will first enter the base model and generate a predicted value and then enter the meta-model to generate the final predicted value
$\hat yq $ $ \in $ -
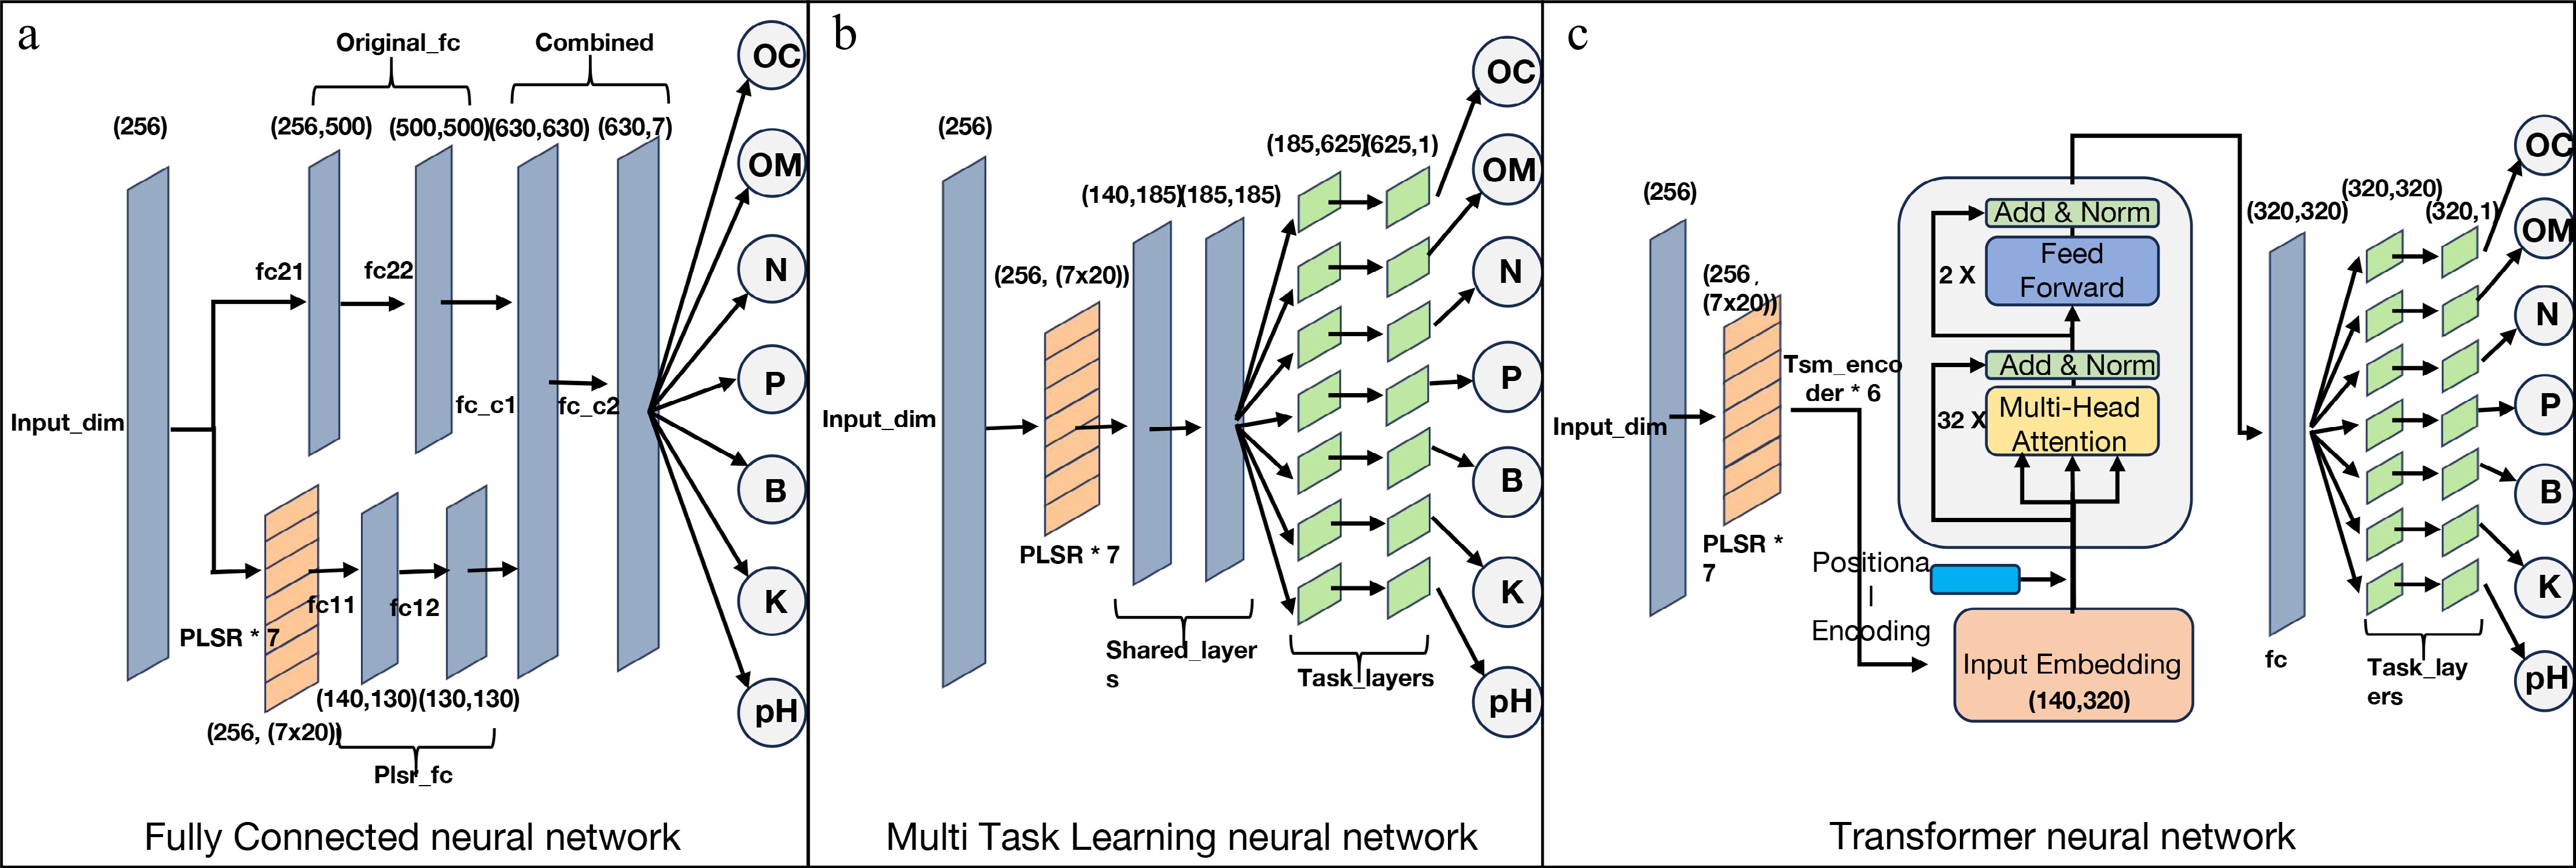
Figure 4.
Three types of hybrid neural network structures including PLSR model group. (a) Fully connected neural network; (b) multi-task learning neural network; (c) transformer neural network. The numbers in the figure mark the input and output dimensions of each layer of neural network. The letters are the name of the neural network of this layer, and the number of neurons are shown in Table 2.
-
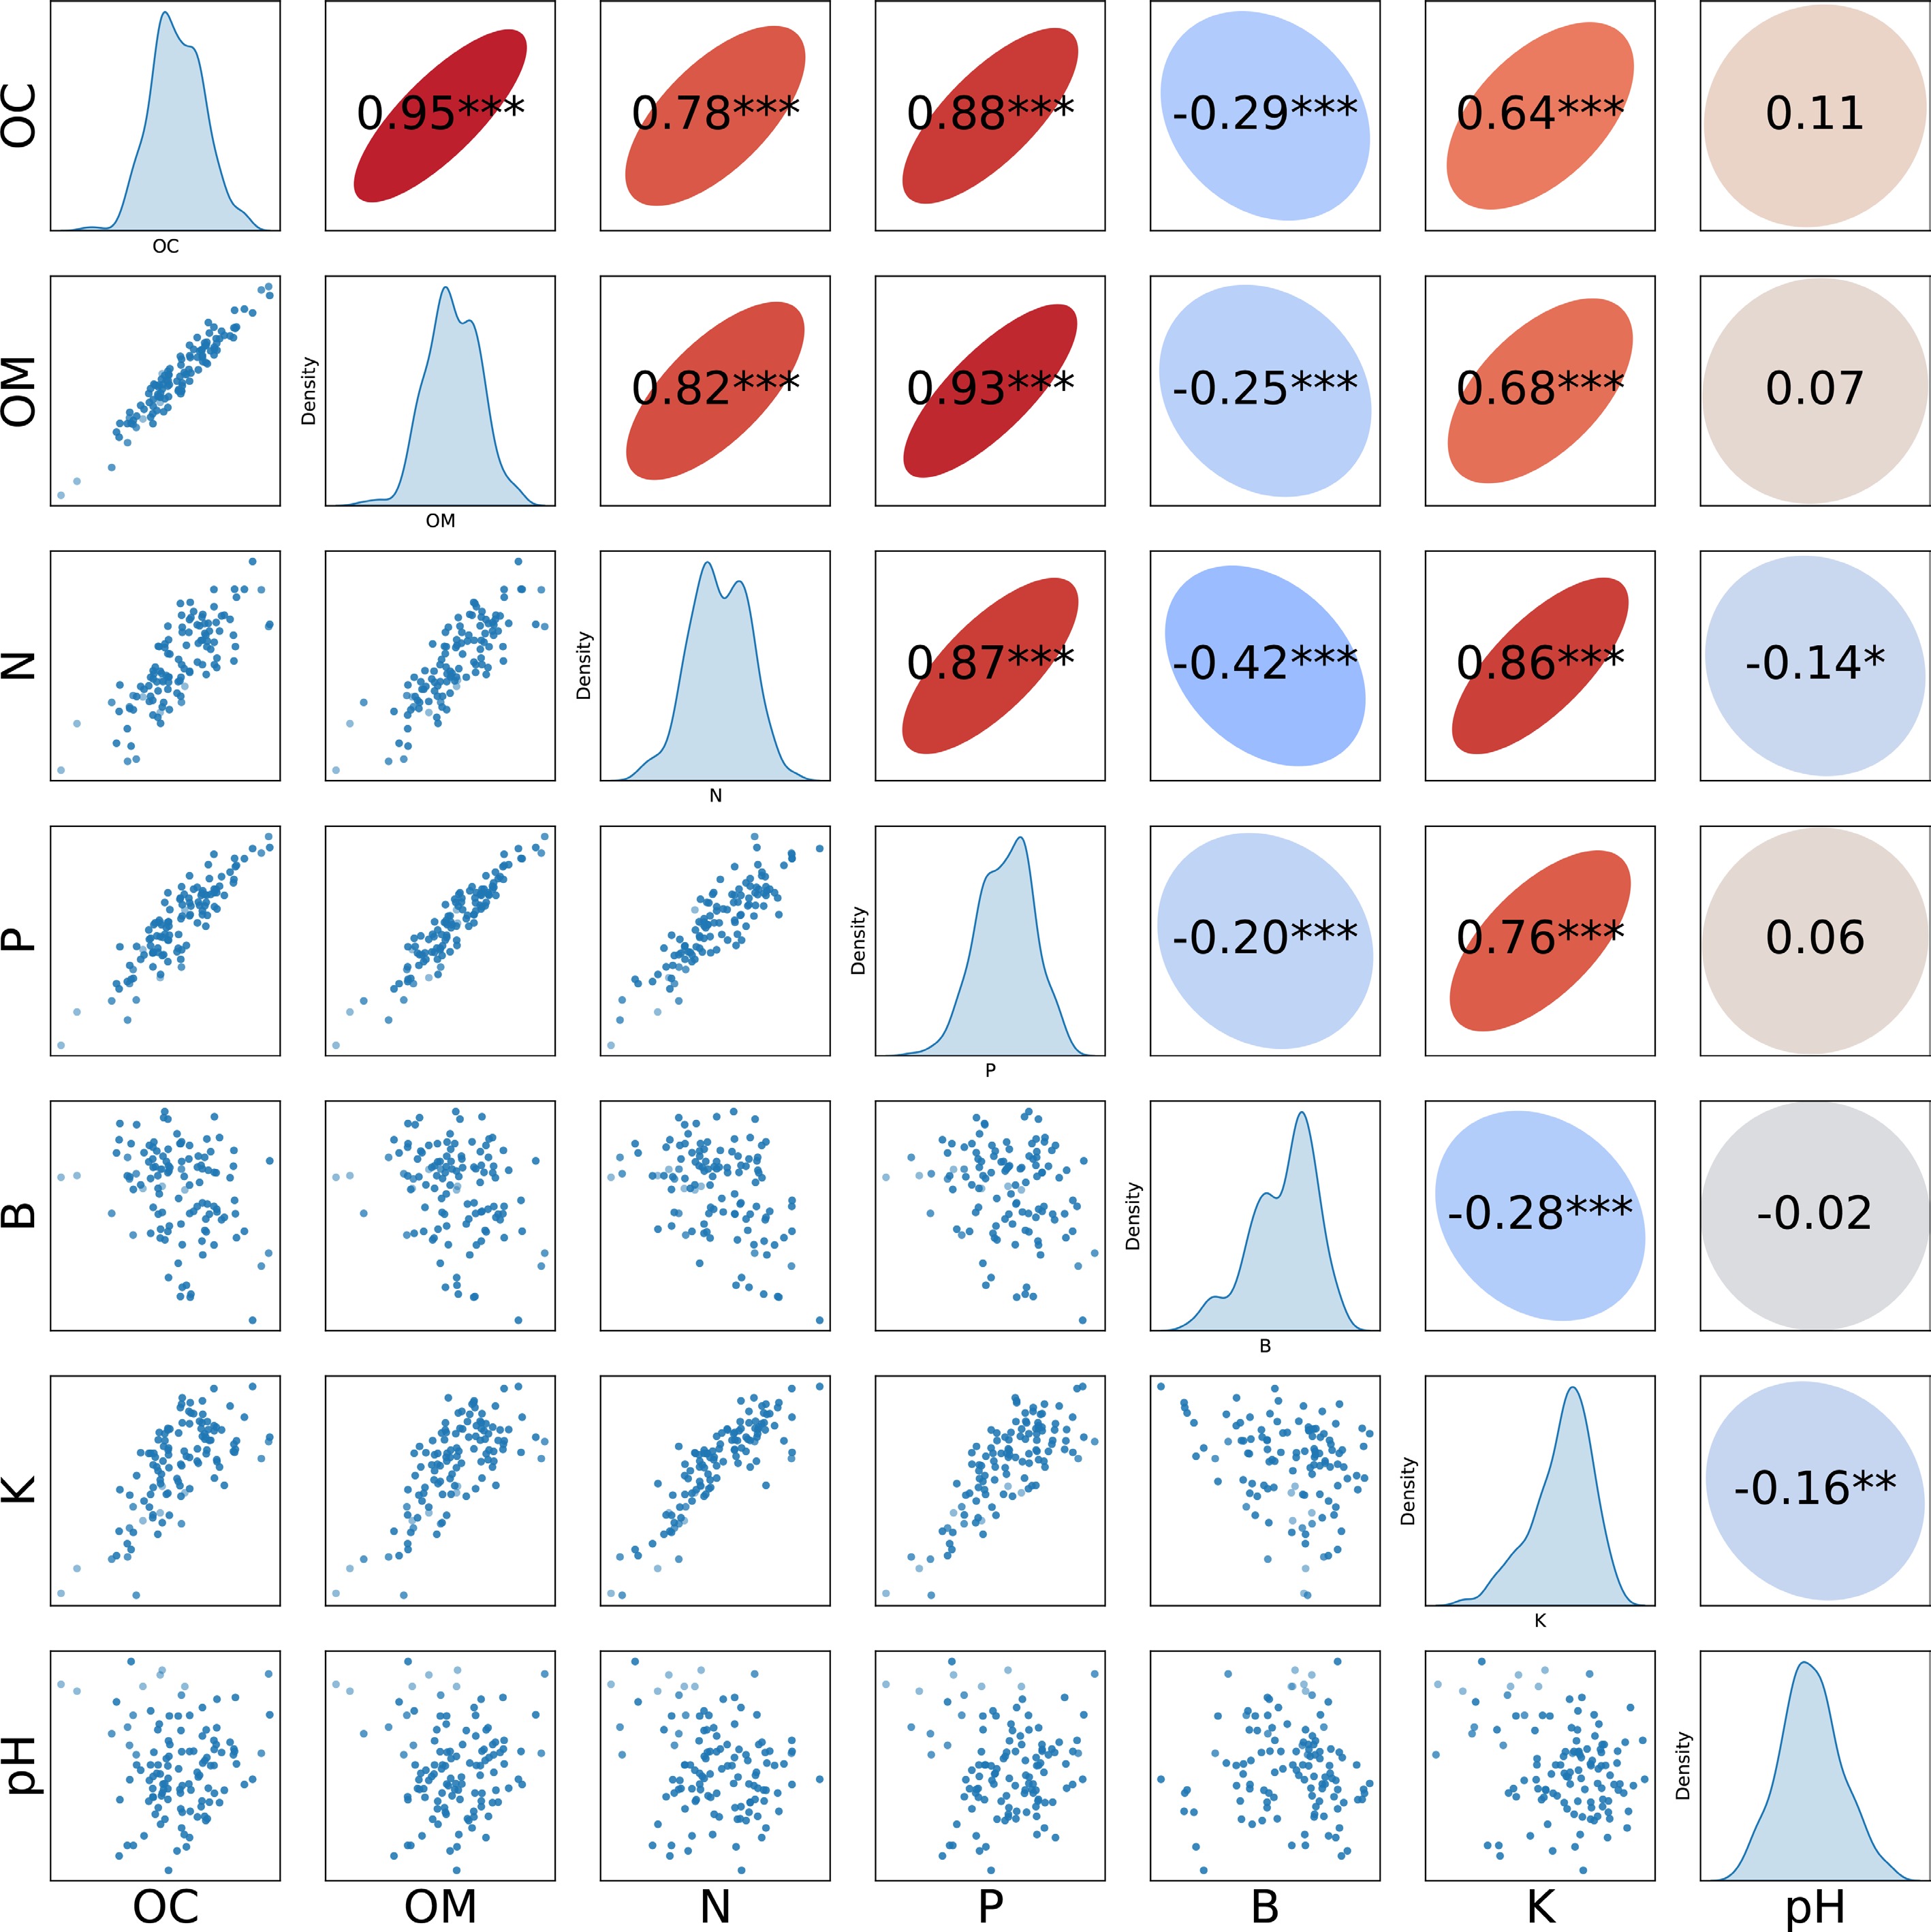
Figure 5.
Scatterplot of seven soil components (lower half), kernel density estimation (diagonal), correlation (upper half). *** p < 0.001; ** p < 0.01; * p < 0.05.
-
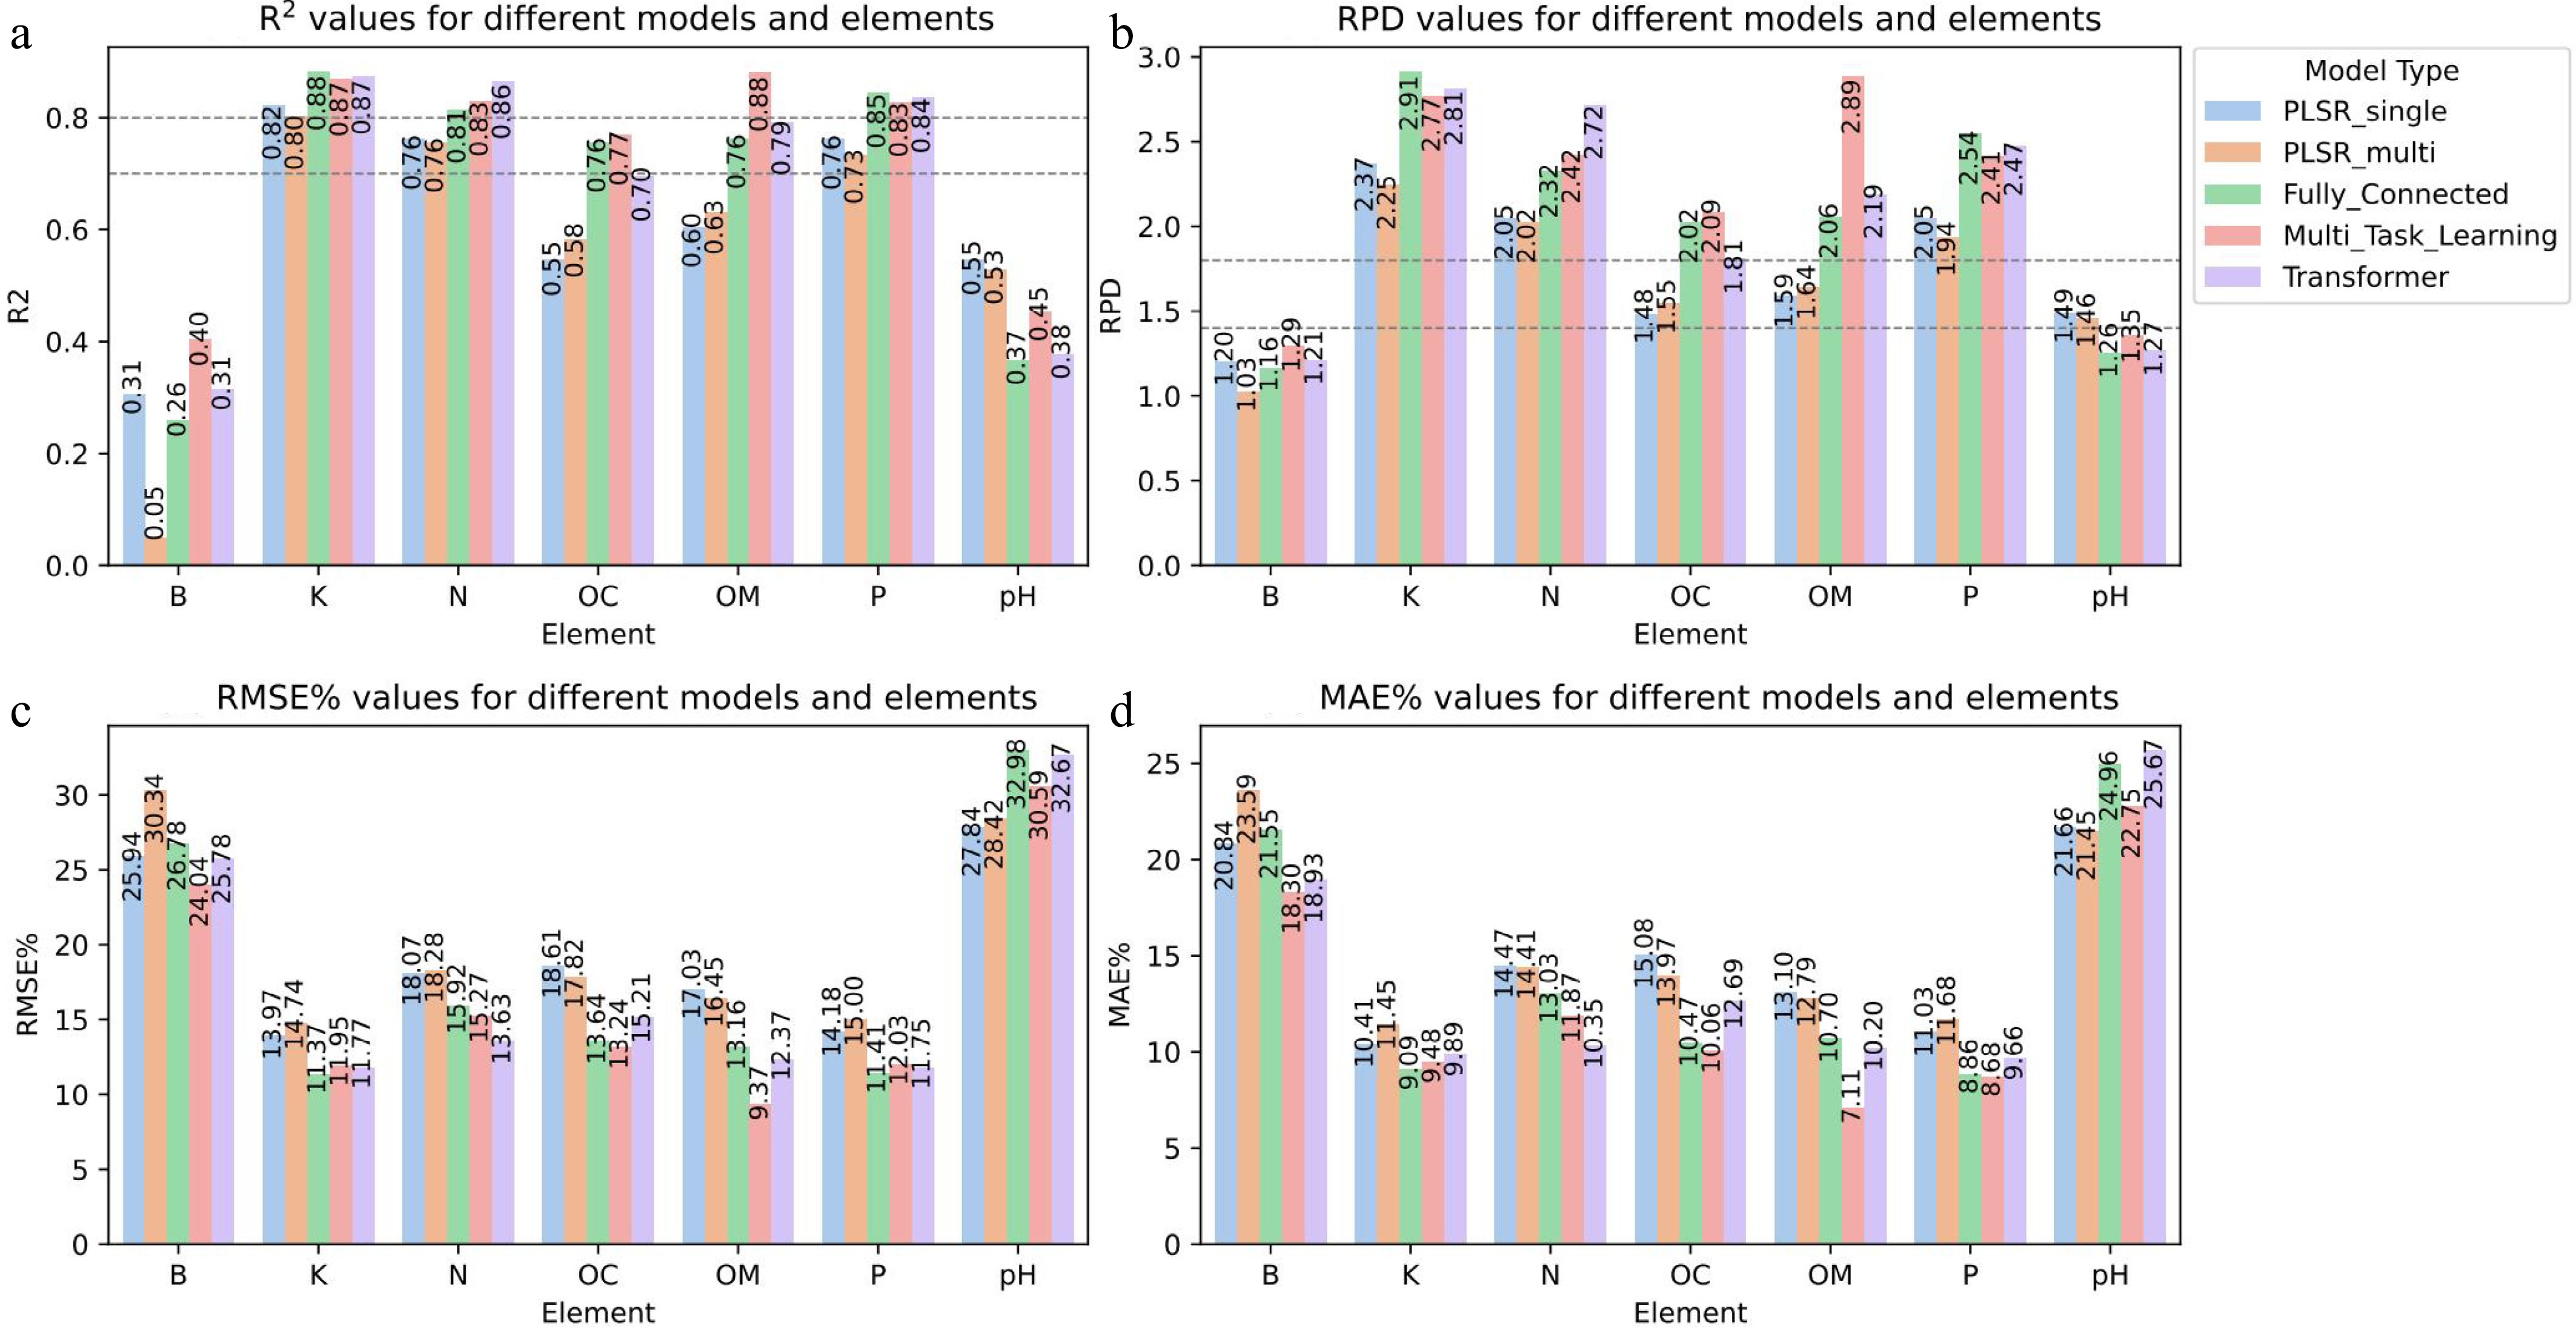
Figure 6.
The figure shows the R2, RPD, RMSE%, and MAE% values of seven soil elements in five models respectively. The dotted line shown in R2 is the threshold of the coefficient of determination. When the R2 of the model is larger than 0.7, it indicates that the model has good prediction ability for this set of data. When the R2 of the model is larger than 0.8, it indicates that the model has excellent predictive ability for this set of data. The dotted line displayed in RPD is the threshold of relative analysis error. When the RPD value is between 1.4 and 1.8, it indicates that the model's prediction ability is average. When the RPD value is larger than 1.8, it indicates that the model can make good predictions.
-
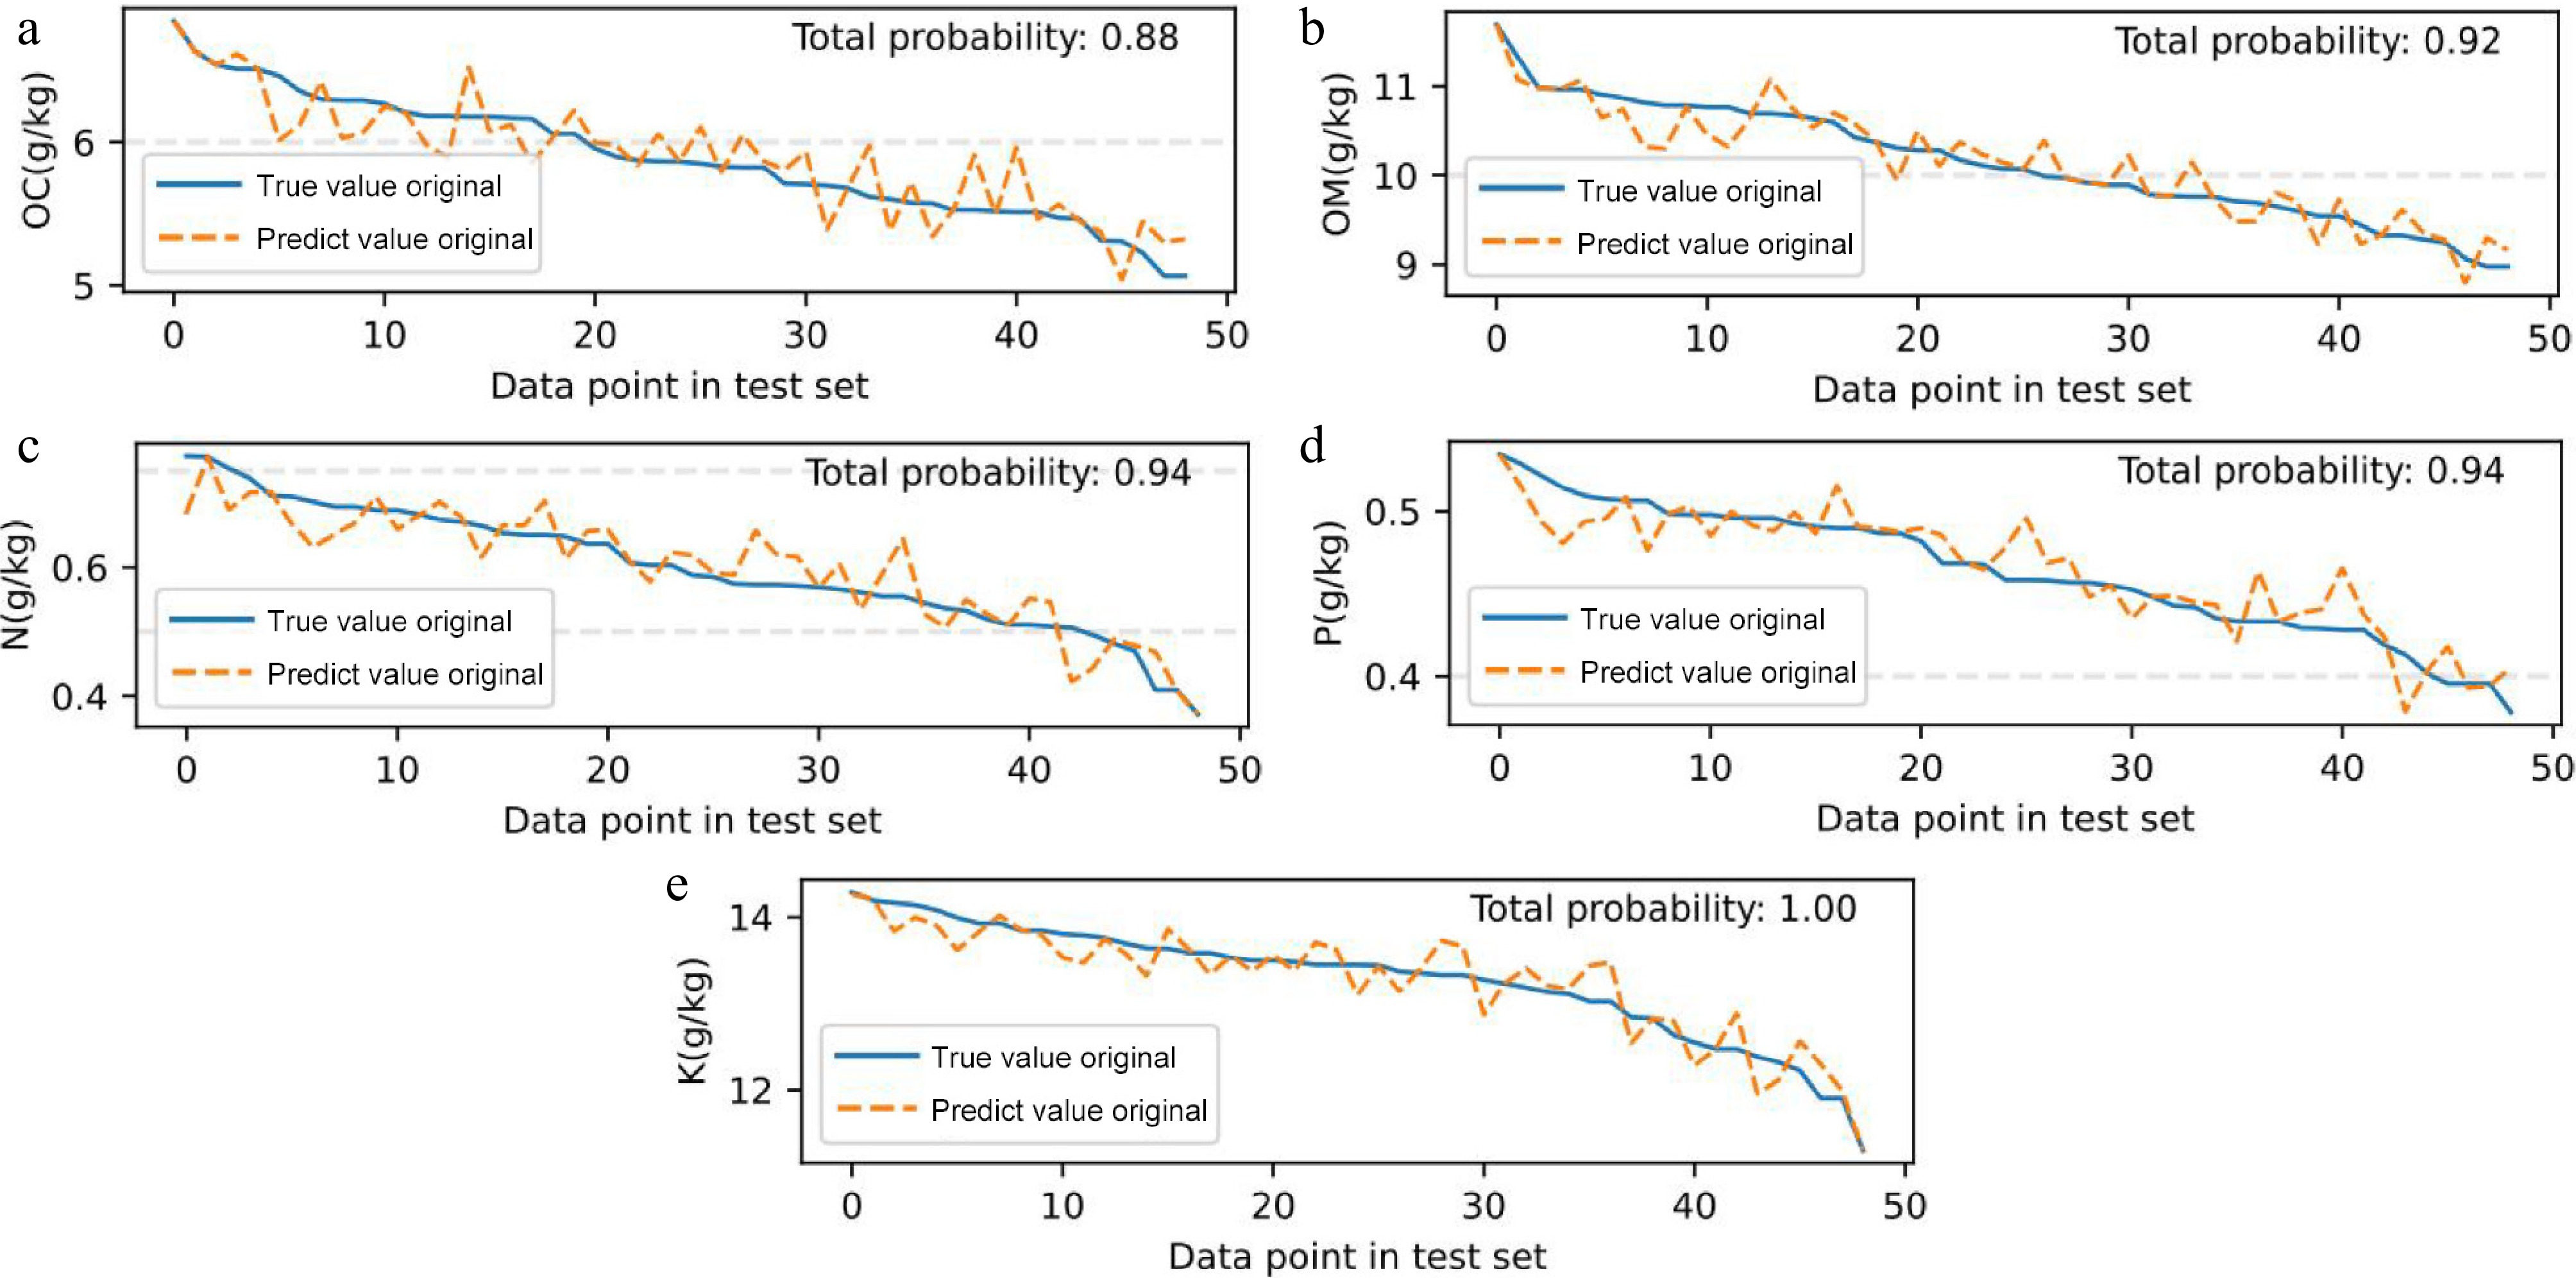
Figure 7.
Comparison of MTL predicted and true values of (a) OC, (b) OM, (c) N, (d) P, and (e) K in the test set. The dotted lines in the figure represent the thresholds for grading soil nutrients in China's second national soil census. The Y-axis represents the nutrient content of the soil sample points, and the X-axis arranges the data of the sample points in descending order according to the true value to achieve a more intuitive performance. The upper right corner is the probability that the model divided the soil nutrients into the correct level.
-
Soil element Testing method Organic Matter (OM) Loss on Ignition (LOI) Organic Carbon (OC) Dry Combustion-Infrared Spectrometry Total Nitrogen (N) Semi-micro Kjeldahl Total Phosphorus (P) Molybdenum blue colorimetry Total Potassium (K) Hydrofluoric Acid Available Boron (B) Azomethine-H colorimetric pH value Potentiometer Table 1.
Laboratory analysis methods used to detect the content of seven soil elements.
-
Model Search range Hyper-parameters FC Plsr_fc 50−1,000 130 Original_fc 50−1,000 500 Combined 50−1,000 630 Output Fixed 7 Batch_size 16−64 32 Initial_lr 1.00E-05 to 1.00E-02 1.50E-04 Epoch 100−1,000 700 MTL Shard_layers 50−500 185 Task_layers 200−1,000 625*7 Output Fixed 1*7 Batch_size 16−64 32 Initial_lr 1.00E-04 to 1.00E-02 1.00E-03 Epoch 500−5,000 3,000 TSM Input_embedding 128−512 320 nhead 4−64 32 d_model 128−512 320 Encoder_num 2-12 6 Task_layers 200−1,000 320*7 Output Fixed 1*7 Batch_size 16−64 32 Initial_lr 1.00E-05 to 1.00E-03 1.00E-04 Epoch 500−2,000 1,300 Table 2.
Hyperparameter selection for three hybrid models. All hyperparameters are filtered by the Optuna hyperparameter filter and fine-tuned manually.
-
Statistic OC (g/kg) OM (g/kg) N (g/kg) P (g/kg) B (mg/kg) K (g/kg) pH Maximum value (Max) 6.9491 11.7562 0.8383 0.5521 0.6615 14.4560 5.4118 Minimum value (Min) 4.3854 7.7722 0.3456 0.3300 0.5169 11.3024 4.5962 Mean value (Mean) 5.8620 10.0869 0.6043 0.4628 0.6070 13.3284 4.9814 Median value (50%) 5.8561 10.0706 0.5951 0.4638 0.6161 13.4462 4.9723 Standard deviation (STD) 0.4249 0.6617 0.0927 0.0395 0.0311 0.6191 0.1642 Table 3.
Laboratory tests for soil composition include maximum (Max), minimum (Min), mean (Mean), median (50%), and standard deviation (STD).
-
Nutrient Grade 1 threshold Grade 3 threshold Fertilizer recommendation Critical application period P > 0.5 g/kg < 0.4 g/kg 40 g P2O5/tree Spring bud differentiation K > 14 g/kg < 12 g/kg 35 g KCl/tree Early rainy season N > 0.7 g/kg < 0.5 g/kg Reduce 30% N fertilizer Avoid summer application Table 4.
Soil nutrient grading and fertilization guidelines.
Figures
(7)
Tables
(4)