


-
Slash pine (Pinus elliottii Engelm.) seed orchards are critical for supplying genetically superior germplasm to support afforestation and carbon sequestration programs in southern China[1,2]. For established orchards in their prime production phase, effective nutrient management through fertilization is one of the most practical levers for enhancing seed yield[3], with studies in conifer species demonstrating over 18% gains in seed and kernel weight from optimized fertilization[4].
There are limited options for improving seed orchard yields. During the pre-establishment phase, cultivation materials can be selected. Meanwhile, in the early establishment phase, the seed orchard can undergo thinning and topping. However, for many seed orchards in their prime production period, tending and fertilization remain the most effective ways to increase yields[3,5]. Yet, traditional fertilization, which is often based on experience, is unsustainable[6]. Consequently, precision fertilization is urgently needed to prevent fertilizer pollution during large-scale afforestation[7]. Precision fertilization has arisen as a scientific and environmentally friendly strategy to address the issues of under- and over-fertilization[8,9]. For seed orchards, soil texture varies across regions. Thus, a refined soil condition assessment method should be established specifically for seed orchards. Traditional approaches to understanding forest soil nutrients involve collecting soil samples and conducting chemical analysis in laboratories. The specialized methods required for different elements result in extended detection times and elevated costs, which hinder the widespread adoption of precision fertilization[10]. While the application of machine learning in soil composition prediction is gaining traction[11,12], research focusing on soil composition prediction models for seed orchards remains scarce. The primary challenge in developing precision fertilization models for seed orchards stems from their characteristically small scale, which is intentionally designed for seed production and scientific research. These orchards, typically under 10 hectares in size, exhibit high spatial heterogeneity but yield limited soil sample sizes, often fewer than 200. This data scarcity is a critical constraint, as conventional machine learning models generally require larger datasets of over 500 samples to mitigate overfitting[13]. Despite the proven efficacy of Near-Infrared (NIR) spectroscopy for rapid soil assessment in broad agriculture[14], dedicated, data-efficient modeling frameworks tailored to the specific context of seed orchards remain scarce.
Previous efforts to predict soil properties from spectroscopic data have relied heavily on traditional Partial Least Squares Regression (PLSR), which has been widely used to estimate soil organic matter as well as macronutrients such as nitrogen, phosphorus, and potassium, owing to its robustness under high-dimensional, collinear conditions[15,16]. However, the linear nature of PLSR limits its ability to capture complex non-linear relationships and interactions in soil–spectra responses. To improve predictive performance, many studies have explored alternative machine learning models, including random forests, support vector machines, gradient boosting algorithms and artificial neural networks, often in combination with different spectral and feature-analysis techniques such as visible–near-infrared (VIS–NIR)[17,18], mid-infrared (MIR), and hyperspectral imaging, together with principal component analysis, variable importance in projection (VIP) or band-selection methods[19,20]. While these approaches have enhanced soil nutrient prediction in various agricultural settings, they typically require relatively large sample sizes to avoid overfitting, and their applicability and stability remain uncertain in small, highly heterogeneous seed orchards.
To address this challenge, this study turns to Multi-target Regression (MTR), an inductive transfer method that leverages the domain-specific information embedded within the training signals of related tasks. We hypothesize that by exploiting the inherent correlations between different soil nutrients, MTR can implicitly expand the effective data volume and bolster generalization, thereby mitigating over-fitting risks in data-scarce contexts[21,22]. The implementation of an effective MTR framework, however, necessitates an organizational structure capable of coordinating multiple tasks and facilitating generalization learning. For this purpose, neural networks present a favorable choice, as their architecture has been demonstrated to foster robust generalization learning across various tasks[23−25].
Within a stacked generalization architecture, the choice of base model is critical. While various machine learning models can serve this role[26], we specifically opted for PLSR. PLSR is a well-regarded algorithm in soil spectroscopy studies[27], prized for its robustness and superior performance with high-dimensional data on limited samples[28,29]. However, PLSR's inherent limitations in complex, non-linear modeling is precisely where the neural network meta-learner complements it, capturing intricate patterns from the PLSR outputs for final prediction.
This integrated modeling approach is supplied by rapid and cost-effective data acquisition using Near-Infrared (NIR) spectroscopy. NIR spectroscopy interacts with fundamental chemical bonds (e.g., C-H, O-H), enabling the analysis of key soil constituents like organic matter and macronutrients[14,29], making it an ideal partner for machine learning-based soil diagnostics. Therefore, by marrying NIR spectroscopy with a novel stacked generalization framework that combines PLSR-base learners and a neural network meta-learner, we aim to create a hybrid model for comprehensive soil nutrient prediction in slash pine seed orchards. Our goals include:
(1) Leveraging hybrid models to address the limited data issue in small-scale site modeling by diversifying data types.
(2) Investigate the predictive ability of hybrid models for different soil elements and the ranking ability of the optimal model.
-
Soil samples for the experiments were sourced from the high-resin-yield slash pine clone seed orchard located at Changle State-owned Forest Farm in Hangzhou City, Zhejiang Province, China (30°18' N, 119°51' E) as shown in Fig. 1. The seed orchard was established using a completely randomized block method, with repetitions assigned to individual plots. This seed orchard, positioned on hillside fields with an elevation variation of approximately 40 m, has been terraced. The predominant soil is classified as red gravel soil, characterized by a gravelly sandy loam texture, high gravel content, low water retention capacity, and common deficiencies in available phosphorus and boron. These soil properties pose significant challenges to slash pine growth: the high gravel content and low water-holding capacity result in a limited reservoir of soil moisture and nutrients, exacerbating seasonal drought stress and consequently impairing photosynthesis and primary growth. Furthermore, deficiencies in critical elements such as phosphorus and boron restrict root development and reproductive organ formation, ultimately adversely impacting resin synthesis and yield. Only minimal amounts of compound fertilizer were applied during subsequent maintenance.
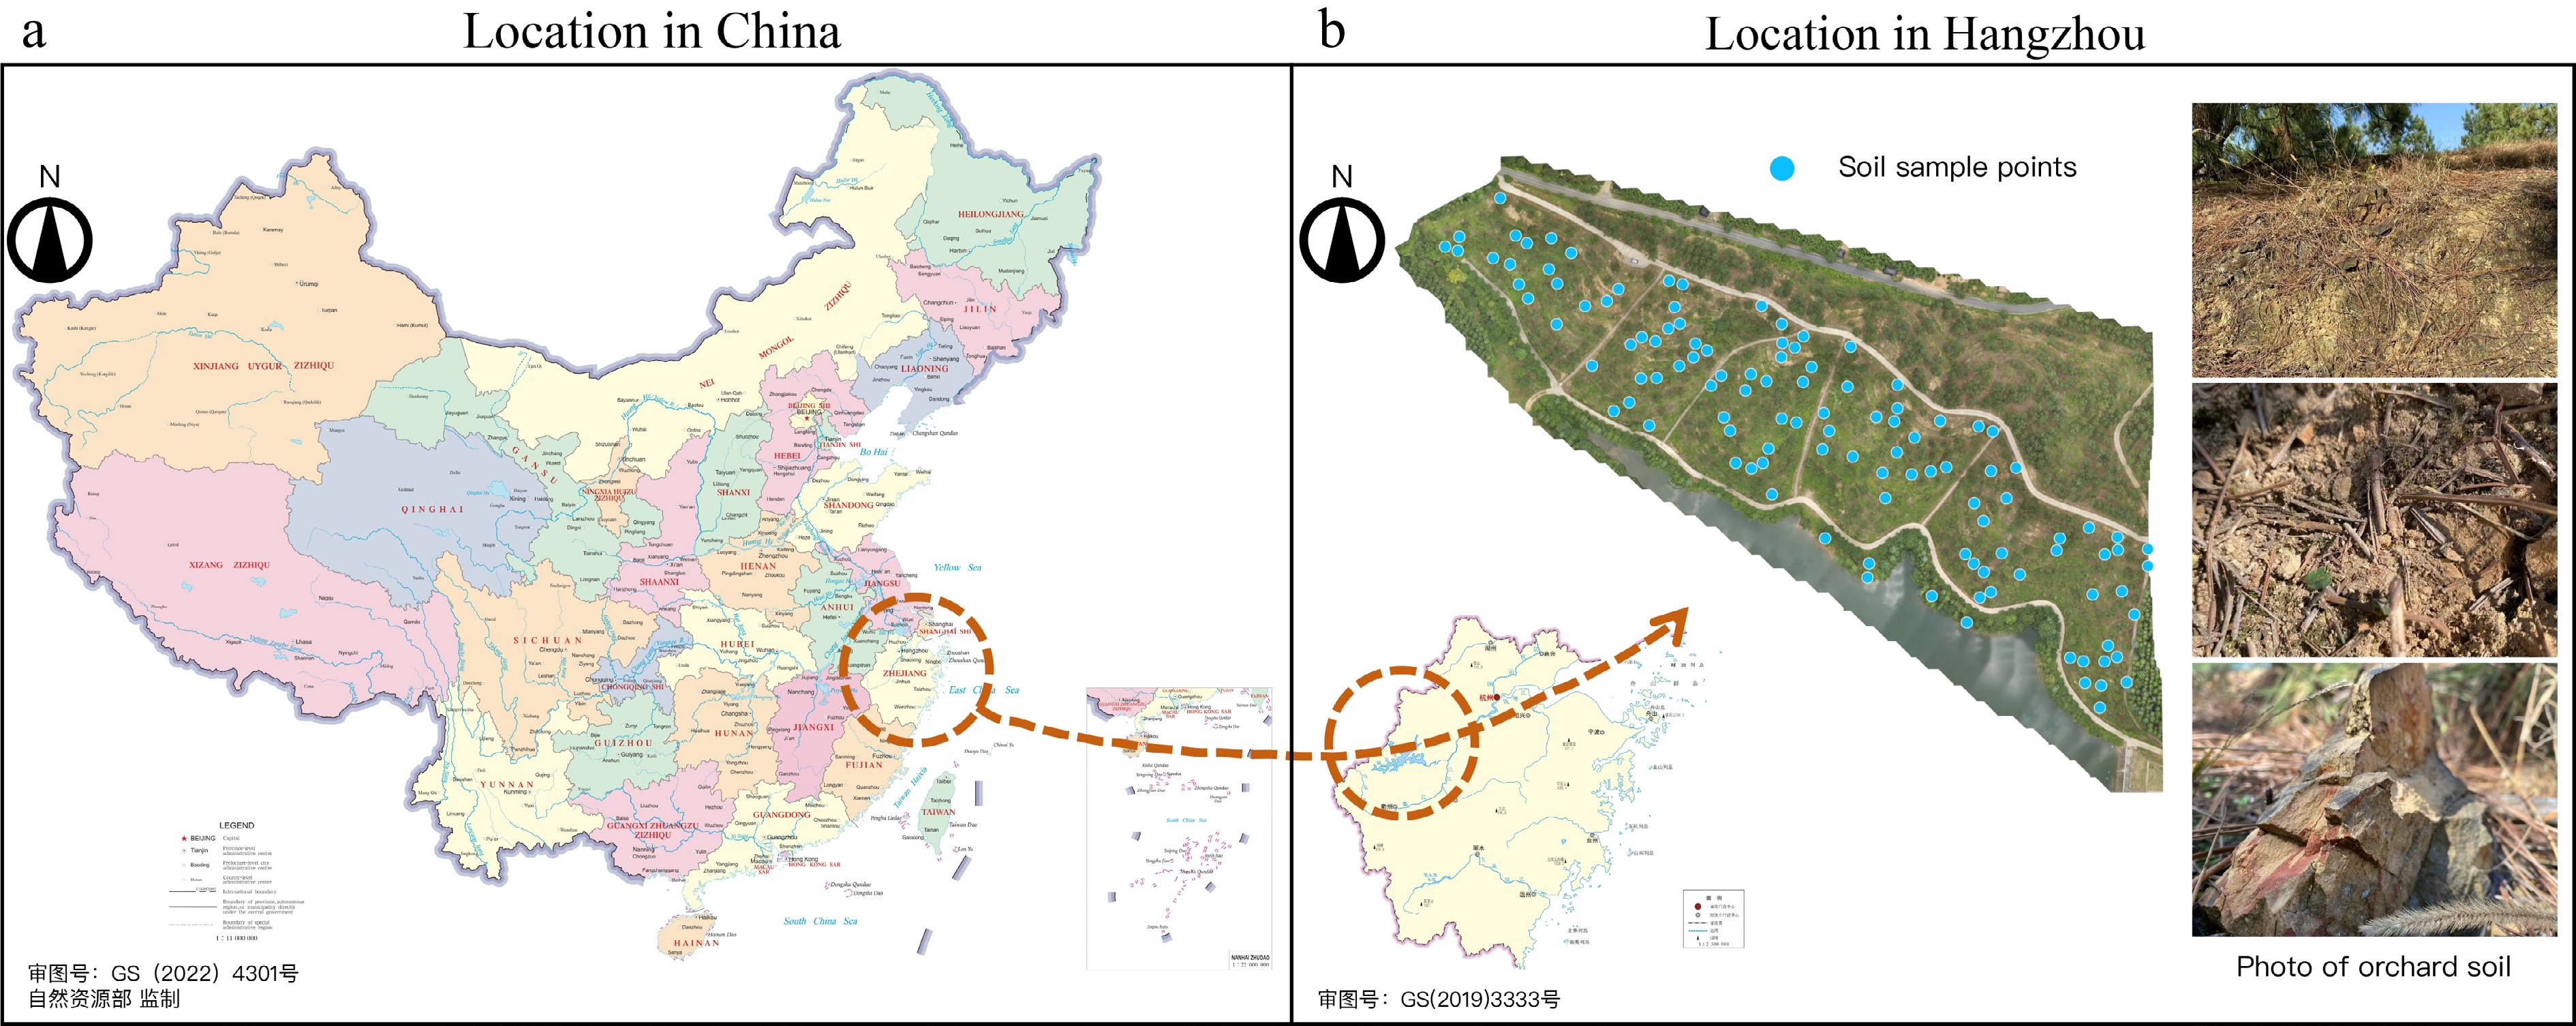
Figure 1.
(a) The experimental trial was in Changle State-owned Forest Farm, Hangzhou, Zhejiang Province, China. (b) The soil sampling points are the blue points, with a total of 115. The predominant soil is classified as red gravel soil. Source:
http://bzdt.ch.mnr.gov.cn/index.html Data collection
Soil collection and laboratory analysis
-
Soil samples were randomly collected from various points in the orchard, corresponding to the slash pine planting locations as depicted in Fig. 1. Sampling points were distributed throughout the terraced orchard within the five blocks (Fig. 1b), thereby covering the range of terrace platforms and hillslope positions present at the site. The terraced layout and natural topography ensure that the sampling design qualitatively spans different slope positions and aspects. At each selected location, which represented a single tree, three sampling points were randomly chosen within a 2 m radius from the root of the slash pine. After removing ground litter, humus, and surface soil, a ring soil shovel was used to extract soil cores to a depth of 20 cm. The three soil cores from the same tree were then combined to form a single sample, resulting in a total of 115 samples.
These samples were then transported to the laboratory, spread out for air drying, cleared of plant remnants, ground, and sieved to a granularity of 1 mm. Each soil sample was divided into two equal portions. One of these portions was subsequently used for laboratory analysis to measure its organic matter (OM), organic carbon (OC), total nitrogen (N), total phosphorus (P), total potassium (K), available boron (B), and pH value. To attain a more objective and comprehensive insight into the soil OC and OM content, this study utilized distinct laboratory assay methods for each component, instead of relying on a constant conversion coefficient between OC and OM. The experimental method is detailed in Table 1.
Table 1. Laboratory analysis methods used to detect the content of seven soil elements.
Soil element Testing method Organic Matter (OM) Loss on Ignition (LOI) Organic Carbon (OC) Dry Combustion-Infrared Spectrometry Total Nitrogen (N) Semi-micro Kjeldahl Total Phosphorus (P) Molybdenum blue colorimetry Total Potassium (K) Hydrofluoric Acid Available Boron (B) Azomethine-H colorimetric pH value Potentiometer Spectral data acquisition
-
For spectral data collection, another portion of each soil sample was evenly spread in a 10 cm diameter petri dish to a depth of 1.5 cm. Once the surface had been smoothed, a near-infrared spectrometer (LF-2500, Spectral Evolution, USA) equipped with a 10 mm diameter contact fiber-optical probe was used. Considering the specific spectral characteristics of the red soil environment, targeted measures were implemented during sample preparation and scanning: first, particles larger than 2 mm were removed before scanning to minimize spectral interference from coarse gravel; second, a white reference measurement was taken every 10 samples due to potential changes in ambient humidity, ensuring the accuracy of the reflectance calibration. The probe spanned a spectral range of 976.3–2,528.8 nm with a resolution of 6 nm. To ensure accuracy and prevent light penetration, the probe was secured over the soil using a bracket. Spectral data was captured across 256 wavelengths, with the absorbance at each wavelength being an average of 30 scans. To enrich the spectral data and thereby enhance model robustness, the scanning procedure was repeated three times for each soil sample. As a result, for the 115 soil samples, a total of 345 spectral datasets were obtained[30,31]. A representative subset of the processed spectra is visualized in Fig. 2 to illustrate the overall spectral characteristics of the soil samples.
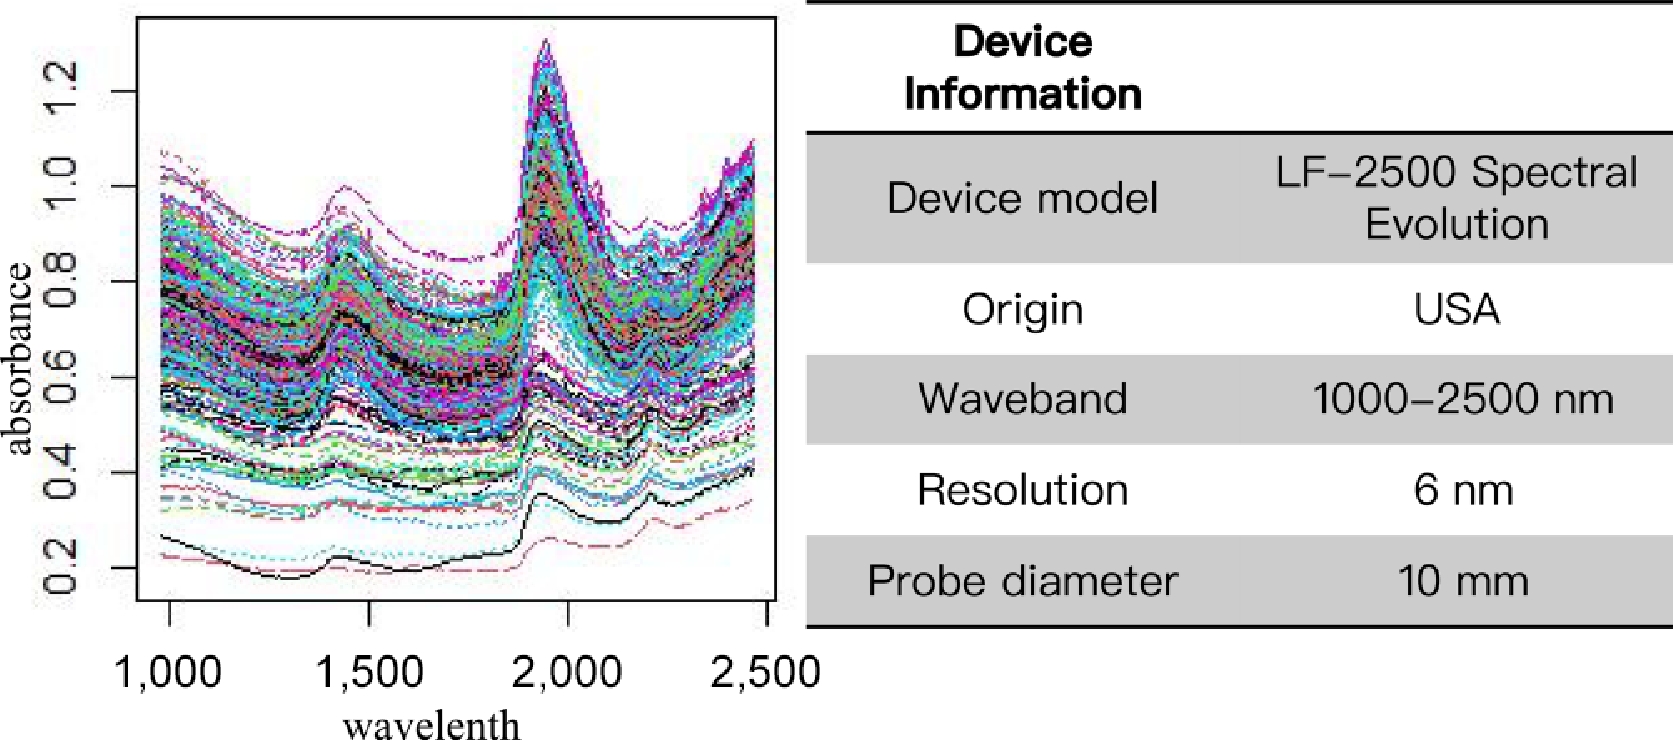
Figure 2.
(left) Visualization of the spectral data collected in the present study, and (right) basic information about the acquisition device. The measured near-infrared spectra cover the wavelength range 976.3–2,528.8 nm with a spectral resolution of 6 nm.
Data analysis equipment and preprocessing
-
Data analysis and model training in this research were conducted using Python (3.9.1), and were supported by NVIDIA GeForce RTX3070-8G. The dataset was partitioned into training, validation, and test subsets using a 7:1.5:1.5 ratio. The neural network was constructed using the Pytorch framework[32]. To explore the advantages of integrating traditional regression algorithms with neural network, a hybrid neural network in Pytorch was developed that incorporated the PLSR model group. We evaluated three neural network architectures: Fully Connected (FC), Multi-task Learning (MTL), and Transformer (TSM). Hyper-parameters were optimized using Optuna during the training phase (Sec 2.4). Visualization was carried out using Matplotlib and Seaborn[33,34].
The preprocessing of the raw spectral data was conducted in a structured pipeline to ensure robustness and prevent data leakage, utilizing the Scikit-learn library[35]. First, the complete set of 256 raw spectral bands was retained to allow the subsequent models to learn from the full spectral signature without prior manual feature selection. Potential outliers within the spectral data were identified and removed using the interquartile range method on the training set. The dataset was then partitioned into training, validation, and test subsets at a strict 7:1.5:1.5 ratio using the train_test_split function. Crucially, all subsequent scaling parameters were derived exclusively from the training set. The StandardScaler was fitted to the training data to standardize the spectral reflectance values, and this fitted scaler was fitted to the training data to standardize the spectral reflectance values, and this fitted scaler was then applied to transform the validation and test sets. This approach ensures that no information from the hold-out sets contaminates the training process. Finally, the processed data were packaged into a structured dataset for model training and evaluation.
Hybrid model building
-
In this study, all hybrid models were based on the implementation of stacked single-target (SST). Building on this foundation, the PLSR model, which had shown superior performance in soil composition prediction in prior studies, was employed as the stacked model. This model served as the base model in the overarching architecture and was incorporated into different neural network structures. Within the hybrid models, neural networks acted as meta-learners, further processing the output values of the base model. It is worth noting that the output value from the base model wasn't the optimal predicted output. Instead, it represented a set of predicted values encompassing various linear combinations of the PLSR model. Furthermore, the names of the three neural network structures functioning as meta-models were derived from their primary architectures. For instance, the FC was predominantly structured around the fully connected layer. The MTL, in addition to the fully connected layer as the shared layer, incorporated the task learning layer. Lastly, the TSM included not only the Transformer's Encoder, but also the task learning layer.
Stacked single-target
-
SST is a precursor stacking multi-target regression algorithm of MTR. Initially, a base learner is built for each target. Subsequently, a new augmented dataset is constructed by merging the predicted output from the base learner with the original input set. Afterward, a new meta-model is built for each target in sequence. This process can be viewed as a specialized form of feature engineering. Our approach differed from that of Spyromitros-Xioufis et al.[36]. First, we integrated the base model and the meta-model into a singular immersive framework based on neural networks, enhancing data flow coherence. The training step of the base model was represented as hj : X → R. Multiple sets of predicted values,
$ \hat Yj $ $ \hat Y j $ $ \in $ 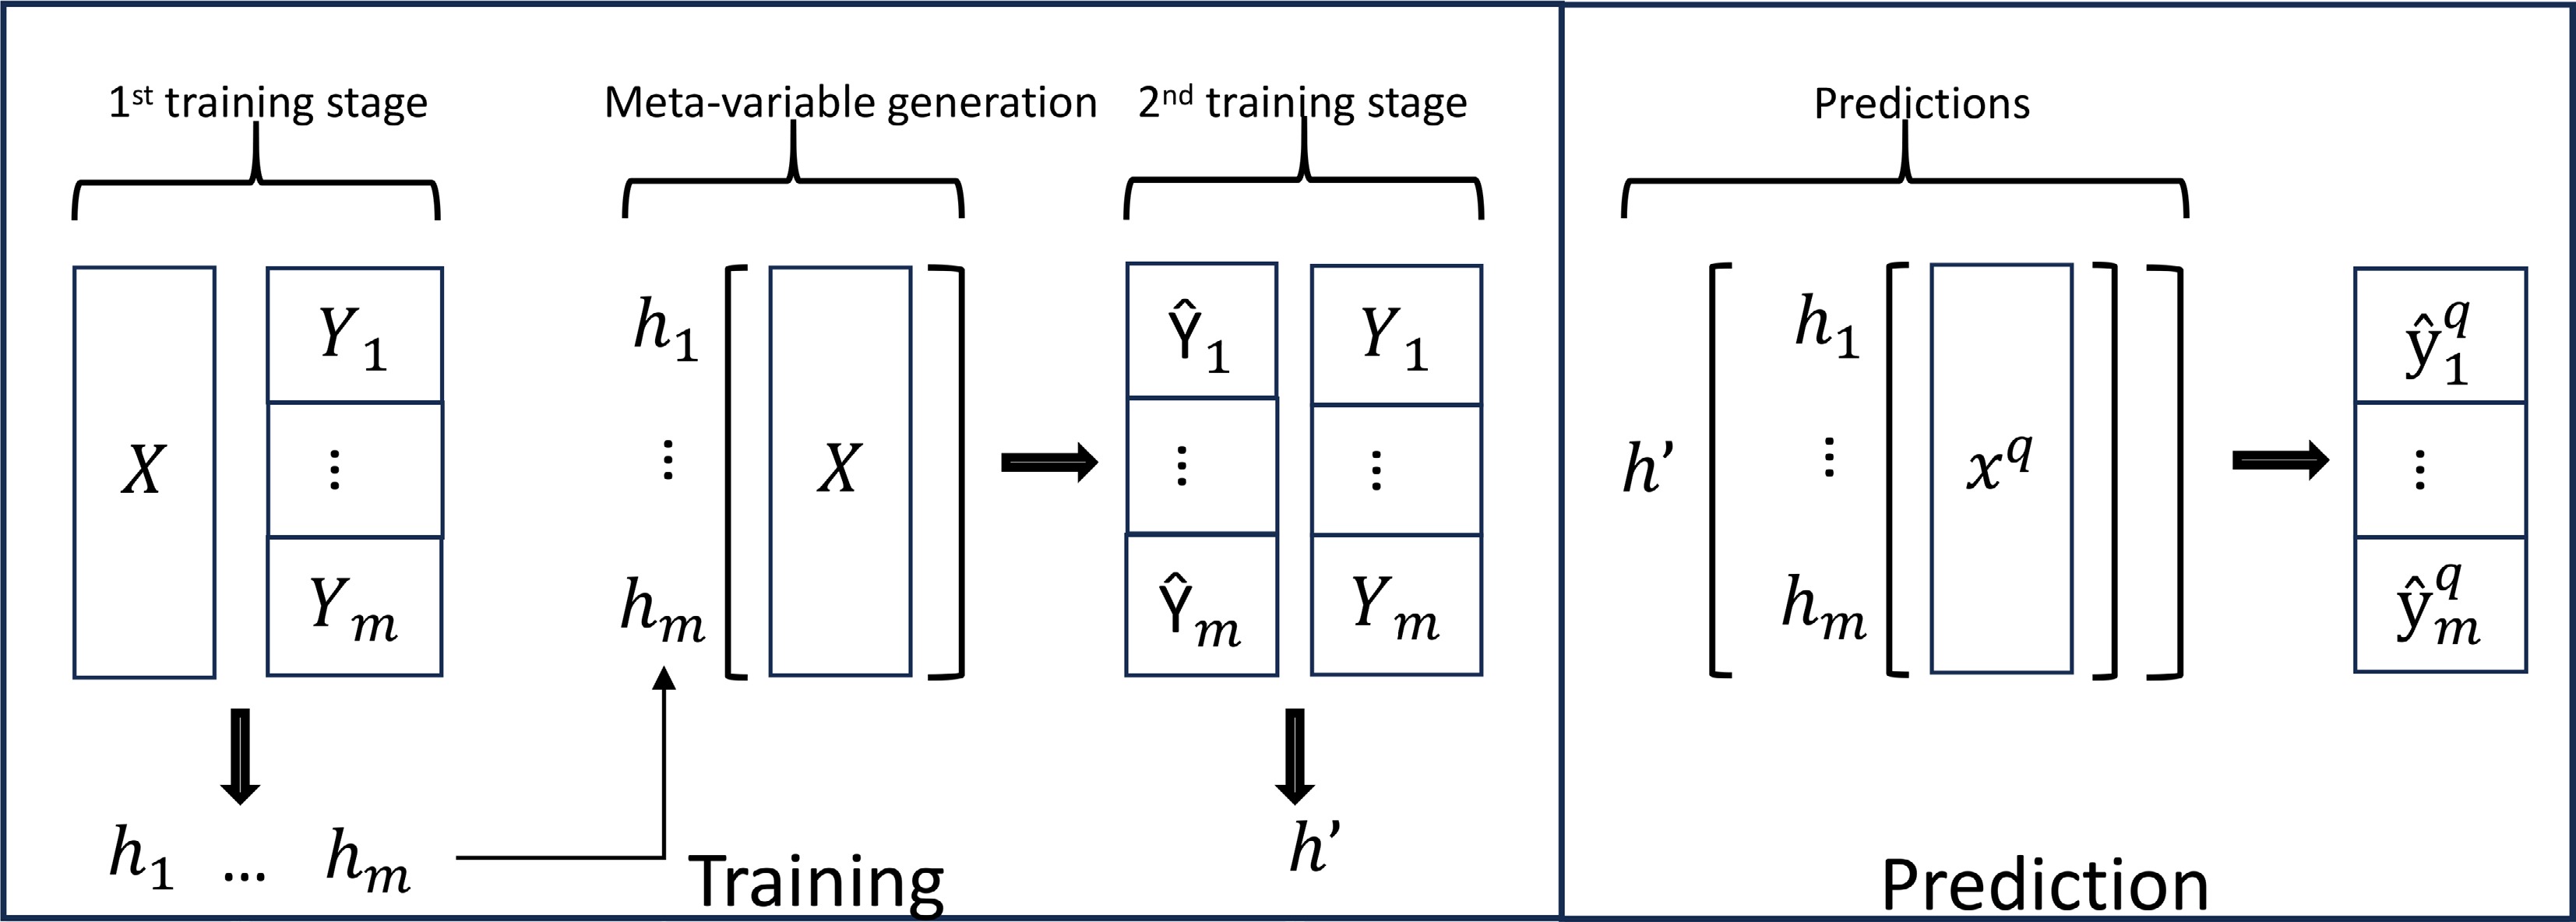
Figure 3.
The model consists of two parts, the base model (hj) and the meta-model (h'). Base model hj is created for each target first, and then the predicted values of the base model are used to create a meta-model h' using the neural network as the framework. When predicting an unknown value xq, the data will first enter the base model and generate a predicted value and then enter the meta-model to generate the final predicted value $\hat yq $, (j $ \in $ {1, ..., m}).
PLSR model
-
In this study, PLSR was employed as the base model for SST. For data augmentation, 20 linear combinations were selected (n_components = 20) and seven PLSR regression models generated corresponding to the seven soil components. These models were amalgamated into a group, forming the PLSR layer in the neural network and serving as the SST's base model. Additionally, to contrast the predictive efficacy of the original PLSR model with the hybrid model, two pure PLSR models were trained. These two models were dubbed PLSR_single and PLSR_multi. Specifically, PLSR_single comprised a model group that trained seven individual regression models for the study's seven regression objectives, while PLSR_multi was a multi-target regression model employing a singular PLSR model to concurrently predict all seven regression objectives. Every PLSR model in this research was implemented using the PLSRegression tool from the cross_decomposition model in Scikit-learn[37].
Fully connected neural network (FC)
-
An FC comprises several fully connected layers, as shown in Fig. 4. In this configuration, each neuron in a layer is connected to every neuron in its preceding layer, facilitating the extraction of features from one layer, and their mapping to different dimensions in the layers that follow. This network structure is chosen in this article because it is the most basic neural network structure and can objectively show the learning effect of the neural network on the base model in the hybrid model. In the present study, a dual-path input structure for the FC neural network was adopted to achieve soil-specific adaptation: the first path processes the raw spectra directly, aiming to capture the non-linear relationships that may be missed by PLSR, while the second path first feeds the spectral data into the PLSR base model to leverage PLSR's strength in extracting latent factors from high-dimension soil spectra[31]. The outputs of the two paths are then fused in a combined layer (630 neurons), which integrates the linear features from PLSR and the non-linear features from the raw spectra to enhance the model's robustness against gravel-induced spectral noise commonly found in red gravel soil. This approach enhances the richness and dimensionality of the input data, mitigating the risk of overfitting that can arise from overly simplistic model structures necessitating excessively deep model layers[38].
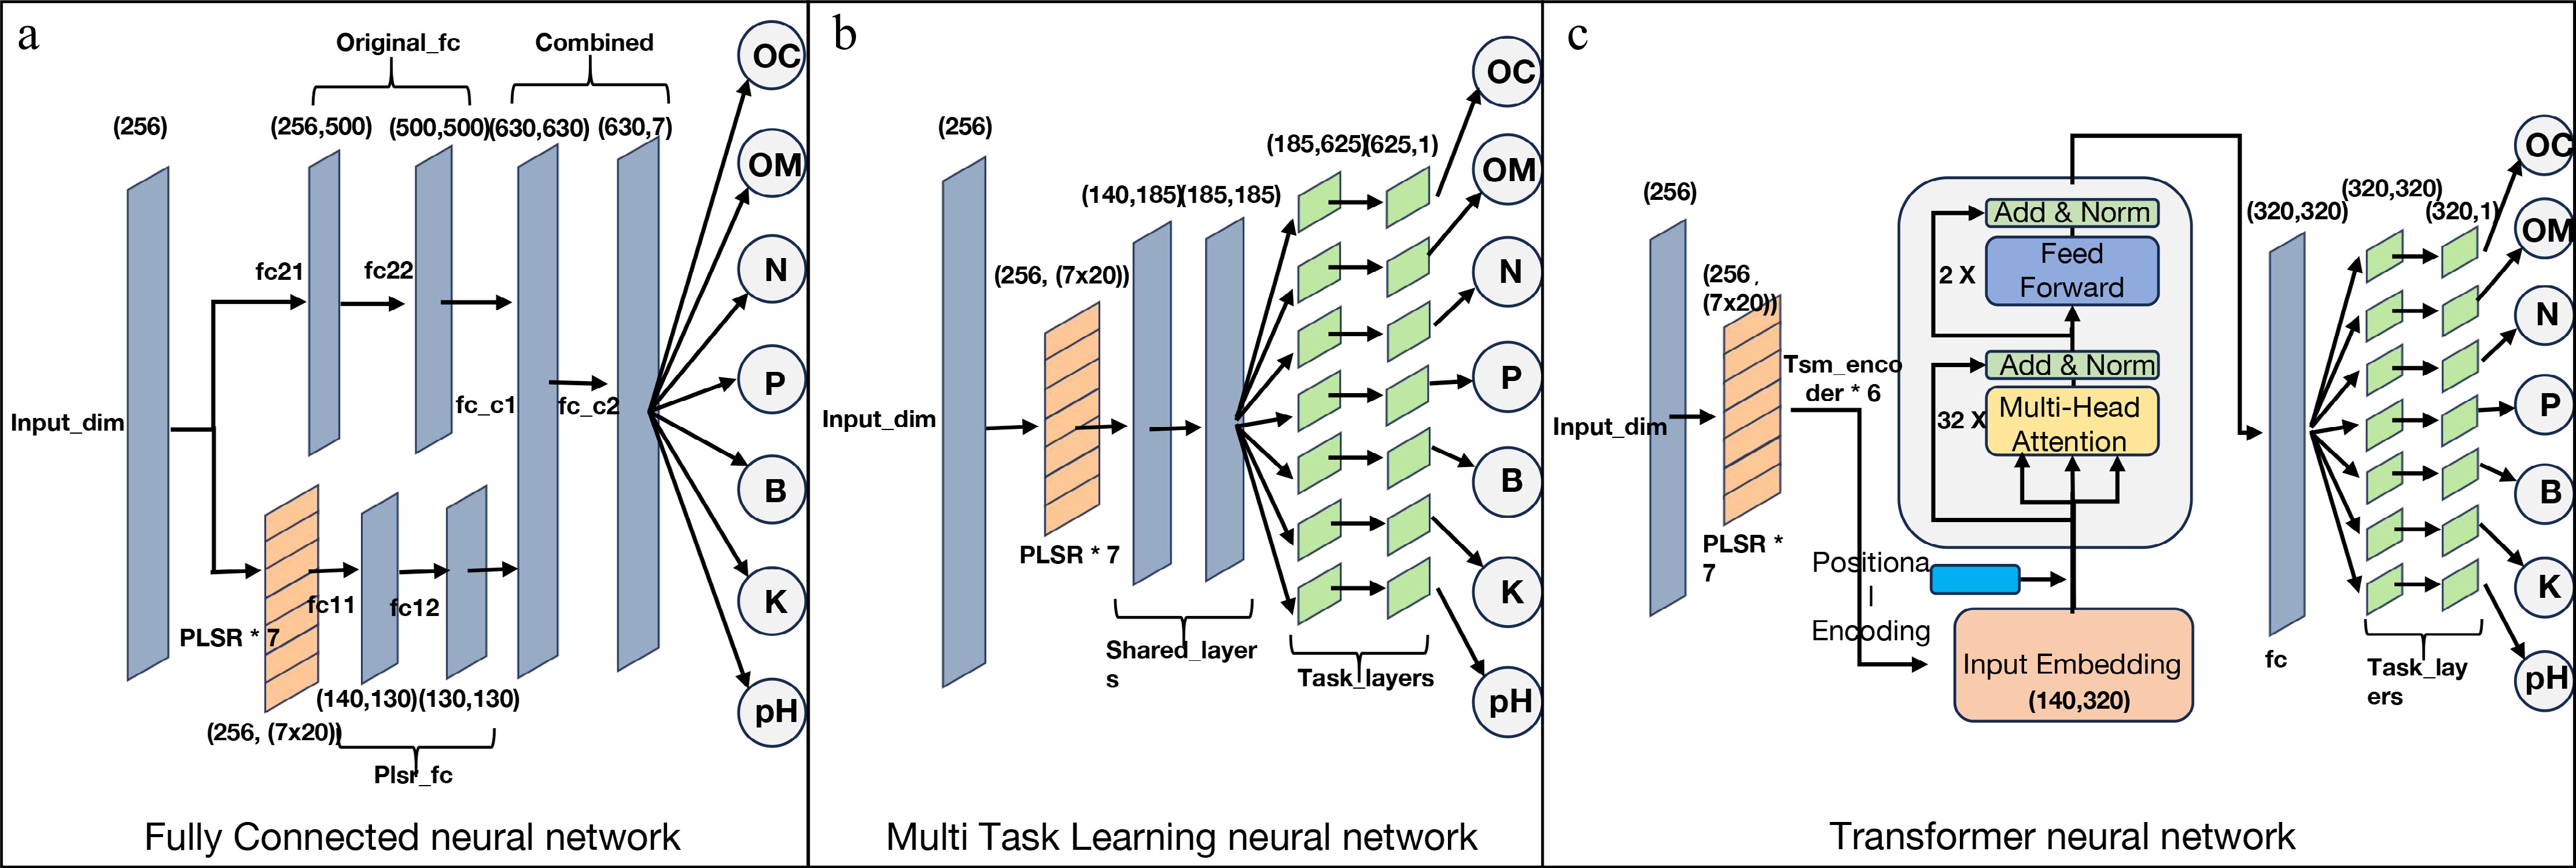
Figure 4.
Three types of hybrid neural network structures including PLSR model group. (a) Fully connected neural network; (b) multi-task learning neural network; (c) transformer neural network. The numbers in the figure mark the input and output dimensions of each layer of neural network. The letters are the name of the neural network of this layer, and the number of neurons are shown in Table 2.
Multi-task learning neural network (MTL)
-
MTL is a form of transfer learning that enhances generalization by leveraging domain-specific information contained within training signals of related tasks as an inductive bias. Enhanced learning performance is achieved by sharing representations across parallel learning tasks, allowing the knowledge acquired in one task to bolster the learning of others[21,39]. The reason for choosing this model structure in this article was that this structure is specially designed for multi-target regression and can better demonstrate the prediction potential of the hybrid model. In our research, the initial full-length spectral input first proceeded to the PLSR base model. This generated a 140-length tensor, which was then fed into two shared connection layers of size 185. The shared layer, with 185 neurons, processes these PLSR-enhanced features and is particularly adept at capturing the underlying correlations between key soil elements. The data is then relayed to seven distinct task layer groups, each with a depth of 2 and 625 neurons, which refine predictions for all target elements, including those with weaker correlations. A key feature of this MTL architecture is its backpropagation mechanism, which automatically weights the losses of different tasks during training. This dynamic weighting is based on prediction difficulty, assigning a stronger influence, for instance, to tasks like B prediction that typically exhibit higher variance. The model learned the weight of each task for a specific task goal (Fig. 4). Finally, each of the seven task layer groups produced its respective predicted value.
Transformer (TSM)
-
TSM excels at natural language processing tasks. Its distinctive feature is its reliance on a multi-head attention mechanism. This mechanism allows the TSM to selectively focus on specific regions or sequences of locations, extracting information from these selected regions. Typically, in natural language processing, a TSM model consists of an encoder that processes input data and a decoder that processes output data. In this study, we selected only the Encoder of TSM because we were more concerned about whether the information brought by the positional encoding of the data output by the base model could enhance the learning ability[40,41]. The initial full-length spectral data was routed to the PLSR base model, resulting in a tensor of length 140. This tensor was then fed into the embedding layer of the TSM encoder, which expanded the data dimension to 320. Subsequently, position encoding was applied to the data. This step is fundamental for soil spectral processing as it preserves the sequential order of wavelengths from 1,000 to 2,500 nm, which is essential for identifying characteristic absorption features of soil nutrients. The encoded data was then processed through a multi-head attention layer with 32 heads. This layer is designed to discover and learn complex interactions between different wavelengths, such as correlating the N-H bend at 1,510 nm with the C=O stretch at 1,980 nm for organic matter prediction. The output of this layer was combined with the input in the form of a residual connection and was subsequently processed by a two-layer feed-forward neural network. This process was repeated six times. Finally, the data entered the task layer, which had the same structure but different dimensions as the MTL neural network. Here, the model learned specific weights for each task, ultimately generating corresponding target values (Fig. 4).
Hyper-parameter optimization
-
Optuna was employed for hyper-parameter tuning. Optuna is a specialized hyper-parameter optimization framework tailored for machine learning[42]. It utilizes sophisticated algorithms to sample hyper-parameters and adeptly prunes unproductive trials, ensuring efficient hyper-parameter optimization. Specifically, Optuna's Tree-structured Parzen Estimator (TPE Sampler) was adopted for sampling and refining the hyper-parameter range[43]. This sampler constructs a Gaussian Mixture Model (GMM) based on the parameter values, l(x), corresponding to the optimal target value, and subsequently crafts another GMM for all parameter values g(x), resulting in a new parameter set defined as l(x)/g(x). To eliminate unpromising hyper-parameter experiments, the Threshold Pruner was employed. Each model experiment was executed 1,000 times. Subsequent to this automated process, manual fine-tuning of hyper-parameters within the identified range was conducted. In addition, nn.MSELoss was used as the loss function, selected Adam in torch.optim as the optimizer, and lr_scheduler.ReduceLROnPlateau as the learning rate adjuster to prevent model overfitting[32]. Details of each model's hyper-parameters can be found in Table 2.
Table 2. Hyperparameter selection for three hybrid models. All hyperparameters are filtered by the Optuna hyperparameter filter and fine-tuned manually.
Model Search range Hyper-parameters FC Plsr_fc 50−1,000 130 Original_fc 50−1,000 500 Combined 50−1,000 630 Output Fixed 7 Batch_size 16−64 32 Initial_lr 1.00E-05 to 1.00E-02 1.50E-04 Epoch 100−1,000 700 MTL Shard_layers 50−500 185 Task_layers 200−1,000 625*7 Output Fixed 1*7 Batch_size 16−64 32 Initial_lr 1.00E-04 to 1.00E-02 1.00E-03 Epoch 500−5,000 3,000 TSM Input_embedding 128−512 320 nhead 4−64 32 d_model 128−512 320 Encoder_num 2-12 6 Task_layers 200−1,000 320*7 Output Fixed 1*7 Batch_size 16−64 32 Initial_lr 1.00E-05 to 1.00E-03 1.00E-04 Epoch 500−2,000 1,300 Model evaluation
-
The evaluation of the model's performance leveraged the following metrics: coefficient of determination (R2), relative root mean square error (RMSE%), relative mean absolute error (MAE%), and relative prediction error (RPD). The R2 metric signifies the model's predictive capacity. Both RMSE% and MAE% gauge the disparity between predicted and actual values. In this study, because seven prediction targets and the value ranges are different, relative indicators are used to obtain a more intuitive comparison. RMSE%, typically the more prevalent error metric, is notably sensitive to pronounced errors. In multi-task regression scenarios, MAE% often becomes the metric of choice as the model may assign varied fitting priorities across tasks[22]. Therefore, these two indicators were selected as model loss evaluation indicators, and their calculation formula is as follows:
$ \begin{array}{c}RMS E{\text{%}}=\left(\dfrac{\sqrt{\dfrac{1}{n}{\displaystyle\sum} _{i=1}^{n}({y}_{i}-{\hat{y}}_{i}{)}^{2}}}{avg\left(y\right)}\right)\times 100{\text{%}}\end{array} $ (1) $ \begin{array}{c}MAE{\text{%}}=\left(\dfrac{\dfrac{1}{n}{\displaystyle\sum} _{i=1}^{n}|{y}_{i}-{\hat{y}}_{i}|}{avg\left(y\right)}\right)\times 100{\text{%}}\end{array} $ (2) In the given equations, yi denotes the observed or actual value, while
$ \hat y_i $ The RPD value serves as an assessment of the model's predictive performance. An RPD value below 1.4 suggests the model's inability to generate effective predictions, while a value exceeding 1.8 denotes a good predictive competence[11]. All these four metrics were derived utilizing tools from the Scikit-learn package[35].
-
Seven soil components were analyzed in the study: OC, OM, N, P, B, K, and pH. Descriptive statistics of the soil dataset are presented in Table 3. Notably, there were marked variations among the different soil components. Generally, given the plot's dimensions, soil compositions exhibited limited variability. Both P and B appeared to be in short supply, while K levels appeared to be higher. The soil was mainly acidic and showed the typical red gravel soil characteristics of southern China.
Table 3. Laboratory tests for soil composition include maximum (Max), minimum (Min), mean (Mean), median (50%), and standard deviation (STD).
Statistic OC (g/kg) OM (g/kg) N (g/kg) P (g/kg) B (mg/kg) K (g/kg) pH Maximum value (Max) 6.9491 11.7562 0.8383 0.5521 0.6615 14.4560 5.4118 Minimum value (Min) 4.3854 7.7722 0.3456 0.3300 0.5169 11.3024 4.5962 Mean value (Mean) 5.8620 10.0869 0.6043 0.4628 0.6070 13.3284 4.9814 Median value (50%) 5.8561 10.0706 0.5951 0.4638 0.6161 13.4462 4.9723 Standard deviation (STD) 0.4249 0.6617 0.0927 0.0395 0.0311 0.6191 0.1642 The correlation analysis of the soil components (Fig. 5) unveiled a strong positive correlation between OC and OM, evidenced by a correlation coefficient (Cor) of 0.95. OM and P also manifested a pronounced correlation (Cor = 0.93). Further, P displayed strong positive correlations with both N and K. Conversely, B exhibited negative correlations to varying extents with other nutrients, the strongest being with N (Cor = −0.42). No marked correlation was observed between the pH value and other nutrients. Overall, among the examined components, N, P, K, OC, and OM emerged with substantial positive correlations. B, on the other hand, largely showcased negative correlations with the other nutritional components. These correlations provide statistical justification for multi-task learning, as nutrient co-variation enables knowledge transfer between prediction tasks.
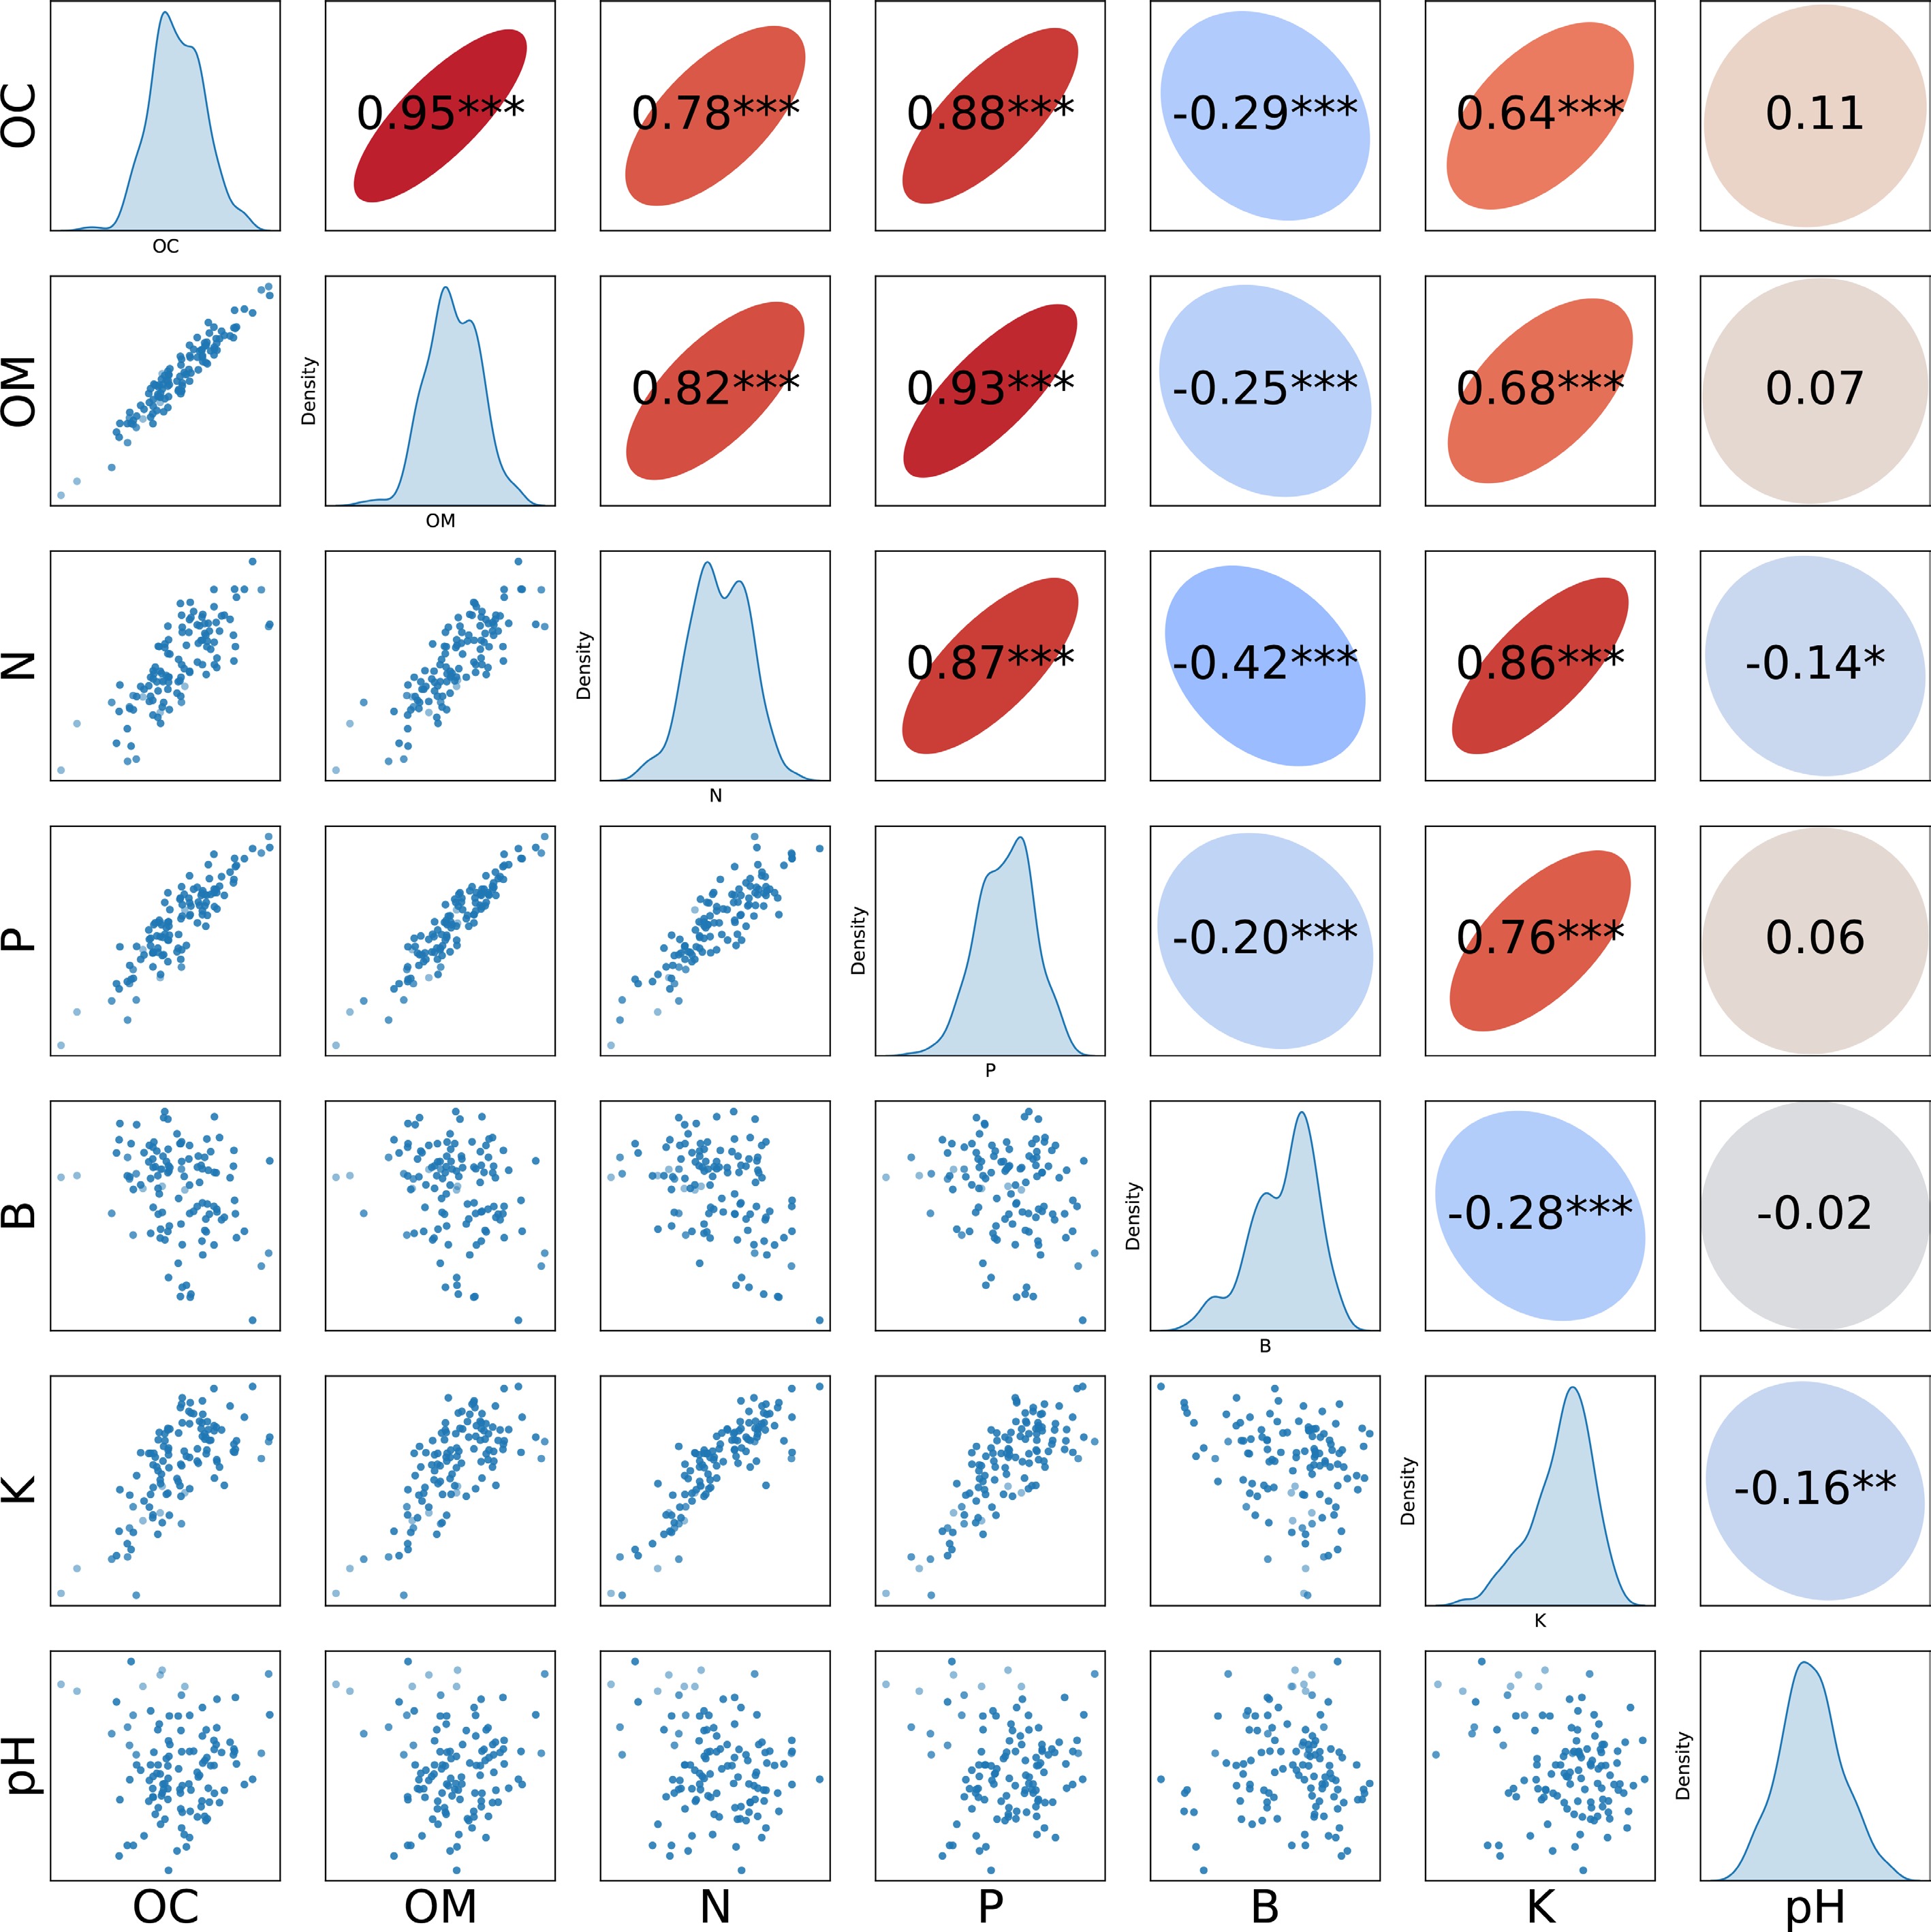
Figure 5.
Scatterplot of seven soil components (lower half), kernel density estimation (diagonal), correlation (upper half). *** p < 0.001; ** p < 0.01; * p < 0.05.
Model performance
-
In this study, five regression methods were employed to forecast seven nutrient elements: PLSR_single models (one for each of the seven targets), PLSR_multi model (a single model addressing all seven targets), FC Hybrid Neural Network, MTL Hybrid Neural Network, and TSM Hybrid Neural Network. The coefficient of determination (R2) showcasing the predictive capabilities of various models for the seven nutrient elements on the test data set is depicted in Fig. 6. It became evident that the predictive efficiency for B varied significantly across models. For instance, when utilizing the PLSR multi-model for MTR, the predictive capability for B was nearly non-existent, registering a mere R2 of 0.05. There were marked disparities in the performance of the other four models. Using the R2 of the PLSR single regression model as a benchmark, both the TSM and MTL models demonstrated enhancements in predicting B.
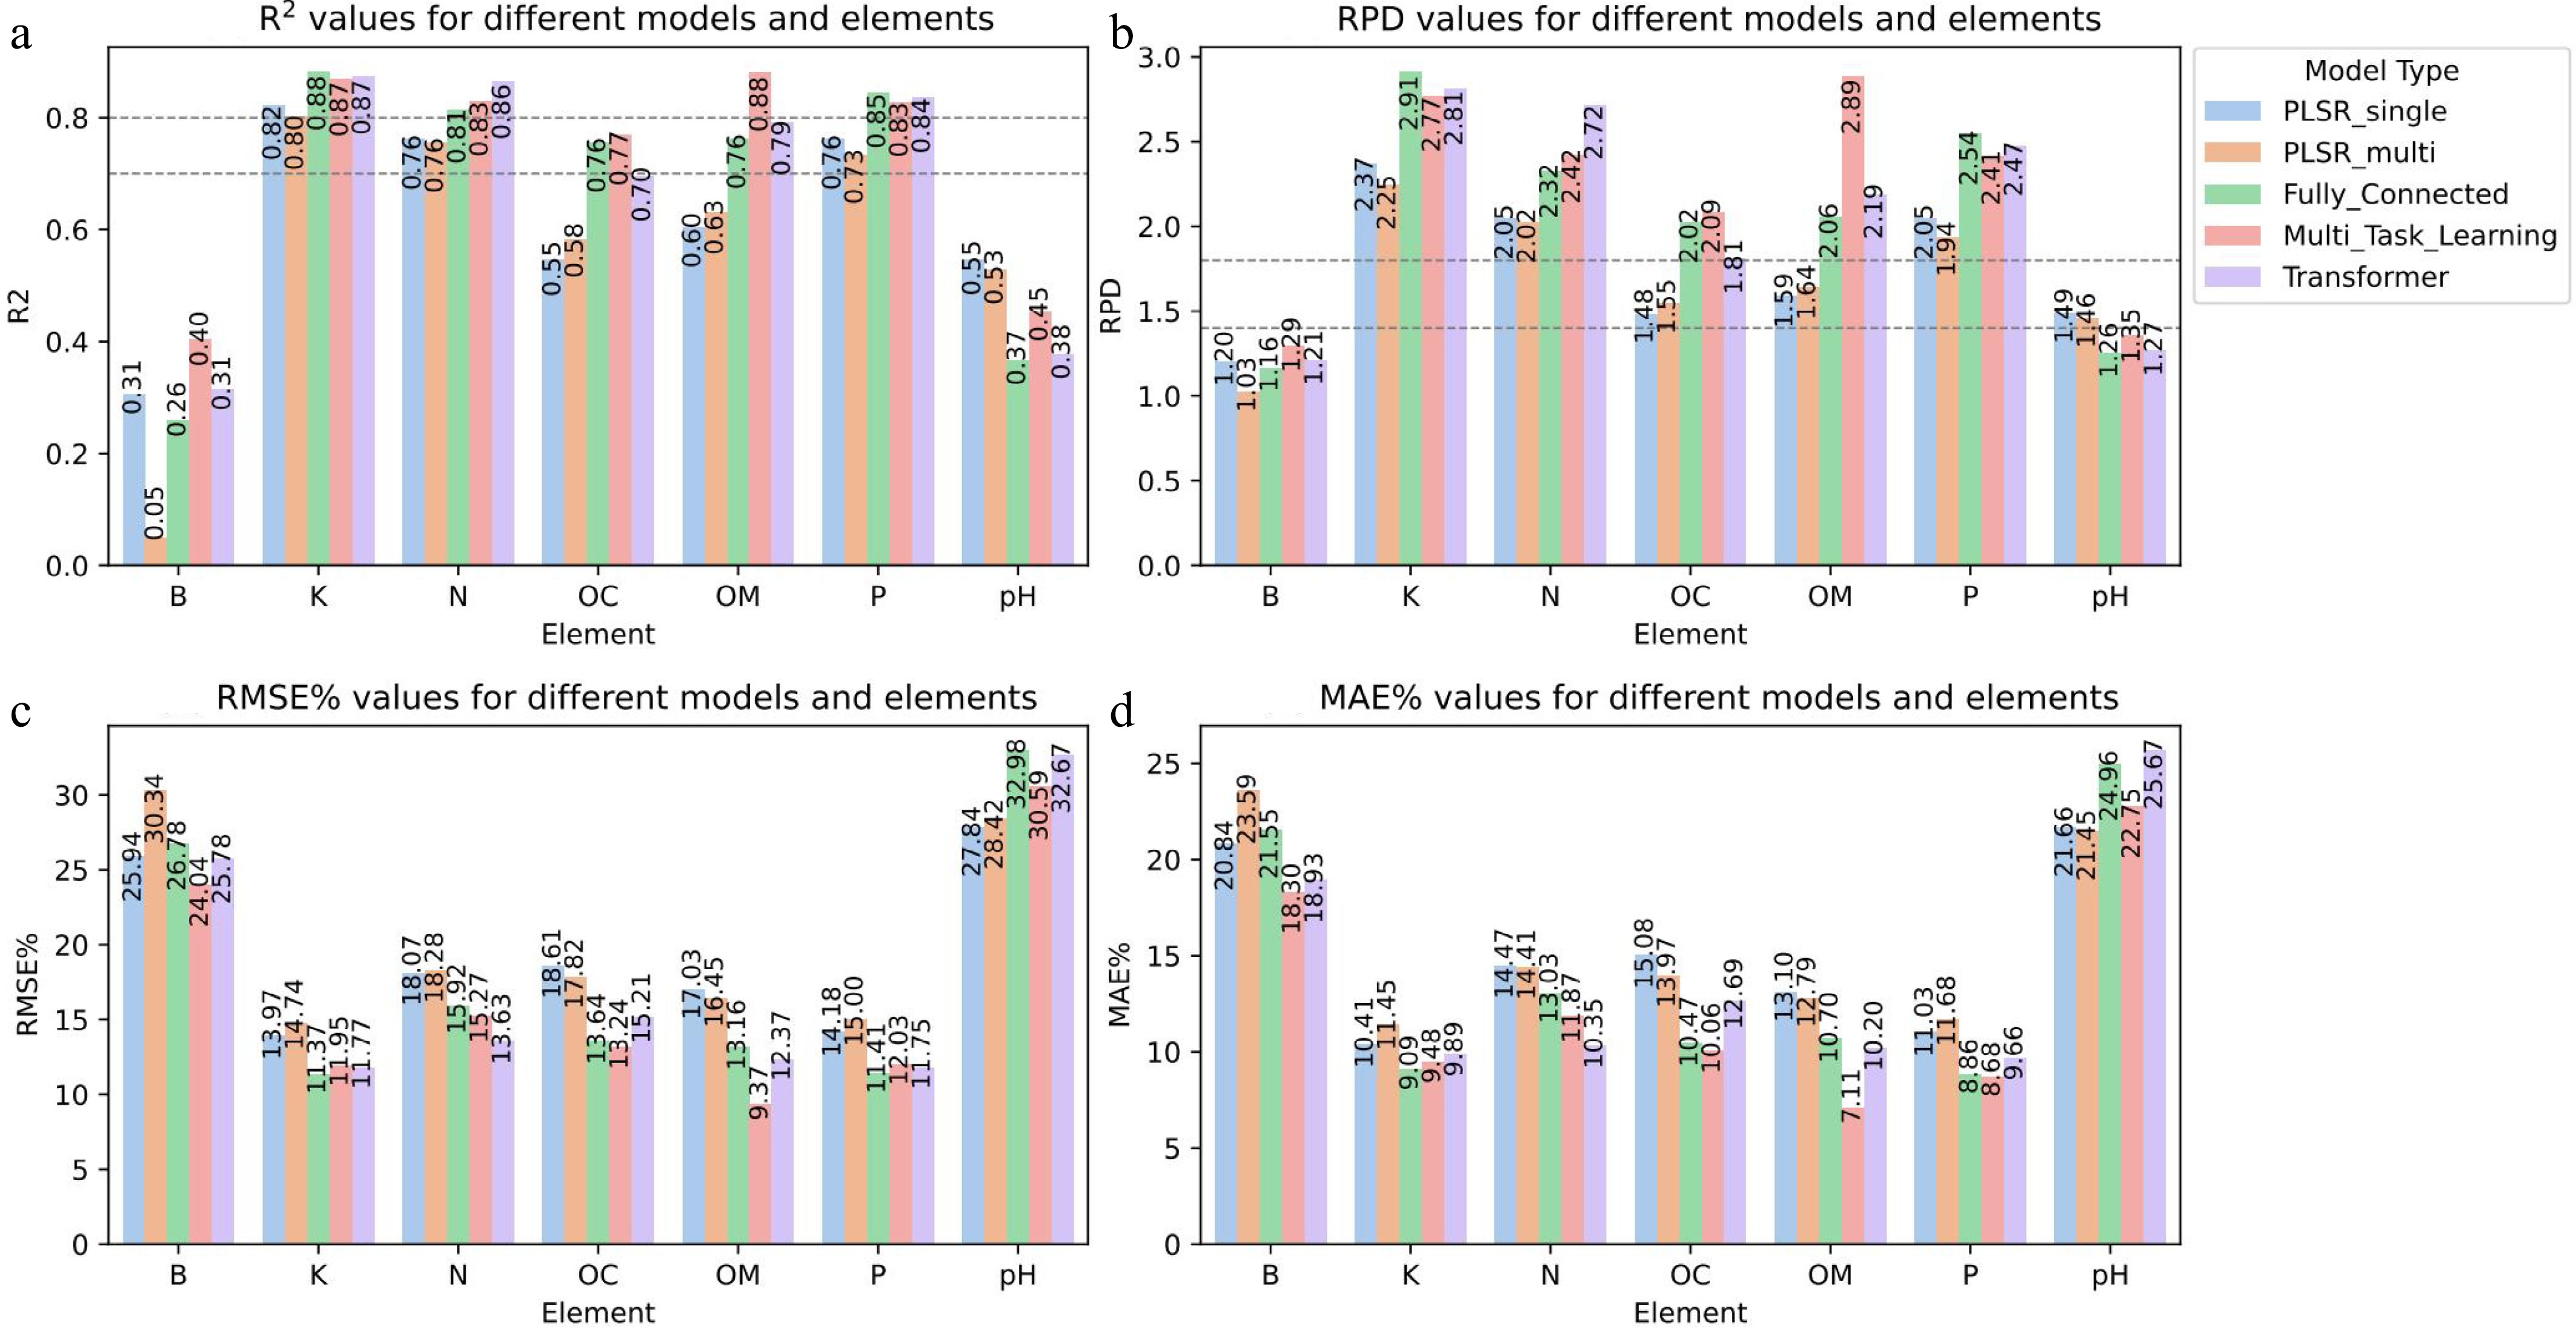
Figure 6.
The figure shows the R2, RPD, RMSE%, and MAE% values of seven soil elements in five models respectively. The dotted line shown in R2 is the threshold of the coefficient of determination. When the R2 of the model is larger than 0.7, it indicates that the model has good prediction ability for this set of data. When the R2 of the model is larger than 0.8, it indicates that the model has excellent predictive ability for this set of data. The dotted line displayed in RPD is the threshold of relative analysis error. When the RPD value is between 1.4 and 1.8, it indicates that the model's prediction ability is average. When the RPD value is larger than 1.8, it indicates that the model can make good predictions.
Specifically, in comparison to the individual regression model, the MTL registered an R2 improvement of 0.09. However, the FC model's predictive capability for B diminished by approximately 0.05 relative to the individual regression model. For the coefficient of determination of the predictive ability of pH value, the three kinds of neural networks all showed the phenomenon of degradation of predictive ability. The R2 decline ranges were 0.08–0.18.
Overall, the neural network consistently outperformed the PLSR model in predicting most nutrients. It is worth noting that the FC model had the best prediction effect on K, with R2 reaching 0.88, which was an improvement over the PLSR individual model. The TSM model performed well in terms of N, with an R2 of 0.86. Across all components, the MTL model showed significant predictive power, especially for OM and OC, with an improved R2 of 0.22 for the latter. The significant inter-element correlations (Fig. 5) directly explain MTL's performance gains: 'For strongly correlated elements (OM/OC/P), MTL achieved 12%–22% higher R2 than PLSR_single (p < 0.01 via paired t-test), whereas weakly correlated targets (B/pH) showed no significant improvement (p > 0.05)'. All neural network models, especially the FC model, showed significant improvement over the PLSR individual model in predicting P. However, it is worth noting that the predictive ability of the neural network model for pH decreased. For B, the performance of the MTL model was significantly improved compared to the PLSR multi-objective model. Overall, the findings highlighted the superior predictive capabilities of neural networks over traditional PLSR models for a variety of soil components.
Figure 6b displays the RPD indicator to evaluate the performance of different models on all soil components. A noteworthy phenomenon observed from the figure was that, whether it was the pure PLSR model or the hybrid model, the predictive ability for B did not reach the threshold. However, for elements such as N, P, and K, all models exceeded the RPD threshold of 1.8. When evaluating OC and OM, only the three hybrid neural networks had RPD values higher than 1.8. In the pH predictions, regrettable results emerged. The three neural networks pulled the RPD value below the threshold, which was an enlightening result. Figure 6c, d provides further insights. Regardless of RMSE% or MAE%, all models could not provide effective predictions on B elements and pH values. For the other five elements, the FC model had lower errors in the prediction of K elements; the TSM model had lower errors in the prediction of N elements; and the MTL model had lower errors in OC and OM. However, there was controversy between the two indicators regarding the prediction error of the P element. The conclusion of RMSE% was basically consistent with R2, while MAE% showed that although the R2 and RPD values of the MTL model were not better than the other two hybrid models, it had lower losses.
-
This study sourced all soil samples from the seed orchard of high-yield resinous clones of slash pine. Insufficient data volume caused by small-area sampling has been a major modeling challenge in previous studies, especially neural networks. However, in this study, multi-target regression was used to convert the depth of data volume into the breadth of data types. In this seed orchard, different elements exhibited distinct correlation patterns (Fig. 7). Major macronutrients such as OC, OM, N, P, and K were generally positively associated, whereas B tended to be weakly and often negatively related to them. In these slash pine forests, soil OC predominantly derives from coniferous litter. Retaining forest litter not only augments OC sequestration but also enriches the soil's N and P content[44]. Previous studies have shown that the input of forest litter increases soil P fraction[45]. This ecological process underlies the strong association between P and OM among the macronutrients. Yet, due to the inherently nutrient-poor nature of the soil, P remains in limited supply. The weak and often negative association between B and other nutrients may stem from the predominant use of nitrogen fertilizers during subsequent orchard maintenance and from the red gravel soil texture, which promotes leaching and boron deficiency. This pattern highlights the importance of combined N and B fertilization for maintaining cone yield and seed quality in slash pine seed orchards[4,46,47].
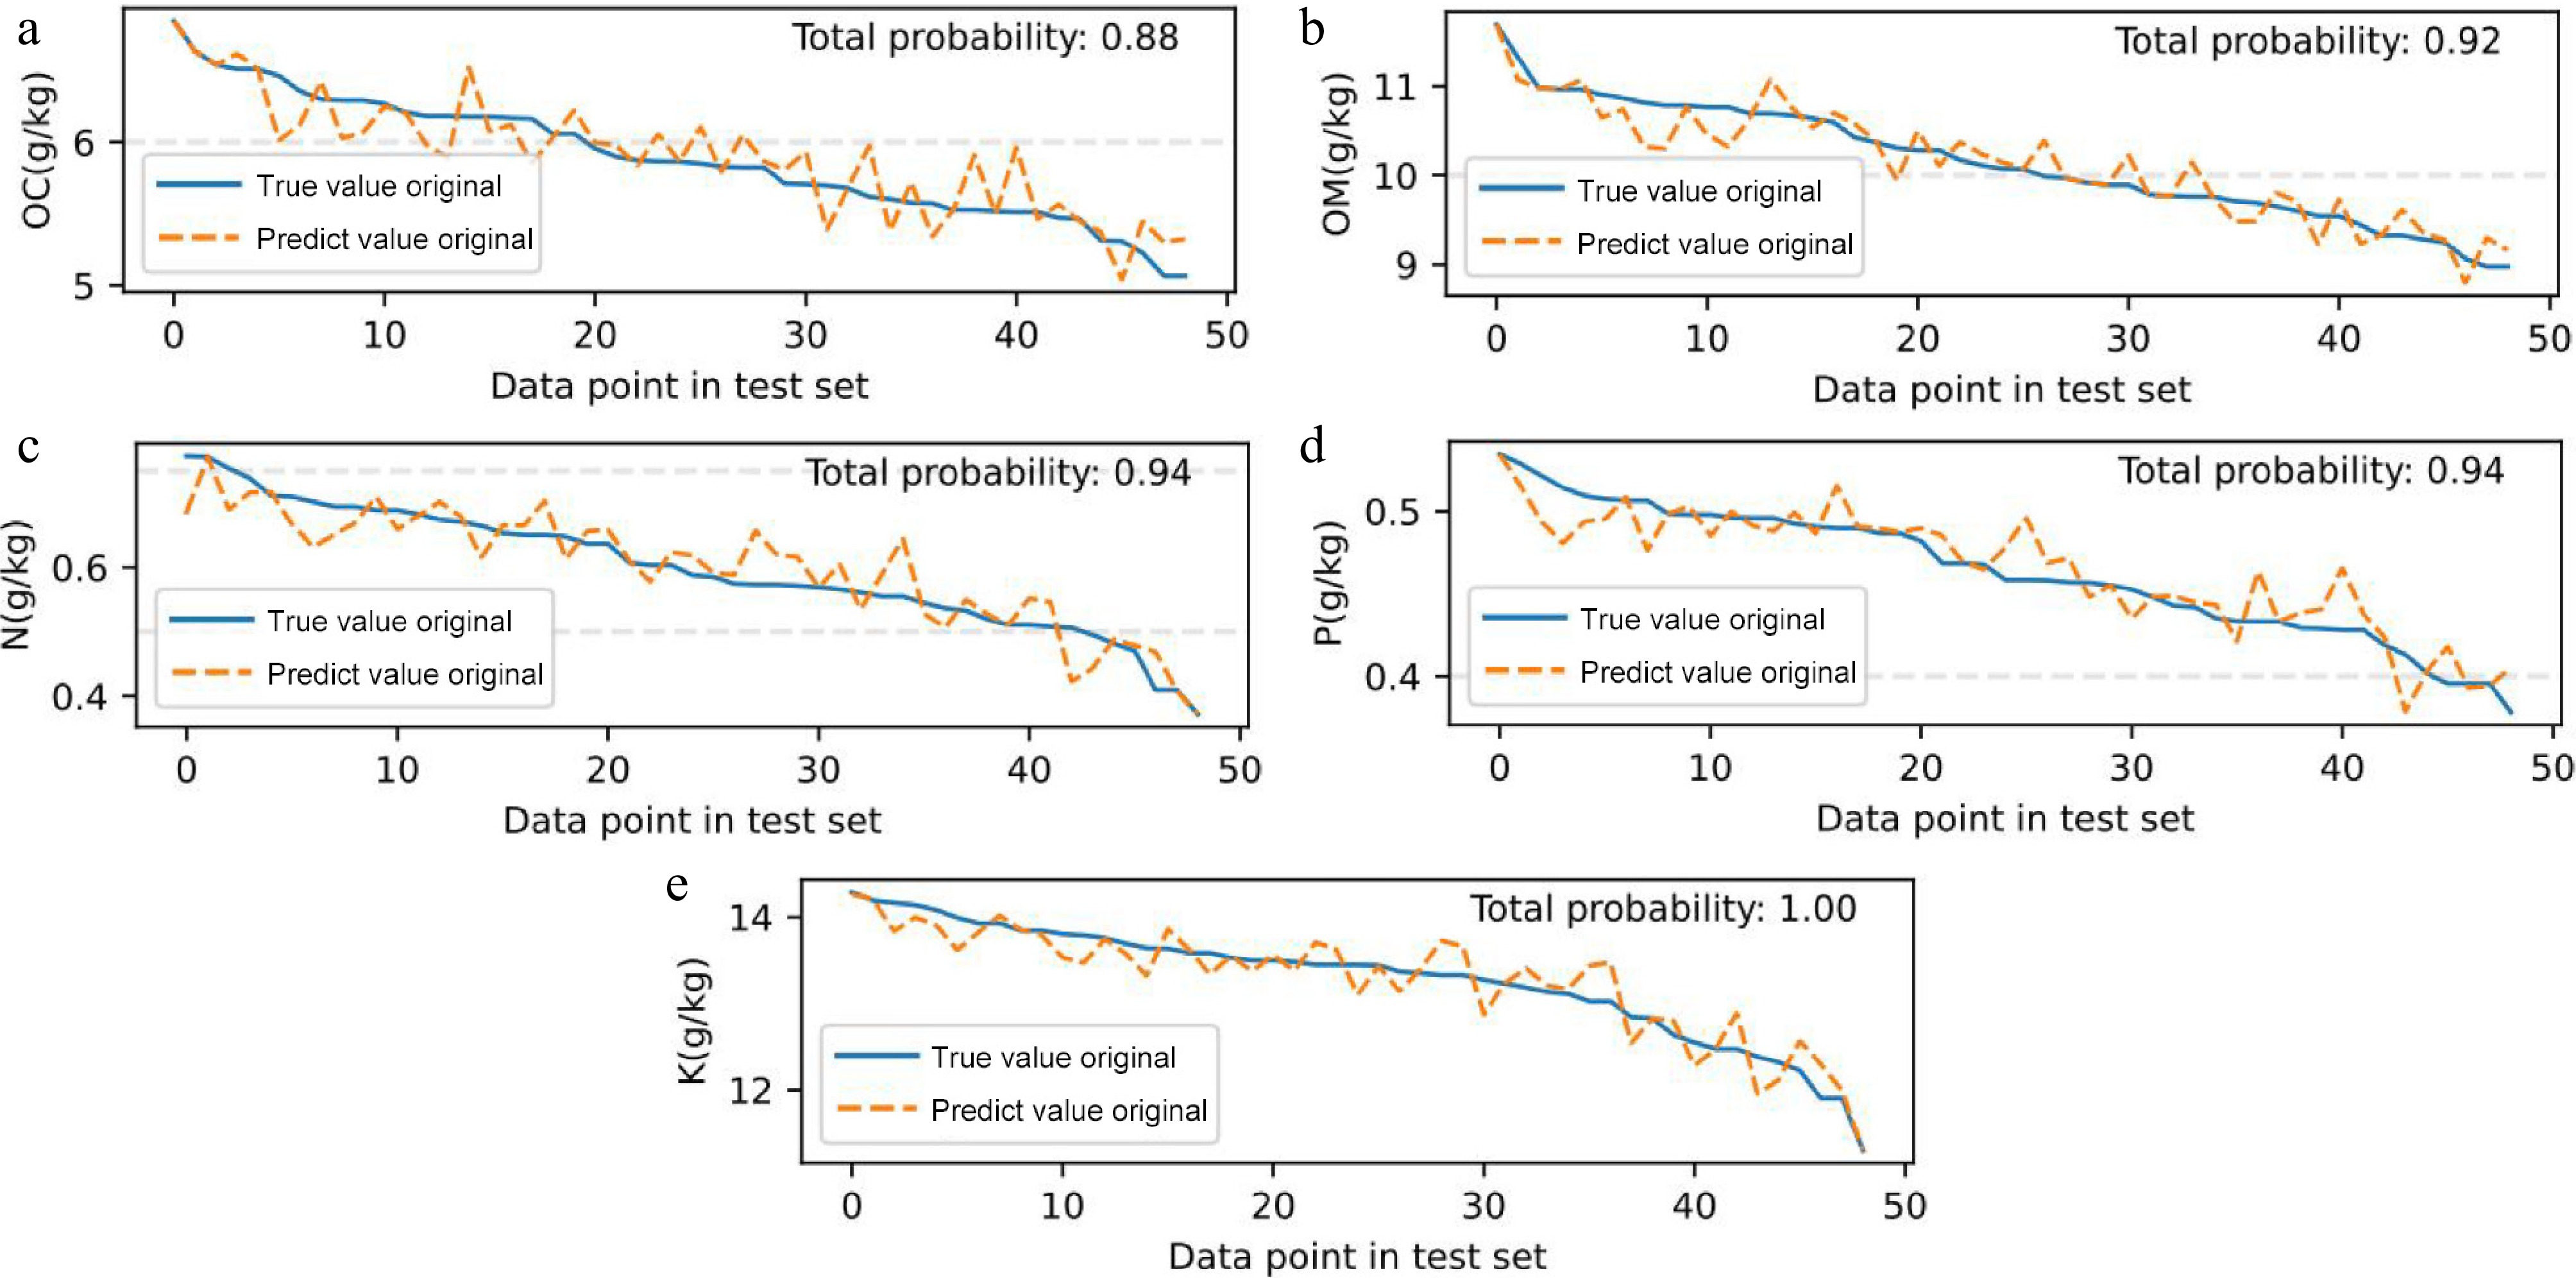
Figure 7.
Comparison of MTL predicted and true values of (a) OC, (b) OM, (c) N, (d) P, and (e) K in the test set. The dotted lines in the figure represent the thresholds for grading soil nutrients in China's second national soil census. The Y-axis represents the nutrient content of the soil sample points, and the X-axis arranges the data of the sample points in descending order according to the true value to achieve a more intuitive performance. The upper right corner is the probability that the model divided the soil nutrients into the correct level.
Predictive ability
-
As shown in Fig. 4, the three neural-network-based hybrid models generally outperformed the pure PLSR models for most nutrients, but their strengths were element-specific. Among them, the MTL hybrid provided the most consistent overall performance across the seven targets, particularly for OC and OM, whereas the FC and TSM hybrids showed more pronounced advantages for K, P, and N, respectively. These differences are consistent with the architectural properties of the models: MTL and TSM adopt forms of local parameter sharing that allow related tasks to exchange information, while the FC hybrid shares all layers across tasks, which can dilute task-specific signals in some cases[38]. Trace elements are difficult to predict due to their low presence and low variability. Although the improvements achieved for B are not yet sufficient for operational use, they indicate that multi-target learning can still extract useful information for difficult targets and motivate further work on trace-element prediction.
Nonetheless, when predicting pH values, all three neural network-based models exhibited a decrease in performance compared to the two traditional regression methods. There exist varying correlation levels between distinct nutrient elements in this study. The pH value, a marker of soil properties, however, correlates weakly with these nutrient elements. The premise of multi-target regression centers on discerning the correlation among numerous tasks through shared layers, subsequently leveraging this knowledge to refine task-specific accuracy. Yet, when task interrelation is tenuous, the neural network often allocates more training emphasis to tasks with robust correlations, which leads to performance degradation of unrelated tasks[21]. A similar phenomenon was also observed in Everton's experiments.
Moreover, due to the correlation between B elements and other nutrients in our study, the neural network greatly enhanced correlation exploration over the PLSR_multi model. Traditional regression methods, lacking the capability to adjust inter-task weights through back-propagation, fail to facilitate inter-task information exchange. This limitation often culminates in diminished predictive prowess, especially in tasks that inherently lack robust predictive outcomes[48]. Neural networks, endowed with the flexibility to select variable weights between tasks, incorporate correlations from other tasks into their main objectives, thus often surpassing the PLSR_single in predictive accuracy[49].
This phenomenon is obvious in the prediction of B elements and OM elements. From the correlations depicted in Fig. 4, it is plausible to infer that the mutual influence between the B element and others significantly enhances its predictive precision within the neural network, notably within the MTL framework. The pronounced correlation among OM, OC, and P elements further elevates their prediction accuracy. The prediction accuracy in terms of OC has surpassed most neural network models that include feature selection steps[11]. In terms of the prediction of N and P, it can basically reach the accuracy of specialized models in other studies[50,51]. And due to less data volume and more regression targets, this model has higher applicability in small-scale seed orchards. Furthermore, elements like B, which are traditionally challenging in single-target regression, are significantly enhanced due to task sharing and generalized learning of multi-target regression. This gives us inspiration that the prediction of trace elements will not be as difficult as before under the synergy of multiple targets. But further research is needed to bring it to a usable level. In stark contrast, elements with superior single-target regression performances, namely K, N, and P, saw marginal improvements.
Furthermore, in the present study it was also noticed that performing multi-target regression by assigning predetermined task weights to the model can improve its training speed and expected accuracy. But choosing to let the model autonomously learn task-specific weights makes more sense for neural networks. This is because, while preset weights can potentially guide the model's training trajectory, they can cause the model to be too conservative, risking weakening the model's potential ability to improve overall accuracy.
Model performs nutrient grading of soil
-
Building on the evaluation results in the previous section, the MTL hybrid model was selectedto examine its ability to perform soil nutrient grading. Soil nutrient classification standards are based on China's Second National Soil Census[52]. Figure 6 shows the comparison between the predicted values and the true values of five elements (OC, OM, N, P, K) with better prediction effects. The solid line in the figure is the true value of the element, and the dotted line is the predicted value. The gray horizontal lines are the thresholds of different nutritional grades. The figure marks the probability of the model classifying soil sample nutrients into the correct grade, with an average accuracy rate of 93%. Using it for precise fertilization guidance can greatly improve the rate of investigation of soil nutrient status, and timely and precise fertilization can be carried out during the period when trees require fertilizer (such as the flower bud differentiation period and fruiting period).
To translate the nutrient grading results into actionable field management practices, a concrete operational fertilization protocol was established (Table 4). Specifically, for soils graded as Level 3 (deficient), when available P falls below 0.4 g/kg, an application of 40 g P2O5 per tree is recommended during the spring bud differentiation period[4]. Similarly, for K levels below 12 g/kg, 35 g KCl per tree should be applied before the early rainy season like June to counteract leaching losses. Conversely, in soils where N exceeds 0.7 g/kg and is graded as Level 1 (rich), a 30% reduction in nitrogen fertilizer application is advised to prevent the decline in resin yield[2]. Regarding B management, despite the model's prediction limitations, a biannual application of 2 g borax per tree in October and March remains a necessary remedial measure, given the widespread regional deficiency evidenced by its minimal variability (STD = 0.0311). This protocol enables precise, timely, and quantitative fertilization tailored to the model's grading output during critical tree growth stages.
Table 4. Soil nutrient grading and fertilization guidelines.
Nutrient Grade 1 threshold Grade 3 threshold Fertilizer recommendation Critical application period P > 0.5 g/kg < 0.4 g/kg 40 g P2O5/tree Spring bud differentiation K > 14 g/kg < 12 g/kg 35 g KCl/tree Early rainy season N > 0.7 g/kg < 0.5 g/kg Reduce 30% N fertilizer Avoid summer application From an operational perspective, this workflow can be embedded into a decision-support system: soil samples are collected and processed through the SST–MTL model to obtain nutrient contents and grades for each tree or management unit; these grades are then combined with the thresholds and recommendations in Table 4 to generate prescription fertilization schedules in terms of dosage and timing. Coupled with the spatial layout of the seed orchard, this framework enables block-wise or tree-wise variable-rate fertilization while reducing field survey time.
Research limitations and future considerations
-
Based on the idea of SST, this study used the PLSR model group as the base model and the neural network as the meta-model to achieve information sharing between multiple models, effectively improving the model performance of multi-target regression. Changing the problem from the depth of data volume to the breadth of data types proved in this study to be an effective way to optimize data sets, addressing challenges faced by small-areas sampling. The correlation between tasks played a crucial role. However, due to equipment and time limitations, we were unable to further explore how the dependencies between multiple targets would change when the correlation altered. Additionally, many neural network architectures were not tested for comparison. We used only the most basic FC model in neural networks, the most typical MTL model in multi-target regression tasks, and the TSM model, which is popular in the field of natural language and is gradually developing towards graph neural networks.
Nevertheless, the findings of this study provided us with inspiration. The multi-target regression model offers significant advantages in guiding seed orchards for precise fertilization. It addresses challenges like insufficient data volume and inefficiencies of multiple single-target training. Furthermore, it offers new avenues to enhance the accuracy of trace element prediction. To gain a deeper understanding of the improved prediction accuracy stemming from this model's structure and to achieve further optimization, it will be essential to establish an interpretable neural network. However, although the correlation between tasks can show the optimization trends in multi-target regression, due to the 'black box' nature of neural networks, caution should still be exercised when interpreting their structures[53].
Furthermore, in practical applications, the model's predictive efficacy may be modulated by dynamic environmental factors and specific stand conditions. For instance, following seasonal rainfall, K content in slope orchards may fluctuate due to leaching, which could lead to short-term deviations from model predictions established based on dry-season samples. Similarly, nutrient demands vary across stands of different ages, with young stands (< 5 years) typically exhibiting higher N requirements than mature stands. Topographic factors like slope position may also exacerbate the spatial heterogeneity of specific elements, such as B, by influencing nutrient transport. Therefore, to ensure prediction accuracy, the following applicability premises should be considered: (1) the sampling period should ideally represent the stand's conditions and avoiding post-extreme weather events; (2) it is recommended to prioritize application in intensively managed orchards with site condition like elevation and slope and stand structures which density > 500 trees/ha similar to those of this study area.
Furthermore, this framework was developed and validated using laboratory near-infrared spectral data collected from soil samples with a contact probe. Therefore, the present findings and fertilization guidelines are intended for use with laboratory or field proximal sensing data, and further research is required before extending the framework to other sensing platforms. Further research will be:
(1) Investigate how task goal correlations affect the generalization of multi-target regression models.
(2) Enhance the predictability of less effective elements like B.
(3) Delve into interpretable models to optimize model performance.
(4) Explore extending the current framework beyond proximal sensing to a wider variety of sensing scenarios.
-
In the present study, an SST-based hybrid model was adopted that combines PLSR layers with neural networks. This model uses a neural network architecture to organize and share the output of multiple single-objective PLSR base models, effectively achieving multi-target regression. When evaluated using test data, the predictive power of the neural network integrated with the PLSR base model was generally better than that of the two pure PLSR models. Among them, the MTL model showed excellent performance. Our approach demonstrates that neural networks can reconstruct the outputs of PLSR models, identify interrelationships between them, and improve prediction accuracy by leveraging shared learning information. When using the model to grade soil nutrients, it was found that the average probability of the MTL model classifying five elements into the correct nutrient grade was 0.93, which means that the model can successfully guide fertilization in seed orchards.
Forestry production emphasizes the comprehensive nutrient status of all soil patches, which is critical for forest protection and precise fertilization. We have successfully transformed the problem of the number of data sets into the problem of data type diversity to address the problem of insufficient data sets caused by the decentralized management and small scale of seed orchards. Given the varying correlations between different forest soil components, these inter-tasks relationships are key to improving the accuracy of multi-target regression models, making this type of regression a natural fit for forest soil monitoring. It should be noted that tasks that lack strong correlation with other tasks should be modeled as single-target regression. Incorporating such tasks into a network of weakly related or unrelated tasks may reduce the predictive power of the model. Overall, when using neural networks, multi-target regression becomes a more effective and accurate prediction technique if multiple tasks exhibit strong interrelationships. Using the PLSR model as the base model and the neural network as the meta-model combines the advantages of the two models, which not only solves the problem of insufficient data volume but also improves the convenience of guiding fertilization by predicting multiple targets at the same time.
This research was funded by the National Key Research and Development Program of Ministry of Science and Technology of the People's Republic of China (2023YFD2200600), and National promotion project of forestry scientific and technological achievements (2020133115).
-
The authors confirm their contributions to the paper as follows: methodology, writing - original draft, visualization: Sun J; software: Sun J, Zhao H; investigation: Sun J, Ding X; writing - review & editing: Xu C, Zhao H, Ding X; supervision: Xu C, Luan Q; resources: Xu C; validation: Zhao H; conceptualization, funding acquisition: Luan Q. All authors reviewed the results and approved the final version of the manuscript.
-
The data presented in this study are available on request from the corresponding author.
-
The authors declare that they have no known competing financial interests or personal relationships that could have appeared to influence the work reported in this paper.
- This article is an open access article distributed under Creative Commons Attribution License (CC BY 4.0), visit https://creativecommons.org/licenses/by/4.0/.
-
About this article
Cite this article
Sun J, Xu C, Zhao H, Ding X, Luan Q. 2025. Soil property-driven fertilization in slash pine orchards: a stacking framework with PLSR and neural networks. Smart Forestry 1: e002 doi: 10.48130/smartfor-0025-0002 

Soil property-driven fertilization in slash pine orchards: a stacking framework with PLSR and neural networks
- Received: 26 August 2025
- Revised: 17 November 2025
- Accepted: 01 December 2025
- Published online: 30 December 2025
Abstract: Accurate assessment of soil nutrients in slash pine (Pinus elliottii Engelm.) seed orchards is crucial for precision fertilization; however, conventional chemical and stoichiometric methods struggle to provide rapid, joint diagnostics for multiple nutrients. To address this gap, a Stacked Single Target (SST) framework was developed that combines Partial Least Squares Regression (PLSR) and neural networks within a stacked generalization architecture from near-infrared (NIR) spectra. In a slash pine seed orchard, 115 tree-based soil sampling points were established, from which laboratory measurements of soil nutrients and NIR spectral data were obtained to train and validate the model. The SST framework first uses clusters of PLSR models to extract features related to each target variable and then employs a neural-network meta-learner on these outputs to perform Multi-target Regression (MTR). The results show that the SST framework achieved a coefficient of determination (R2) of 0.88, and a root-mean-square error (RMSE) of 0.093 for soil organic matter, representing an increase in R2 of approximately 0.25, and a substantial reduction in RMSE compared with a standalone PLSR model. For macronutrient grade classification, the average classification accuracy reached 93%. Even under a limited sample size, the SST model maintained stable performance, alleviating the overfitting issues that commonly occur in small, heterogeneous sites. Overall, by combining traditional PLSR with neural networks in a stacked generalization framework, this study provides a scalable and rapid diagnostic tool for soil nutrient assessment that can support precision fertilization decisions in constrained environments, helping to balance productivity gains with the mitigation of fertilizer pollution.