-
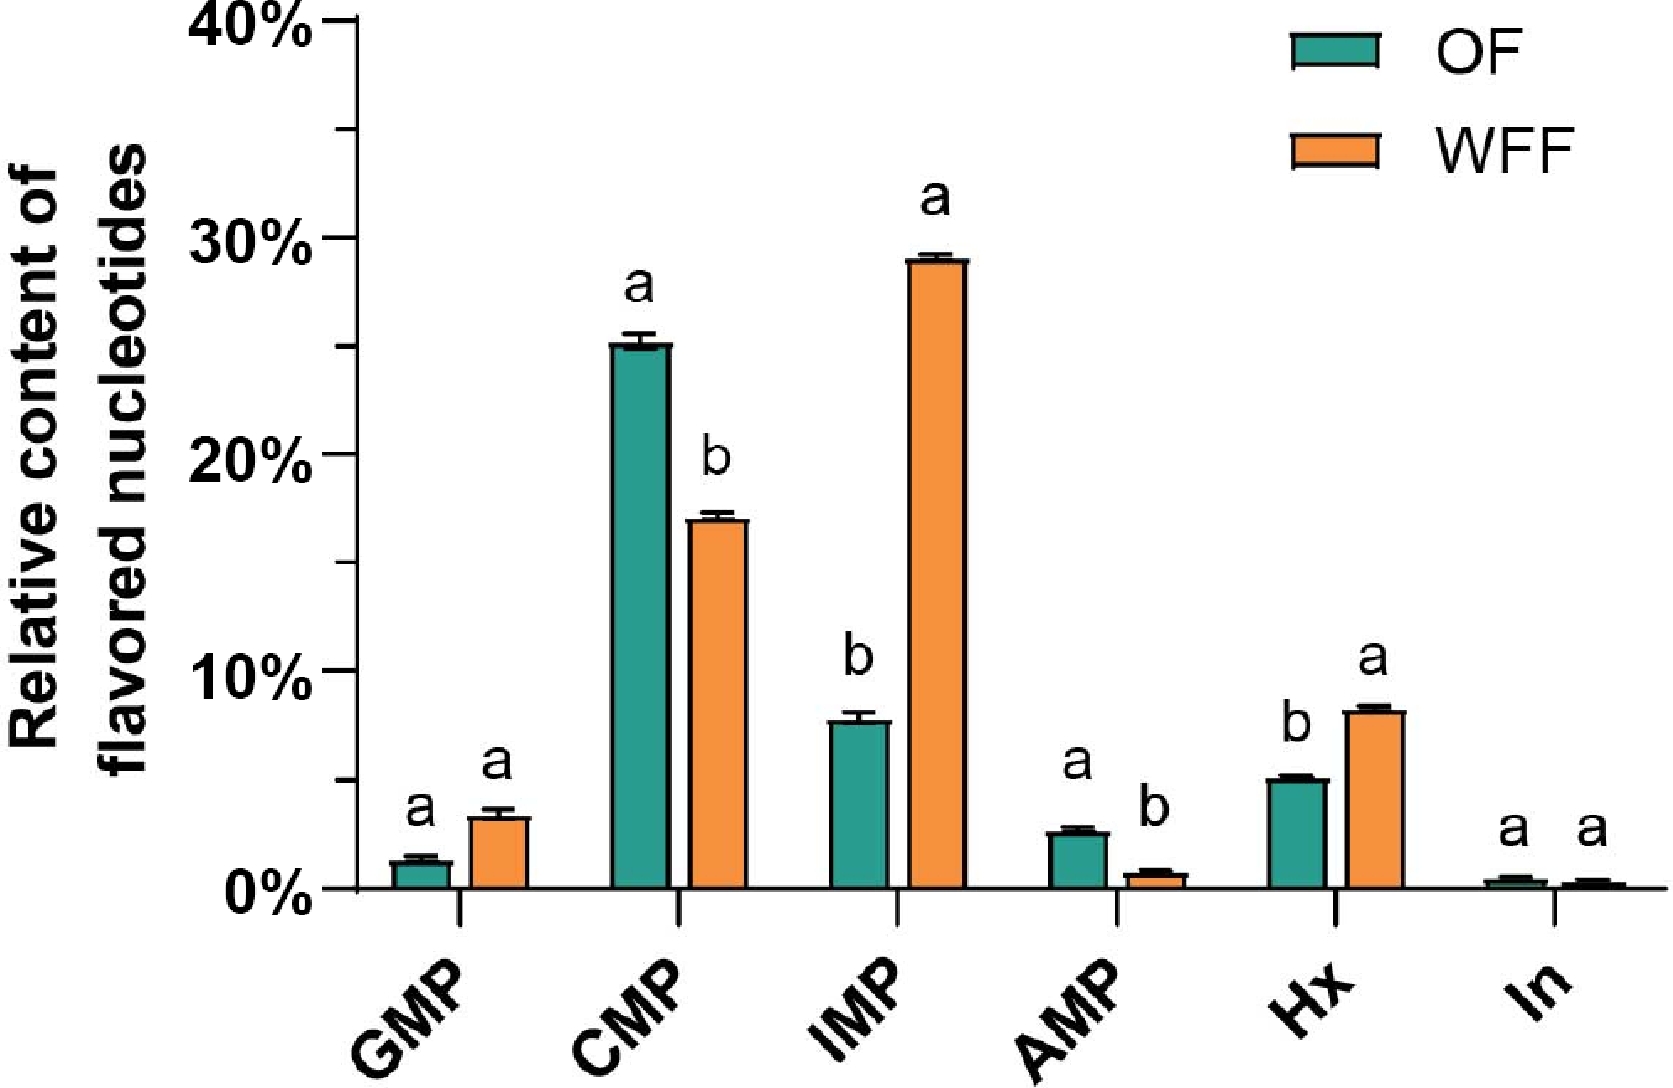
Figure 1.
Percentage of different flavor nucleotides in the loin. Data are presented as mean ± SE. The difference between the two groups of data was compared by independent sample t-test. Different lowercase letters indicate significant differences between the two groups of data (p < 0.05). Abbreviations: GMP: Guanylic acid; CMP: Cytidine acid; IMP: Inosine acid; AMP: Adenylic acid; Hx: Hypoxanthine; In: Inosine; OF: ordinary feed; WFF: wet fermented feed.
-
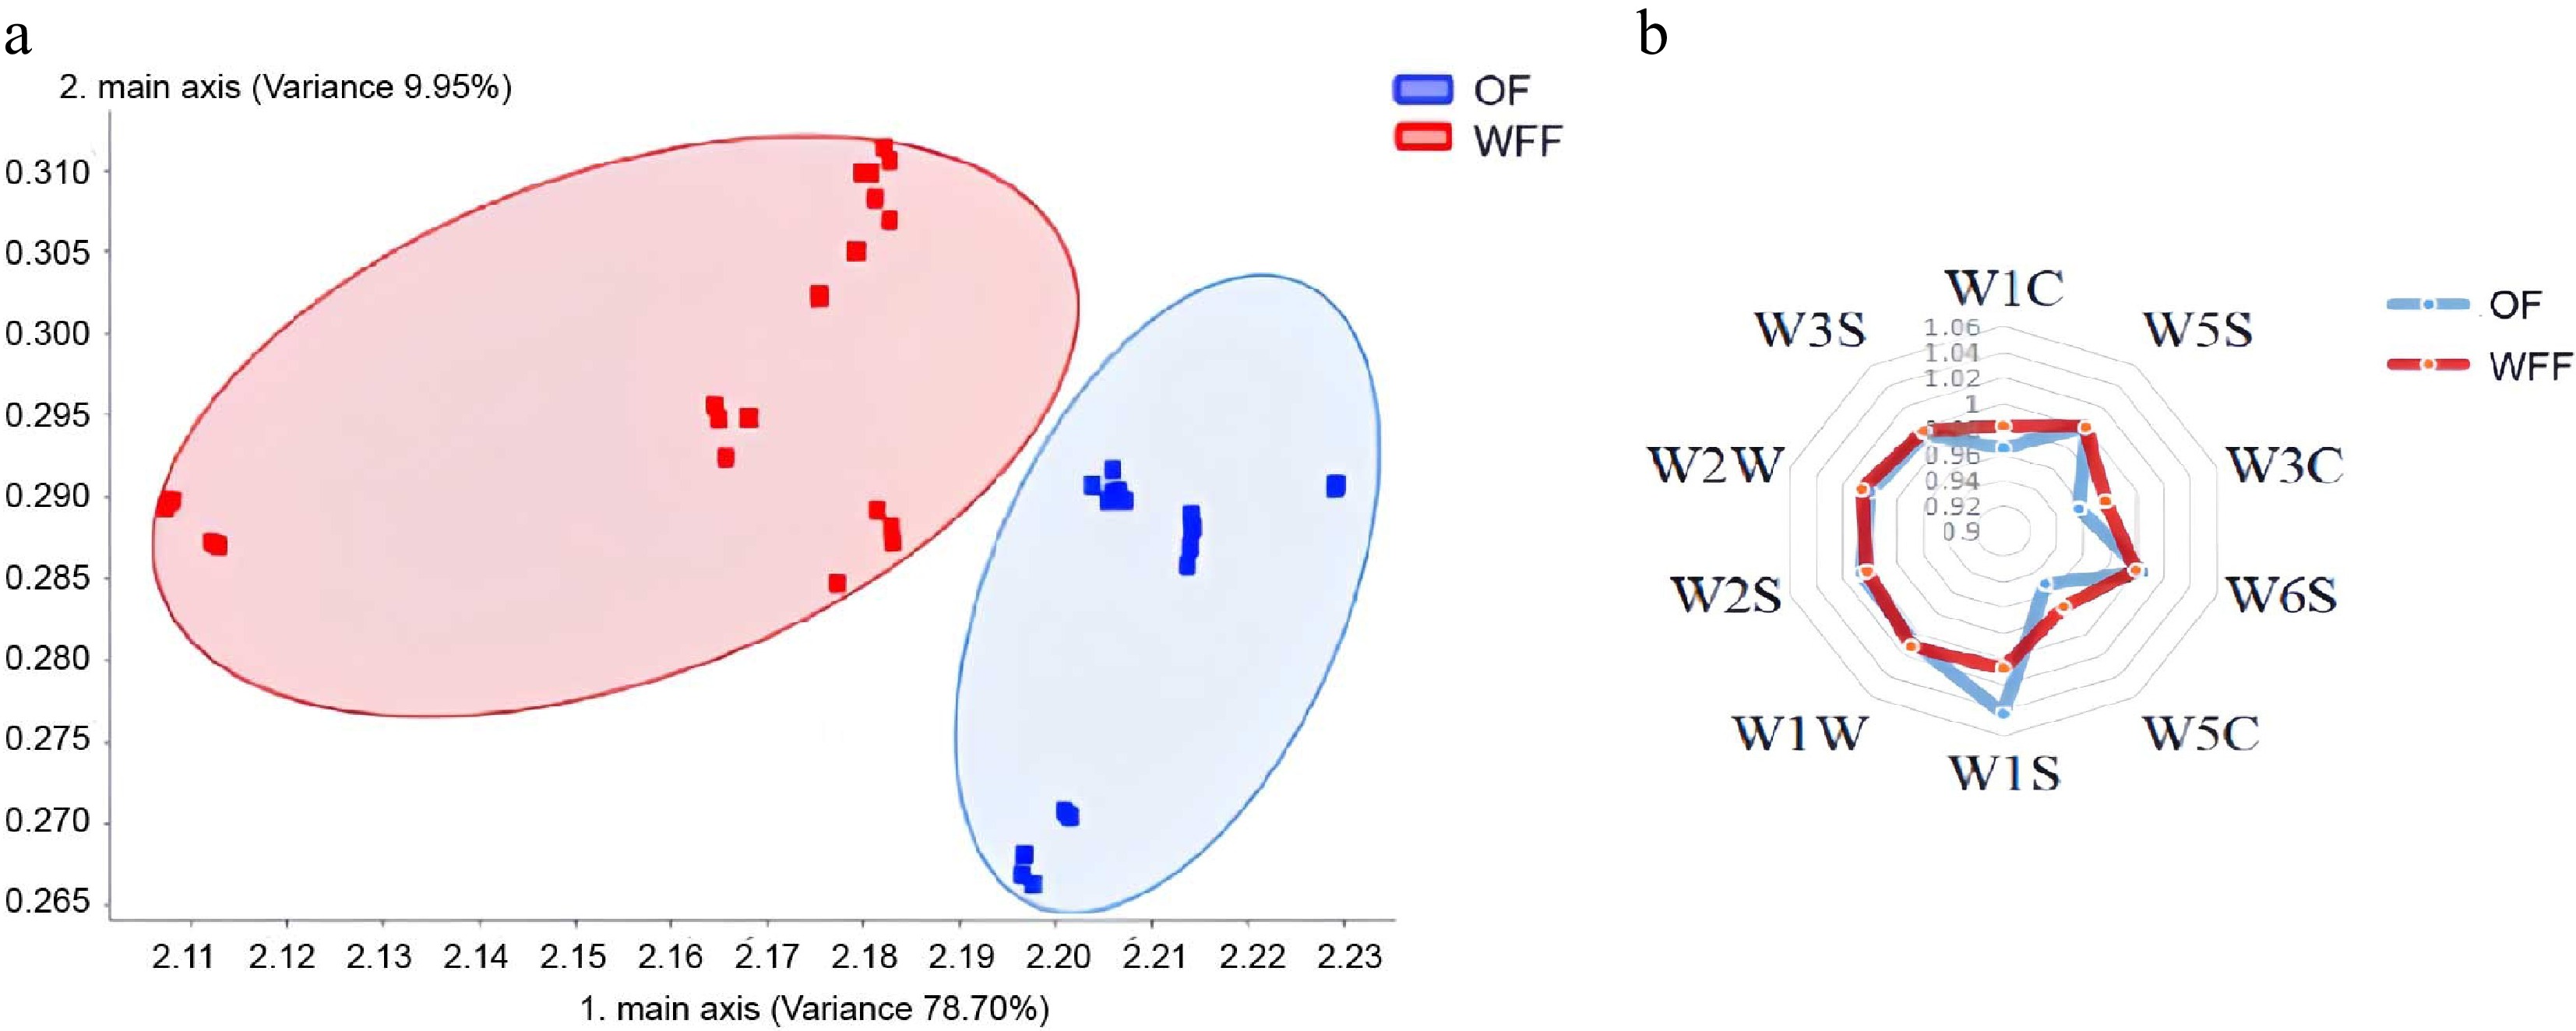
Figure 2.
The flavor profile of loin obtained by E-nose. (a) Principal component analysis (PCA) of the loin flavor of pigs fed with two kinds of feed. (b) Radar map of the loin flavor of pigs fed with two kinds of feed. Abbreviations: OF: ordinary feed; WFF: wet fermented feed.
-
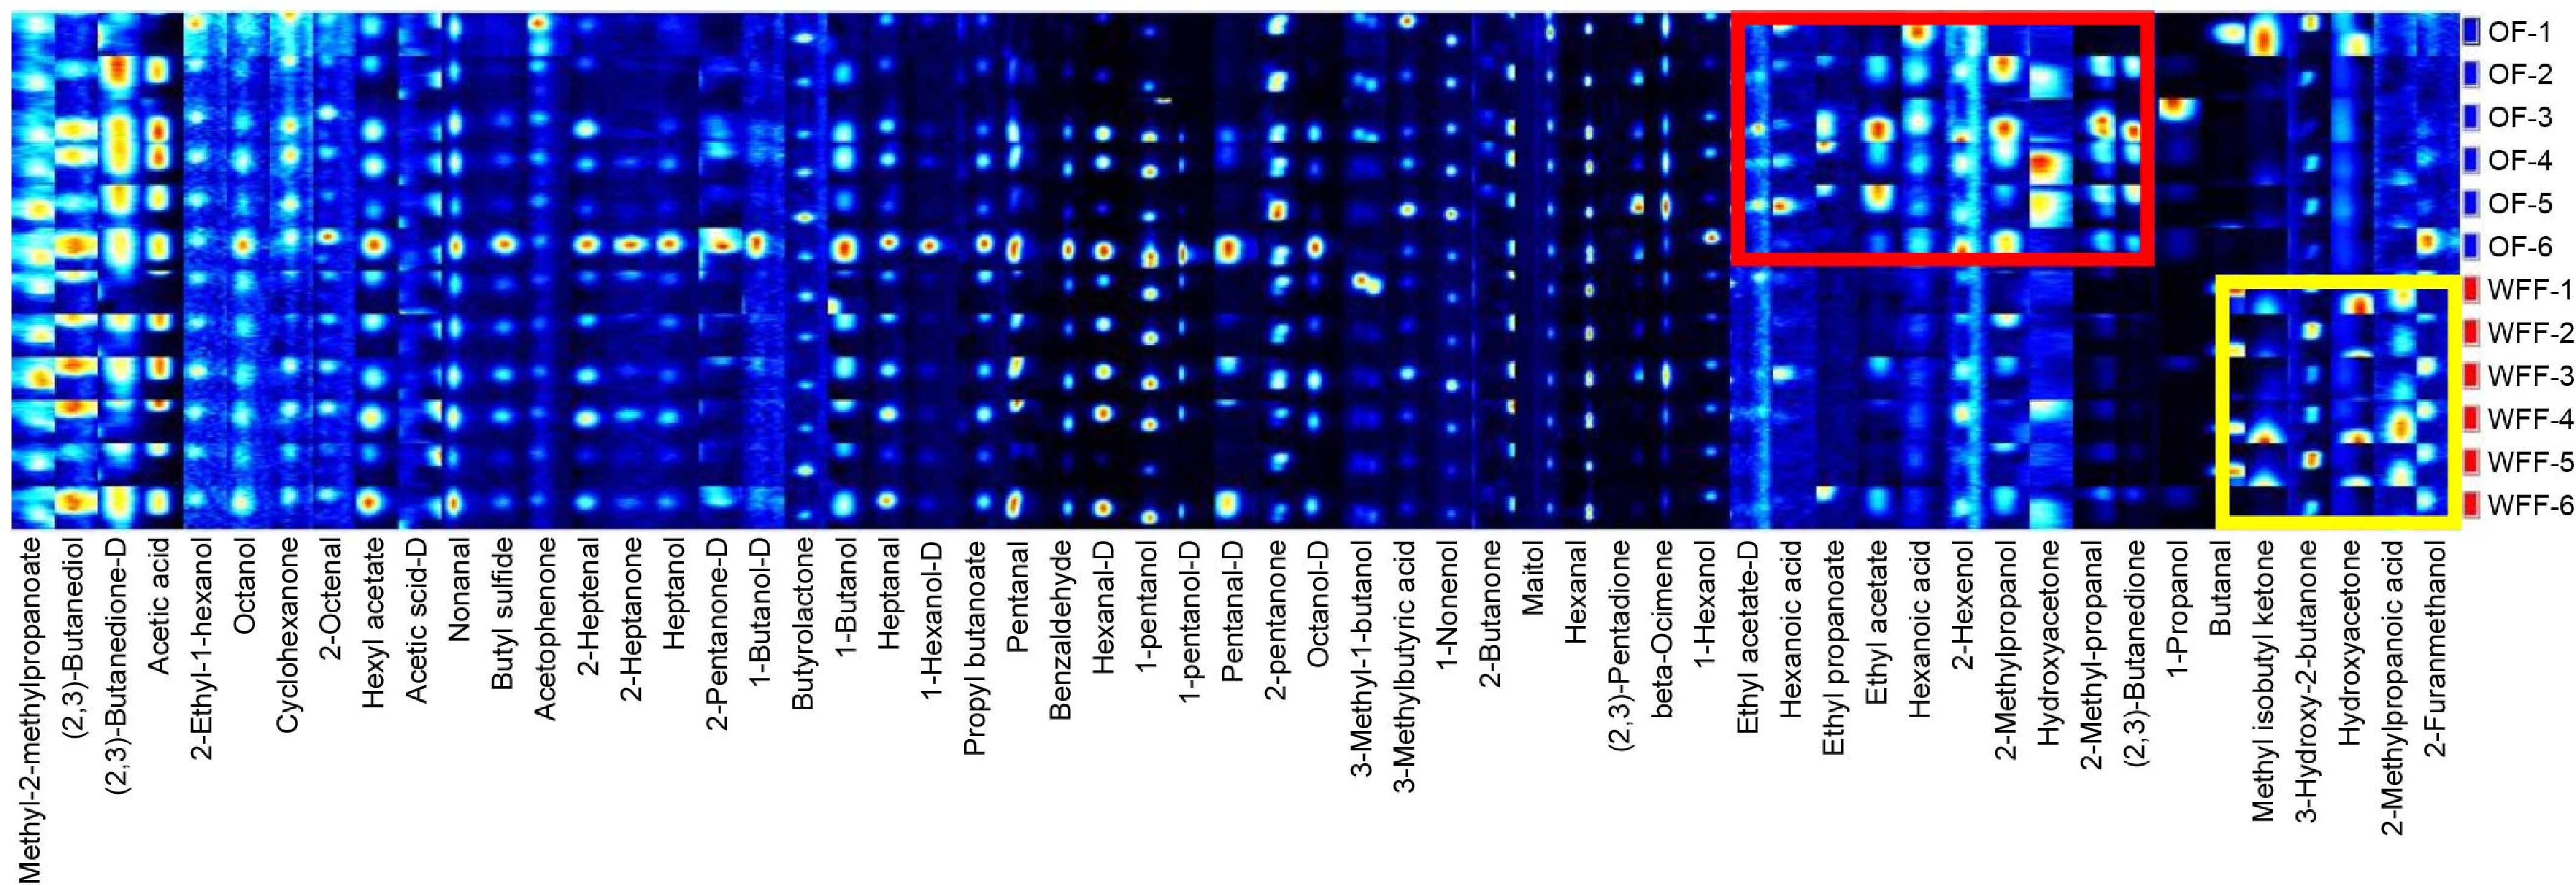
Figure 3.
Gallery plot of volatile organic compounds in the loin. Each row represents a sample. Each column represents a volatile compound. The color scale represents the concentration of the volatile compound ("D" means dimer). The content of substances in the red box is higher in the OF group, while that in the yellow box is higher in the WFF group. Abbreviations: OF: ordinary feed; WFF: wet fermented feed.
-
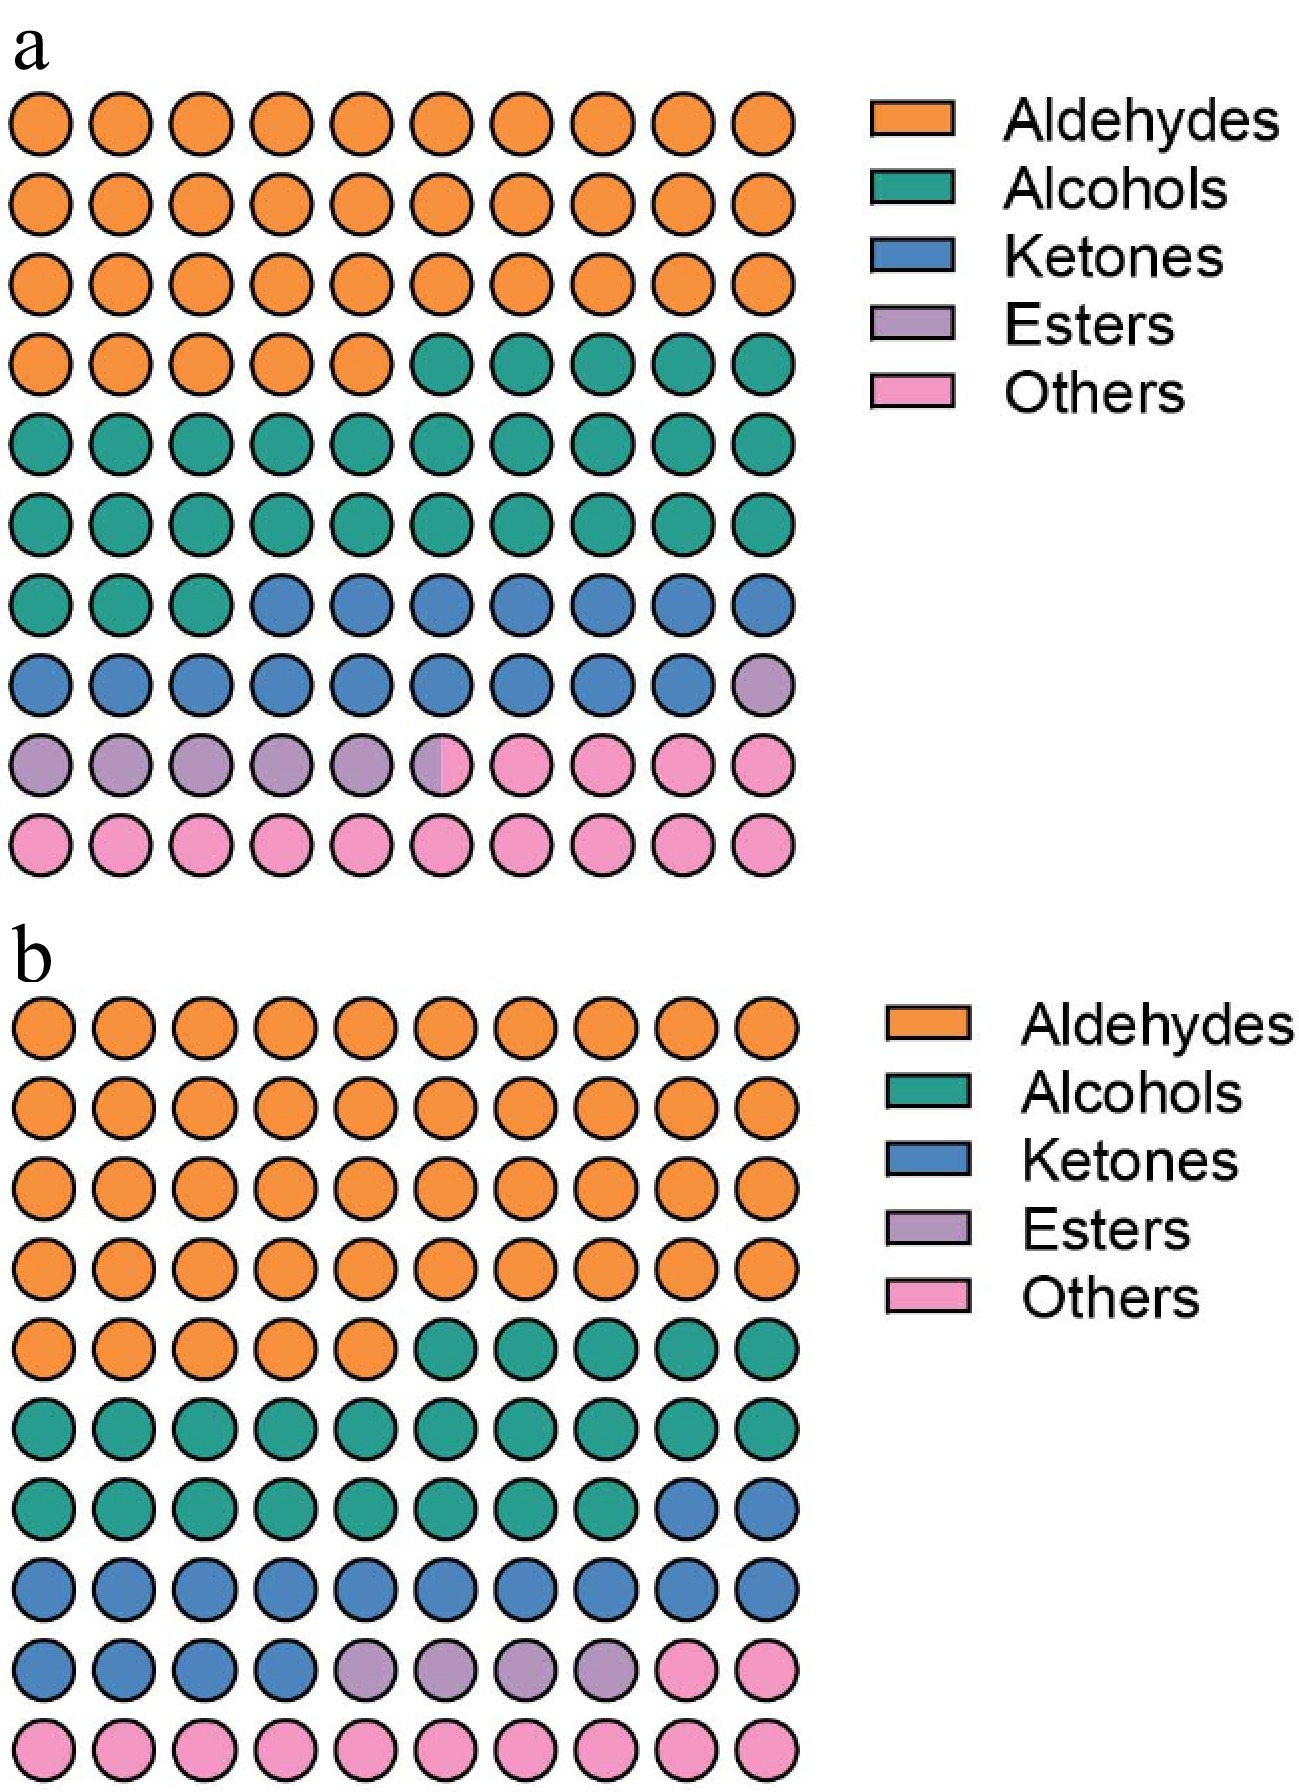
Figure 4.
Percentage of six volatile organic compounds in the loin in (a) OF, and (b) WFF groups. Abbreviations: OF: ordinary feed; WFF: wet fermented feed.
-
Amino acids (%) OF WFF SEM p-value Aspartic acid 0.21 0.27 0.01 0.63 Threonine 3.59 8.59 0.40 < 0.01 Serine 1.65 2.25 0.07 0.19 Glutamate 2.38 5.64 0.27 0.01 Glycine 4.98 11.47 0.53 0.03 Alanine 8.62 20.97 1.01 < 0.01 Cysteine 0.21 0.63 0.03 < 0.01 Valine 1.60 2.10 0.05 0.07 Methionine 0.56 0.44 0.01 0.10 Isoleucine 1.04 1.10 0.02 0.56 Leucine 1.85 1.90 0.02 0.71 Tyrosine 0.81 0.85 0.01 0.42 Phenylalanine 1.59 2.24 0.05 0.02 Lysine 1.60 3.02 0.12 0.03 Histidine 1.01 1.86 0.09 0.14 Arginine 0.78 1.29 0.04 0.01 Essential amino acid 11.27 18.95 0.62 0.04 Flavor amino acid 18.59 41.44 1.84 < 0.01 γ-aminobutyric acid 0.54 0.32 0.03 0.19 OF: composition of free amino acids in the loin of pigs fed with ordinary feed; WFF: composition of free amino acids in the loin of pigs fed with wet fermented feed. Table 1.
Composition of free amino acids in loin.
-
Fatty acids (mg/100 g loin) OF WFF SEM p-value Caprylic acid C8:0 22.55 – 0.13 – Capric acid C10:0 115.21 49.20 5.29 < 0.01 Lauric acid C12:0 91.43 38.95 4.21 < 0.01 Myristic acid C14:0 6.56 6.15 0.35 0.11 Pentadecylic acid C15:0 24.60 33.21 0.73 < 0.01 Palmitic acid C16:0 666.25 795.40 10.34 0.04 Pearl acid C17:0 216.48 109.47 8.57 < 0.01 Stearic acid C18:0 577.69 537.51 12.72 0.67 Arachic acid C20:0 77.90 76.26 0.47 0.54 Docosate C22:0 83.64 58.63 3.31 0.05 Saturated fatty acid (SFA) 1,923.31 1,745.78 20.02 0.02 Myristic acid C14:1 95.12 161.95 5.35 0.65 Palmitoleic acid C16:1 112.34 205.82 7.50 < 0.01 Heptacenoic acid C17:1 164.41 150.88 2.55 0.79 Oleic acid C18:1n9c 1,243.53 1,265.67 1.78 0.85 Eicosenoic acid C20:1 16.81 – 0.06 – Monounsaturated fatty acid (MUFA) 1,632.21 1,784.32 12.43 0.09 Trans linoleic acid C18:2n6t 20.09 6.56 1.69 < 0.01 Linoleic acid C18:2n6c 357.11 446.08 7.79 0.04 α-Linolenic acid C18:3n3 41.82 28.70 1.06 0.39 Eicosadienoic acid C20:2 40.59 26.24 4.44 0.05 Eicosatraenoic acid C20:3n6 29.93 37.31 0.66 0.05 Eicosatraenoic acid C20:3n3 24.60 11.89 8.13 < 0.01 Arachidonic acid C20:4n6AA – 31.98 0.13 – Docosahexaenoic acid C22:6n3DHA 35.67 27.88 1.64 0.06 Polyunsaturated fatty acids (PUFA) 549.81 616.64 15.10 0.59 OF: composition of fatty acids in the loin of pigs fed with ordinary feed; WFF: composition of fatty acids in the loin of pigs fed with wet fermented feed. The difference between the two groups of data was compared by independent sample t-test. "–" indicates that the substance was not detected. Table 2.
Composition of fatty acids in loin.
-
Number Compound RI Rt Dt OF WFF SEM p-value Aldehydes (11) 1 N-butyraldehyde 592.7 155.956 1.1227 3.17 14.96 0.95 0.03 2 Pentanal 691.1 215.162 1.1916 3.09 3.42 0.03 0.42 3 Pentanal-D 688.7 213.467 1.4233 0.91 0.63 0.02 0.22 4 Hexanal 801.5 319.848 1.274 1.44 1.30 0.01 0.01 5 Hexanal-D 802.7 321.219 1.5533 0.77 0.66 0.01 0.50 6 Heptaldehyde 906.5 464.281 1.3434 6.62 7.62 0.08 < 0.01 7 2-Hepteneal 966.6 575.278 1.2576 1.17 0.87 0.02 0.02 8 Octenal 1,055.8 794.090 1.3369 0.44 0.37 0.01 0.50 9 Nonanal 1,099.2 924.726 1.4816 10.68 11.53 0.09 0.13 10 Benzaldehyde 997.4 642.268 1.1368 4.42 3.82 0.02 < 0.01 11 Methylpropionaldehyde 544.1 134.071 1.0913 0.06 0.26 0.02 < 0.01 Alcohols (17) 12 Propanol 530.5 128.641 1.1139 3.04 0.74 0.19 < 0.01 13 Butanol 662.2 195.764 1.1764 2.31 1.93 0.03 0.10 14 Butanol dimer 661.2 195.098 1.3793 0.26 0.26 0.01 0.06 15 Amyl alcohol 762.0 274.140 1.2526 5.71 6.68 0.08 0.06 16 Pentanol-D 759.0 271.311 1.5119 3.03 3.31 0.04 < 0.01 17 N-hexanol 874.4 414.223 1.3223 2.68 1.90 0.06 < 0.01 18 N-hexanol-D 876.1 412.716 1.6478 0.61 0.22 0.03 < 0.01 19 Heptanol 984.6 611.704 1.4035 0.33 0.50 0.01 0.25 20 Octanol 1,070.4 838.377 1.4765 0.28 0.24 0.01 0.06 21 Octanol-D 997.6 639.692 1.4334 3.10 2.60 0.05 0.13 22 Sugar alcohol 871.0 407.499 1.3693 0.31 0.42 0.01 0.06 23 Isobutanol 638.9 181.000 1.1706 0.89 0.63 0.02 0.17 24 3-Methyl-1-Butanol 725.0 241.335 1.2484 0.50 1.01 0.04 0.03 25 2,3-Butanediol 535.0 130.395 1.1691 0.49 0.61 0.01 0.06 26 Ethyl hexanol 1,035.2 735.440 1.4242 0.24 0.30 0.01 0.06 27 Vinyl alcohol 856.0 388.079 1.1847 0.52 0.32 0.02 < 0.01 28 Nonenol 1,159.1 1,146.169 1.8282 1.81 1.41 0.03 0.17 Ketones (13) 29 2-Butanone 622.4 170.746 1.2438 5.28 4.36 0.08 < 0.01 30 2-Pentanone 686.1 211.572 1.392 0.53 0.19 0.03 < 0.01 31 2-Pentanone-D 675.9 204.492 1.3648 0.61 0.48 0.01 < 0.01 32 Heptanone 896.9 446.869 1.6324 0.35 0.25 0.01 < 0.01 33 3-Hydroxy-2-Butanone 721.9 241.704 1.3309 1.05 2.47 0.11 0.09 34 Hydroxyacetone 634.8 178.298 1.0597 0.41 3.54 0.25 < 0.01 35 Hydroxyacetone-D 628.2 175.427 1.2121 0.37 0.16 0.02 0.50 36 2,3-butanedione 535.0 130.395 1.1691 2.29 2.45 0.02 < 0.01 37 2,3-butanedione-D 535.0 130.395 1.1691 0.58 0.54 0.01 0.50 38 Acetophenone 1,064.0 814.998 1.1915 0.32 0.27 0.01 0.06 39 Cyclohexanone 894.4 438.590 1.152 0.36 0.27 0.01 < 0.01 40 Methyl isobutyl ketone 739.2 256.784 1.1709 0.36 1.25 0.07 0.06 41 2,3-Pentanedione 664.6 196.962 1.3190 2.66 0.23 0.20 < 0.01 Esters (7) 42 Ethyl acetate 611.9 165.825 1.0958 1.83 0.49 0.11 < 0.01 43 Ethyl acetate-D 612.4 166.094 1.3377 0.39 0.23 0.01 0.06 44 Ethyl propionate 680.9 207.899 1.1525 0.46 0.13 0.03 0.50 45 2-Methyl 680.9 207.899 1.1525 0.39 0.54 0.01 0.50 46 methylpropionate 917.4 482.754 1.0885 0.55 0.46 0.01 0.12 47 Butyrolactone 891.3 433.702 1.2631 1.66 1.58 0.01 < 0.01 48 Propyl butyrate 1,014.6 682.867 1.415 0.85 0.82 0.01 < 0.01 Acids (6) 49 Acetic acid 598.6 158.918 1.0599 4.41 4.72 0.03 0.17 50 Acetic acid-D 618.4 169.338 1.1466 0.24 0.26 0.01 0.50 51 Caproic acid 1,008.4 667.921 1.3127 0.50 0.27 0.02 < 0.01 52 Caproic acid-D 982.7 609.280 1.6433 0.42 0.26 0.01 0.17 53 2-Methylpropionic acid 777.9 293.139 1.1434 0.19 0.37 0.01 0.50 54 Methyl butyric acid 826.3 349.278 1.4798 1.42 0.94 0.04 0.09 Sulfur compound (1) 55 Dibutyl sulfide 1,086.0 888.807 1.3045 0.59 0.51 0.01 < 0.01 Phenols (1) 56 Maltol 1,086.6 883.783 1.2258 0.13 0.11 0.01 0.50 Terpenes (1) 57 Basilene 1,018.6 692.794 1.6864 5.72 4.62 0.10 0.23 RI, retention index; Rt, retention time; Dt, drift time; OF, the relative content of volatile organic compounds in the loin of pigs fed with ordinary feed; WFF, the relative content of volatile organic compounds in the loin of pigs fed with WFF. Table 3.
The relative content of volatile organic compounds in loin.
Figures
(4)
Tables
(3)