-
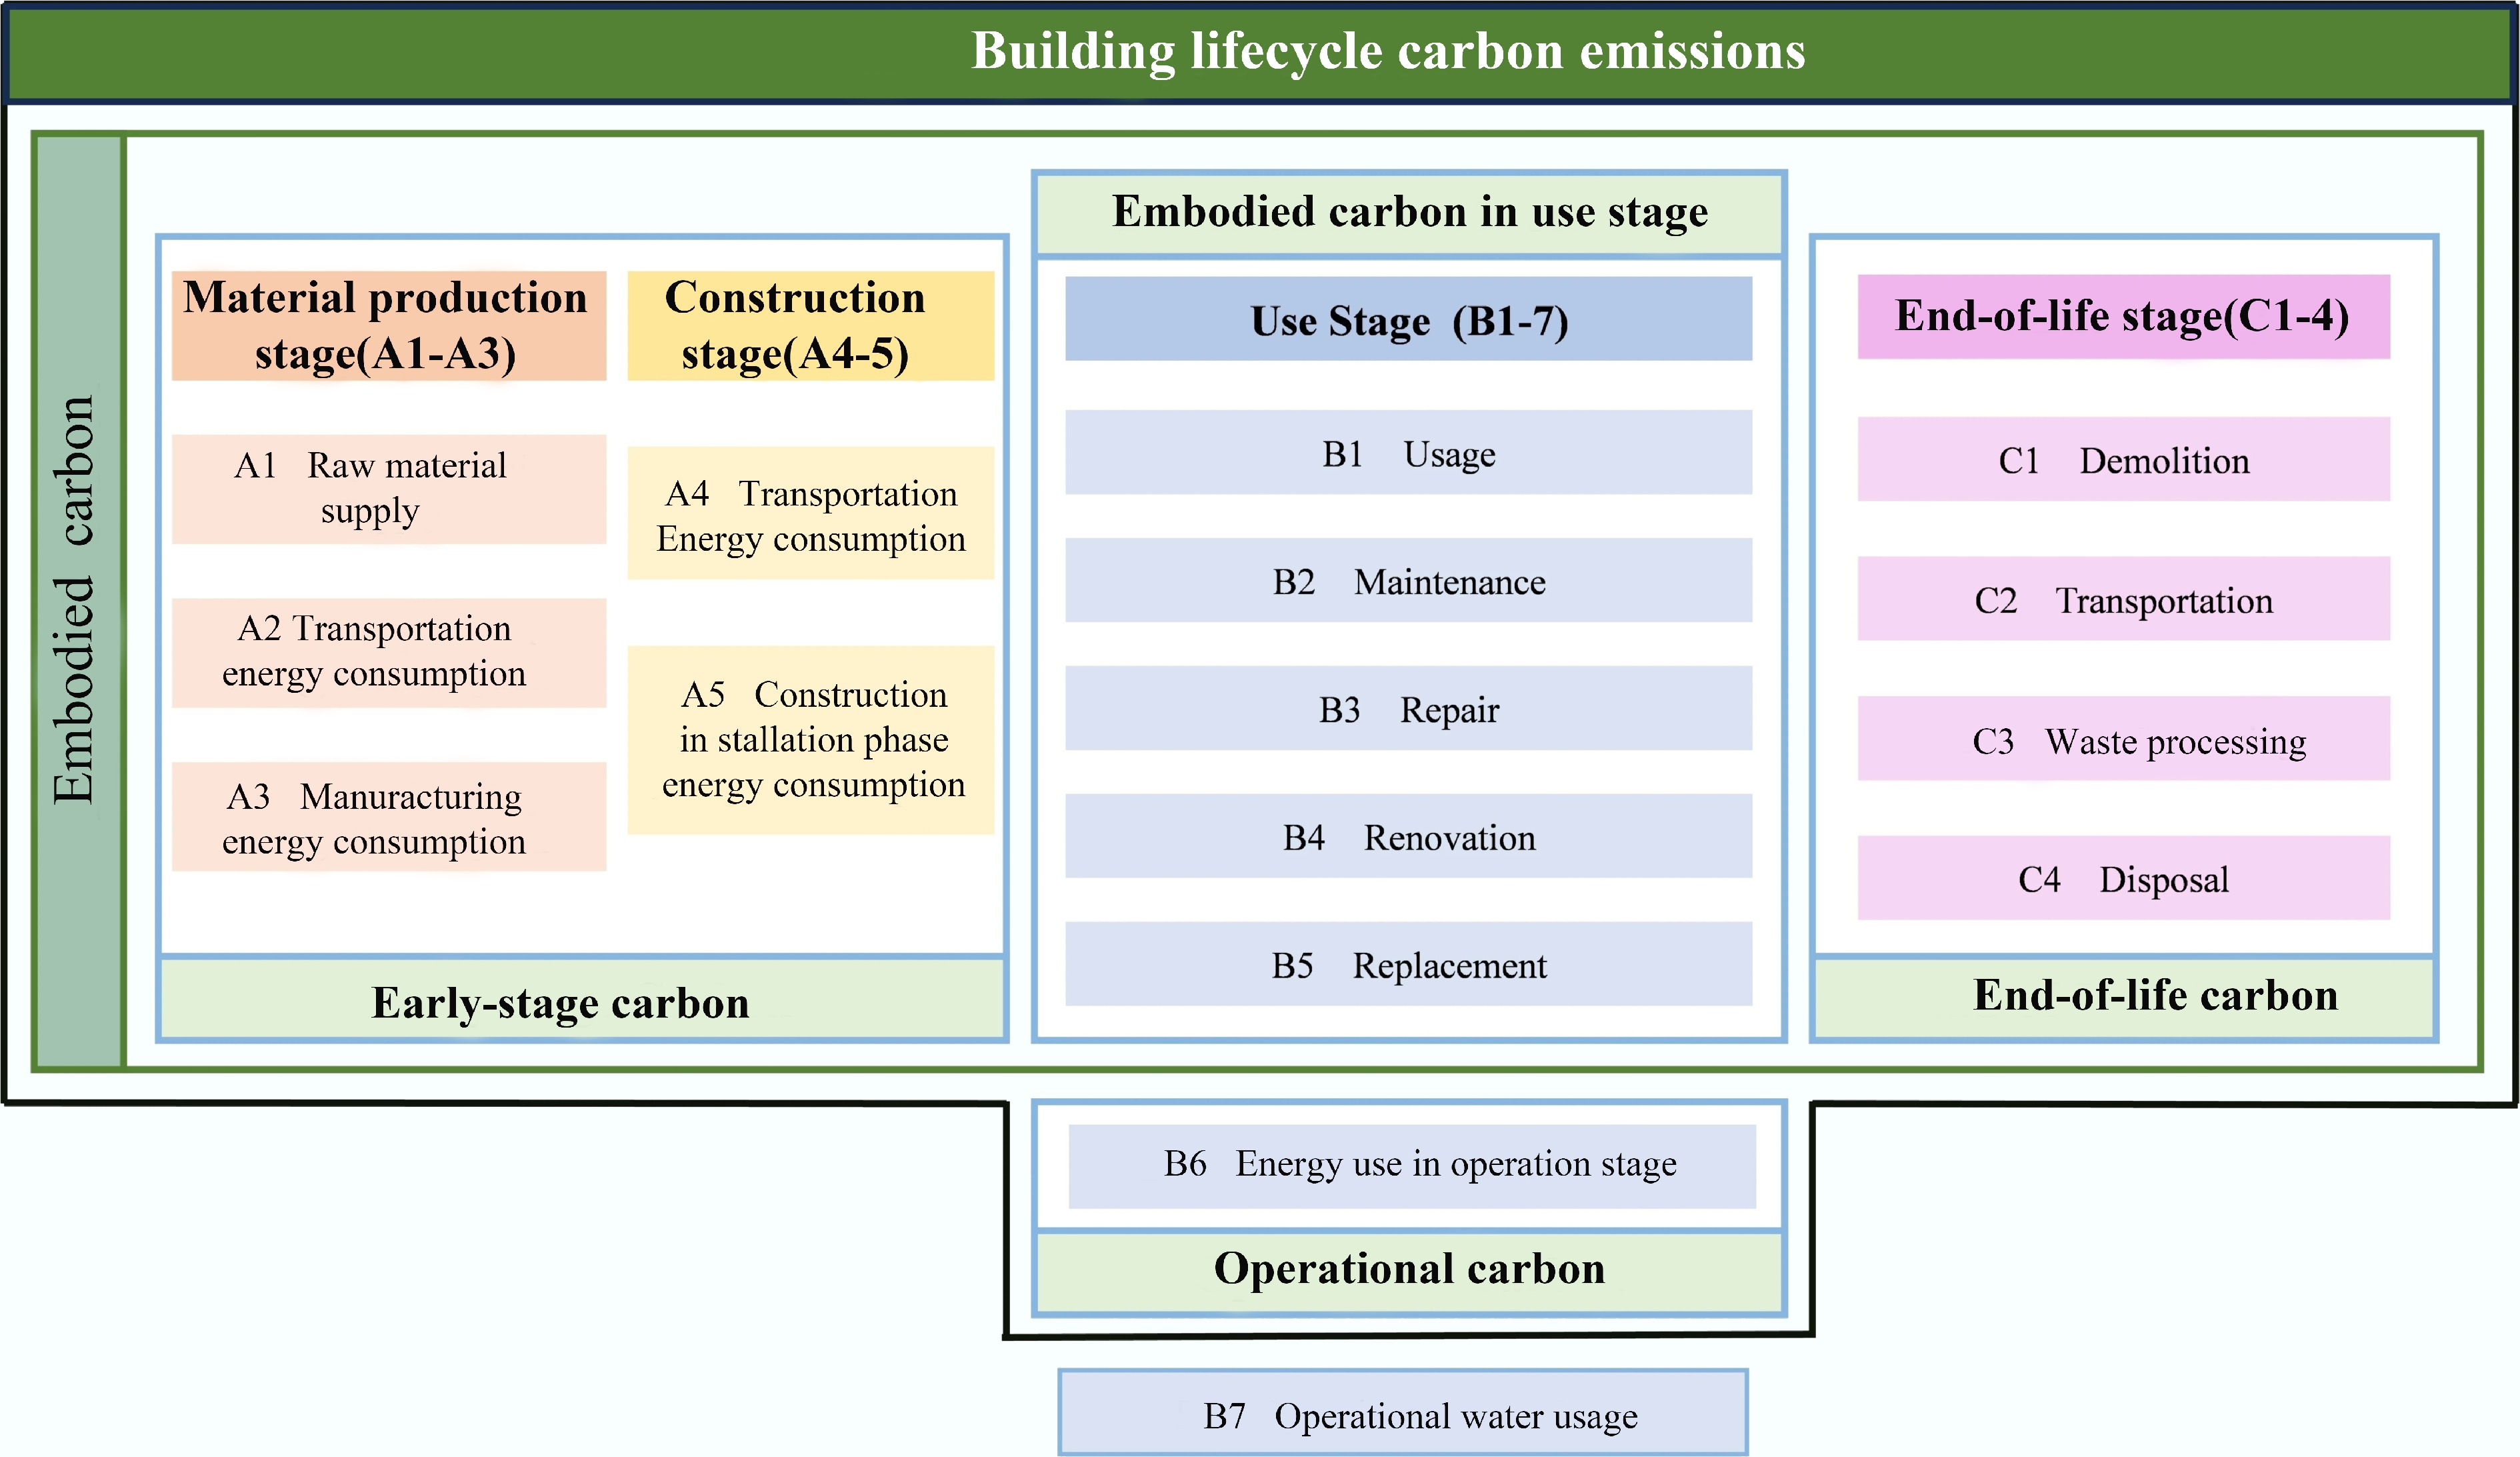
Figure 1.
Classification of carbon emissions in the whole life cycle of buildings and definition of system boundary.
-
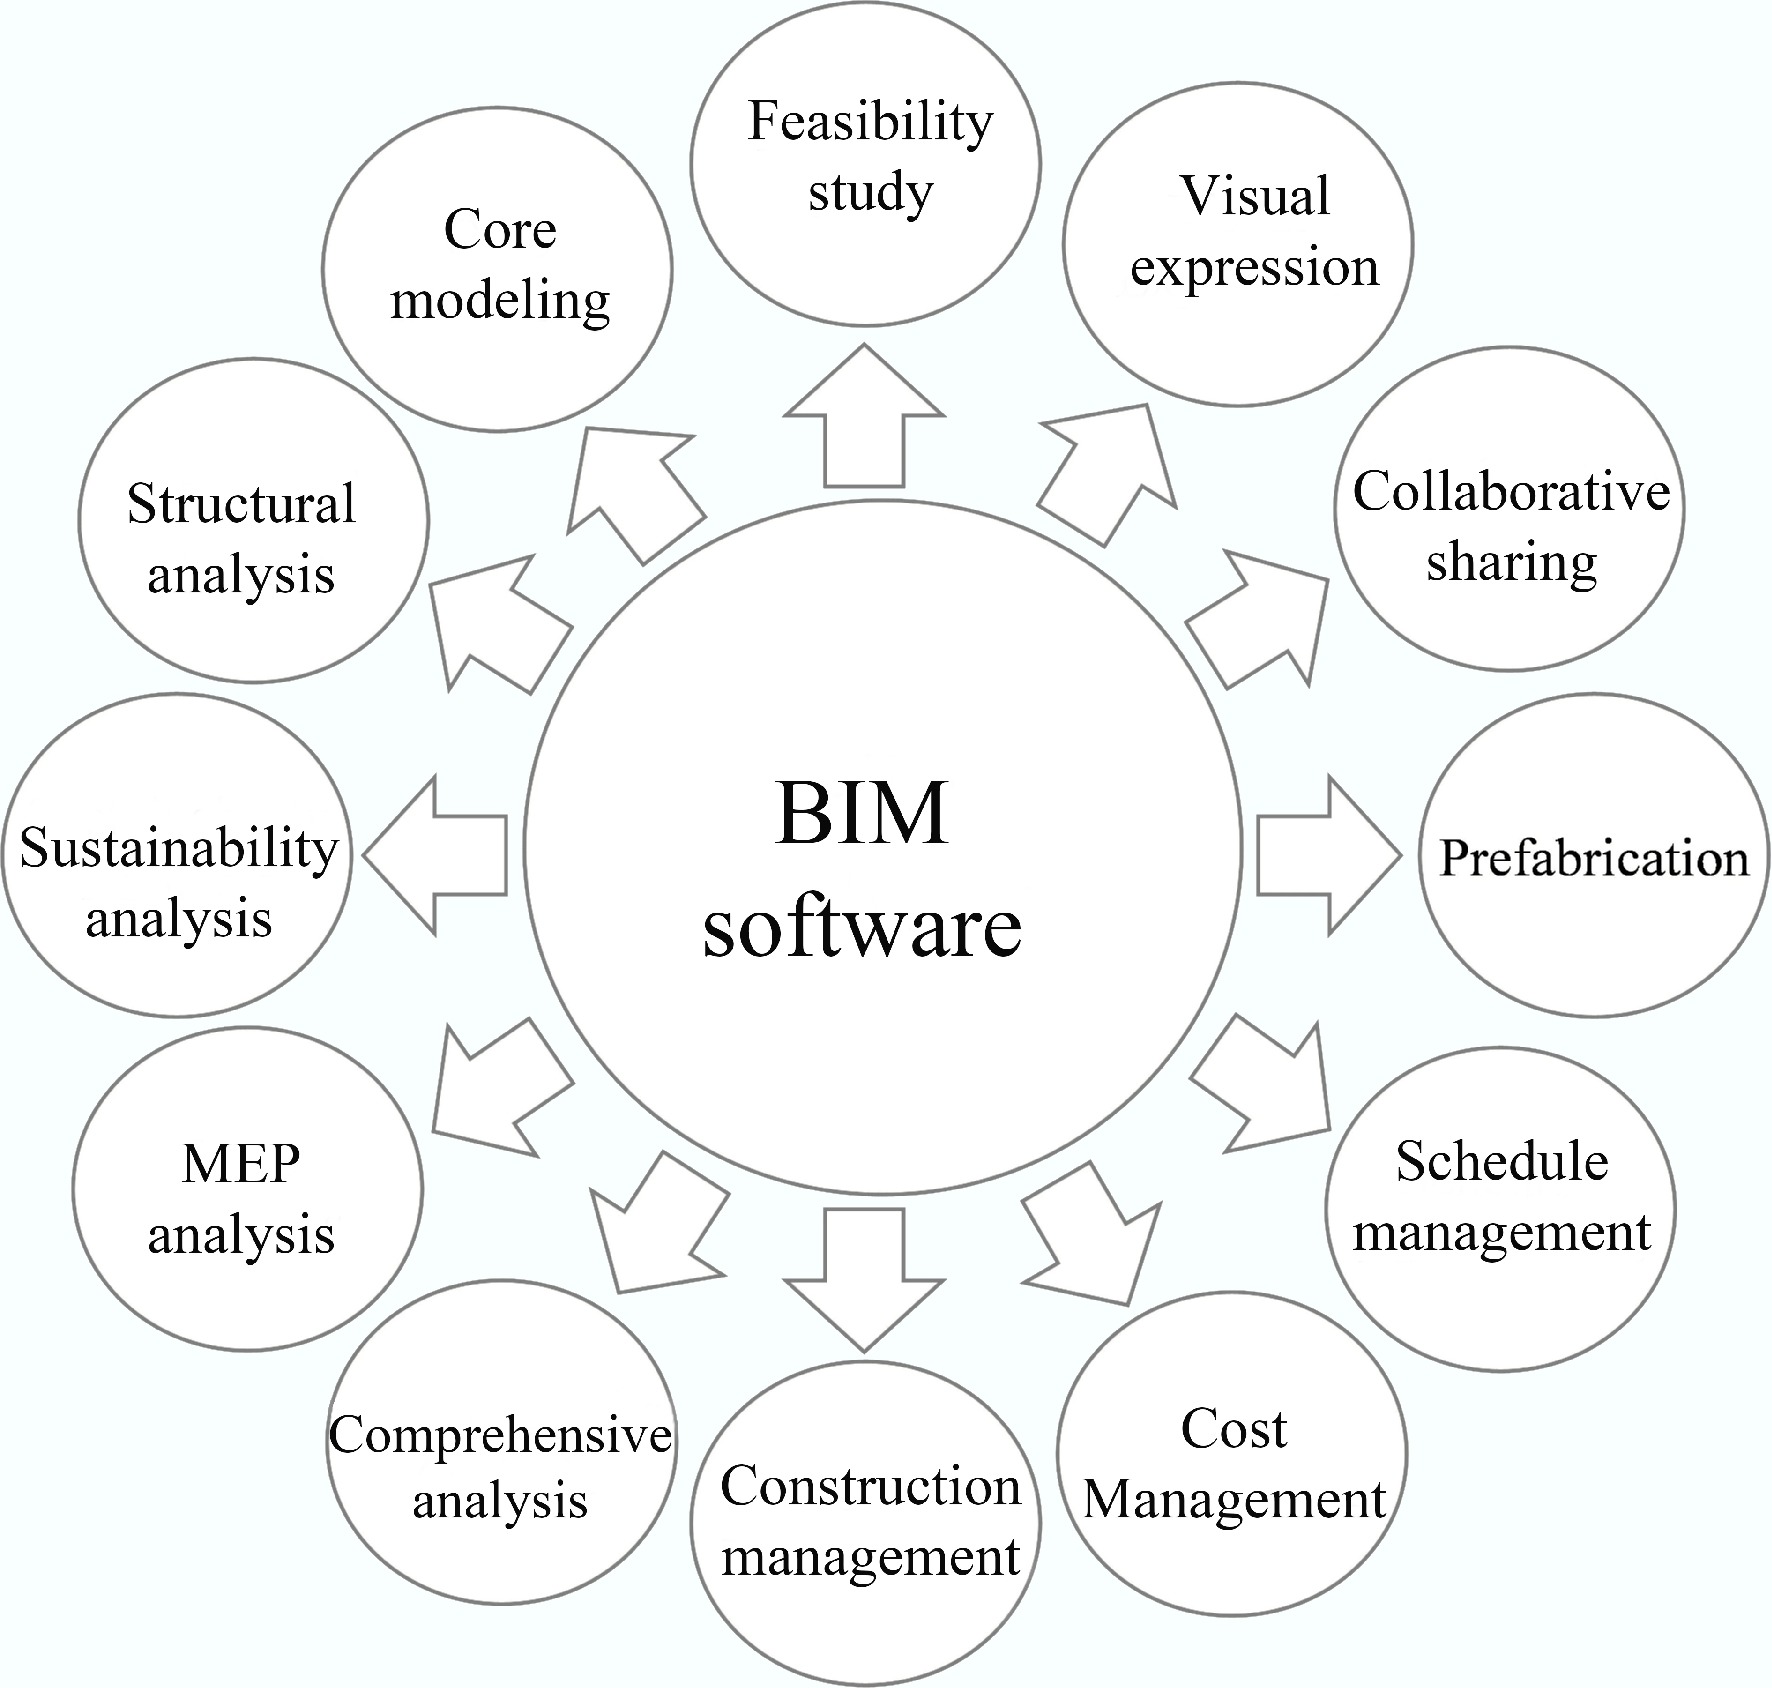
Figure 2.
BIM software classification.
-

Figure 3.
Provides a sustainable decision-making framework for the proposed building using the BIM model.
-
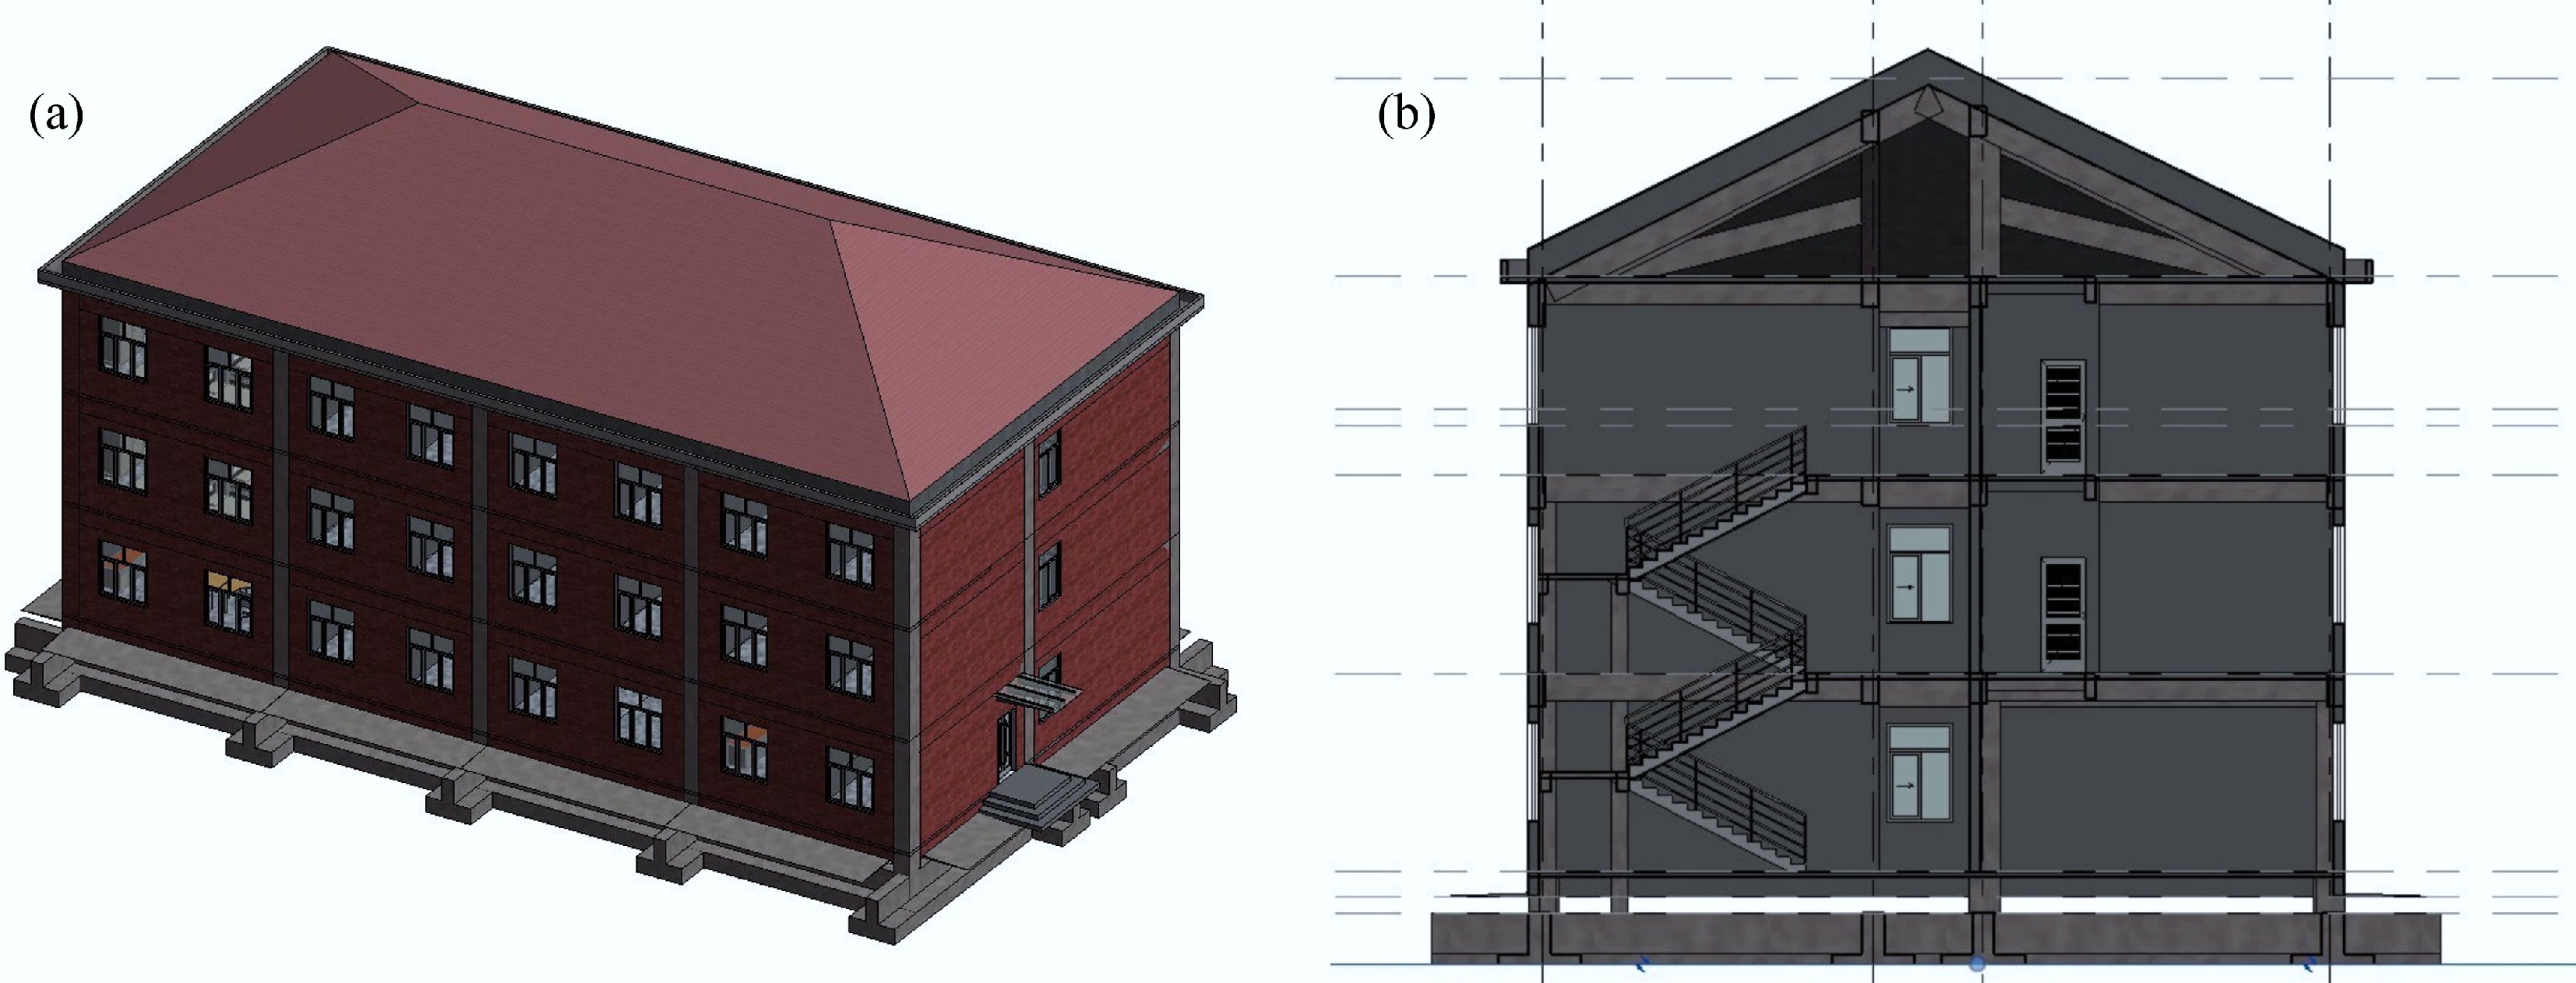
Figure 4.
BIM model. (a) Model of single building, (b) model of building section.
-
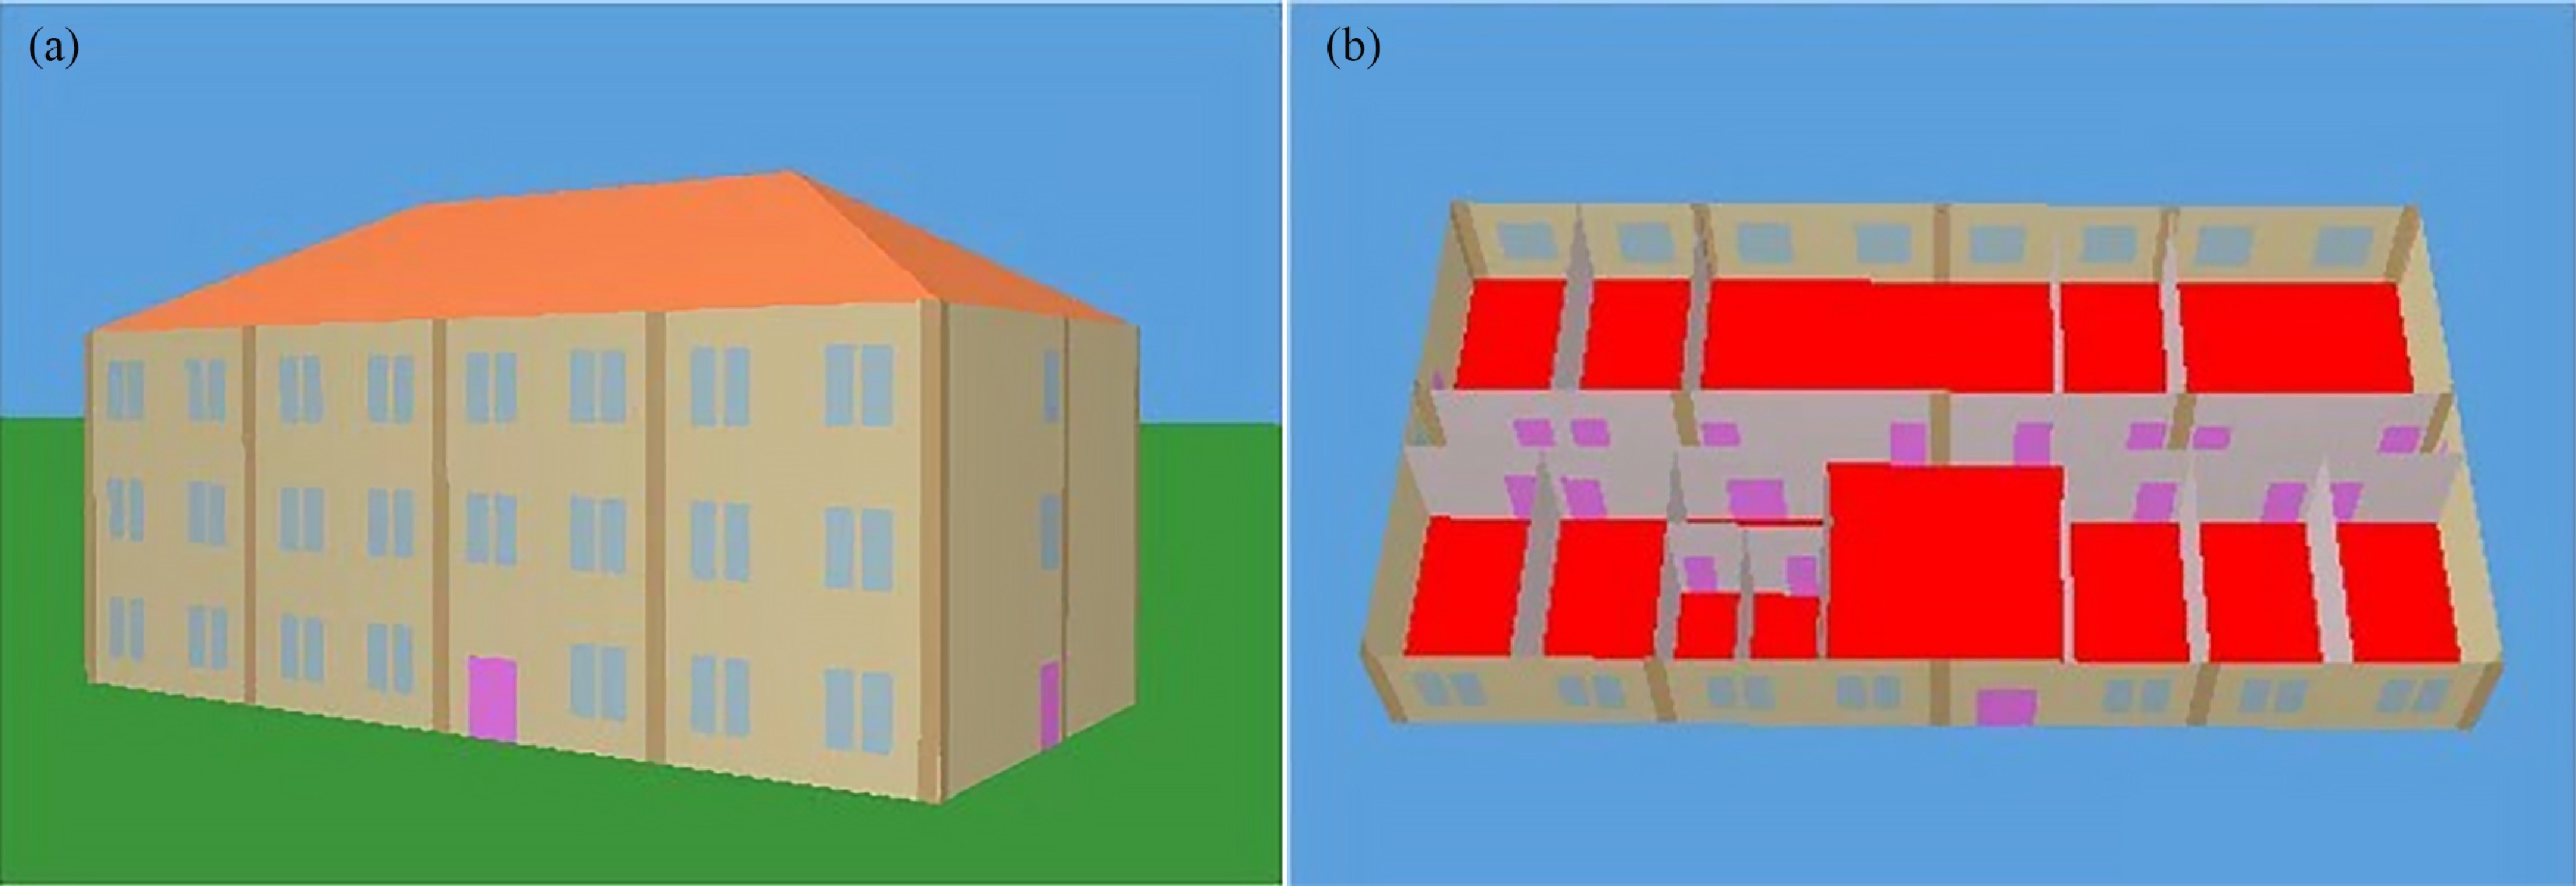
Figure 5.
CEEB model. (a) Model of single building, (b) model of building standard floor.
-
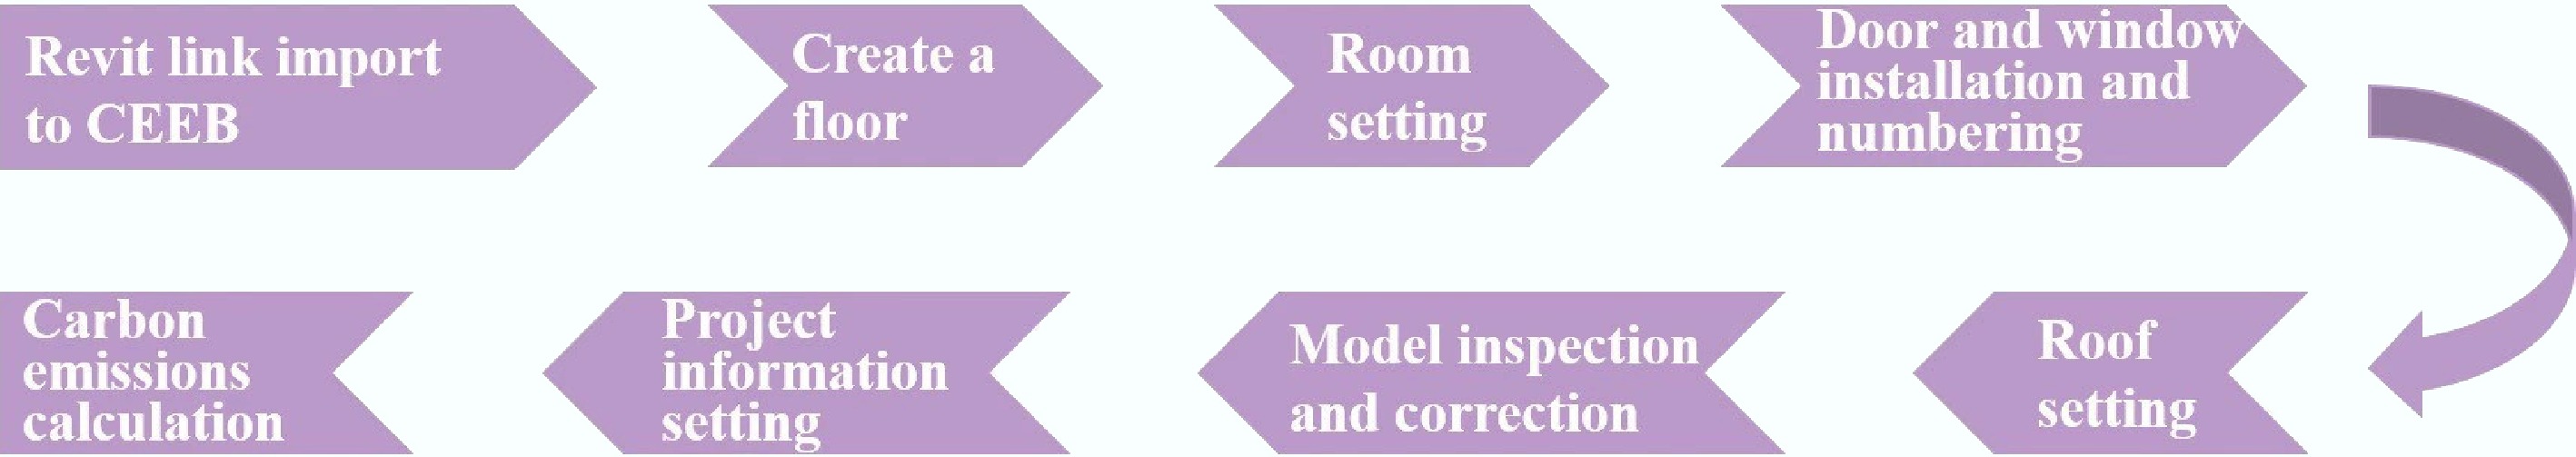
Figure 6.
CEEB model building process.
-
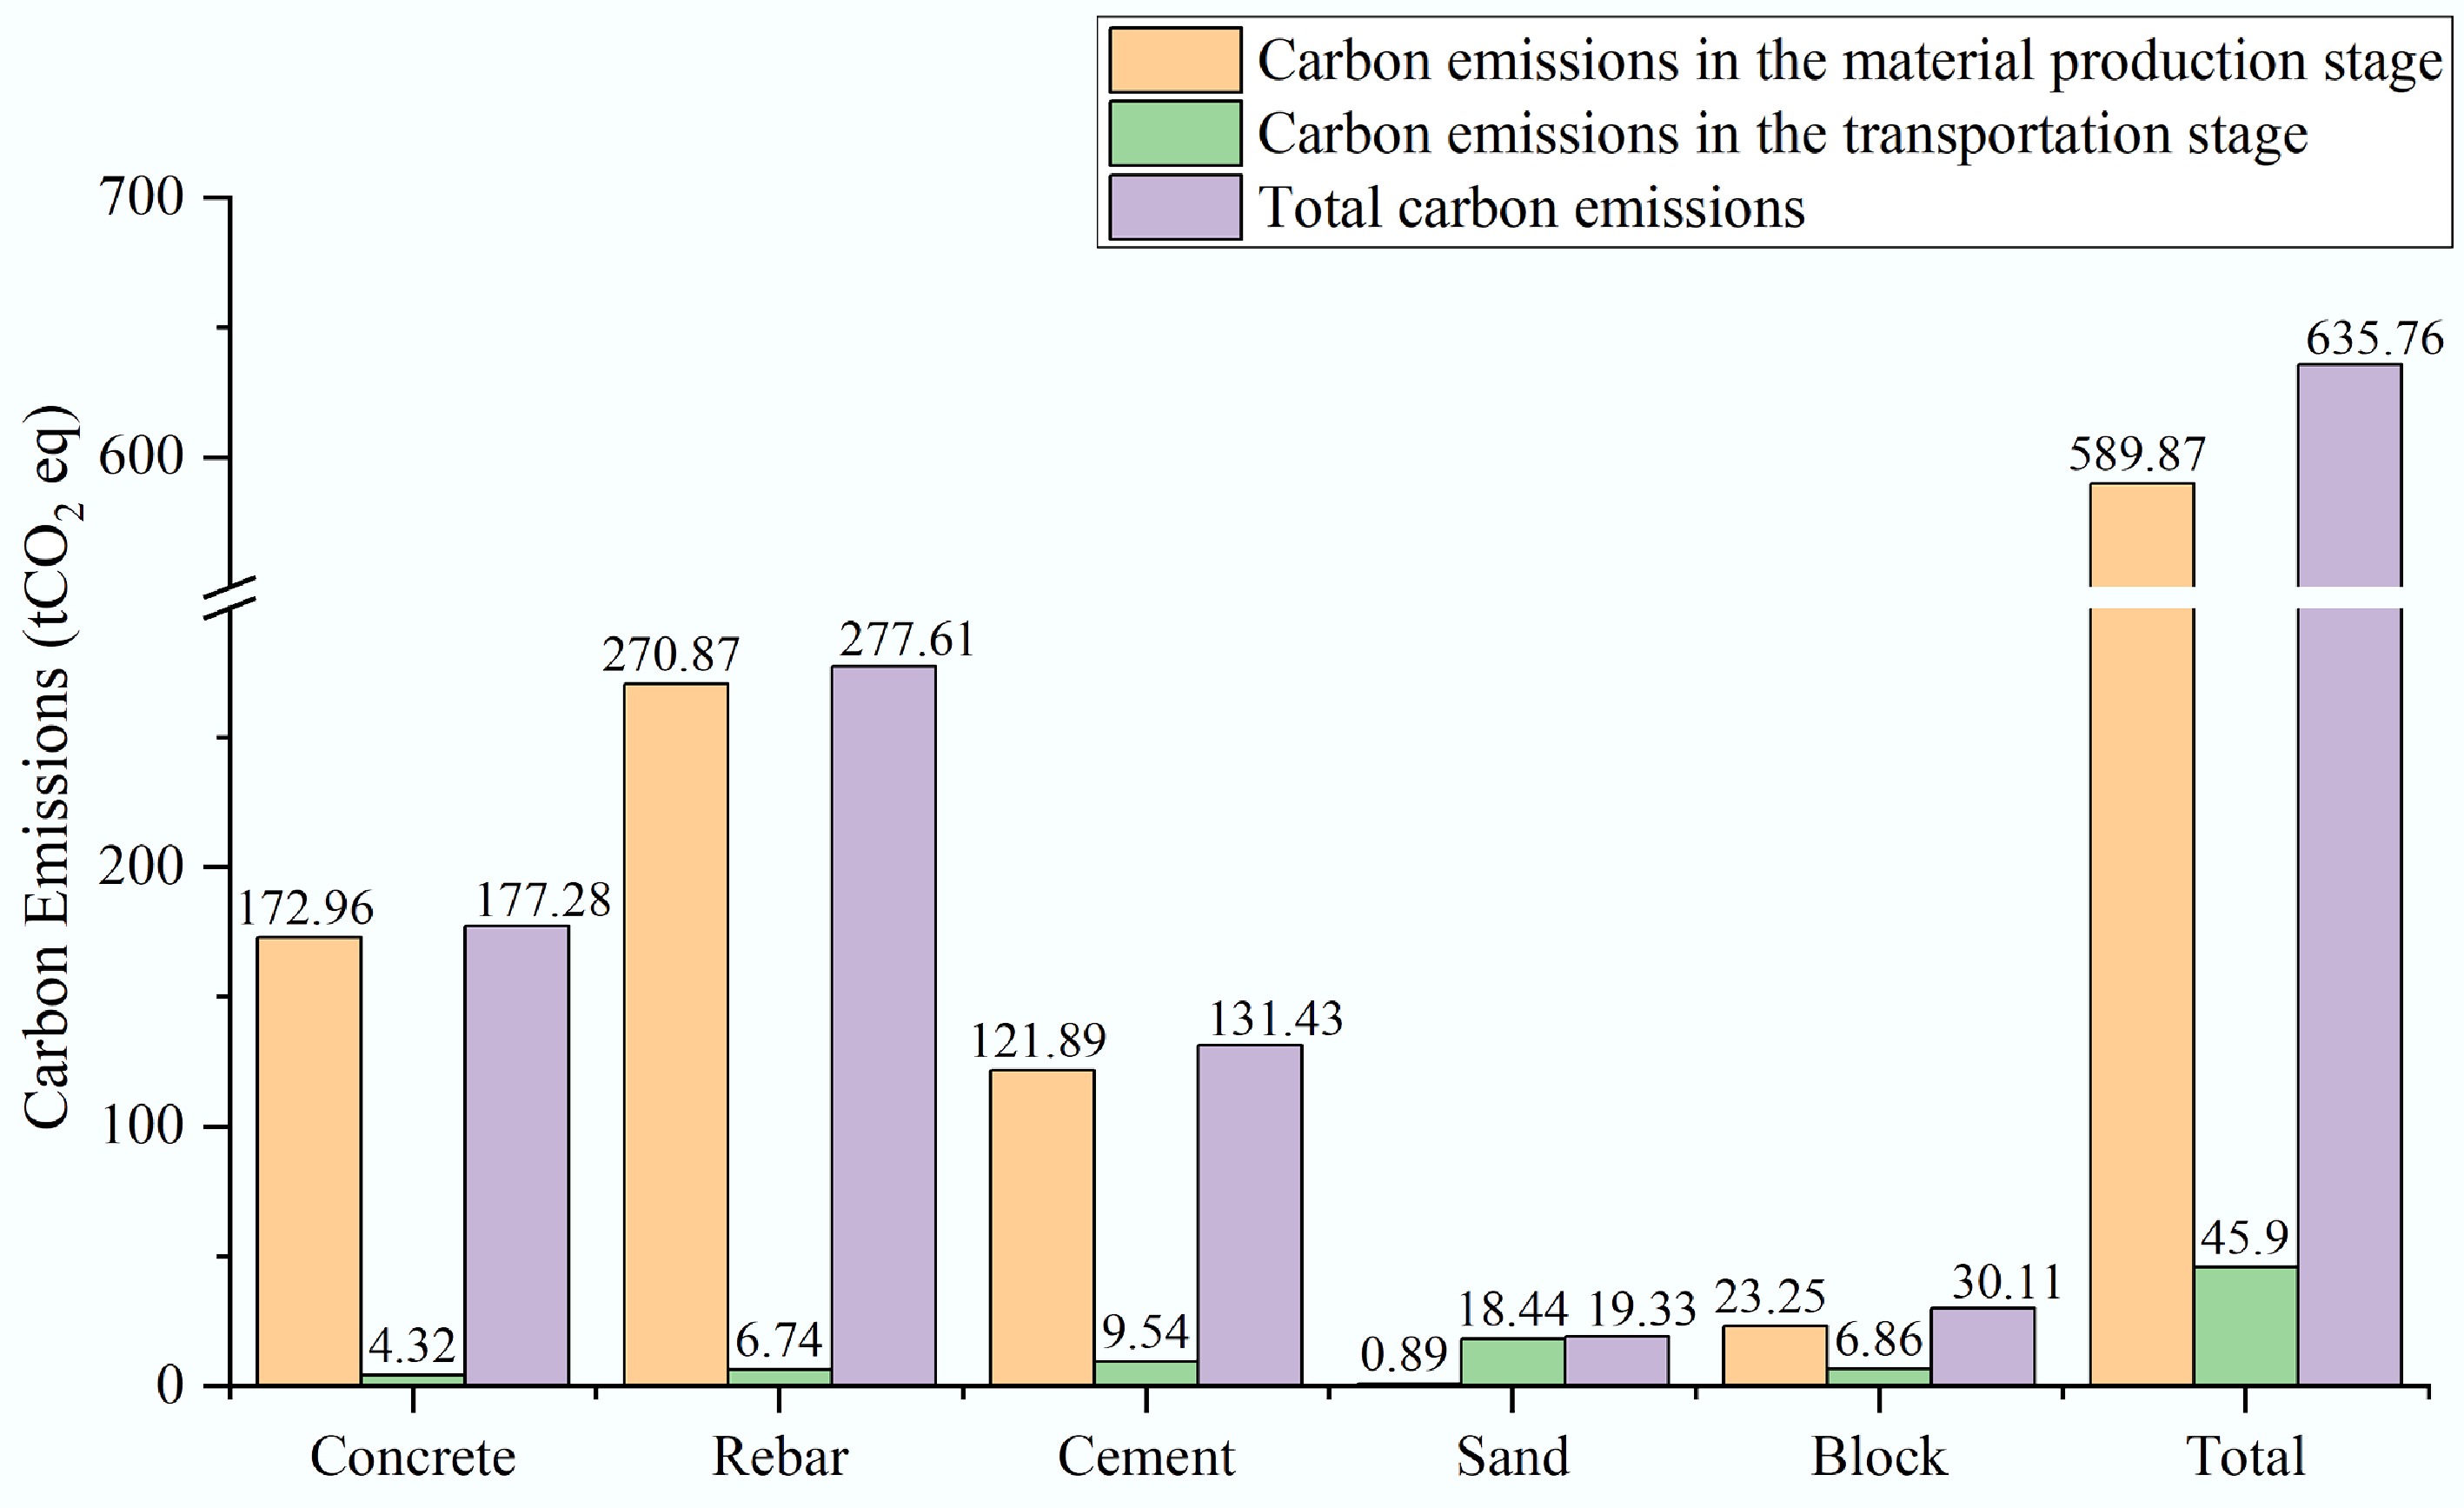
Figure 7.
Carbon emissions in the production and transportation stages of building materials.
-
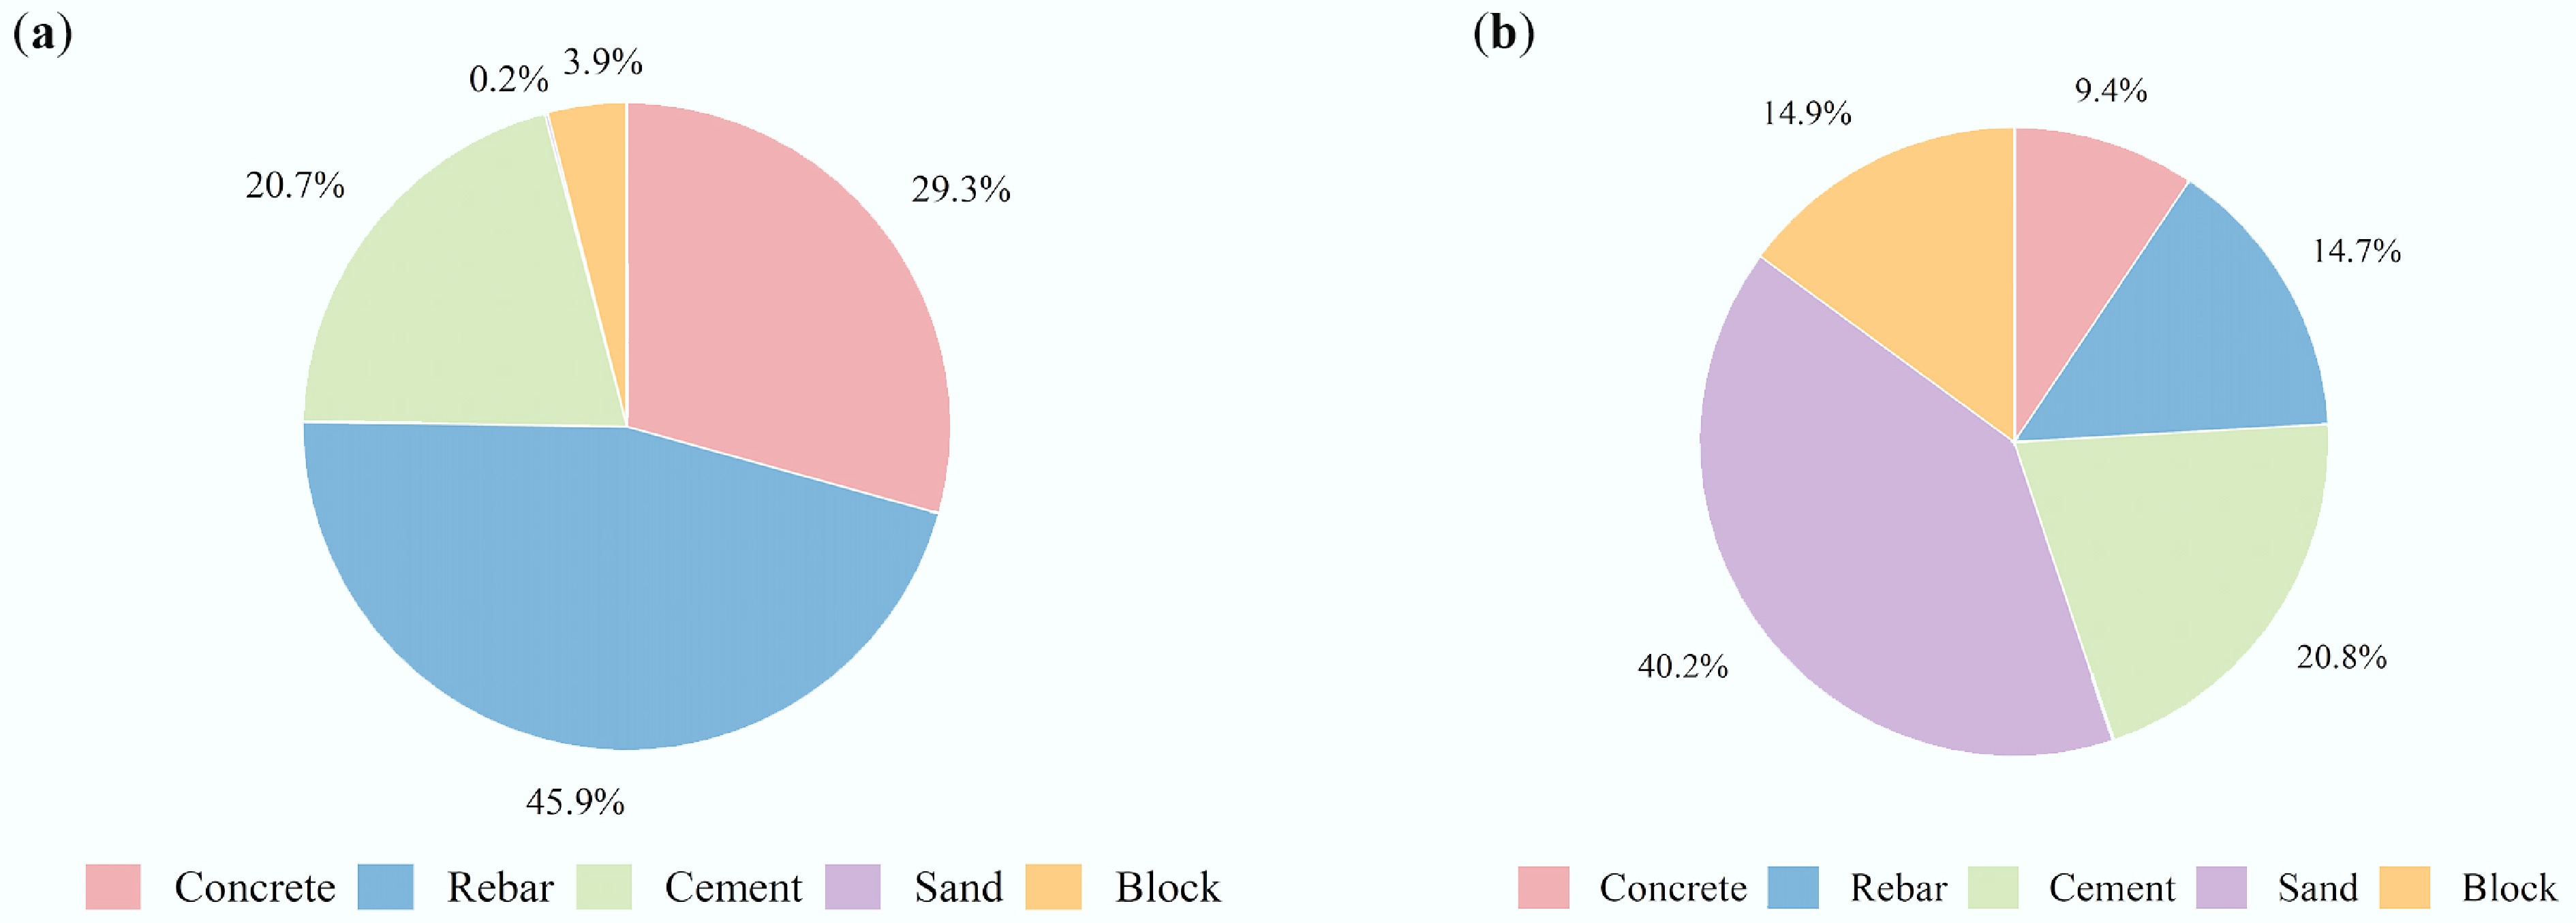
Figure 8.
Proportion of carbon emissions of material (a) in the production stage, (b) in the transportation stage.
-

Figure 9.
Carbon emission of building operation stage.
-
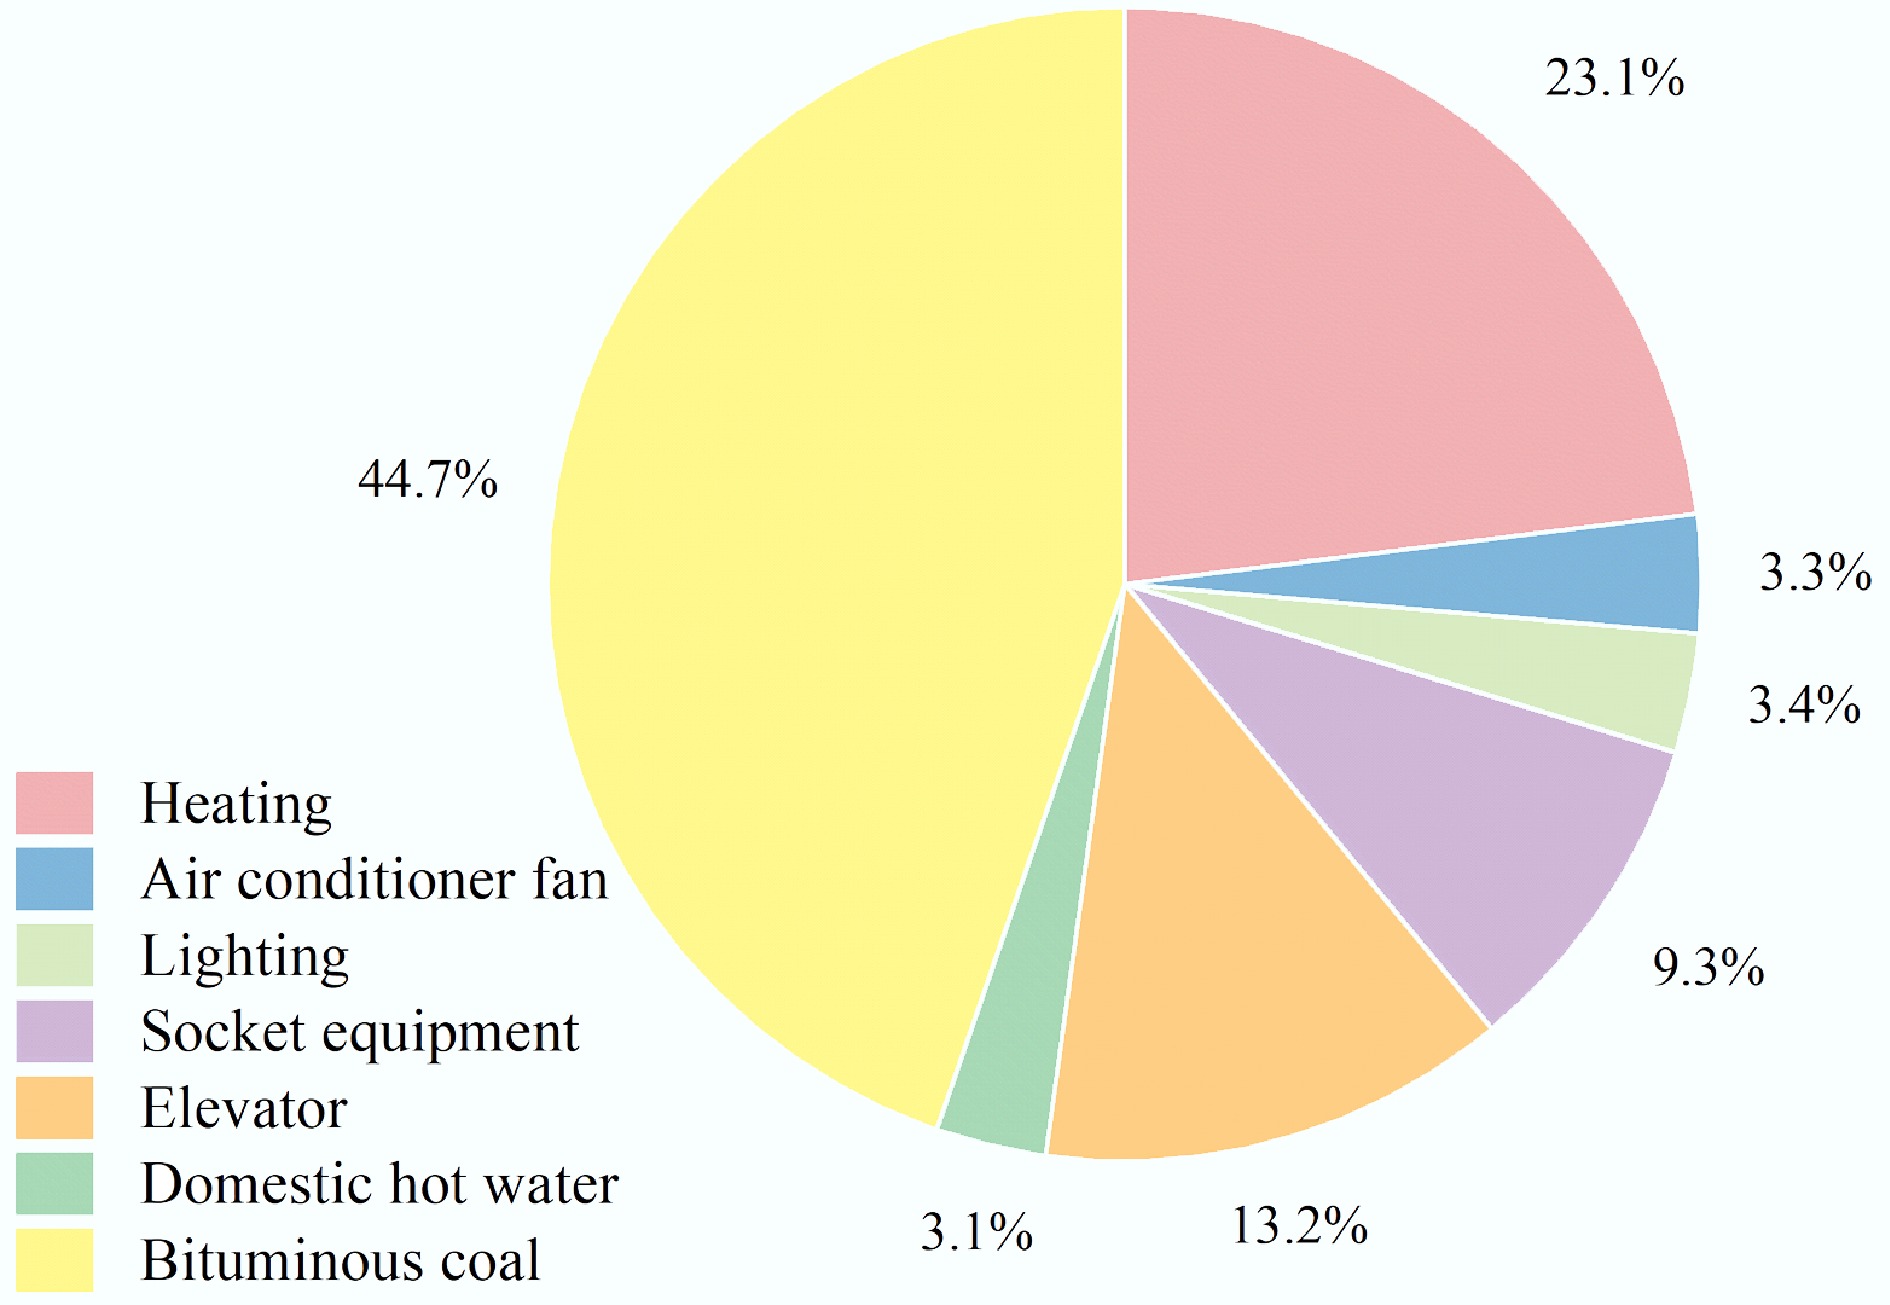
Figure 10.
The proportion of energy consumption in building operation stage.
-
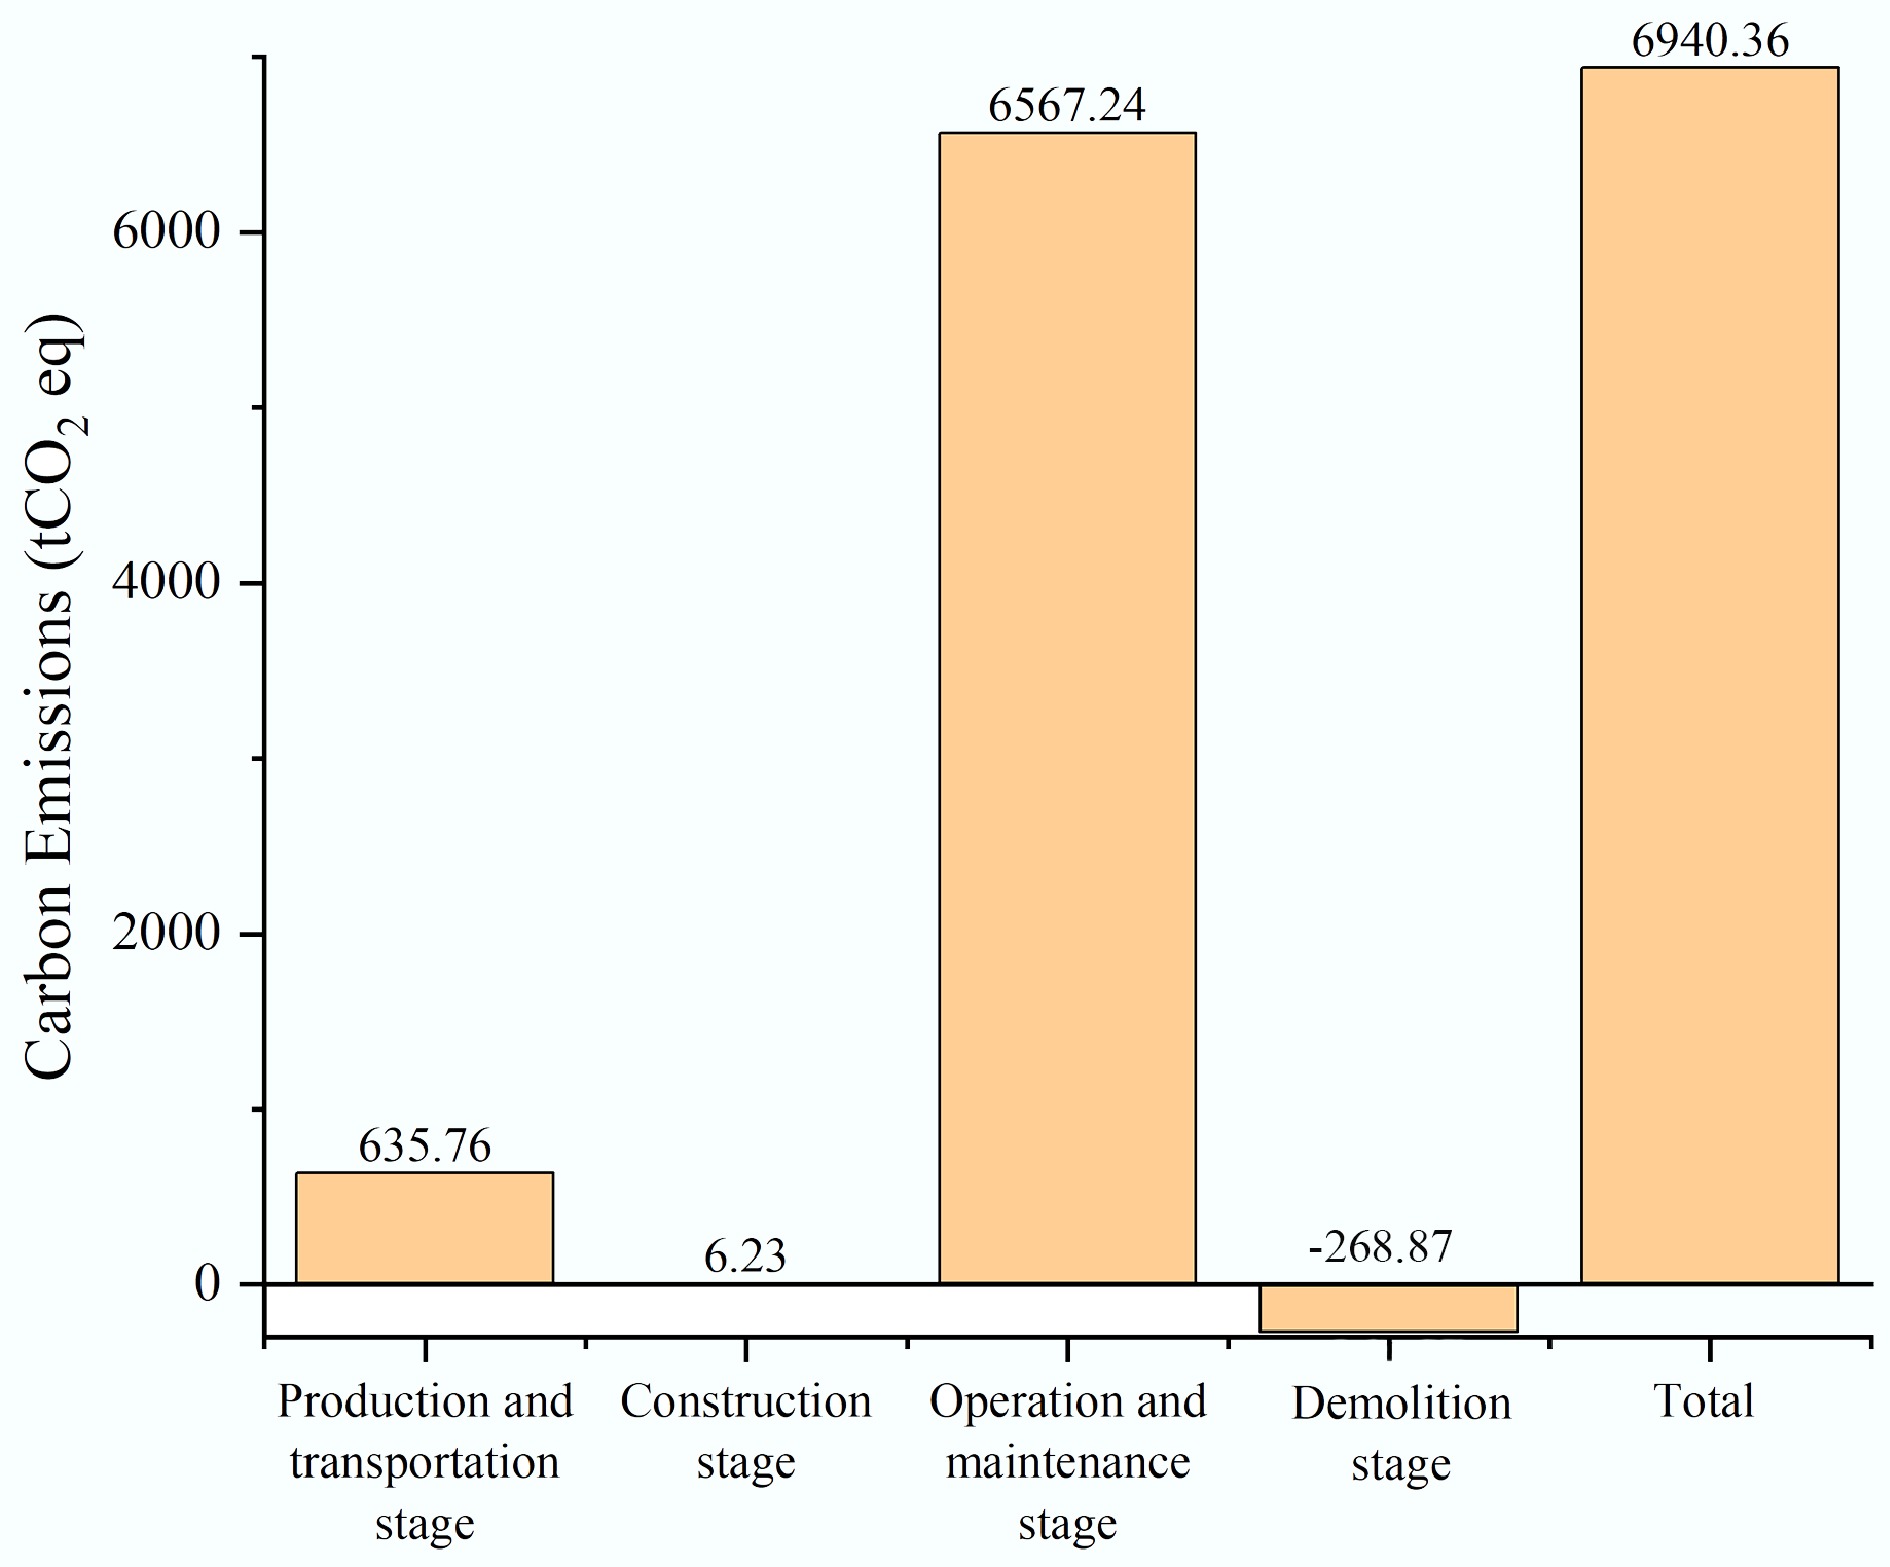
Figure 11.
Building life cycle carbon emissions.
-
Material Material consumption Unit Concrete 586.29 m3 Rebar 117.26 t Cement 165.84 t Sand 354.68 t Block 119.24 m3 Table 1.
The amount of building materials extracted
-
Material CO2 emission factor Unit Resource Concrete 295 CO2 kg/m3 Building Carbon Emission Calculation Standard Rebar 2,310 CO2 kg/t Carbon footprint of building life cycle Cement 735 CO2 kg/t Building Carbon Emission Calculation Standard Sand 2.51 CO2 kg/t Building Carbon Emission Calculation Standard Block 195 CO2 kg/m3 Related papers[37] Table 2.
Carbon emission factors of different building materials
-
Material Consumption (t) Transport way Transportation distance (km) Carbon emission factor (kgCO2/t·km) Concrete 1,383.69 Heavy-duty diesel truck transport (Load 30t) 40 0.078 Rebar 117.26 Medium-sized gasoline truck transportation (Load 8t) 500 0.115 Cement 165.84 Medium-sized gasoline truck transportation (Load 8t) 500 0.115 Sand 354.68 Heavy petrol truck transport (Load 18t) 500 0.104 Block 119.24 Medium-sized gasoline truck transportation (Load 8t) 500 0.115 Table 3.
Carbon emission factors of different building materials transportation
-
Material Production carbon emission (tCO2 eq) Transport carbon emission (tCO2 eq) Total carbon emission (tCO2 eq) Concrete 172.96 4.32 177.28 Rebar 270.87 6.74 277.61 Cement 121.89 9.54 131.43 Sand 0.89 18.44 19.33 Block 23.25 6.86 30.11 Total 589.87 45.90 635.76 Table 4.
Carbon emissions in the production and transportation stage of non-building materials
-
Situation type Parameter setting Purpose Baseline scenario (S0) Original transport parameters: 500 km (sand, rebar, cement, block), 40 km (concrete); vehicle type and emission factors are shown in Table 3. As the baseline of sensitivity analysis. Vehicle type sensitivity (S1) Keep a distance of 500 km and change from 'Heavy Petrol Trucks (0.104)' to 'Heavy Diesel Trucks (0.078)'. Verify the effect of fuel type (gasoline vs diesel) on emissions. Local supply scenario (S2) Transport distance reduced to 50 km (sand, cement, blocks), vehicle type unchanged (continued Table 3). Simulation of the impact of local material procurement on emissions. Comprehensive optimization scenario (S3) Local supply (50 km) + diesel vehicles (heavy petrol trucks for sand and cement, emission factor 0.078). Emission potential assessment under extreme optimization scenarios. Table 5.
Sensitivity analysis under different scenarios
-
Scenario Material Distance (km) Vehicle type Carbon emission factor (kgCO2/t·km) Q2 (tCO2 eq) Proportion Billing S0 Sand 500 Heavy petrol trucks 0.104 18.44 40% 1 Cement 500 Medium-sized gasoline truck transportation 0.115 9.54 21% 2 Block 500 Medium-sized gasoline truck transportation 0.115 6.86 15% 3 Rebar 500 Medium-sized gasoline truck transportation 0.115 6.74 15% 4 Concrete 40 Heavy diesel trucks 0.078 4.32 9% 5 S1 Sand 500 Heavy diesel trucks 0.078 13.78 31% 1 Cement 500 Medium-sized gasoline truck transportation 0.115 9.54 21% 2 Block 500 Medium-sized gasoline truck transportation 0.115 6.86 15% 3 Rebar 500 Medium-sized gasoline truck transportation 0.115 6.74 15% 4 Concrete 40 Heavy diesel trucks 0.078 4.32 9% 5 S2 Sand 50 Heavy Petrol Trucks 0.104 1.84 12% 3 Cement 50 Medium-sized gasoline truck transportation 0.115 0.95 6% 4 Rebar 500 Medium-sized gasoline truck transportation 0.115 6.74 43% 1 Block 50 Medium-sized gasoline truck transportation 0.115 0.69 4% 5 Concrete 40 Heavy Diesel Trucks 0.078 4.32 28% 2 S3 Sand 50 Heavy Diesel Trucks 0.078 0.35 3% 5 Rebar 500 Medium-sized gasoline truck transportation 0.115 6.74 57% 1 Concrete 40 Heavy Diesel Trucks 0.078 4.32 36% 2 Cement 50 Medium-sized diesel trucks 0.092 0.73 6% 3 Block 50 Medium-sized diesel trucks 0.092 0.54 5% 4 Table 6.
Sensitivity analysis
-
Carbon emission source Consumption CO2 emission factor Annual carbon emissions (tCO2/a eq) Total carbon emission (tCO2 eq) Heating 1,860 kWh/m2 0.5703 kgCO2/kWh 26.50 1,325.20 Air conditioner fan 268 kWh/m2 0.5703 kgCO2/kWh 3.81 190.55 Lighting 271 kWh/m2 0.5703 kgCO2/kWh 3.86 193.15 Socket equipment 750 kWh/m2 0.5703 kgCO2/kWh 10.68 534.15 Elevator 1,062 kWh/m2 0.5703 kgCO2/kWh 15.13 756.65 Domestic hot water 251 kWh/m2 0.5703 kgCO2/kWh 3.57 178.50 Bituminous coal 23,198 MJ/m2 89 tCO2/TJ 51.41 2,570.50 Total carbon emissions from building operation 114.97 5,748.70 Table 7.
Carbon emissions in building operation stage
-
Scenario Energy type Carbon emission factor Energy efficiency ratio (COP) Heat demand Data source Benchmark scenario Bituminous coal 89 tCO2/TJ 1.0 0.5776 TJ/a Table 5 Scenario 1 Natural gas heating Gas 55.54 tCO2/TJ 0.9 0.5776 TJ/a Related papers[45] Scenario 2 Ground source heat pump Power 0.5703 kgCO2/kWh 3.5 154,152.36 kWh /a Related papers[41] Scenario 3 Air source heat pump Power 0.5703 kgCO2/kWh 2.2 154,152.36 kWh /a Related papers[46] The heat demand benchmark is based on the inverse calculation of coal consumption in the original scenario. The annual heat demand was 0.5776 TJ/154,152 kWh, which ensured that the heating effect of each scenario was consistent. Table 8.
Key parameters for different heating scenarios
-
Indicator Benchmark scenario Scenario 1 Scenario 2 Scenario 3 Heating carbon emissions (tCO2 eq) 2,570.50 1,782.22 1,255.90 1,998.02 Total carbon emissions in the operation stage(tCO2 eq) 5,748.70 4,960.42 4,434.10 5,176.22 Total carbon emissions in the maintenance stage (tCO2 eq) 818.54 818.54 818.54 818.54 LCCE (tCO2 eq) 6,940.36 6,152.08 5,625.76 6,367.88 Proportion of operation and maintenance stage 94.62% 93.94% 93.37% 94.14% Table 9.
Carbon emissions and the proportion of the whole life cycle in the operation stage under different heating scenarios
-
Production and transportation stage
(tCO2 eq)Construction stage
(tCO2 eq)Operation and maintenance stage
(tCO2 eq)Demolition stage
(tCO2 eq)Total
(tCO2 eq)635.76 6.23 6,567.24 –268.87 6,940.36 Table 10.
Building life cycle carbon emissions
Figures
(11)
Tables
(10)