


-
Researchers have examined carbon emissions associated with civil engineering. The construction industry was the largest consumer of energy in 2022, accounting for 30% of global final energy demand—primarily for operational purposes such as ventilation, heating, and cooling, according to the United Nations Environment Programme's Global Status Report for Buildings and Construction. This sector was responsible for 37% of carbon dioxide emissions in 2022 from both operations and material production in the world, amounting to 132 EJ. Based on the literature research, the construction industry is recognized as a significant potential for carbon emission reduction[1]. Carbon emissions in China resulting from construction activities increased from 2.23 billion tonnes to 5.08 billion tonnes between 2005 and 2020, accounting for 50.9% of the total carbon emissions in the country—a 2.3-fold increase, with an average annual growth rate of 5.6%. In 2021, the total carbon emissions from the entire construction process in China was projected to reach 5.01 billion tonnes of CO2, representing 47.1% of national energy-related carbon emissions. Material production accounted for 2.6 billion tonnes of CO2, equivalent to 24.4% of China's energy-related carbon emissions. Emissions from the construction phase were 0.11 billion tonnes, accounting for 1.0%, compared with 2.3 billion tonnes, representing 21.6% of the national total for the operational emissions[2]. Therefore, reducing CO2 emissions from the construction industry has become a critical and far-reaching initiative for lowering energy consumption, achieving energy-saving goals, and contributing to emission reduction strategies[3]. From a life cycle perspective, building-related carbon emissions originate from four key stages: the production and transportation of materials, construction, operation and maintenance, and demolition[4].
Researchers have explored and developed various methodologies for calculating building-related carbon emissions to analyze life cycle carbon emissions more accurately[5]. The simulation capabilities in construction design, particularly within a BIM environment where both functional and structural attributes are integrated into a digital model supporting visualization, coordination, simulation, and optimization, have significantly facilitated the development of building carbon emissions assessment[6].
BIM technology has attracted increasing attention in the construction industry due to its ability to provide precise and detailed information during the design phase. Users can access model-specific data based on the project stage and complexity, enabling accurate estimation and planning[7], which can be used to evaluate a building's carbon footprint[8]. Existing studies have employed various approaches, such as simulation, quantitative analysis, and regression methods, to analyze building energy consumption and visualize carbon emissions[9]. Some researchers have directly applied BIM technology to calculate and manage carbon emissions across all project stages, contributing to more effective carbon control strategies[10]. Based on BIM and LCA, this research utilized the GBSWARE building carbon emission (CEEB) software to predict the carbon emissions during the building design stage. Furthermore, it identifies targeted strategies for reducing building emissions to ensure compliance with green building standards and regulations.
-
The International Organization for Standardization (ISO) published ISO 21930 in 2017, which serves as an international standard for conducting Life Cycle Assessment (LCA) in the construction industry. It categorizes the entire life cycle into four main stages comprising 16 sub-stages: building material production (A1–A3), construction (A4–A5), use (B1–B7), and end-of-life (C1–C4). This framework defines different life cycle stages and establishes the system boundaries for calculating the cost and environmental impact (LCCE) of buildings (Fig. 1)[11].
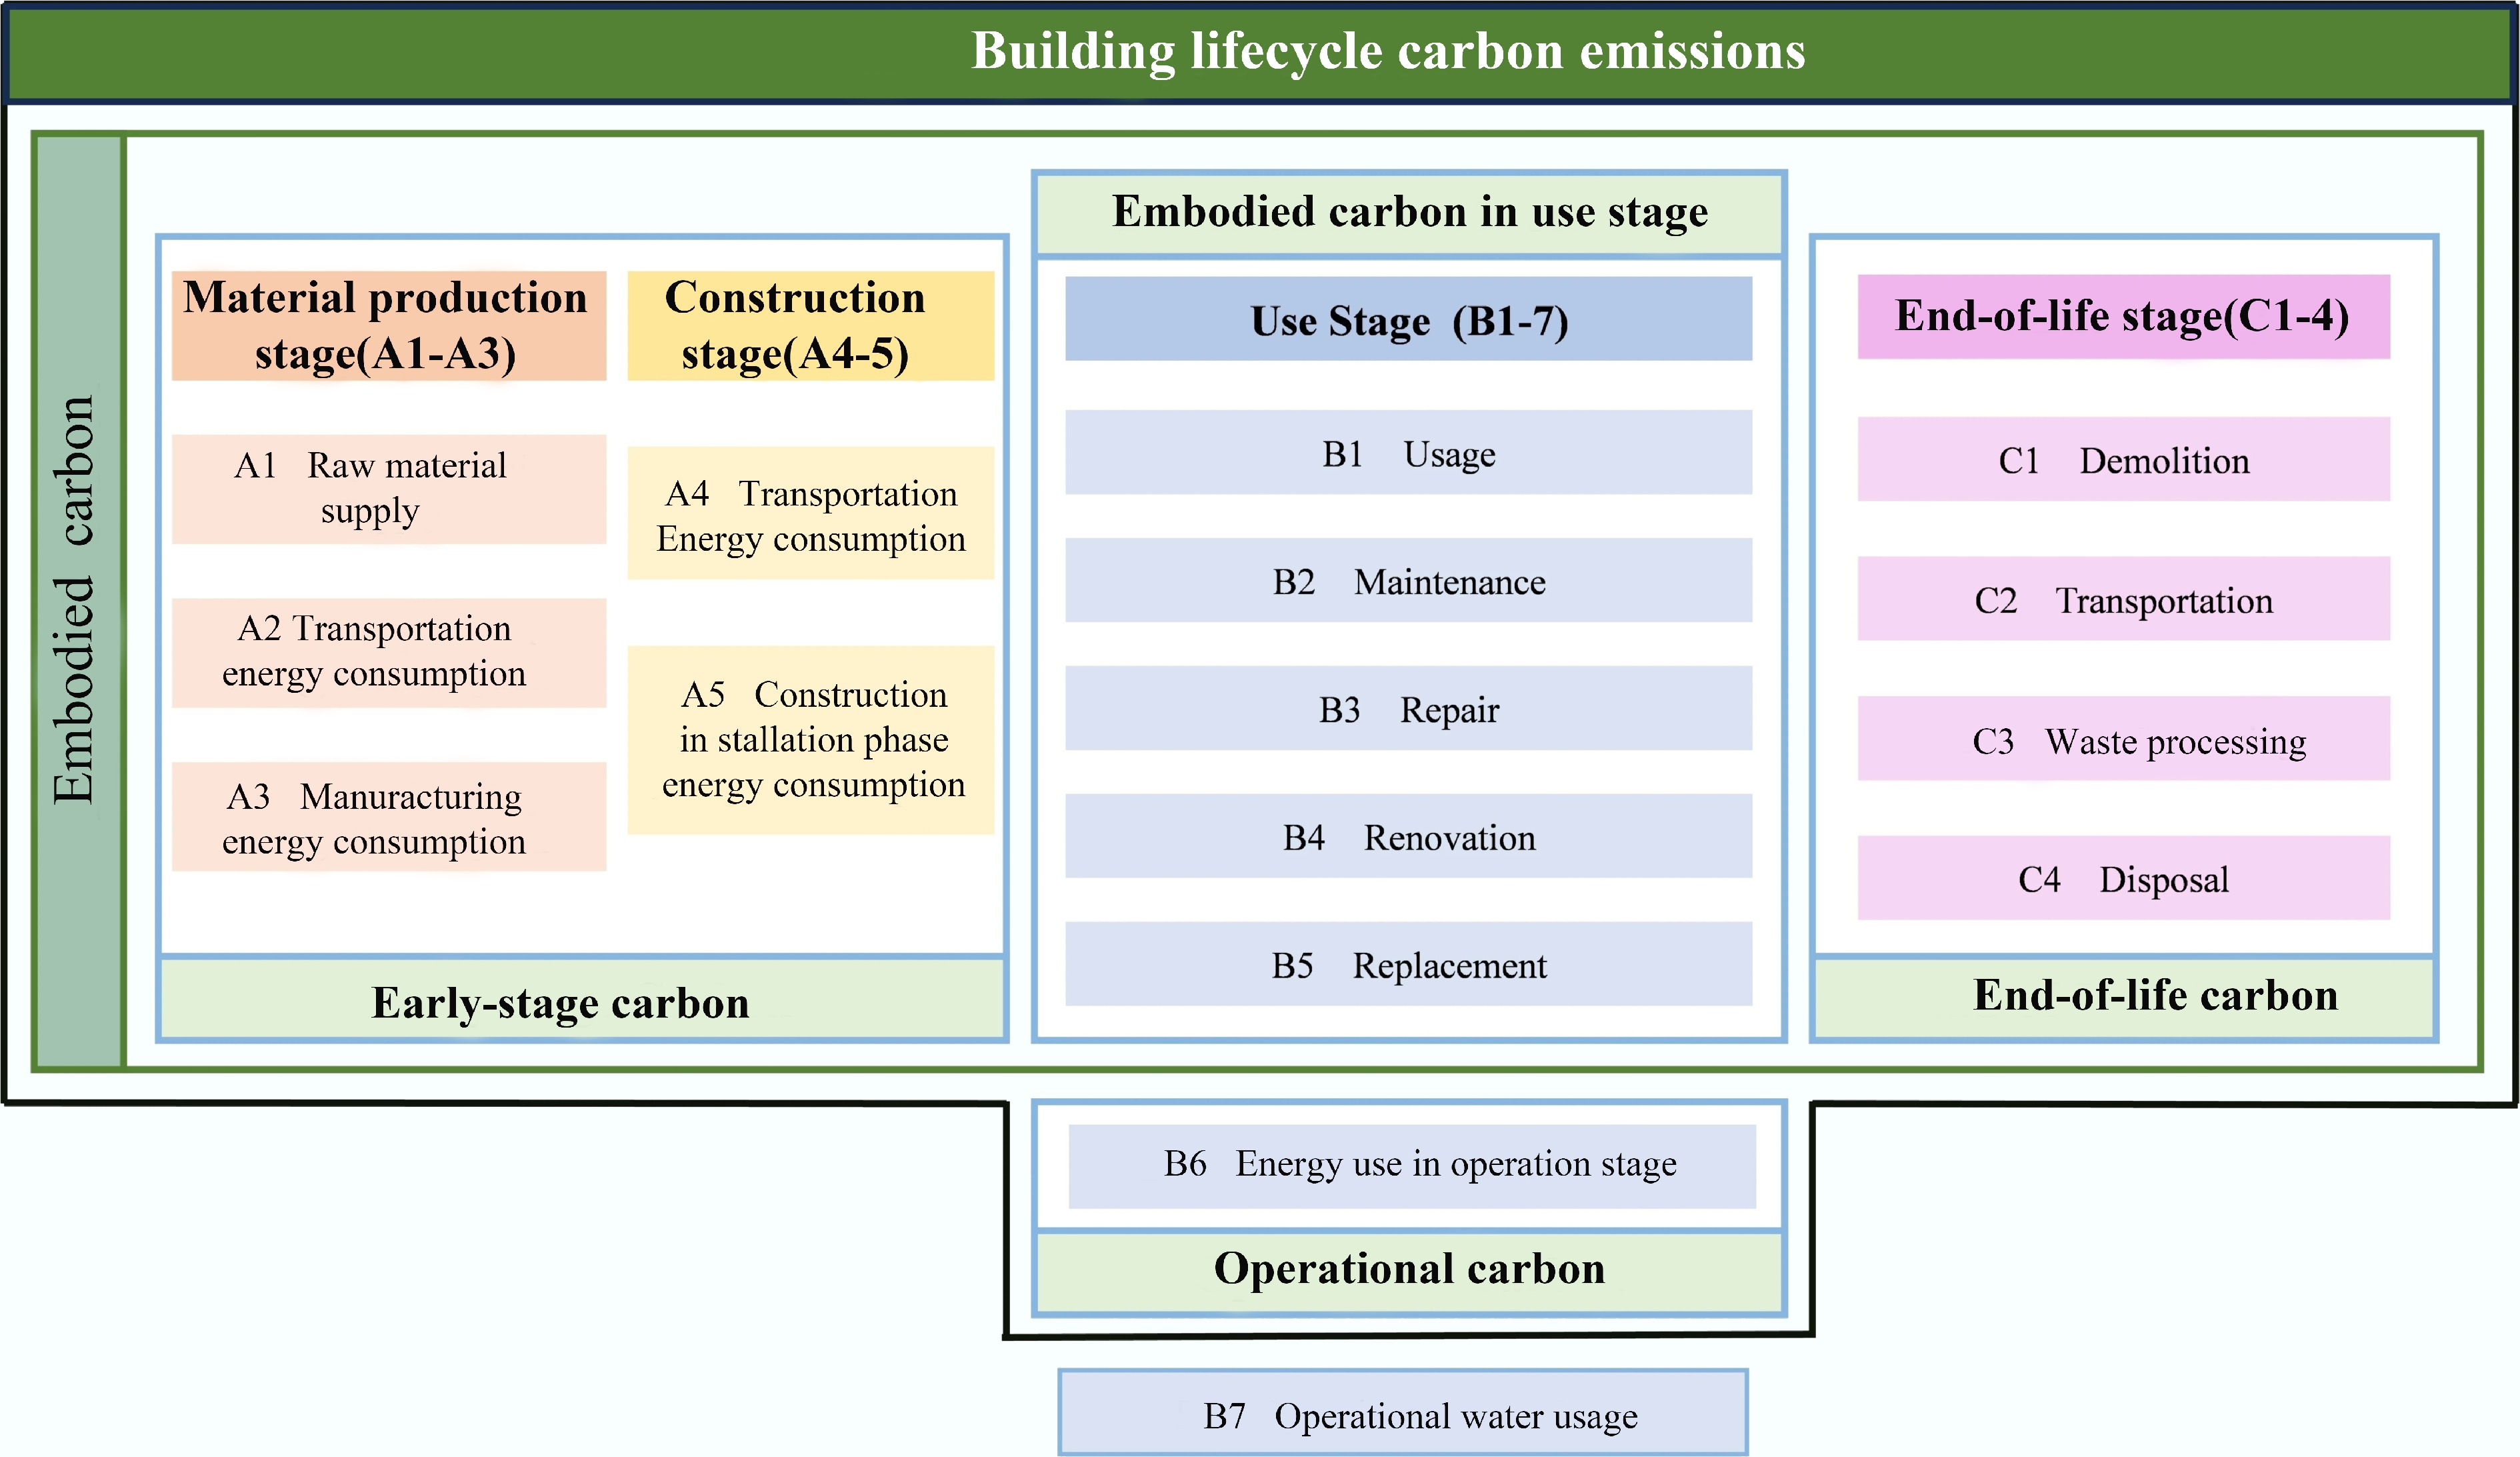
Figure 1.
Classification of carbon emissions in the whole life cycle of buildings and definition of system boundary.
Carbon emissions primarily stem from energy consumption associated with transporting building materials from factories to construction sites, on-site material processing, the use of mechanical equipment, and internal transportation on the construction site during the construction stage. In the operation and maintenance stage, emissions are mainly generated from energy consumption for heating, air conditioning, ventilation, lighting, domestic water supply, and the operation of building systems. In the demolition stage, emissions are largely attributed to the human and mechanical resources required for dismantling the structure[12].
The carbon dioxide equivalent (CO2-eq) is used as the standard measurement unit for calculating carbon emissions, which includes the combined effects of multiple greenhouse gases[13]. While methodologies for calculating carbon emissions have been researched in the literature, few studies have quantified emissions throughout the entire life cycle, because the process-based LCCE calculation method offers high accuracy but requires extensive data collection, making it costly and time-consuming[14]. Estimating emissions during the construction and demolition stages is difficult because of the variety of materials, equipment, and construction techniques[15]. It can vary significantly for carbon emissions during the operational stage due to differences in climate conditions, comfort requirements of users, and operating schedules[16]. Domestic scholars have conducted preliminary studies on emissions throughout the life cycle in China. Huang et al.[17] analyzed carbon emissions at each life cycle stage using the emission factor method, identifying the operational stage as having the highest proportion of total emissions, with CO2 emissions per unit area increasing annually. Zhang & Lui[18] reviewed existing research, and discussed the life cycle assessment methods and carbon reduction strategies. The findings showed that it accounted for the largest proportion, approximately 81.072% in the maintenance stage, followed by the materialization stage at 17.526%, and the demolition and disposal stage at 1.39%.
Building information modelling (BIM)
-
The platform, based on BIM technology, integrates diverse data and technological resources, thereby enabling the visualization of project information, which allows project stakeholders to gain a clearer understanding of their responsibilities and obligations. As a result, BIM enhances project operational efficiency and cooperation while effectively reducing construction time waste and achieving cost savings. BIM can be categorized into 12 types based on professional application and functional orientation[19], including green building analysis, construction management, and collaborative sharing, as illustrated in Fig. 2.
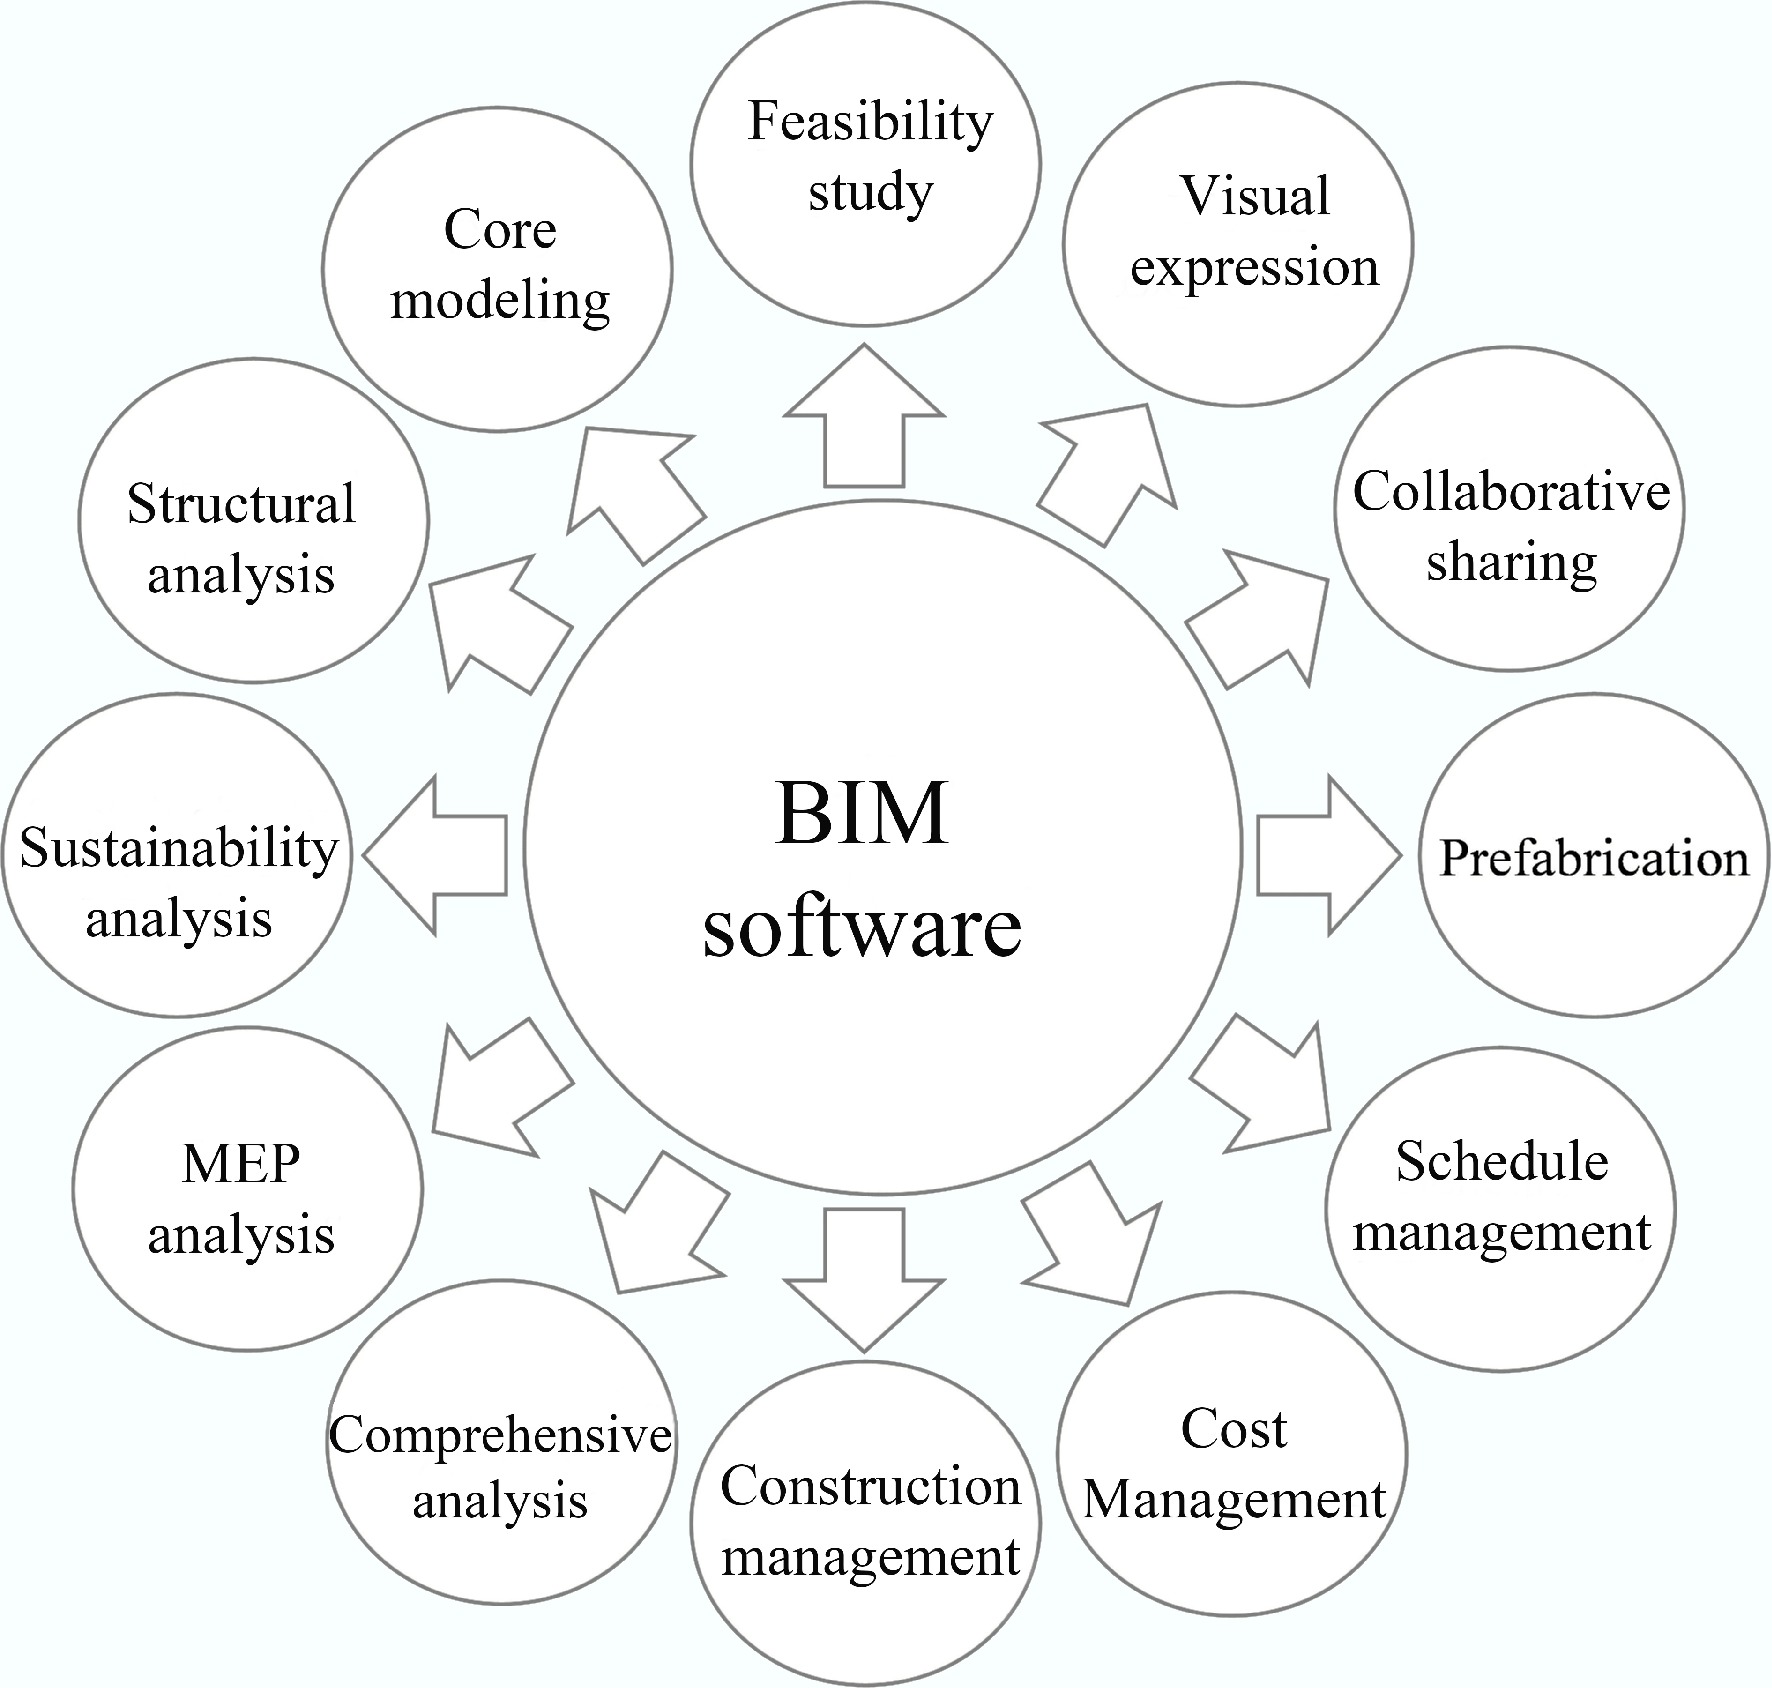
Figure 2.
BIM software classification.
The core of BIM lies in a three-dimensional (3D) information model that offers significant advantages in visualization, coordination, and simulation[20]. It provides substantial benefits in the architectural design phase by facilitating sustainable knowledge sharing among stakeholders, policymakers, and project managers compared with traditional 2D design methods, and it supports the successful implementation of high-quality green buildings[21]. Guo et al. developed a green building evaluation framework to assess performance in five key aspects: the main structure, building envelope, HVAC, lighting, and equipment[22]. Sun et al. used a tunnel project as a case study, employing the automatic calculation function of BIM to quantify CO2 emissions from tunnel materials and major equipment during the construction phase. This study offers valuable insights and direction for low-carbon assessment research[23,24]. Liu et al. investigated the carbon reduction per unit compared to cast-in-place concrete structures[25], which showed that it accounted for the highest proportion of emissions at the operational stage, reaching 63.64%, primarily due to the high energy consumption of the air conditioning and lighting systems, followed by material production. Emissions from other stages were below 5%, whereas the recycling of materials contributed to a carbon reduction of up to 8.93%. Based on the literature above, it plays a crucial role for BIM in advancing green building practices amid growing concerns over carbon emissions in the construction industry. Establishing an evaluation system based on BIM is essential and meaningful for promoting sustainable building development.
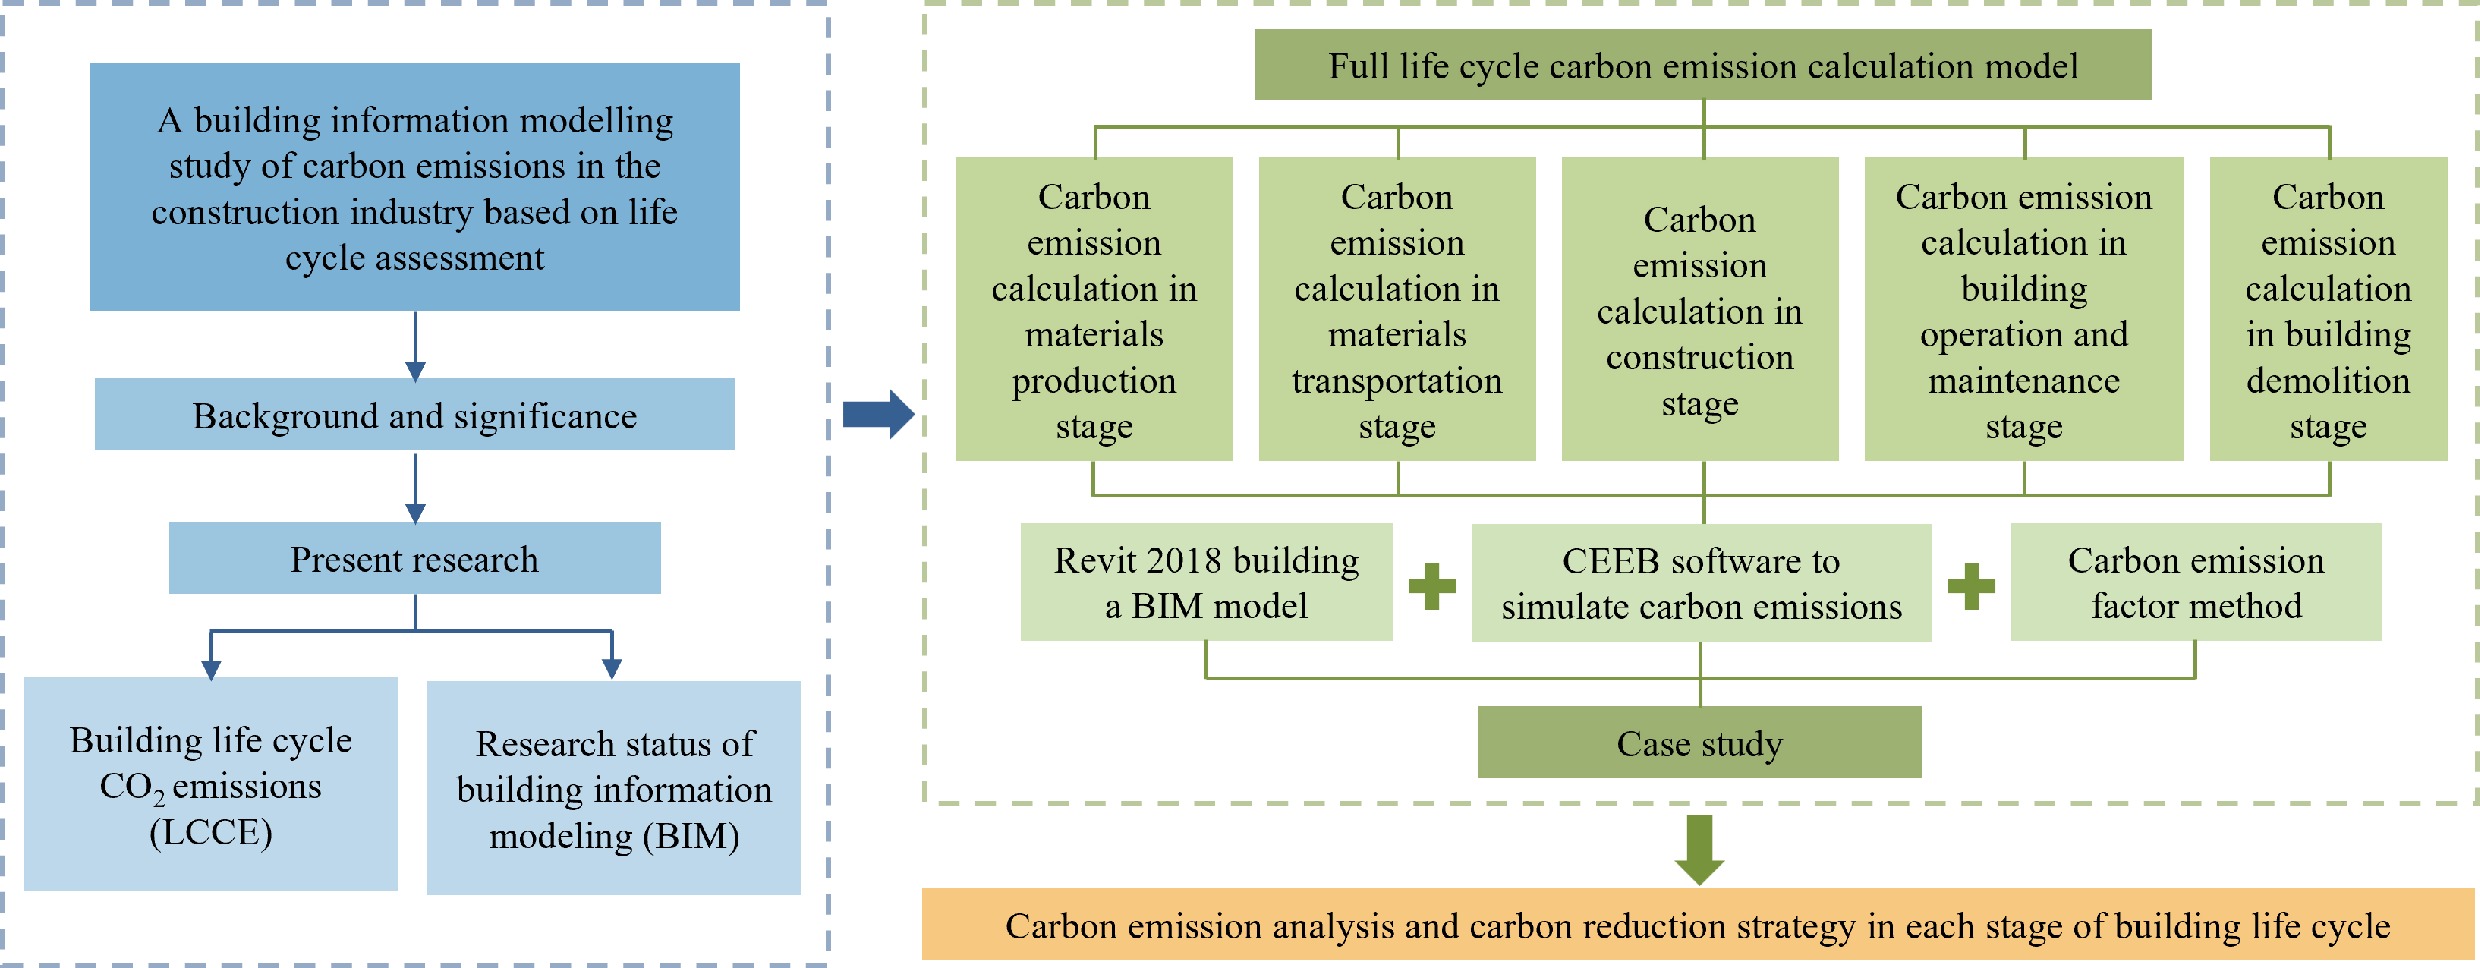
The structure of this paper is as follows: firstly, the functional units and system boundaries are presented, and the calculation formula for carbon emissions in the model is discussed; secondly, the selected proposed building for the case study is described, and the amount of building materials in the Revit model is extracted. The carbon emission factors were analyzed, and a CEEB model was established; thirdly, the carbon emissions of building material production and the transportation stage are analyzed. The carbon emissions in the operational stage and over the life cycle of the building are discussed. Finally, the key findings are summarized, and future research directions are suggested in the conclusion.
-
de Simone Souza et al. emphasized that different functional units (FU) serve varied purposes in life cycle assessment (LCA) research. Functional units are not only used to describe the building being assessed, but also to enable meaningful comparisons of environmental impacts under different conditions[26]. Precisely defining functional units is essential to ensure valid and reliable comparisons throughout the life cycle assessment process. In building-related LCA studies, functional units are commonly defined as 'per square meter' or 'per building', which facilitates the effective measurement of the long-term environmental impacts of materials and design strategies[27].
This study examined the carbon emissions over the entire life cycle of a building, focusing on the estimation of carbon emissions during the production and transportation phases to ensure a comprehensive understanding of the environmental impacts associated with raw material extraction, manufacturing, and transportation. An in-depth analysis of these early stages allows for better prediction and evaluation of subsequent life cycle phases, providing a solid scientific foundation for decision-making during the design process.
The functional unit in this study was per building, and the system boundary encompassed the production and transportation of materials, the construction stage, the operation phase, and the demolition stage. During the material production stage, the quantities of all building materials were determined, and the carbon emissions generated during the transportation phase were assessed based on different transportation modes.
Key parameters were defined based on Chinese national standards and regional context to ensure accuracy and reproducibility of the calculations. The case building, located in Taiyuan (Shanxi Province), is classified as Cold Zone A according to 'Code for Thermal Design of Civil Buildings' (GB 50176-2016), with a total floor area of 1,248.99 m2 (all emissions normalized to per m2). A 50-year design life was adopted in line with 'Unified Standard for Design of Civil Buildings' (GB 50352-2019), while an average 20-year renovation cycle (encompassing envelope retrofits and equipment upgrades) was specified with reference to 'Green Retrofit Evaluation Standard for Existing Buildings' (GB/T 51141-2015). Maintenance protocols followed the 'Technical Specification for Maintenance Management of Office Buildings' (JGJ/T 429-2018), including minor maintenance (e.g., window seal replacement, 3-year interval), medium maintenance (e.g., HVAC servicing, 10-year interval), and major renovation (20-year interval). Indoor temperature setpoints were 18 ± 2 °C (winter heating) and 26 ± 2 °C (summer cooling) per the 'Design Standard for Energy Efficiency of Public Buildings' (GB 50189-2015), with natural ventilation utilized during transitional seasons.
Calculation formula of carbon emission in the whole life cycle of buildings
-
The carbon emissions were calculated as follows:
$ LCCE = Q+C+O+R $ (1) where, LCCE is the carbon emission over the entire life cycle of the building, Q is the carbon emission from the production and transportation of building materials, C is the carbon emissions from the construction stage, O is the carbon emissions from the operation and maintenance stage of the building, and R is the carbon emission from the building demolition stage.
Carbon emissions, Q, from the production and transportation of building materials are the total amount of carbon emissions generated by the production of building materials and the transportation of building materials from the processing plant to the construction site[28]. In this study, this stage was calculated using the following formula:
$ {\rm Q}={\mathrm{Q}}_{1}+{\mathrm{Q}}_{2} $ (2) $ {Q}_{1}={\sum}_{i=1}^{n}{Q}_{1i}={\sum}_{i=1}^{n}({q}_{i}\times {u}_{i}) $ (3) $ {Q}_{2}={\sum}_{i=1}^{n}{Q}_{2i}={\sum} _{i=1}^{n}({u}_{i}\times {d}_{i}\times {c}_{i}) $ (4) where, Q is the carbon emission from the production and transportation stages of materials, Q1 is the carbon emission from the production of materials, Q2 is the carbon emission from the transportation of materials, Q1i is the carbon emissions generated by the production of material i, Q2i is the carbon emissions generated by the transportation of material i, and i denotes the material type. Qi is the carbon emission factor of material i, where ui is the amount of material, Q2i is the carbon emissions generated by the transportation of i materials, di is the transport distance of i material, and ci is the carbon emission factor for transporting material i.
The carbon emission, C, from the construction stage is the sum of the carbon emissions from the main construction activities[29]. If there are no detailed construction data, according to the 'Guidelines for the Calculation of Building Carbon Emissions (Trial)', it can be estimated using an empirical formula[30]. In this study, this stage was calculated using the following formula:
$ \mathrm{C}=\mathrm{Y}\times \mathrm{A} $ (5) $ \mathrm{Y}=\mathrm{X}+1.99 $ (6) where, C is the carbon emissions from the construction stage, Y is the carbon emissions per unit area, A is the total construction area, and X is the number of the upper layer.
Carbon emission, O, from building operation and maintenance is the sum of the carbon emissions from the power, fuel, and maintenance parts after the building is put into normal use[31]. The power part is mainly divided into cooling, heating, air conditioning, and lighting. In this study, this stage was calculated using the following formula:
$ \mathrm{O}={\mathrm{O}}_{1}+{\mathrm{O}}_{2}+{\mathrm{O}}_{3} $ (7) $ {O}_{1}={\sum}_{a=1}^{4}{O}_{1a}={\sum}_{a=1}^{4}({w}_{a}\times {e}_{a}) $ (8) $ {O}_{2}={\sum}_{i=1}^{n}{Q}_{2i}={\sum}_{i=1}^{n}({f}_{i}\times {g}_{i})$ (9) $ {O}_{3}=(Q+C)\times (0.2{\text{%}}+1.05{\text{%}}+8{\text{%}}+\dfrac{10{\text{%}} }{\delta })\times N $ (10) where, O is the carbon emission from the operational stage of the building, O1 is the carbon emission from electricity, O2 is the carbon emission from fossil fuels, O1a is the carbon emission generated by the production of type a—the type of power consumption generation, and wa is the power consumption; ea is a form of carbon emission factor; Q2i is the carbon emission generated by the combustion of fuel i; i is the type of fossil fuel, and fi is the carbon emissions generated by the combustion of fuel i; gi is the carbon emission factor of i fuel; O3 is the carbon emission of building maintenance, and δ is the average renovation period of a certain type of building, which is 20 years in this study, and N is the design life of the building.
The carbon emission, R, of the building demolition stage is the sum of the carbon emissions generated by manual demolition and mechanical demolition. Compared with manual demolition, mechanical demolition consumes a lot of energy owing to the continuous operation of various large-scale mechanical equipment during the demolition process, which becomes the main source of carbon emissions at this stage. The calculation period for carbon emissions in the demolition phase is from the start of demolition until the main structure is demolished and transported away[32]. If there are no detailed relevant data of construction, according to the simplified calculation formula proposed by Bonamente et al.[33] and Li et al.[44], this stage in this study was calculated using the following formula:
$ R=C\times 90{\text{%}} +{Q}_{2}\times 90{\text{%}} -{Q}_{1}\times 50{\text{%}} $ (11) The model assembly
-
This study aims to evaluate the carbon emissions of a reinforced concrete building. It is essential to determine the quantities of the materials for assessing the carbon footprint over the full life cycle of a building, as it is related to the precise quantification of building materials for carbon emissions at each stage[34]. This study was structured into the following four stages:
Stage 1: Building information was integrated into a 3D BIM model based on architectural and structural drawings, and the total quantities of the materials were calculated.
Stage 2: The BIM model was linked and imported into the green building carbon emission calculation tool (CEEB). The relevant parameters were configured to ensure the completeness and accuracy of the model data.
Stage 3: The CEEB was used to simulate and calculate the carbon emissions across the entire building life cycle.
Stage 4: A comprehensive evaluation was conducted to assess the environmental impact of the building, providing a scientific foundation for sustainable design and informed decision-making. The workflow of the research methodology is illustrated in Fig. 3.

Figure 3.
Provides a sustainable decision-making framework for the proposed building using the BIM model.
-
The building is a three-story office building with a reinforced concrete frame structure. It has a total height of 14.40 m and comprises three above-ground floors, with a total construction area of 1,248.99 m2, and a standard floor area of 416.33 m2 for the building. Figure 4 presents a 3D view of the Revit model alongside a sectional view of the staircase.
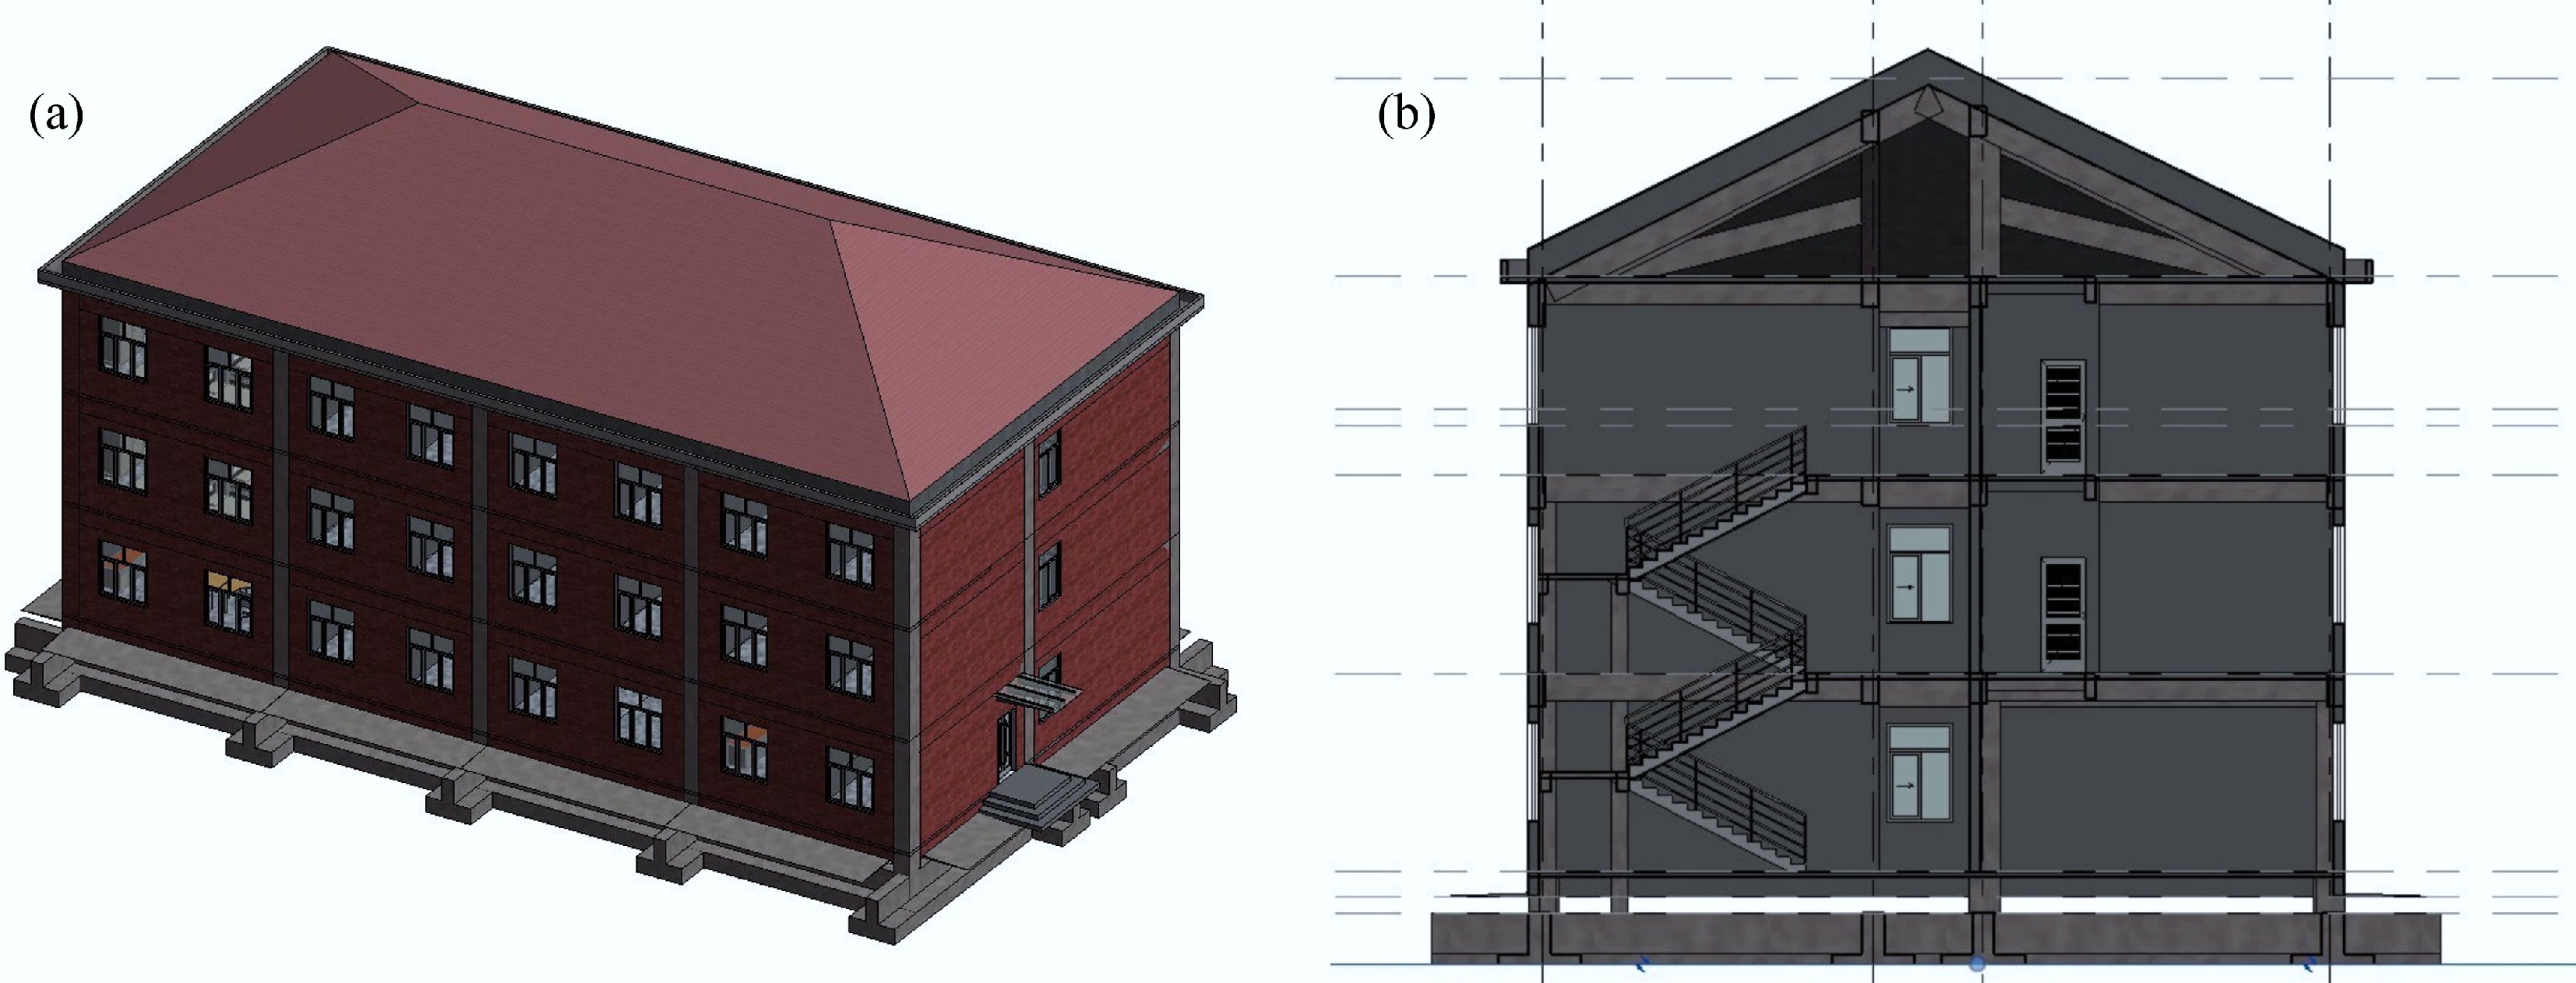
Figure 4.
BIM model. (a) Model of single building, (b) model of building section.
Extraction of the amount of building materials in the Revit model
-
A detailed bill of quantities was generated from the BIM to quantify building materials accurately. This inventory primarily includes key attributes such as the volume, area, and type of various materials, providing essential data for the subsequent calculation of life cycle carbon emissions[35]. The specific quantities of building materials extracted from the model are presented in Table 1. The specific amount of material extracted from the model is shown in Table 1: C30 ready-mixed concrete was used, with a Portland cement (P.O 42.5) content of 300 kg/m3, supplemented by 20% mineral admixture, totaling 75 kg/m3; HRB400 grade (grade III) rebars were used. The production of rebars adopted the mainstream long process of Taiyuan: 'iron ore-sintering-blast furnace ironmaking-converter steelmaking-continuous casting-hot rolling'. Converter steelmaking (in line with 'Cleaner Production Standards for Iron and Steel Industry') used 15% scrap to reduce iron ore consumption.
Table 1. The amount of building materials extracted
Material Material consumption Unit Concrete 586.29 m3 Rebar 117.26 t Cement 165.84 t Sand 354.68 t Block 119.24 m3 Carbon emission factors
-
The carbon emission factor is a key parameter for calculating greenhouse gas emissions, which represents the amount of carbon dioxide emitted per unit of energy or material consumed. It plays an essential role in the emission factor method and is typically determined by experimental analysis. The values of carbon emission factors may depend on the target material, testing methodology, and experimental conditions[36]. For the production stage of building materials, the reference sources for emission factors include Appendix D of the Building Carbon Emission Calculation Standard (GB/T 51366–2019), the 'Carbon Footprint of the Building Life Cycle', and relevant academic literature. Table 2 presents the carbon emission factors of the various materials used.
Table 2. Carbon emission factors of different building materials
Material CO2 emission factor Unit Resource Concrete 295 CO2 kg/m3 Building Carbon Emission Calculation Standard Rebar 2,310 CO2 kg/t Carbon footprint of building life cycle Cement 735 CO2 kg/t Building Carbon Emission Calculation Standard Sand 2.51 CO2 kg/t Building Carbon Emission Calculation Standard Block 195 CO2 kg/m3 Related papers[37] The transportation of materials is also a significant contributor to carbon emissions. Khan et al. highlighted several key factors that influence transportation-related emissions, including the mode of transportation, travel distance, and the type of energy powering the vehicles[38]. In this study, material transportation was assumed to be carried out by medium-sized gasoline trucks with an 8-ton load capacity. When specific data were unavailable, default values from Appendix E of GB/T 51366-2019 were used. The transportation distance for concrete was set at 40 km, whereas a default distance of 500 km was assumed for other building materials. The relevant data are summarized in Table 3.
Table 3. Carbon emission factors of different building materials transportation
Material Consumption (t) Transport way Transportation distance (km) Carbon emission factor (kgCO2/t·km) Concrete 1,383.69 Heavy-duty diesel truck transport (Load 30t) 40 0.078 Rebar 117.26 Medium-sized gasoline truck transportation (Load 8t) 500 0.115 Cement 165.84 Medium-sized gasoline truck transportation (Load 8t) 500 0.115 Sand 354.68 Heavy petrol truck transport (Load 18t) 500 0.104 Block 119.24 Medium-sized gasoline truck transportation (Load 8t) 500 0.115 CEEB model establishment
-
The floor layout is created after importing the BIM model into the CEEB via a link. The associated carbon emissions differ from each other because the rooms serve various functional purposes. Therefore, it is necessary to configure each room individually on each floor to enable a more accurate assessment of carbon emissions. After all the construction settings were completed, a thorough inspection was conducted to identify and correct any errors. The revised and adjusted model is presented in Fig. 5.
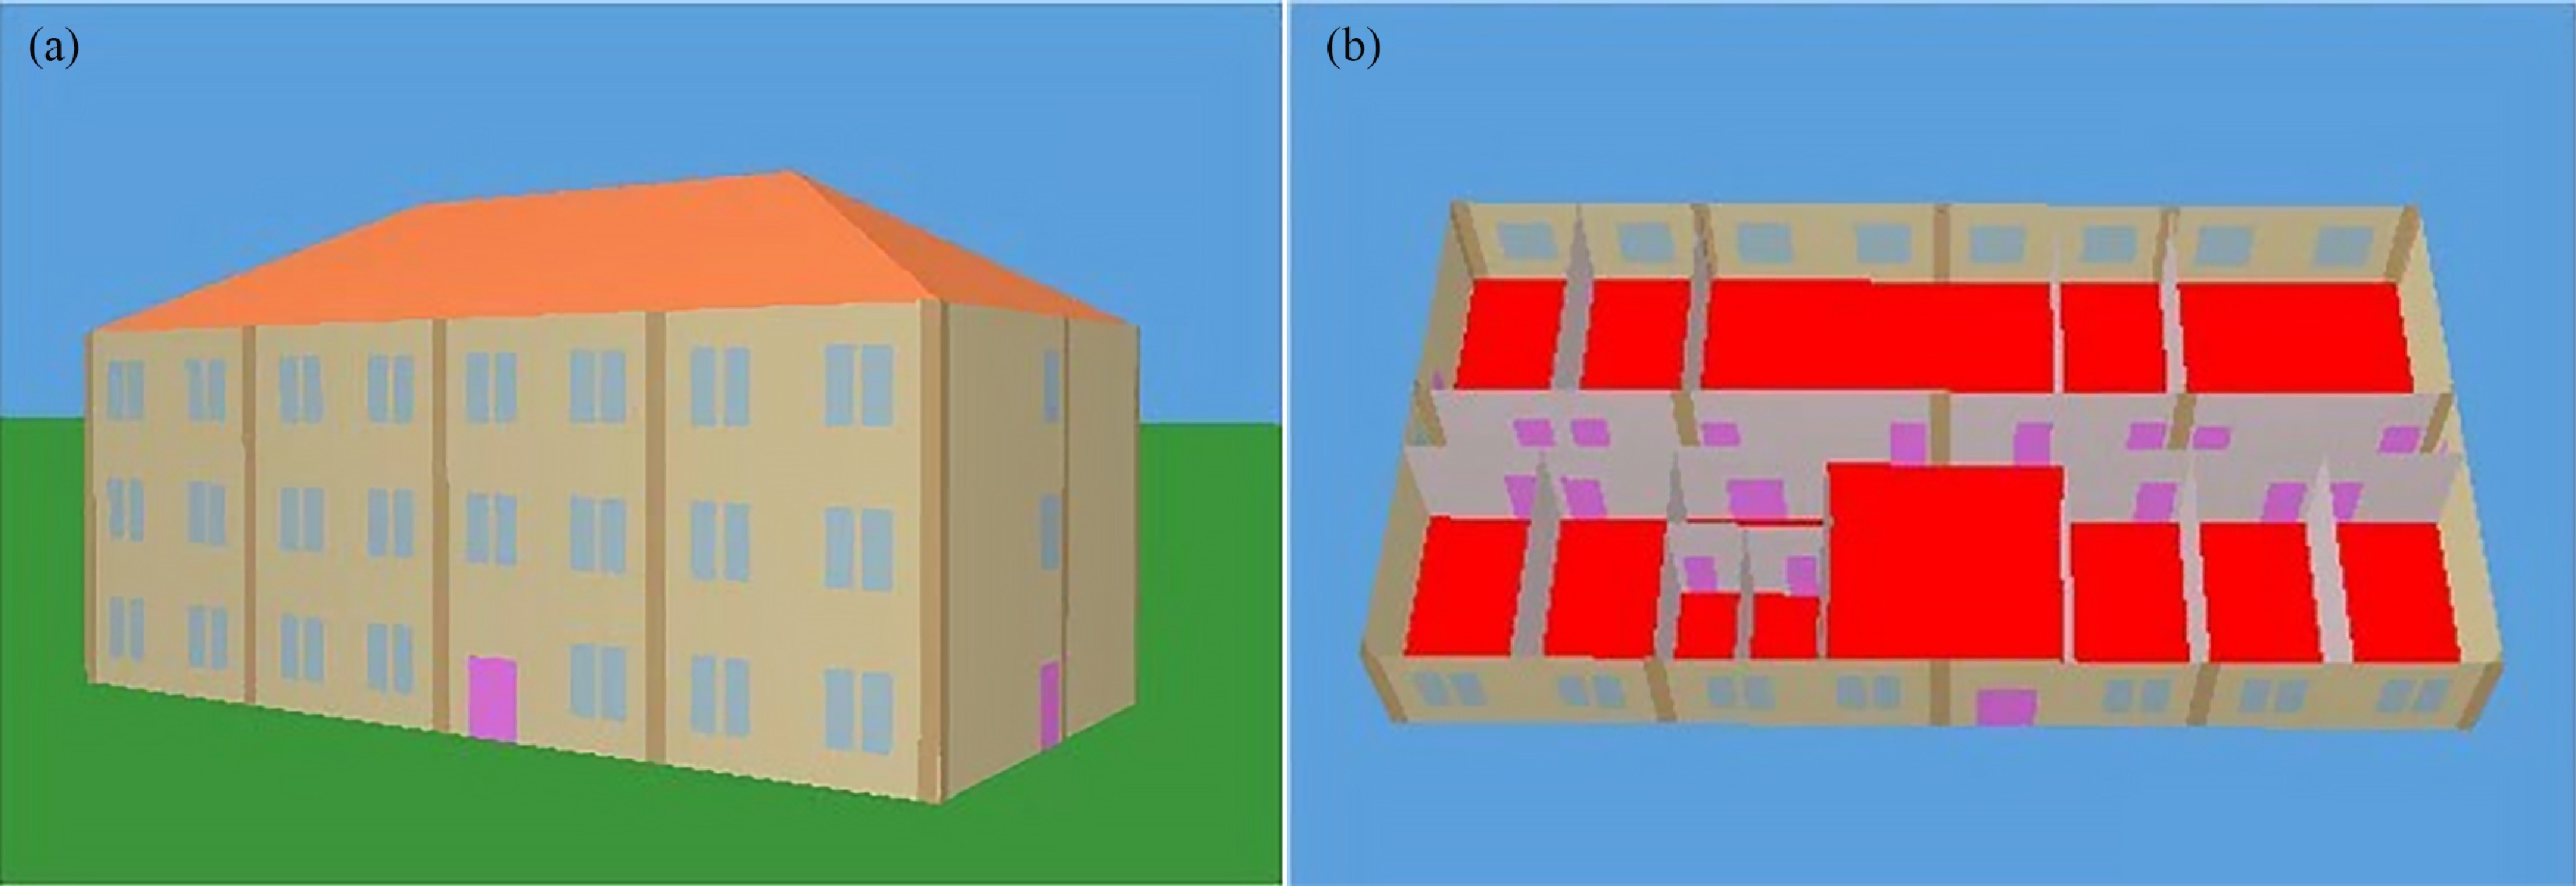
Figure 5.
CEEB model. (a) Model of single building, (b) model of building standard floor.
The next step involves entering the building information following model refinement, including the input of key parameters such as the geographical location of the project, building type, heating duration, room functions, and elevator configuration. The carbon emission calculations were initiated after the completion of these configurations, which yielded critical data regarding the environmental impact of various stages, supporting the optimization of energy efficiency and sustainability design strategies during the design stage. The detailed workflow for establishing the CEEB model is shown in Fig. 6.
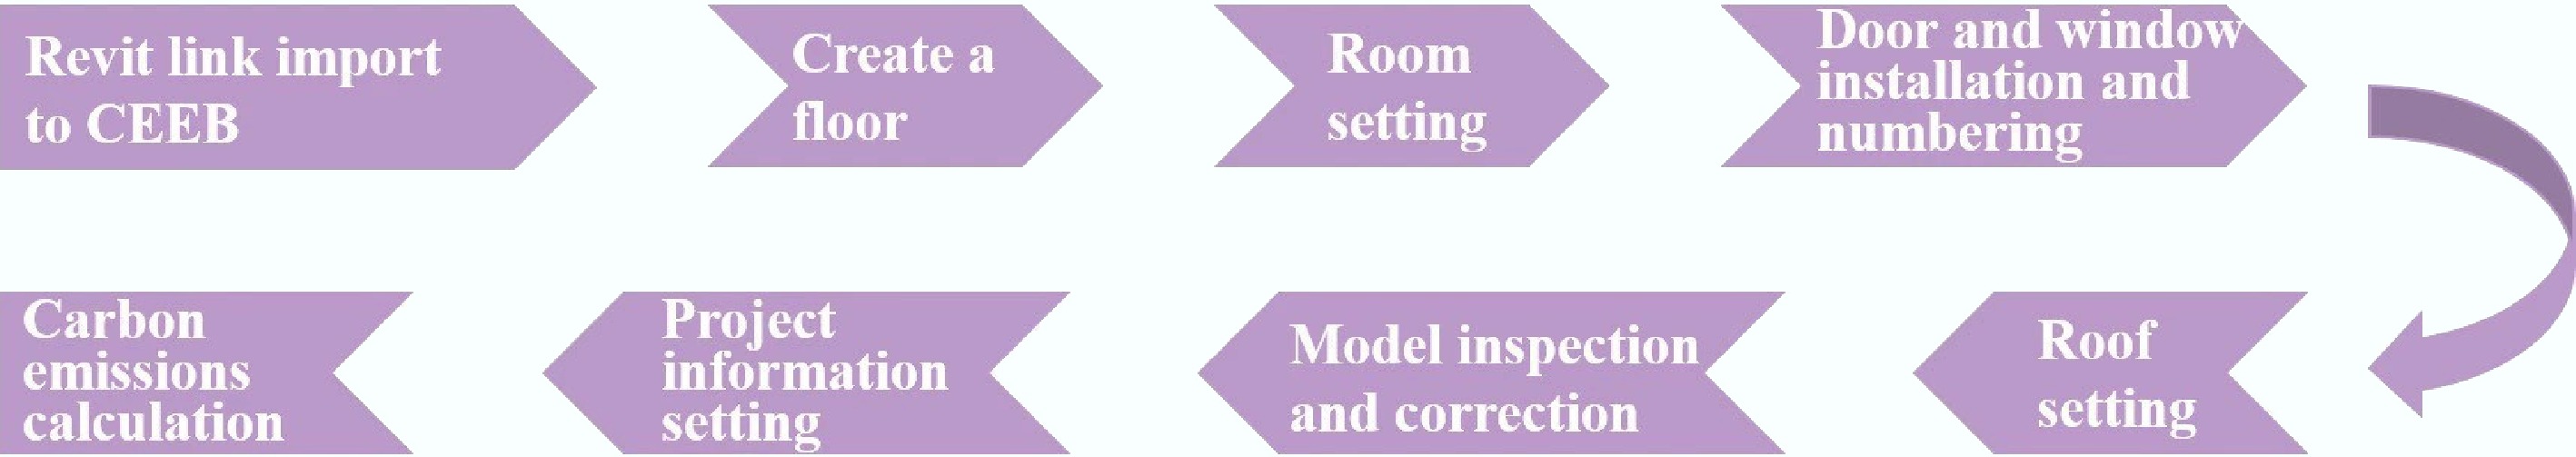
Figure 6.
CEEB model building process.
-
Due to the extensive variety of building materials used in the material production and transportation phases, along with the limited consumption of certain materials and the difficulty in obtaining carbon emission factor data for others, it is difficult to account for the carbon emissions of all building materials comprehensively. Therefore, to simplify the calculation process, the analysis scope is confined to major materials such as concrete, steel reinforcement, cement, sand, and masonry blocks. Based on the data provided in Tables 1 to 3, and in accordance with Eqs (2) to (4), the carbon emissions for this stage were calculated, with detailed results presented in Table 4. As shown in Figs 7 and 8a, the carbon emissions from steel bars reached 270.871 tCO2 eq in the production stage of building materials, accounting for 46% of the total carbon emissions of building materials production, nearly half of the total. Concrete contributed 172.956 tCO2 eq, accounting for 29%, whereas cement accounted for 51.064 tCO2 eq, less than that of concrete, representing 21% of the total. These results indicate that steel, concrete, and cement are the primary contributors to carbon emissions in the production stage, with steel having the highest proportion of emissions. This highlights both the environmental impact and the emission reduction potential of steel in the construction industry. Carbon emissions during the production stage can be mitigated by optimizing manufacturing processes, utilizing renewable energy sources, improving waste heat recovery in cement kilns, optimizing mix designs, adopting low-carbon materials, enhancing power grid structures, and increasing material efficiency. For instance, the carbon emissions of concrete can be reduced by reducing the amount of cement and increasing the proportion of mineral admixtures, such as fly ash and slag powder, on the premise of ensuring the performance of concrete. Additionally, the dependence on limestone and clay can be reduced by using industrial by-products such as fly ash as partial substitutes for raw materials in cement production[39], which not only curbs energy consumption and carbon emissions but also promotes industrial waste cycling and supports the development of a circular economy.
Table 4. Carbon emissions in the production and transportation stage of non-building materials
Material Production carbon emission (tCO2 eq) Transport carbon emission (tCO2 eq) Total carbon emission (tCO2 eq) Concrete 172.96 4.32 177.28 Rebar 270.87 6.74 277.61 Cement 121.89 9.54 131.43 Sand 0.89 18.44 19.33 Block 23.25 6.86 30.11 Total 589.87 45.90 635.76 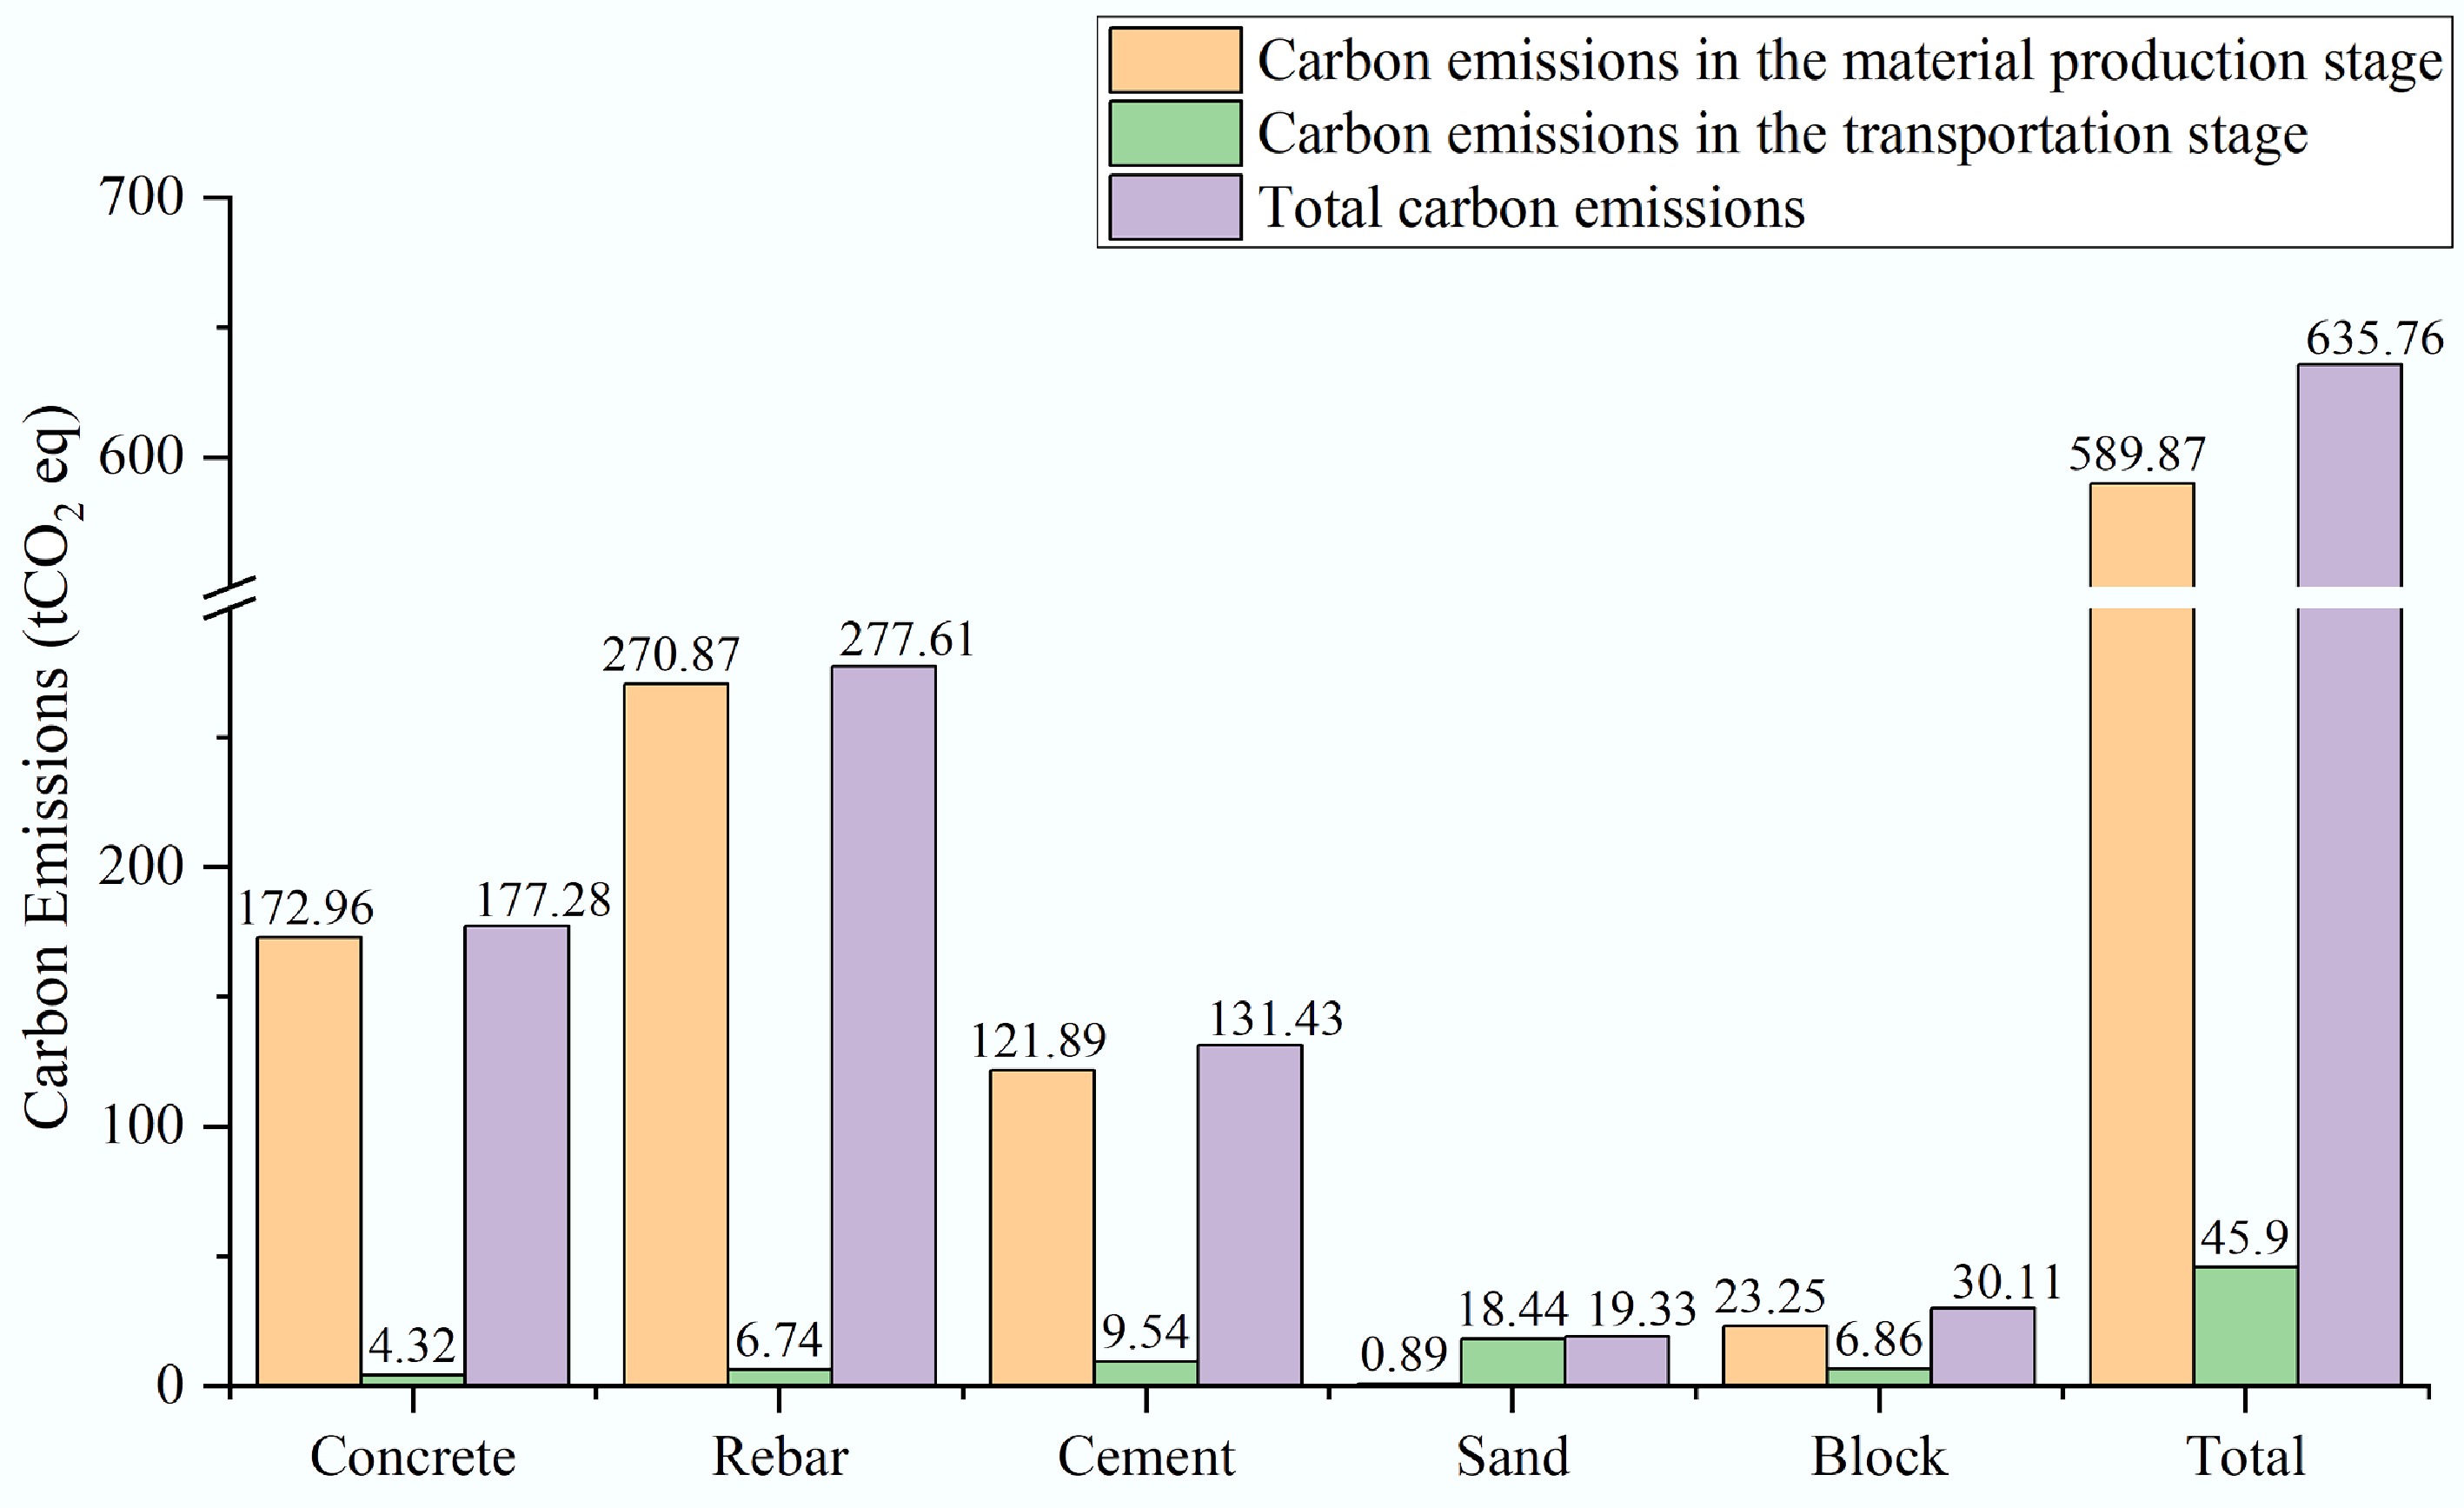
Figure 7.
Carbon emissions in the production and transportation stages of building materials.
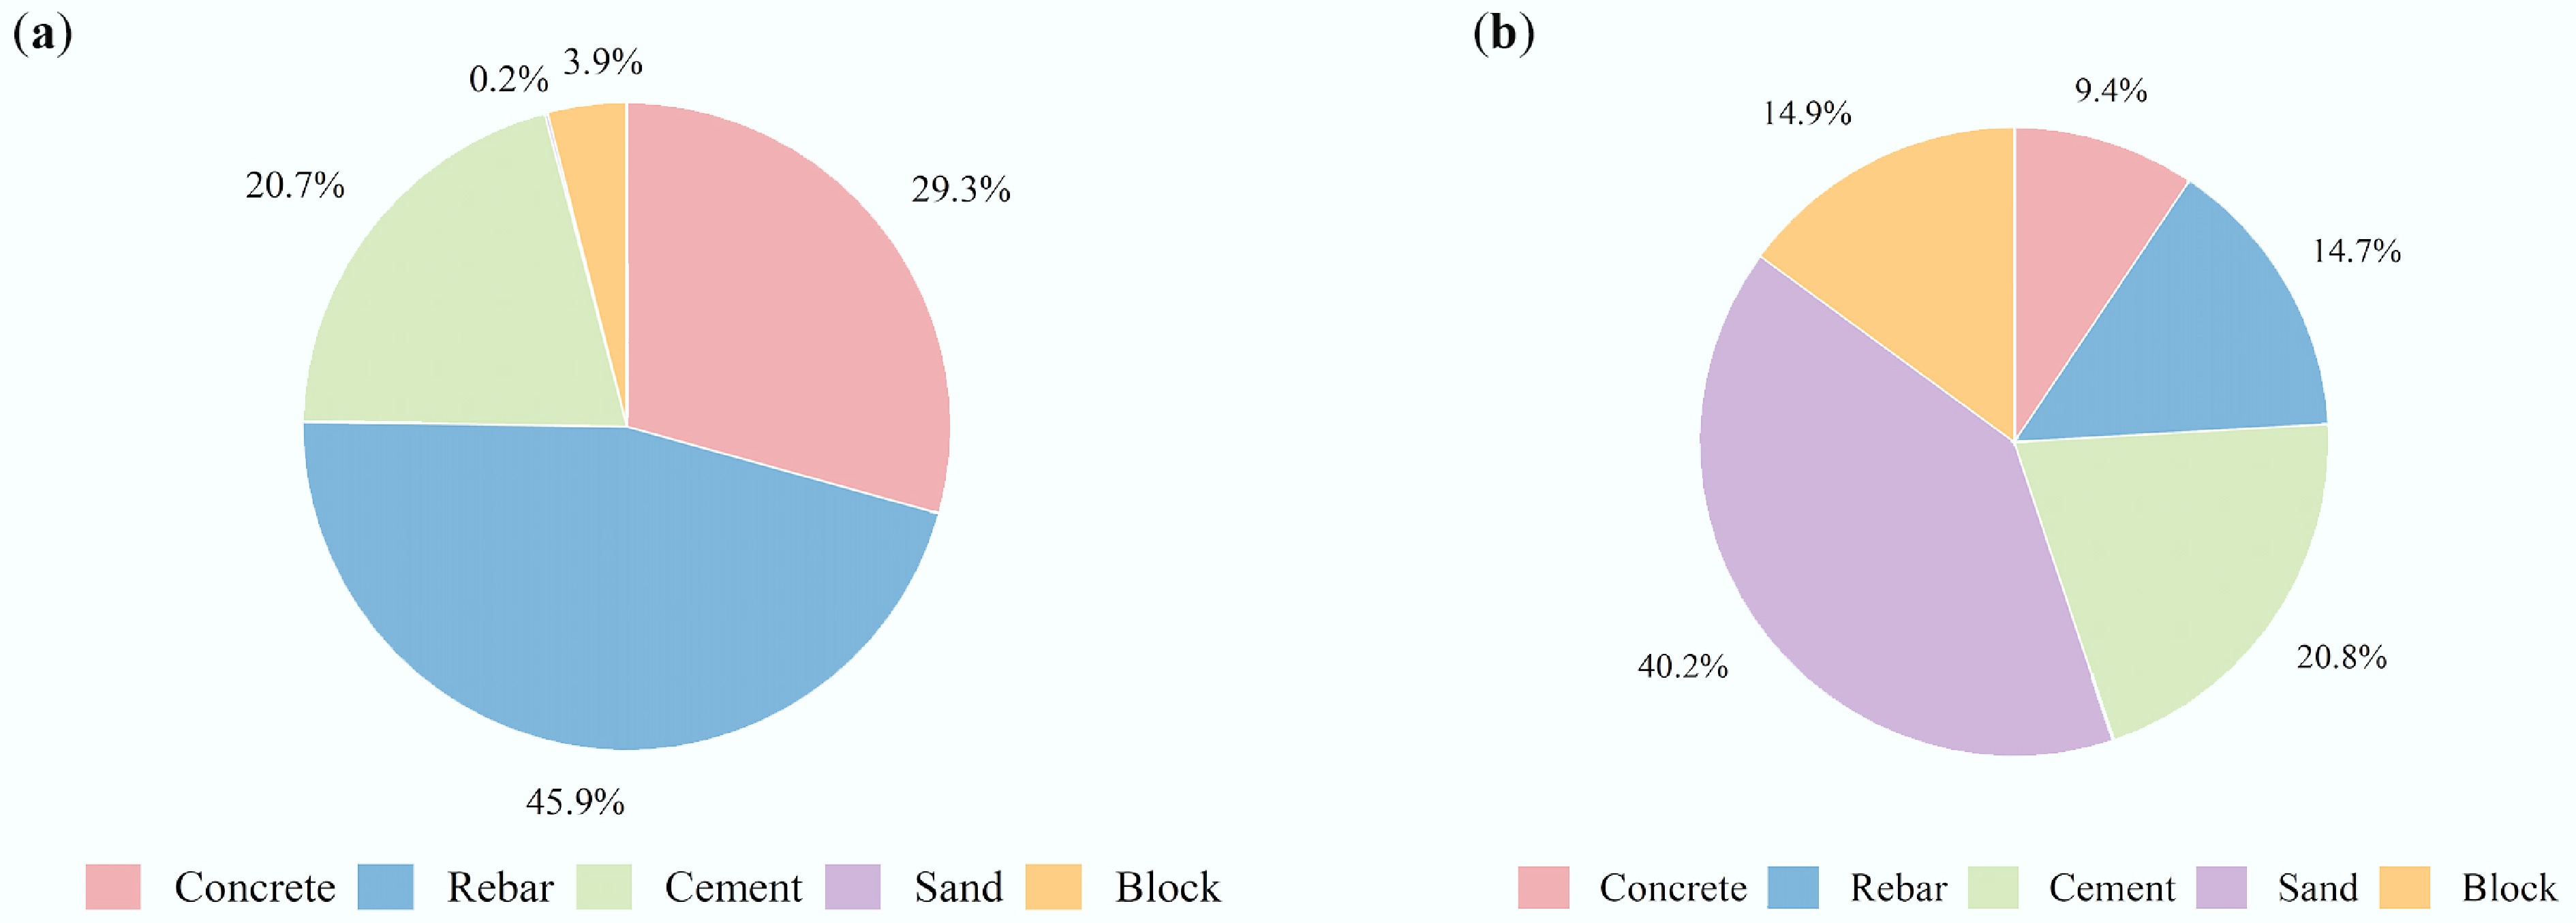
Figure 8.
Proportion of carbon emissions of material (a) in the production stage, (b) in the transportation stage.
From the analysis of Figs 7 and 8b, it is evident that the sand transportation generated 18.443 tCO2 eq, accounting for 40% of the total carbon emission from building materials production. In contrast, the carbon emissions from sand during the production phase were only 0.89 tCO2 eq, making its production impact almost negligible. Cement contributed 9.536 tCO2 eq to transportation emissions, accounting for 21% of the total carbon emissions; while the blocks and steel bars had relatively close emissions, both at 6.8 tCO2 eq, accounting for 15% each. This stark contrast underscores the disproportionate impact of sand transportation on total emissions and highlights the need for targeted improvements in this phase.
Several measures can be adopted to reduce the carbon emissions from building materials during the transportation phase, such as optimizing transportation routes, improving transportation efficiency, utilizing clean energy vehicles, and prioritizing local or regional material suppliers. This study suggests that sourcing materials locally, closer to the construction site, could significantly reduce emissions from the high transportation of sand[40]. Furthermore, using short-haul transport and clean energy vehicles, such as electric, hydrogen-powered, or natural gas trucks, can effectively reduce the environmental footprint of material logistics.
Sensitivity analysis of transportation parameters
-
Owing to different transportation distances and fuel vehicle types, the carbon emissions generated during the material transportation stage may differ. Based on the original transportation parameters (Table 3), different scenarios were designed for the sensitivity analysis (Table 5).
Table 5. Sensitivity analysis under different scenarios
Situation type Parameter setting Purpose Baseline scenario (S0) Original transport parameters: 500 km (sand, rebar, cement, block), 40 km (concrete); vehicle type and emission factors are shown in Table 3. As the baseline of sensitivity analysis. Vehicle type sensitivity (S1) Keep a distance of 500 km and change from 'Heavy Petrol Trucks (0.104)' to 'Heavy Diesel Trucks (0.078)'. Verify the effect of fuel type (gasoline vs diesel) on emissions. Local supply scenario (S2) Transport distance reduced to 50 km (sand, cement, blocks), vehicle type unchanged (continued Table 3). Simulation of the impact of local material procurement on emissions. Comprehensive optimization scenario (S3) Local supply (50 km) + diesel vehicles (heavy petrol trucks for sand and cement, emission factor 0.078). Emission potential assessment under extreme optimization scenarios. The sensitivity analysis results are presented in Table 6. Transportation parameters have a significant impact on material transport carbon emissions: (1) Vehicle type impact: switching sand transportation from heavy-duty petrol trucks (emission factor: 0.104 kgCO2/t·km) to diesel trucks (0.078 kgCO2/t·km) reduced sand transport emissions by 25.3% (18.44 to 13.78 tCO2 eq), yet sand remained the primary emitter (31% share vs 40% originally), confirming the robustness of sand as a key emission source while highlighting diesel vehicles' mitigation potential; (2) Local supply impact: Adopting a 50 km local supply scenario (vs original 500 km) triggered a 90% reduction in sand emissions (18.44 to 1.84 tCO2 eq), dropping its share from 40% to 12% (rank: 1st→3rd), while rebar (maintaining 500 km transport) emerged as the top emitter (43%), followed by concrete (28%, 40 km), underscoring transport distance as a critical sensitive parameter and validating localized sourcing as an effective mitigation strategy; (3) Combined optimization potential: The integrated scenario (50 km local supply + diesel vehicles) achieved extreme reductions, with sand emissions plummeting to 0.35 tCO2 eq (3% share), rebar dominating (57%), and total transport emissions decreasing by 73.9% (45.90 to 11.98 tCO2 eq), demonstrating synergistic benefits of distance reduction and clean vehicle adoption.
Table 6. Sensitivity analysis
Scenario Material Distance (km) Vehicle type Carbon emission factor (kgCO2/t·km) Q2 (tCO2 eq) Proportion Billing S0 Sand 500 Heavy petrol trucks 0.104 18.44 40% 1 Cement 500 Medium-sized gasoline truck transportation 0.115 9.54 21% 2 Block 500 Medium-sized gasoline truck transportation 0.115 6.86 15% 3 Rebar 500 Medium-sized gasoline truck transportation 0.115 6.74 15% 4 Concrete 40 Heavy diesel trucks 0.078 4.32 9% 5 S1 Sand 500 Heavy diesel trucks 0.078 13.78 31% 1 Cement 500 Medium-sized gasoline truck transportation 0.115 9.54 21% 2 Block 500 Medium-sized gasoline truck transportation 0.115 6.86 15% 3 Rebar 500 Medium-sized gasoline truck transportation 0.115 6.74 15% 4 Concrete 40 Heavy diesel trucks 0.078 4.32 9% 5 S2 Sand 50 Heavy Petrol Trucks 0.104 1.84 12% 3 Cement 50 Medium-sized gasoline truck transportation 0.115 0.95 6% 4 Rebar 500 Medium-sized gasoline truck transportation 0.115 6.74 43% 1 Block 50 Medium-sized gasoline truck transportation 0.115 0.69 4% 5 Concrete 40 Heavy Diesel Trucks 0.078 4.32 28% 2 S3 Sand 50 Heavy Diesel Trucks 0.078 0.35 3% 5 Rebar 500 Medium-sized gasoline truck transportation 0.115 6.74 57% 1 Concrete 40 Heavy Diesel Trucks 0.078 4.32 36% 2 Cement 50 Medium-sized diesel trucks 0.092 0.73 6% 3 Block 50 Medium-sized diesel trucks 0.092 0.54 5% 4 Emissions in construction
-
By configuring building envelope parameters, indoor environmental settings, and other relevant inputs within the CEEB model, operational energy consumption data for heating, air conditioning, lighting, and domestic hot water can be obtained. Subsequently, Eqs (7) through (9) are applied to calculate the corresponding carbon emissions for this phase, with detailed results presented in Table 7. As illustrated in Figs 9 and 10, carbon emissions from bituminous coal dominated the construction operation stage, reaching 2,570.50 tCO2 eq and accounting for 44.7% of the total emissions during this phase. In addition, the carbon emissions from heating reached 1,325.20 tCO2 eq, representing 23.1%. Based on the simulation analysis, the hot water for the building boiler system primarily relies on the combustion of bituminous coal, whereas the heating system operates via a hot water circulation pump. This indicates that nearly two-thirds of the building's operational carbon emissions are directly related to the heating.
Table 7. Carbon emissions in building operation stage
Carbon emission source Consumption CO2 emission factor Annual carbon emissions (tCO2/a eq) Total carbon emission (tCO2 eq) Heating 1,860 kWh/m2 0.5703 kgCO2/kWh 26.50 1,325.20 Air conditioner fan 268 kWh/m2 0.5703 kgCO2/kWh 3.81 190.55 Lighting 271 kWh/m2 0.5703 kgCO2/kWh 3.86 193.15 Socket equipment 750 kWh/m2 0.5703 kgCO2/kWh 10.68 534.15 Elevator 1,062 kWh/m2 0.5703 kgCO2/kWh 15.13 756.65 Domestic hot water 251 kWh/m2 0.5703 kgCO2/kWh 3.57 178.50 Bituminous coal 23,198 MJ/m2 89 tCO2/TJ 51.41 2,570.50 Total carbon emissions from building operation 114.97 5,748.70 
Figure 9.
Carbon emission of building operation stage.
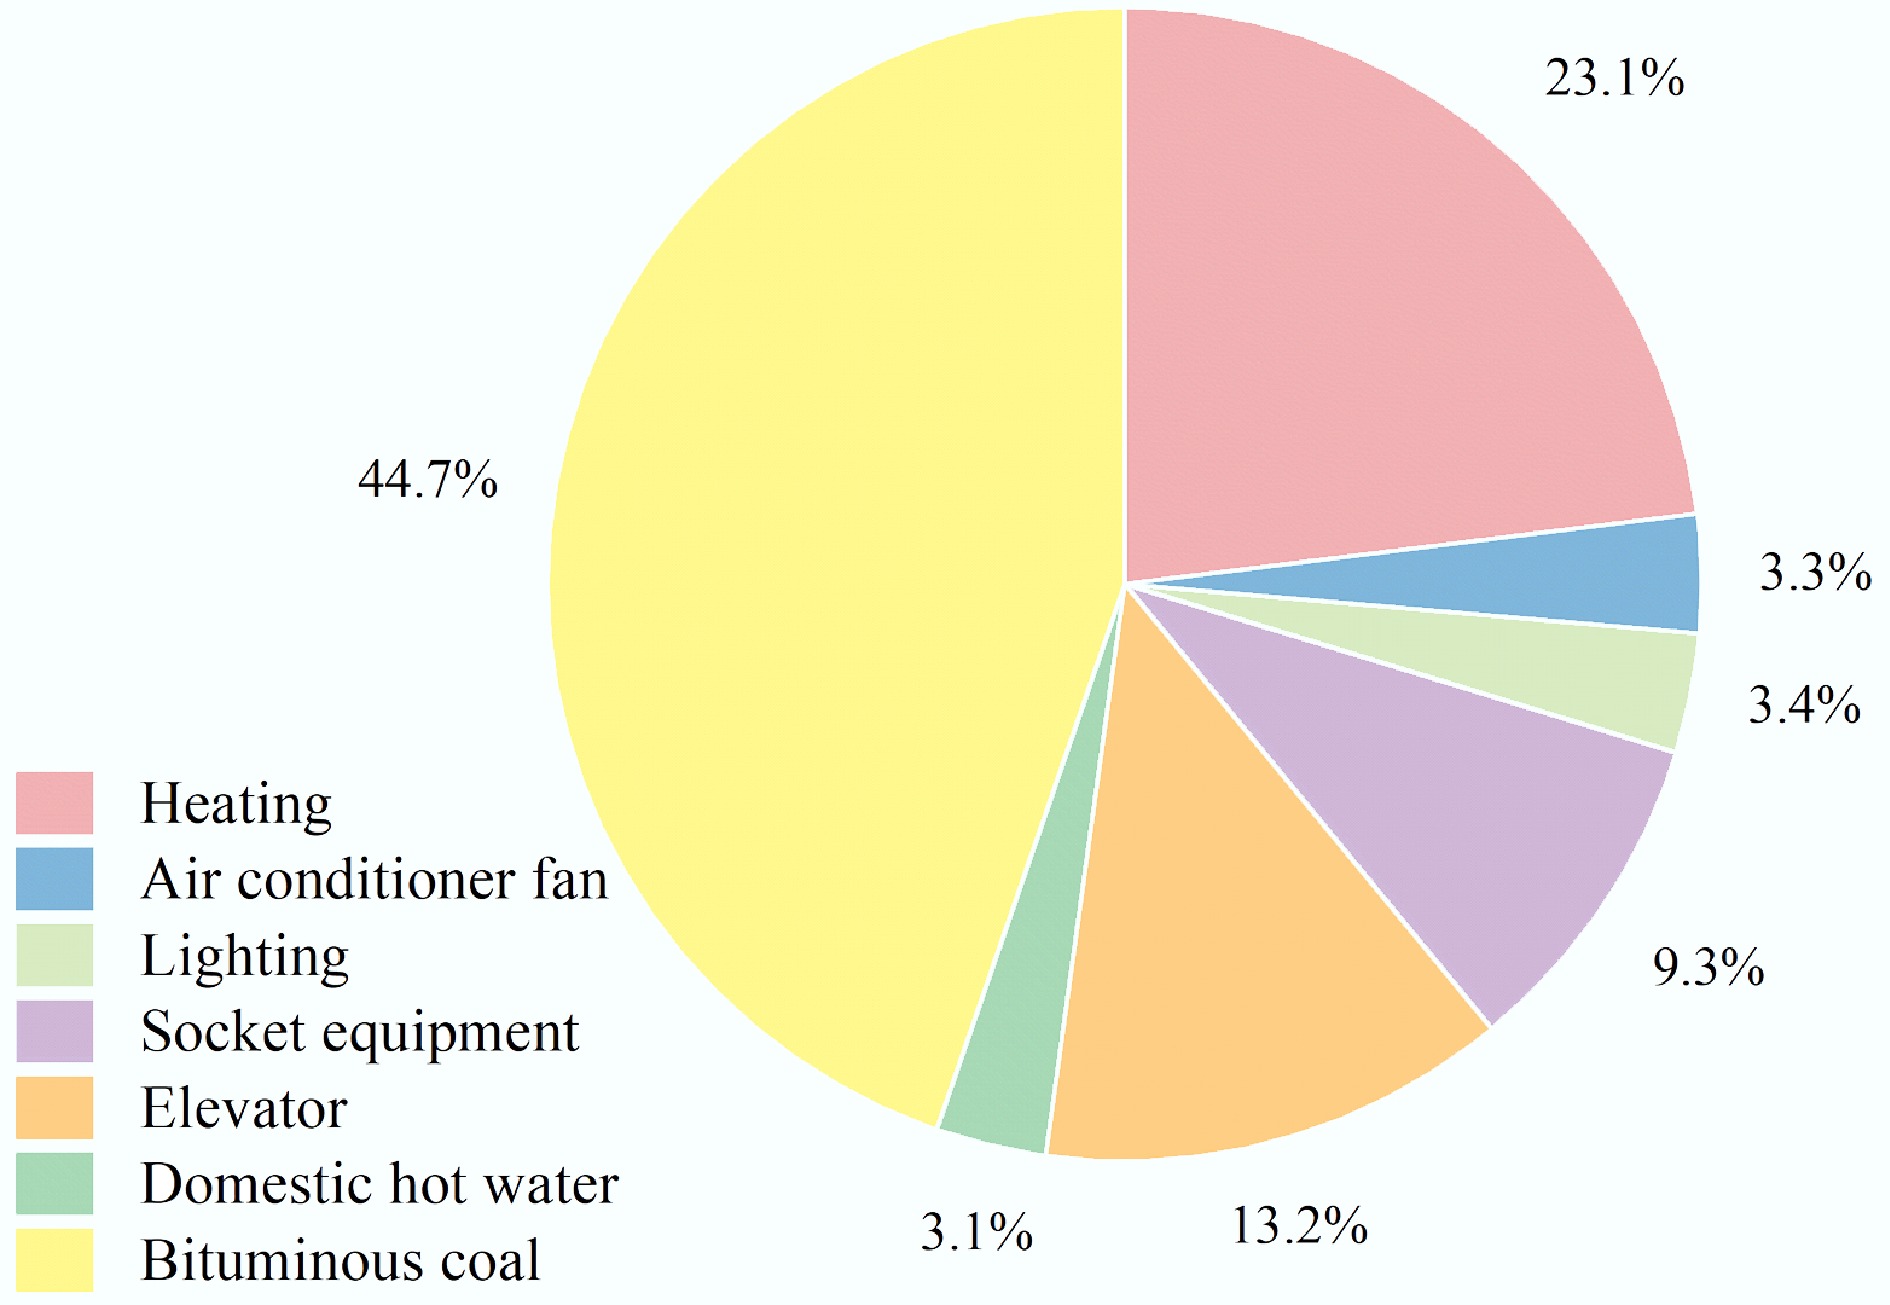
Figure 10.
The proportion of energy consumption in building operation stage.
The development and adoption of clean heating technologies are particularly critical to effectively reduce the carbon emissions generated during the heating process. Therefore, the following strategies may be considered: first, reducing the dependence on fossil fuels by transitioning to electric heating and renewable energy sources such as solar or wind power; second, promoting geothermal heating systems leveraging geothermal energy for efficient, low-emission heating[41]; third, introducing biomass heating, using renewable biomass fuels as an alternative to coal[42]; and fourth, utilizing industrial waste heat for space heating, enabling the recycling of thermal energy that would otherwise be lost.
In addition to technological solutions, improving building design can significantly enhance heating efficiency. A well-considered spatial layout and design tailored to the local climate can reduce the heating load of a building. Furthermore, enhancing the thermal performance of the building envelope is essential for lowering the heating demand. Specific practices include: adding high-efficiency insulation to roofs and exterior walls to minimize heat loss and replacing traditional windows with thermally broken, double-glazed, Low-E aluminum alloy windows, which effectively reduce internal heat loss and block external heat gain. These improvements not only enhance the building's thermal insulation but also help reduce heating energy consumption. Ultimately, this reduces the carbon footprint of the building and contributes to sustainable development.
Comparison of carbon emissions under different heating scenarios
-
Based on the climate characteristics of Cold Zone A in Taiyuan (heating period 151 d, indoor design temperature 18 °C), and taking the original coal-fired heating scenario as the benchmark, three typical heating methods were selected for the comparison. The key parameters are listed in Table 8.
Table 8. Key parameters for different heating scenarios
Scenario Energy type Carbon emission factor Energy efficiency ratio (COP) Heat demand Data source Benchmark scenario Bituminous coal 89 tCO2/TJ 1.0 0.5776 TJ/a Table 5 Scenario 1 Natural gas heating Gas 55.54 tCO2/TJ 0.9 0.5776 TJ/a Related papers[45] Scenario 2 Ground source heat pump Power 0.5703 kgCO2/kWh 3.5 154,152.36 kWh /a Related papers[41] Scenario 3 Air source heat pump Power 0.5703 kgCO2/kWh 2.2 154,152.36 kWh /a Related papers[46] The heat demand benchmark is based on the inverse calculation of coal consumption in the original scenario. The annual heat demand was 0.5776 TJ/154,152 kWh, which ensured that the heating effect of each scenario was consistent. By adjusting the fossil fuel/electricity consumption during the operation phase, the operational carbon emissions and the proportion of the entire life cycle under each scenario were recalculated. The results are presented in Table 9.
Table 9. Carbon emissions and the proportion of the whole life cycle in the operation stage under different heating scenarios
Indicator Benchmark scenario Scenario 1 Scenario 2 Scenario 3 Heating carbon emissions (tCO2 eq) 2,570.50 1,782.22 1,255.90 1,998.02 Total carbon emissions in the operation stage(tCO2 eq) 5,748.70 4,960.42 4,434.10 5,176.22 Total carbon emissions in the maintenance stage (tCO2 eq) 818.54 818.54 818.54 818.54 LCCE (tCO2 eq) 6,940.36 6,152.08 5,625.76 6,367.88 Proportion of operation and maintenance stage 94.62% 93.94% 93.37% 94.14% As shown in Table 9, the emission reduction of the ground source heat pump was the most significant: the carbon emission of heating was 51.14% lower than that of coal burning, the total carbon emission from operation was reduced to 4,960.42 tCO2 eq, and the total carbon emission over the entire life cycle was reduced by 18.94%. This is attributed to the high COP (3.5) of the ground-source heat pump and the renewable energy contributions of 15% wind power and 5% photovoltaic power in the power system. Natural gas heating ranked second, with a reduction of 30.67%. This is because the carbon emission factor of natural gas (56.1 tCO2/TJ) is lower than that of bituminous coal (89 tCO2/TJ), and Taiyuan has built a natural gas pipeline network, making transformation costs low. The air-source heat pump is limited by the climate. Although it is driven by electricity, the COP in cold regions is low (2.2), and the heating carbon emissions are reduced by only 22.27%.
Taiyuan prioritizes the promotion of ground-source heat pumps. Shanxi is rich in geothermal resources (e.g., the geothermal gradient of the Taiyuan Basin is 2.5–3.0 °C/100 m). The initial investment for a ground-source heat pump (CNY ¥300–400 /m2) can be recovered through 10–15 years of energy-saving income. As a transitional scheme, natural gas can reduce carbon emissions by 36.9% in the short term by using the existing gas pipeline network, and can be further reduced by blending hydrogen in the future. An air-source heat pump (ASHP) assisted by a photovoltaic roof (2,600 h of sunshine in Taiyuan) can increase the proportion of renewable energy in electricity and reduce the carbon emissions of the ASHP.
Life cycle carbon emission analysis
-
By integrating the total carbon emissions across all construction phases and applying Eq. (1), the total lifecycle carbon emissions of the building can be calculated. The specific results are detailed in Table 10. As shown in Fig. 11, the majority of carbon emissions from the building come from the stage of operation and maintenance, and the carbon emissions reach 6,567.24 tCO2 eq in this stage, which accounts for 94.62% of the total carbon emissions over the whole life cycle of the building. This finding aligns closely with the results reported by Cai et al.[43] and Li et al.[44], further emphasizing the dominant role of the operation and maintenance stages in the life cycle carbon emissions of buildings.
Table 10. Building life cycle carbon emissions
Production and transportation stage
(tCO2 eq)Construction stage
(tCO2 eq)Operation and maintenance stage
(tCO2 eq)Demolition stage
(tCO2 eq)Total
(tCO2 eq)635.76 6.23 6,567.24 –268.87 6,940.36 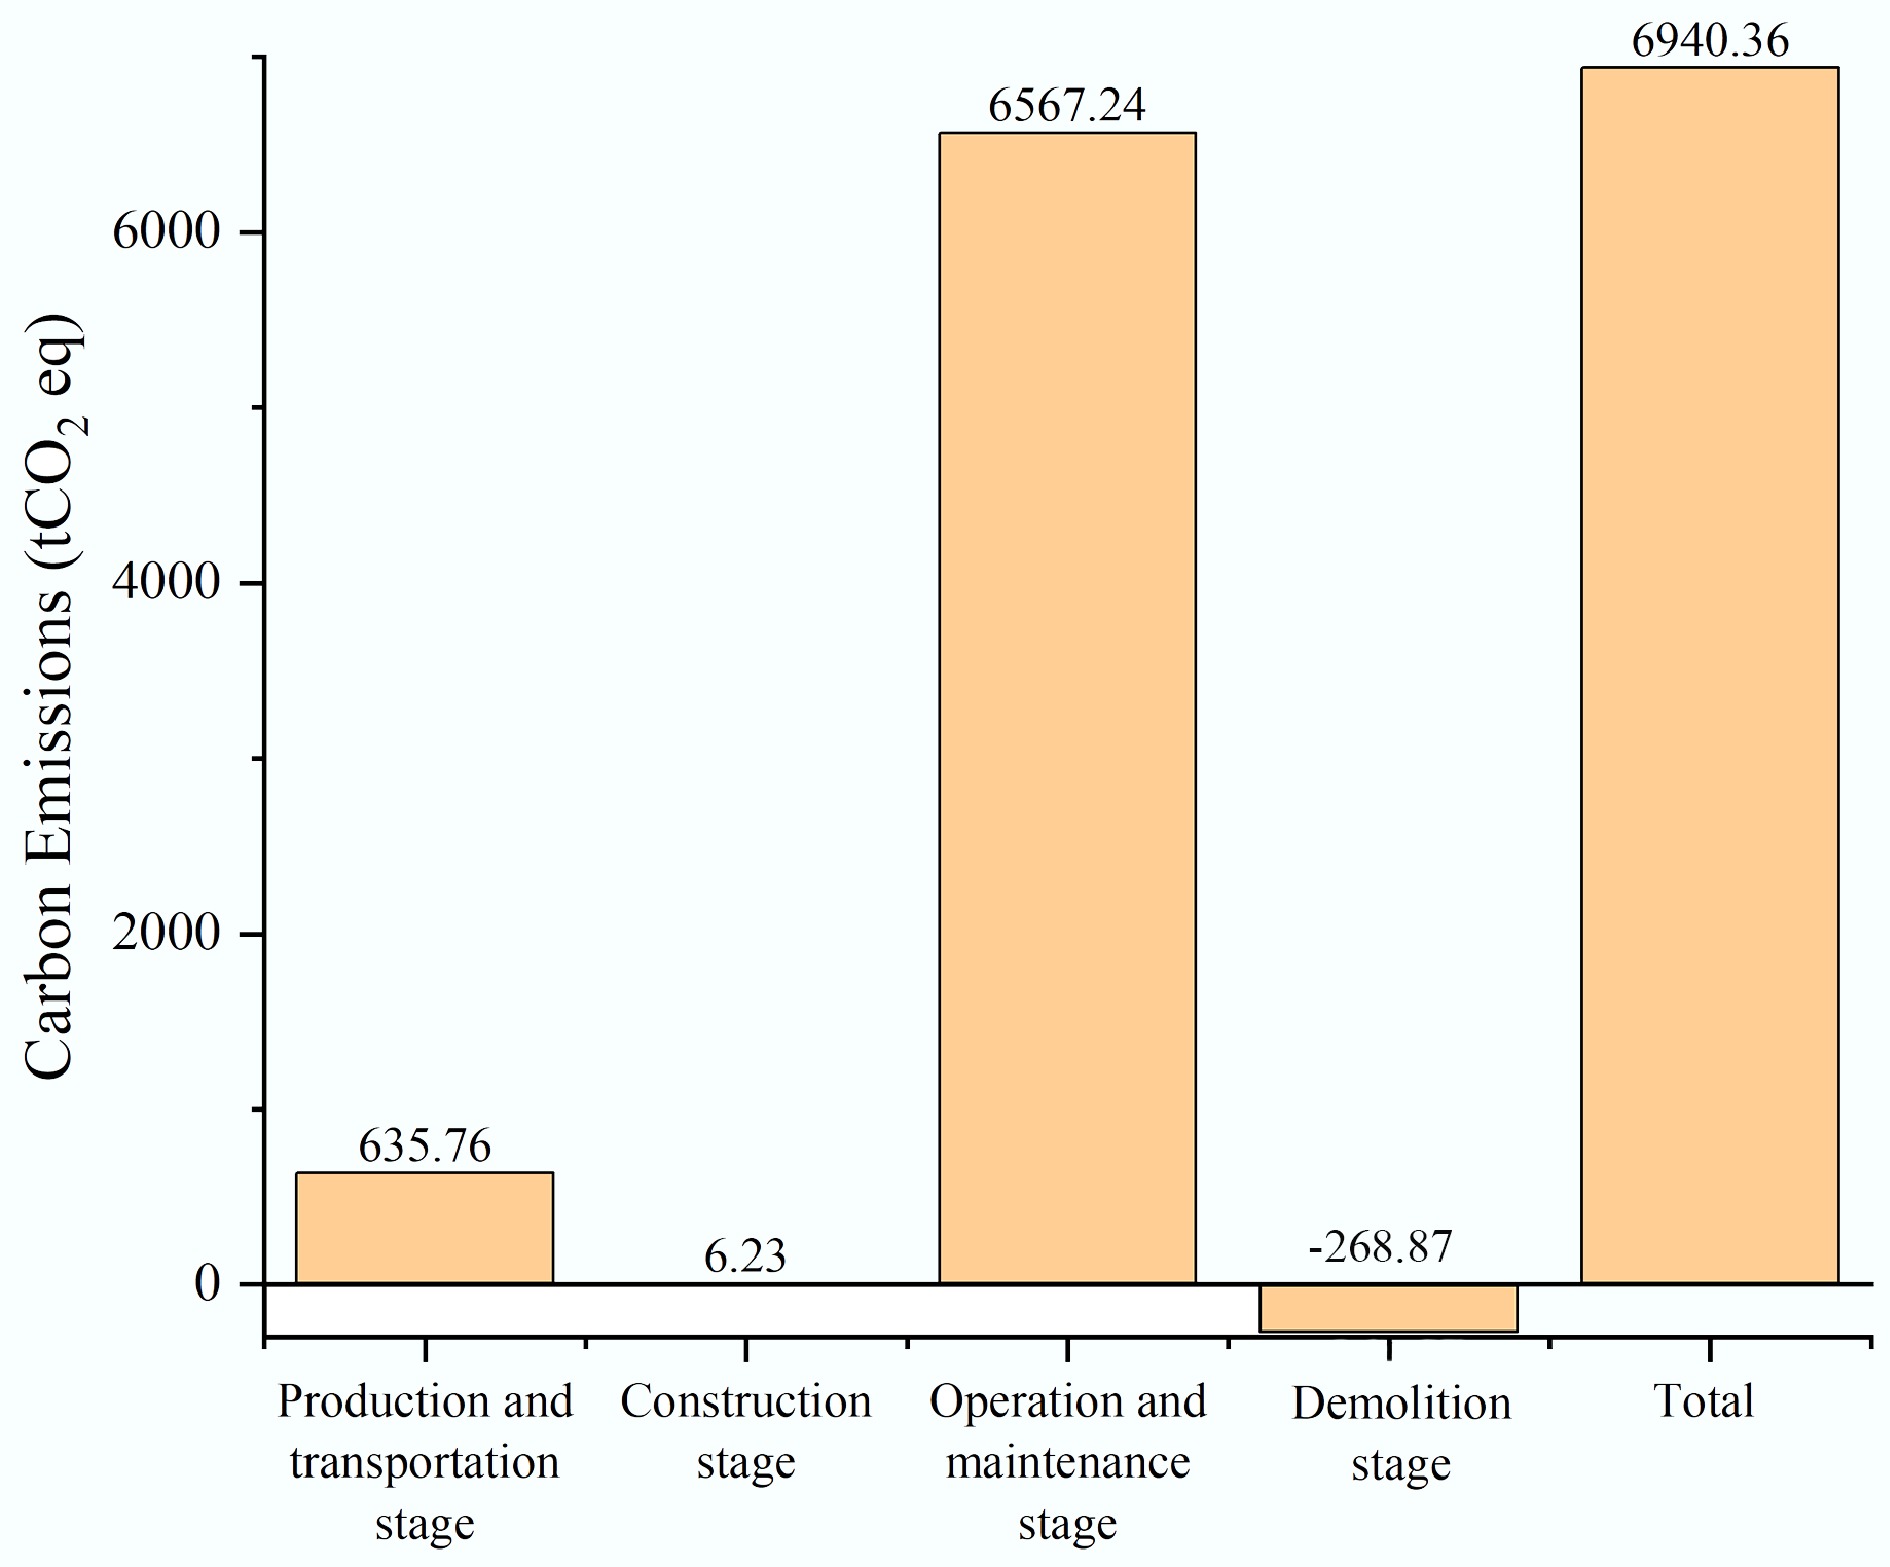
Figure 11.
Building life cycle carbon emissions.
The carbon emissions from the production and transportation stages ranked second in terms of carbon emissions, reaching 635.76 tCO2 eq, accounting for 9.16% of the total carbon emissions. This proportion highlights that the production and transportation of building materials also have a significant impact on overall carbon emissions, especially in the process of building preparation and material acquisition. Therefore, implementing environmental protection measures at this stage will help reduce the carbon footprint of the entire building life cycle.
Using the same estimation method, the carbon emissions from the construction stage and the demolition stage are both 6.23 tCO2 eq, which accounts for 0.1% of the carbon emissions over the whole life cycle of the building. Their minimal impact suggests that efforts to reduce emissions should prioritize the operation, production, and transportation phases.
The case study demonstrated a clear pattern in the distribution of carbon emissions throughout the building life cycle. The operation and maintenance stage contributes approximately 94.62% of the total emissions, while the production and transportation of building materials account for about 8.8%. In contrast, the combined contribution of the construction and demolition phases is only 0.1%, rendering their impact comparatively negligible. These findings underscore the critical importance of targeting emission-reduction efforts during the operational phase. Based on the analysis above, the following measures should be implemented: prioritize the use of renewable energy and low-carbon materials, improve material utilization efficiency, and select building material suppliers with local production or shorter transportation distances to reduce overall carbon emissions.
-
A Building Information Model integrated with Life Cycle Assessment and Carbon Emission Estimation for Buildings methods was developed and successfully applied to a case study of an office building in Taiyuan, China. The results of the case study revealed characteristics of the distribution of carbon emissions over the whole life cycle of buildings, characterized by: (1) the operation and maintenance phase of buildings incurring the most emissions—approximately 90% of the total—due to energy use in heating and cooling, ventilation and maintenance; (2) the production and transportation of construction materials accounting for roughly 10% of the total emissions; and (3) the construction and demolition contributing negligibly to total emissions. Direct heating using fossil fuels, such as coal, was identified as the main factor driving the high emissions. This finding confirms that the operation and maintenance phase should be the core focus of carbon emission reduction efforts in the construction industry, emphasising the necessity of prioritizing long-term energy efficiency strategies in architectural design and operation. Among construction materials, steel, concrete, and cement were identified as the dominant contributors to carbon emissions during the production process, which steel accounted for approximately 50% of the total emissions. In addition, sand quarrying and transport accounted for the highest proportion of transport-related carbon emissions, approximately 40%. It follows that emission reduction measures should focus on optimizing production processes and shortening transportation distances by selecting local suppliers.
-
The authors confirm contributions to the paper as follows: study conception and design: Xinyu Yang, Yingjie Shi; data collection: Shanzhi Wang, Xuan Cao; analysis and interpretation of results: Basaula Pululu Jordan, Yuxuan Li, Qifan Yue; draft manuscript preparation: Yujing Yang. All authors reviewed the results and approved the final version of the manuscript.
-
The data were derived from the drawings of the case projects selected.
-
This research was supported by the China Scholarship Council (CSC) (Grant No. 202308140128), and the Fundamental Research Program of Shanxi Province (Grant No. 202203021212486).
-
The authors declare that they have no conflicts of interest.
-
This study predicts carbon emissions during the design phase and explores mitigation measures based on Life Cycle Assessment (LCA) principles.
An anonymous office building was selected as a case study to create the BIM model and calculate the CEEB values.
The targeted emission reduction strategies are proposed based on the carbon emission characteristics of each phase.
This study innovatively proposes an integrated carbon emission calculation model combining LCA and BIM simulations.
-
Full list of author information is available at the end of the article.
- Copyright: © 2025 by the author(s). Published by Maximum Academic Press, Fayetteville, GA. This article is an open access article distributed under Creative Commons Attribution License (CC BY 4.0), visit https://creativecommons.org/licenses/by/4.0/.
-
About this article
Cite this article
Yang X, Shi Y, Jordan BP, Wang S, Cao X, et al. 2025. A building information modelling study of carbon emissions in the construction industry based on life cycle assessment. Energy & Environment Nexus 1: e015 doi: 10.48130/een-0025-0014 

A building information modelling study of carbon emissions in the construction industry based on life cycle assessment
- Received: 09 August 2025
- Revised: 11 November 2025
- Accepted: 05 December 2025
- Published online: 31 December 2025
Abstract: In an effort to understand characteristics of carbon dioxide emissions from the construction sector in China, a building information model (BIM) has been developed. The BIM enables stepwise calculation of carbon emissions throughout a building's life cycle, from the design phase through construction and use, to the end-of-life decommissioning. The BIM serves as a tool to explore mitigation measures based on the Life Cycle Assessment (LCA) principles. An anonymous office building was selected as a case study to demonstrate the BIM model for the calculation of Carbon Emission Estimation for Building (CEEB). The results reveal the relative proportions and intensities of carbon emissions during the operation and maintenance, building material production and transportation, and construction and demolition phases, which allows for the formulation of targeted emission reduction strategies based on the carbon emission characteristics of each phase. This study illustrates the capability of an integrated carbon emission calculation model that combines LCA and BIM simulations, providing a methodology for carbon emission assessment in the design phase of the construction industry.
-
Key words:
- BIM models /
- Carbon emission estimation /
- Civil engineering /
- Life cycle assessment