-
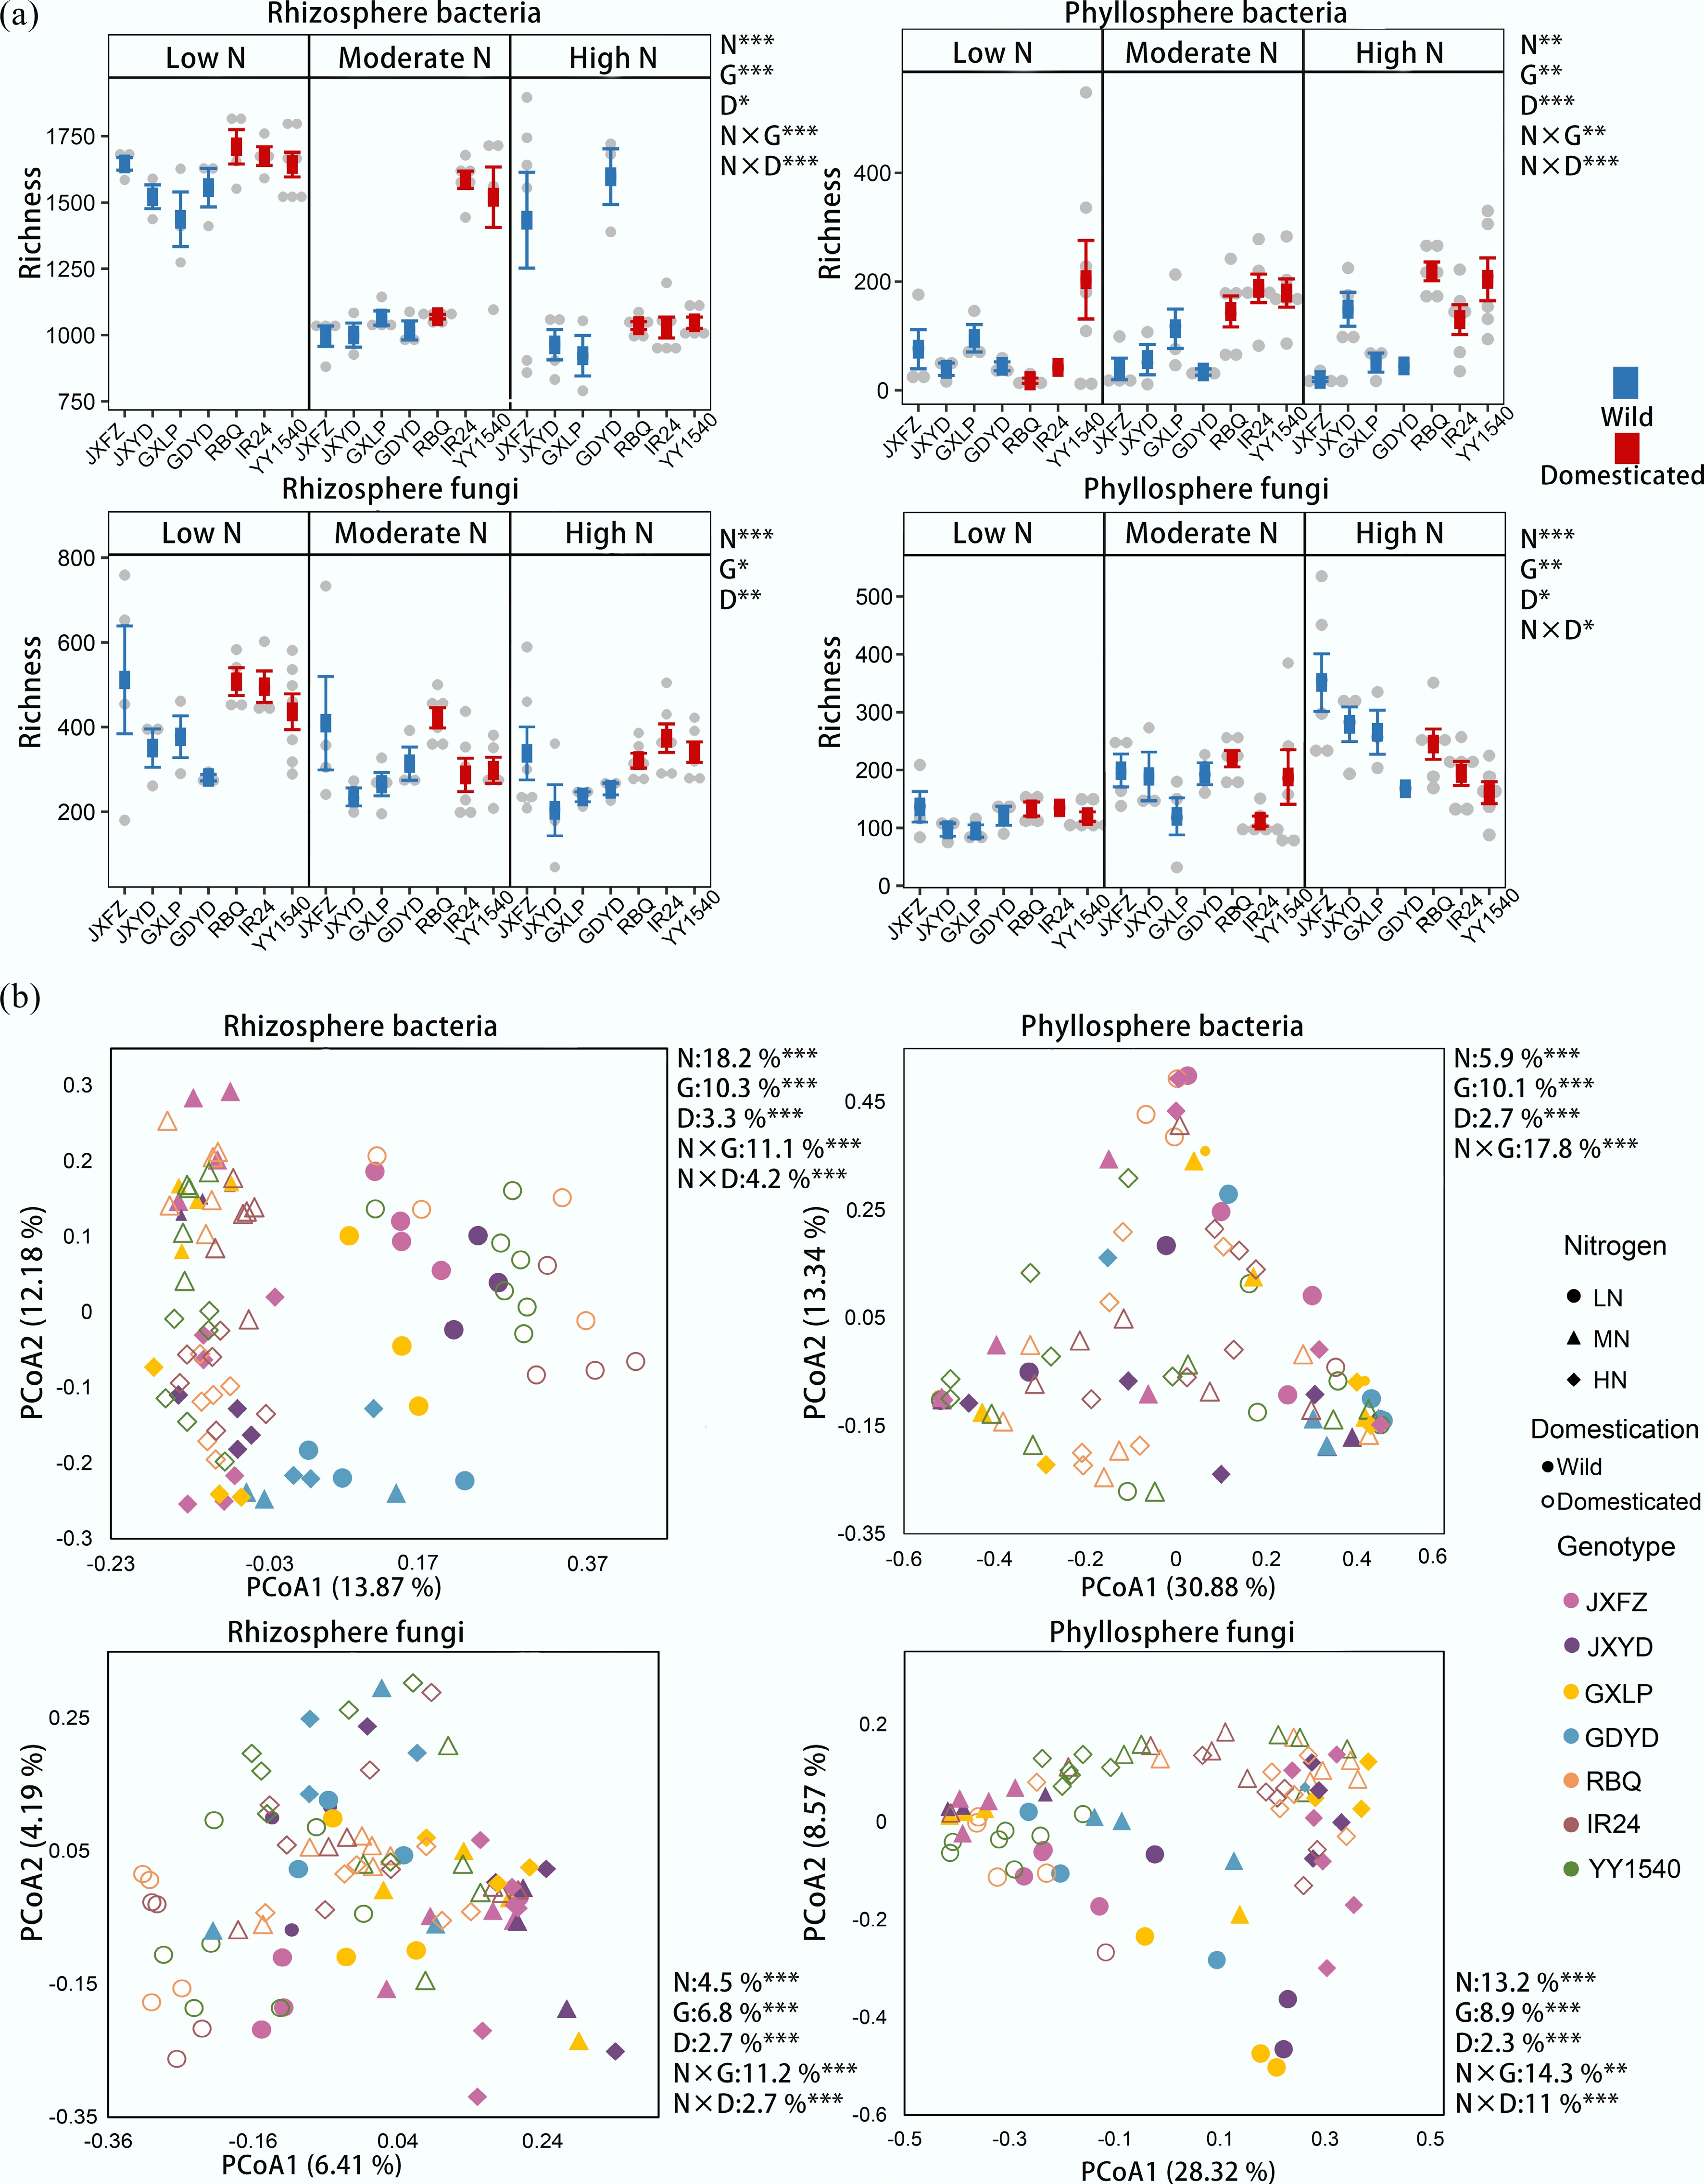
Figure 1.
Comparison of microbial communities in the rhizosphere and phyllosphere of different rice genotypes under three nitrogen fertilizer application levels. (a) Bacterial and fungal community richness. Data are presented as mean ± standard deviation (SD). (b) Principal coordinate analysis (PCoA) of bacterial and fungal community composition based on Bray-Curtis distances. The PERMANOVA results reveal the relative contributions of nitrogen addition (N), the identity of rice genotypes (G), and domestication status (D), as well as their interactions to bacterial and fungal richness and community composition. Significance levels of 0.05, 0.01, and 0.001 are represented by *, **, and ***, respectively.
-
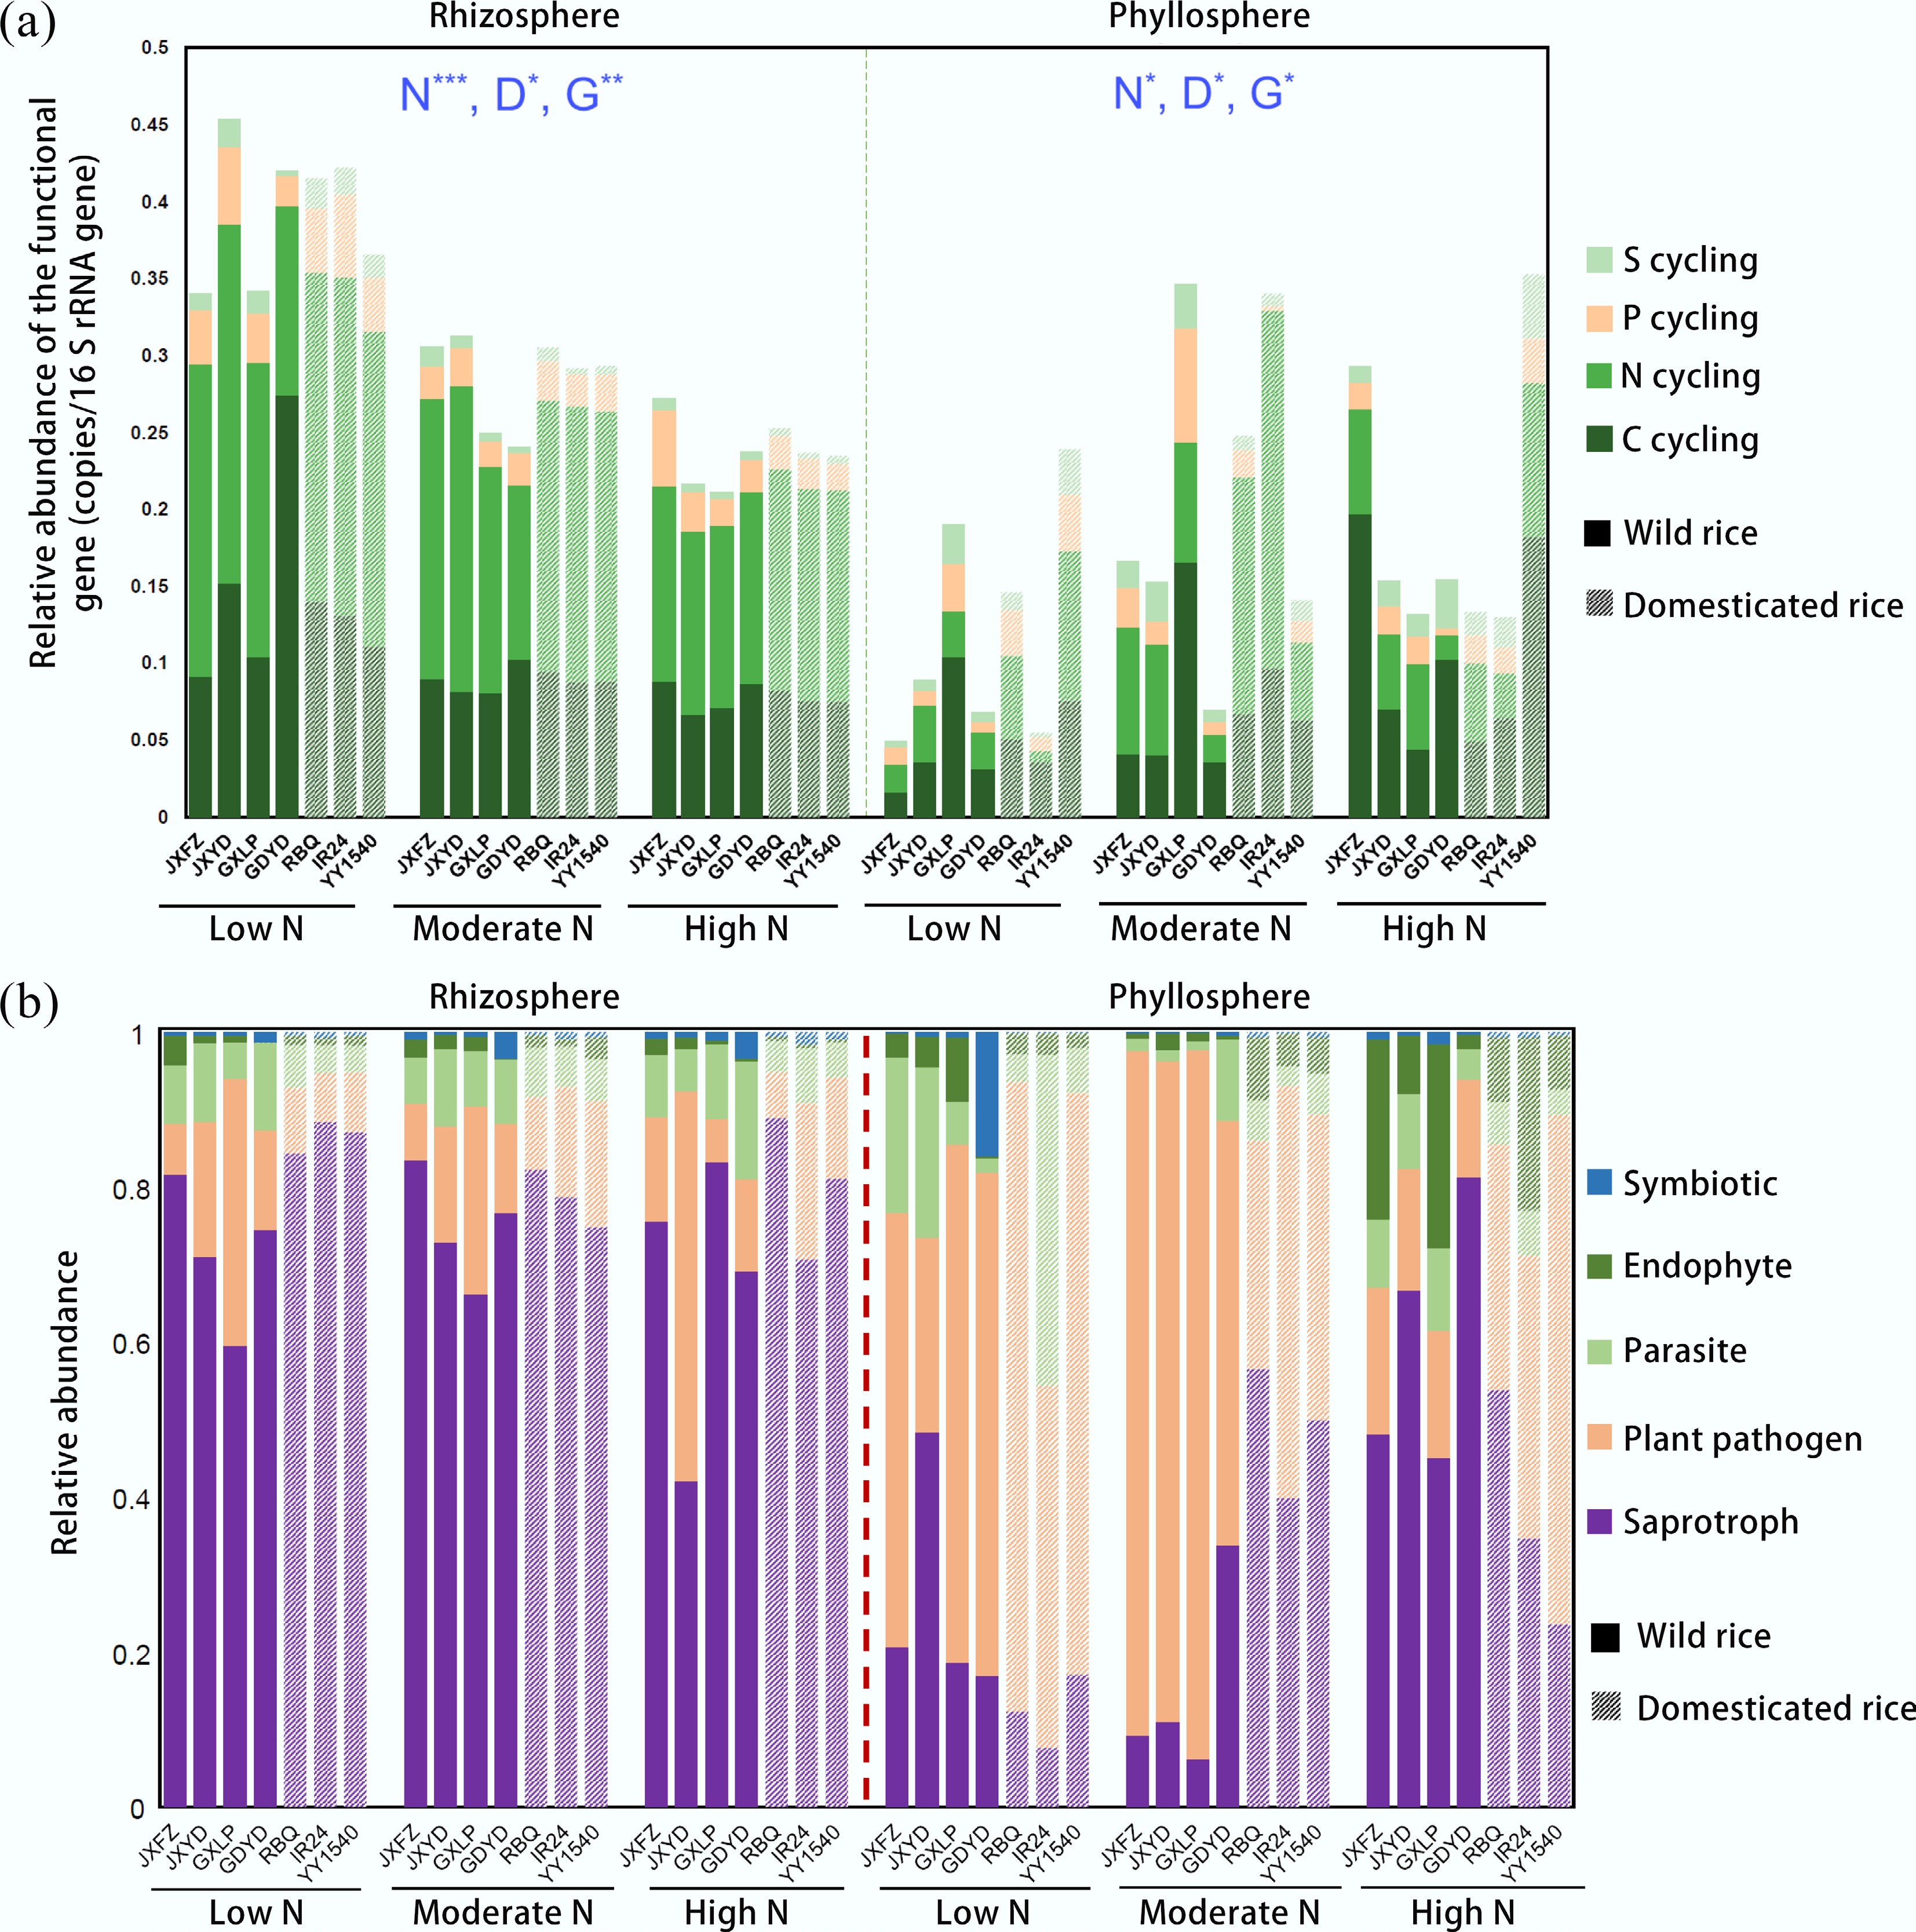
Figure 2.
Shifts in functional genes and fungal traits in the rhizosphere and phyllosphere of different rice genotypes under three nitrogen fertilizer application levels. (a) Relative abundance of functional genes. (b) Relative abundance of fungal traits among the total identified traits. PERMANOVA analysis reveals significant differences in functional genes between nitrogen addition (N), the identity of rice genotypes (G), and domestication status (D); Significance levels are represented as follows: * p < 0.05; ** p < 0.01; and *** p < 0.001.
-
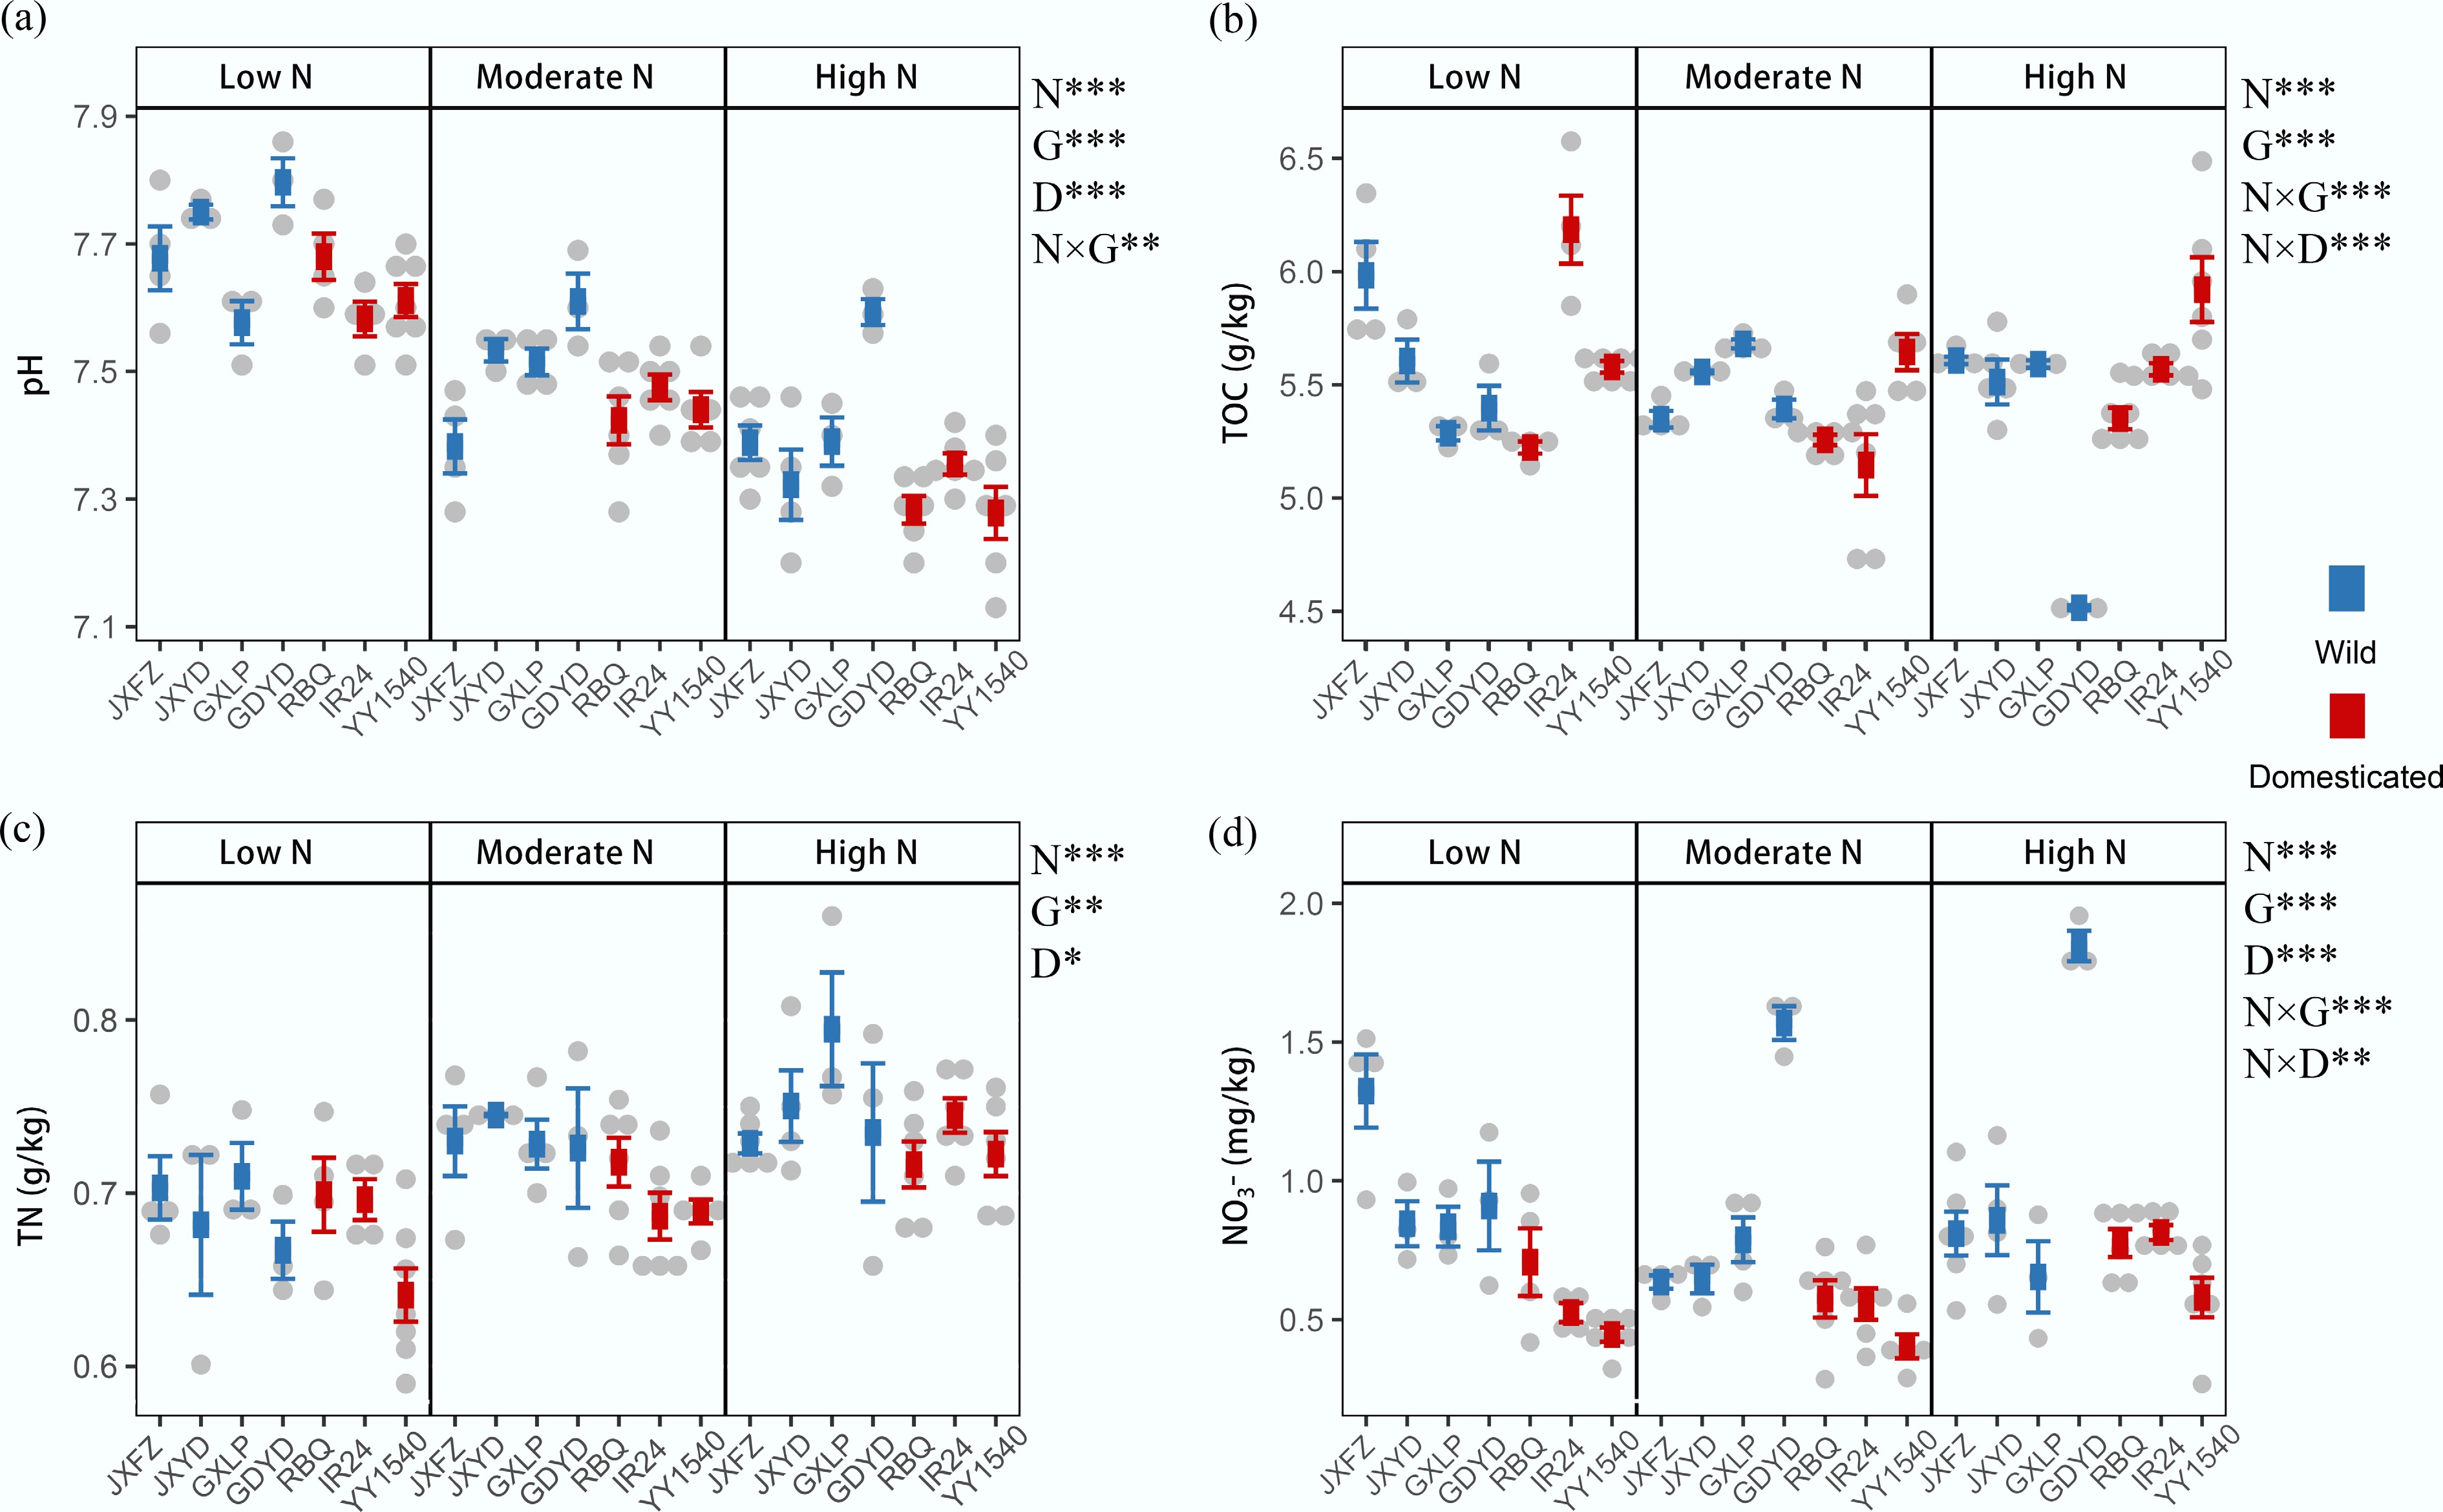
Figure 3.
Effects of nitrogen addition (N), domestication status (D), and identity of rice genotypes (G) on rhizosphere soil properties. (a) Soil pH. (b) Total organic carbon (TOC). (c) Total nitrogen (TN). (d) Nitrate nitrogen (NO3–-N). The data are presented as mean ± SD. PERMANOVA results indicate significant differences between treatment groups; * p < 0.05; ** p < 0.01; and *** p < 0.001.
-
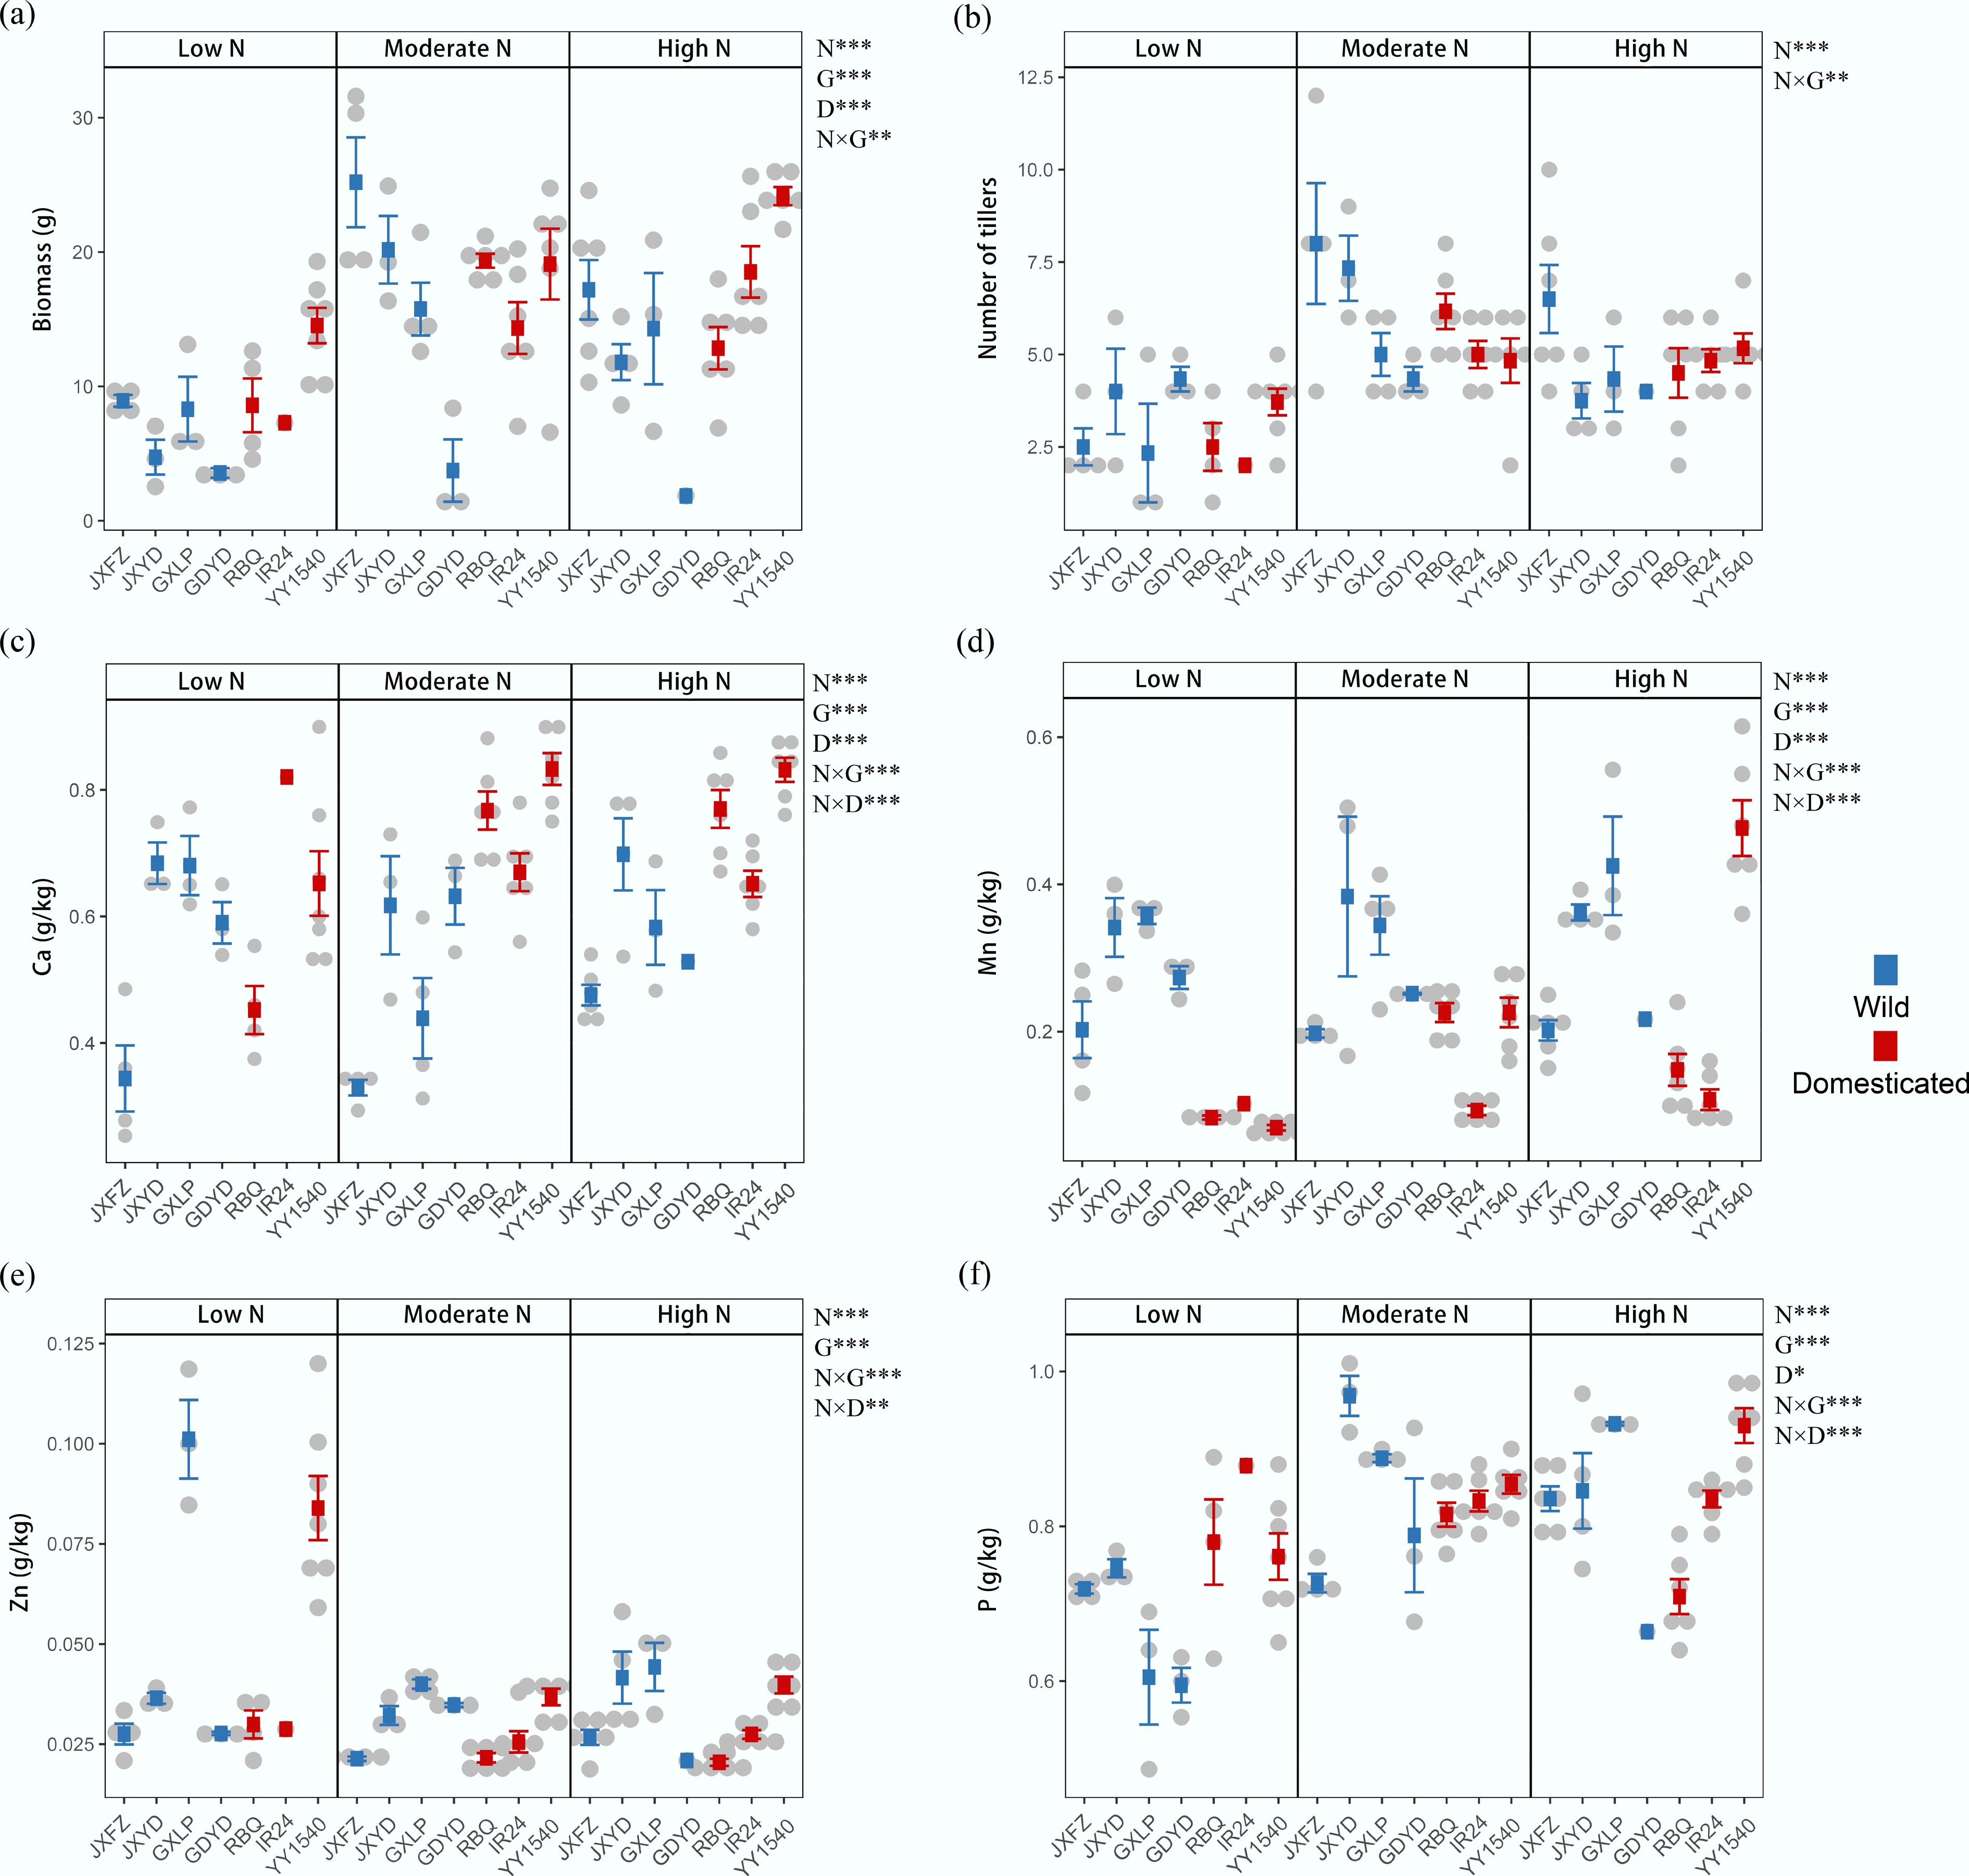
Figure 4.
Effects of nitrogen addition (N), domestication status (D), and identity of rice genotypes (G) on rice functional traits. (a) Aboveground biomass. (b) Tiller number. Leaf concentrations of mineral elements: (c) calcium (Ca), (d) manganese (Mn), (e) zinc (Zn), and (f) phosphorus (P). Data are presented as mean ± SD. PERMANOVA results reveal significant differences between treatment groups; * p < 0.05; ** p < 0.01; and *** p < 0.001.
Figures
(4)
Tables
(0)