-
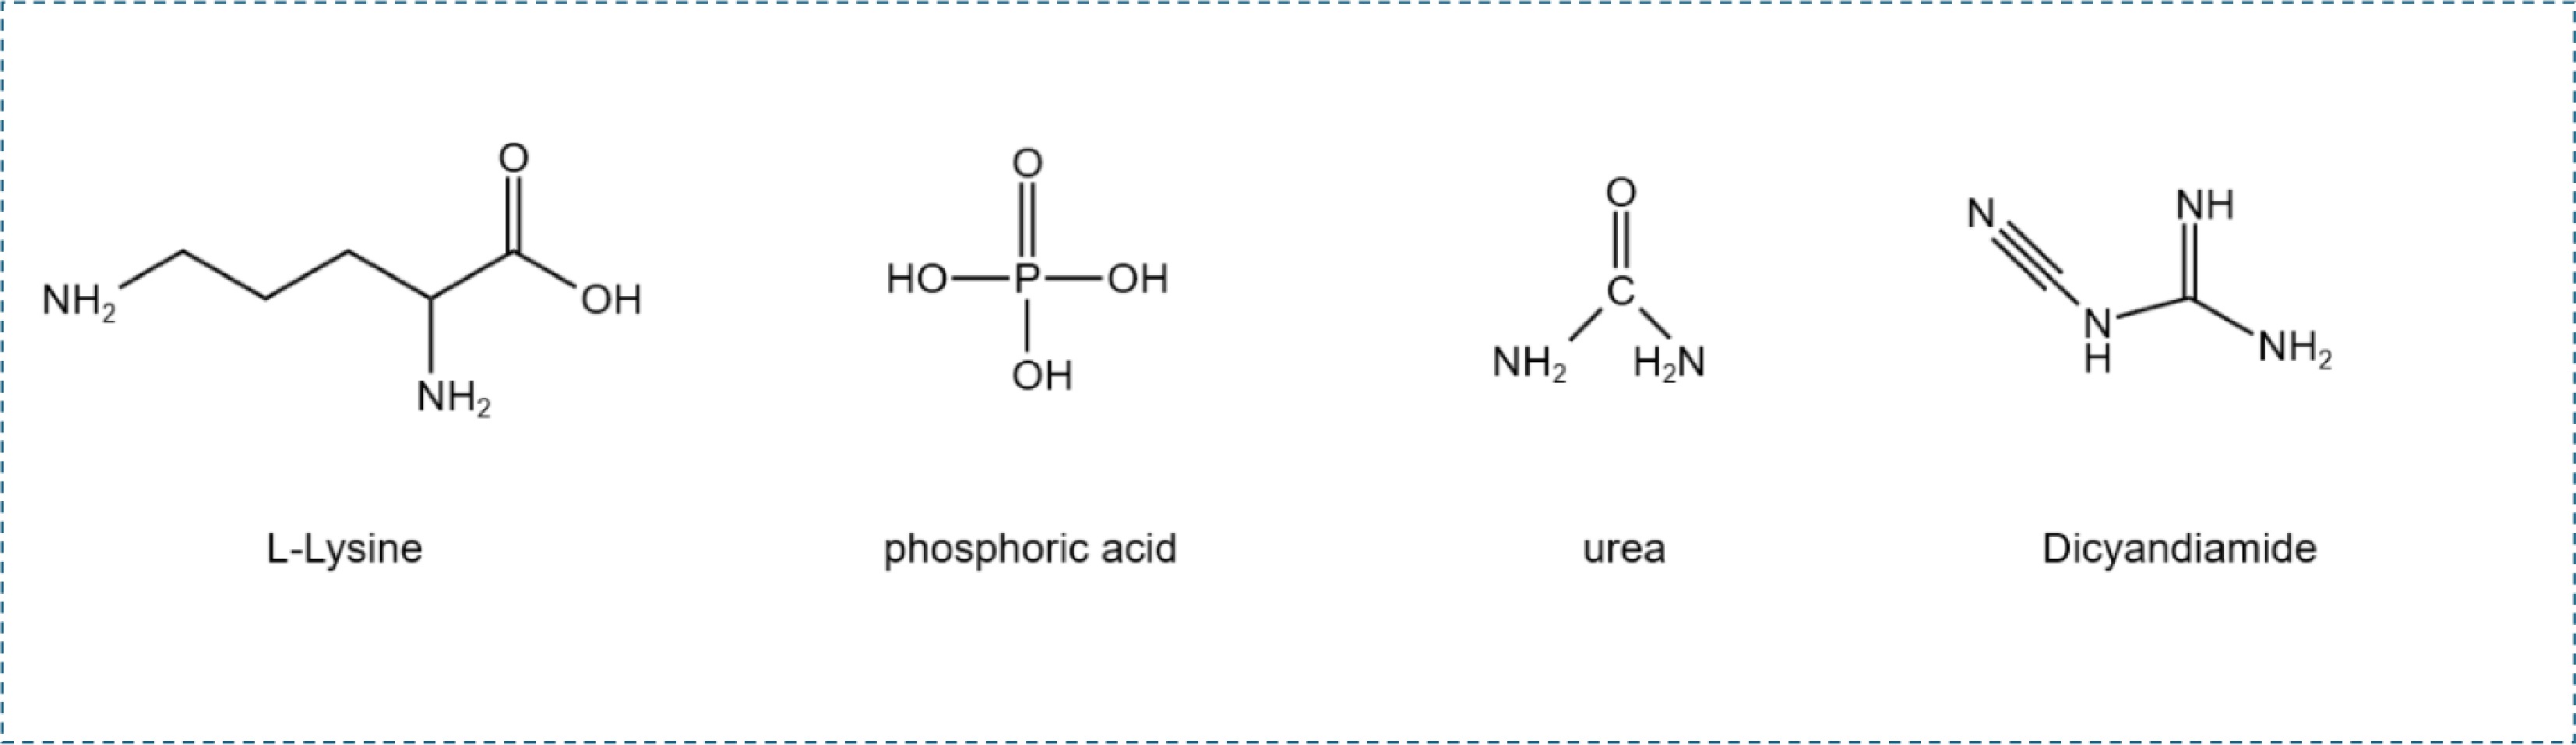
Figure 1.
Chemical structural formulas of L-lysine, phosphoric acid, urea, and dicyandiamide.
-
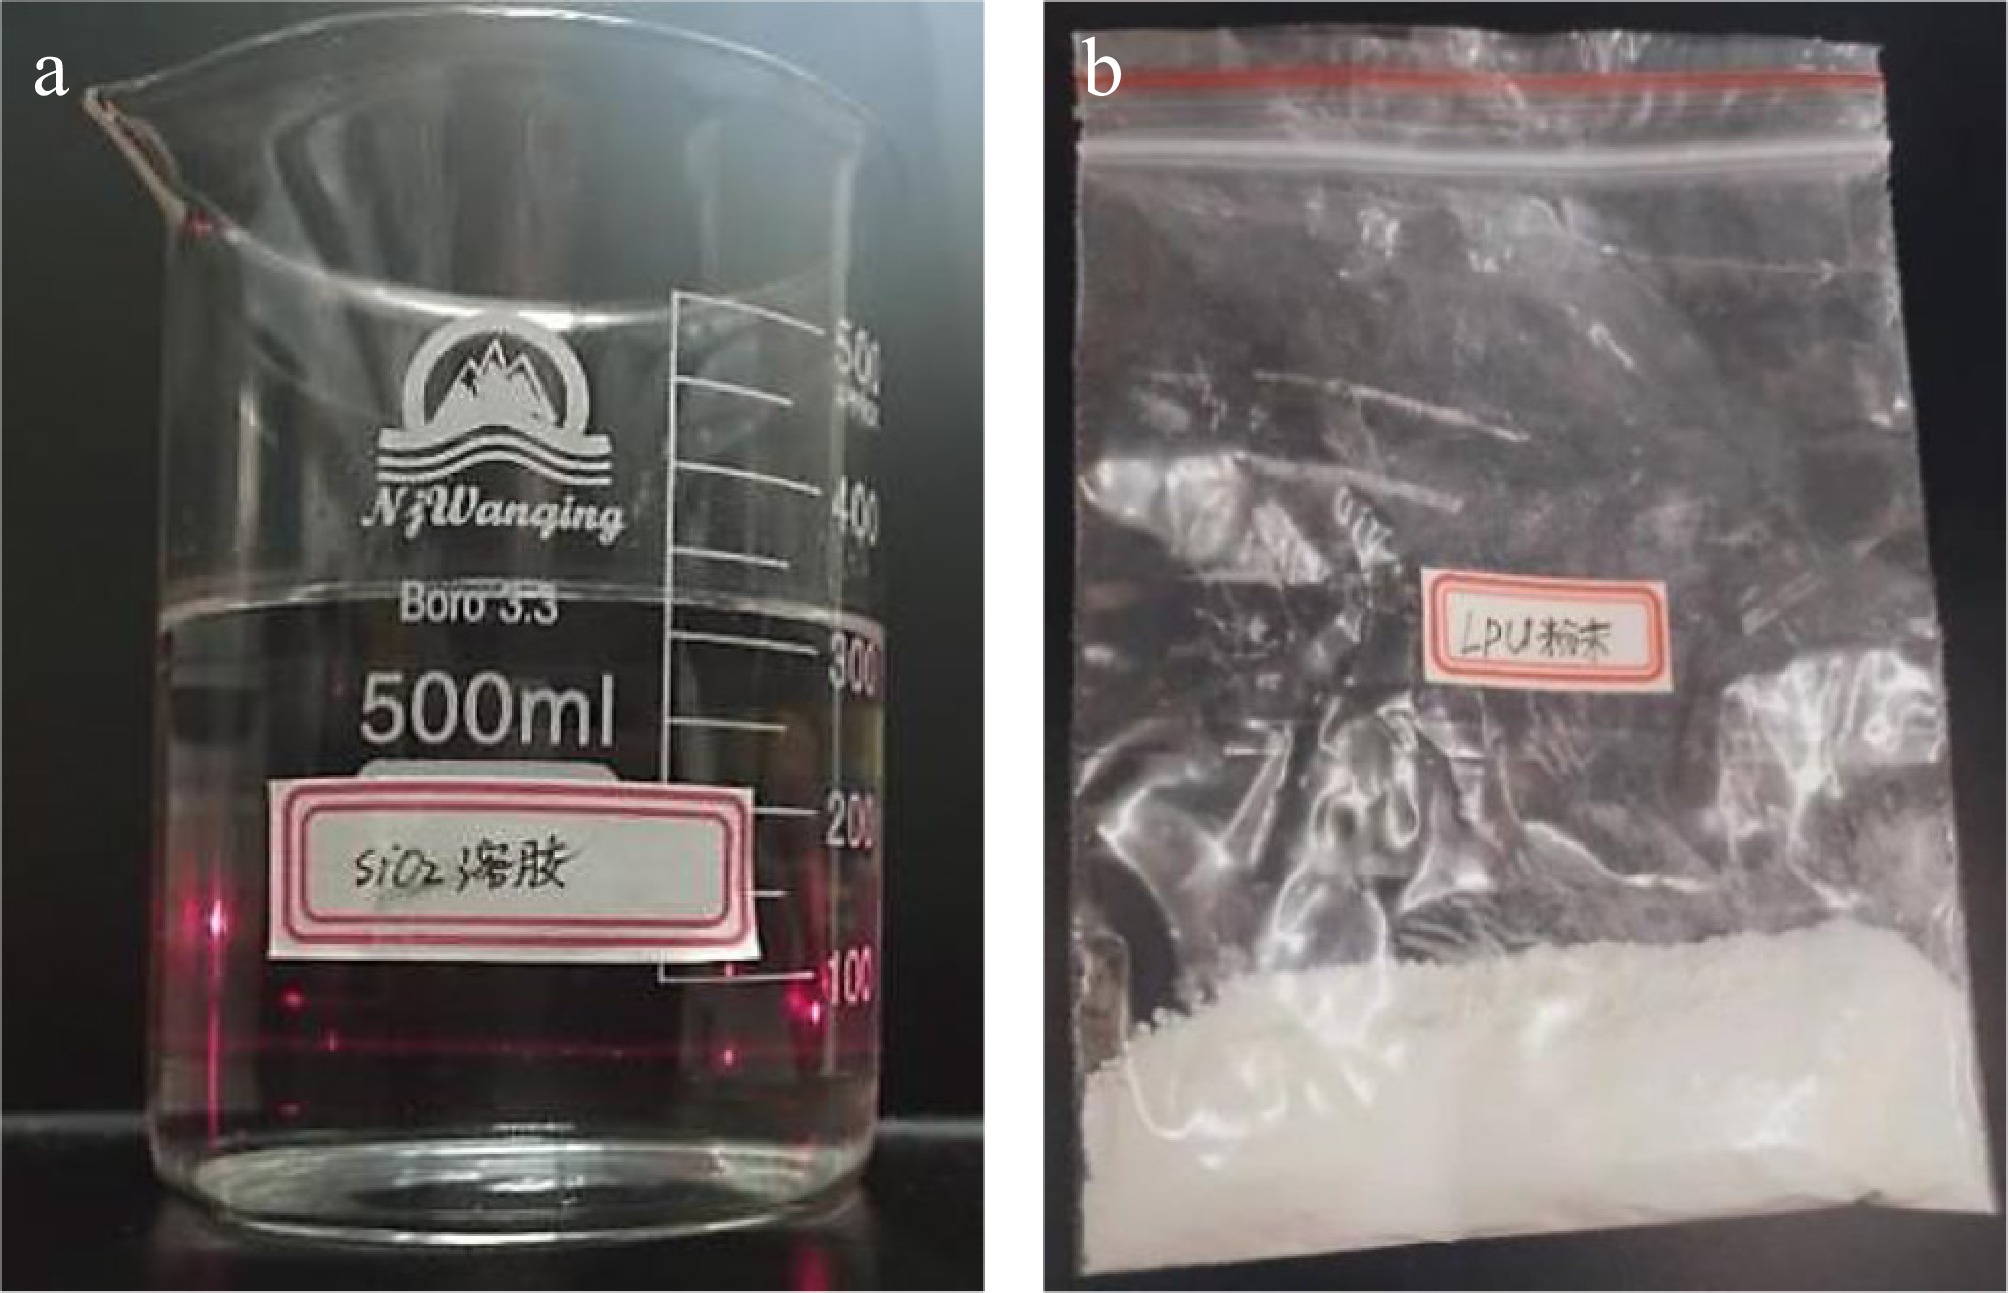
Figure 2.
(a) LPU flame retardant powder creation. (b) Flame retardant LPU powder.
-
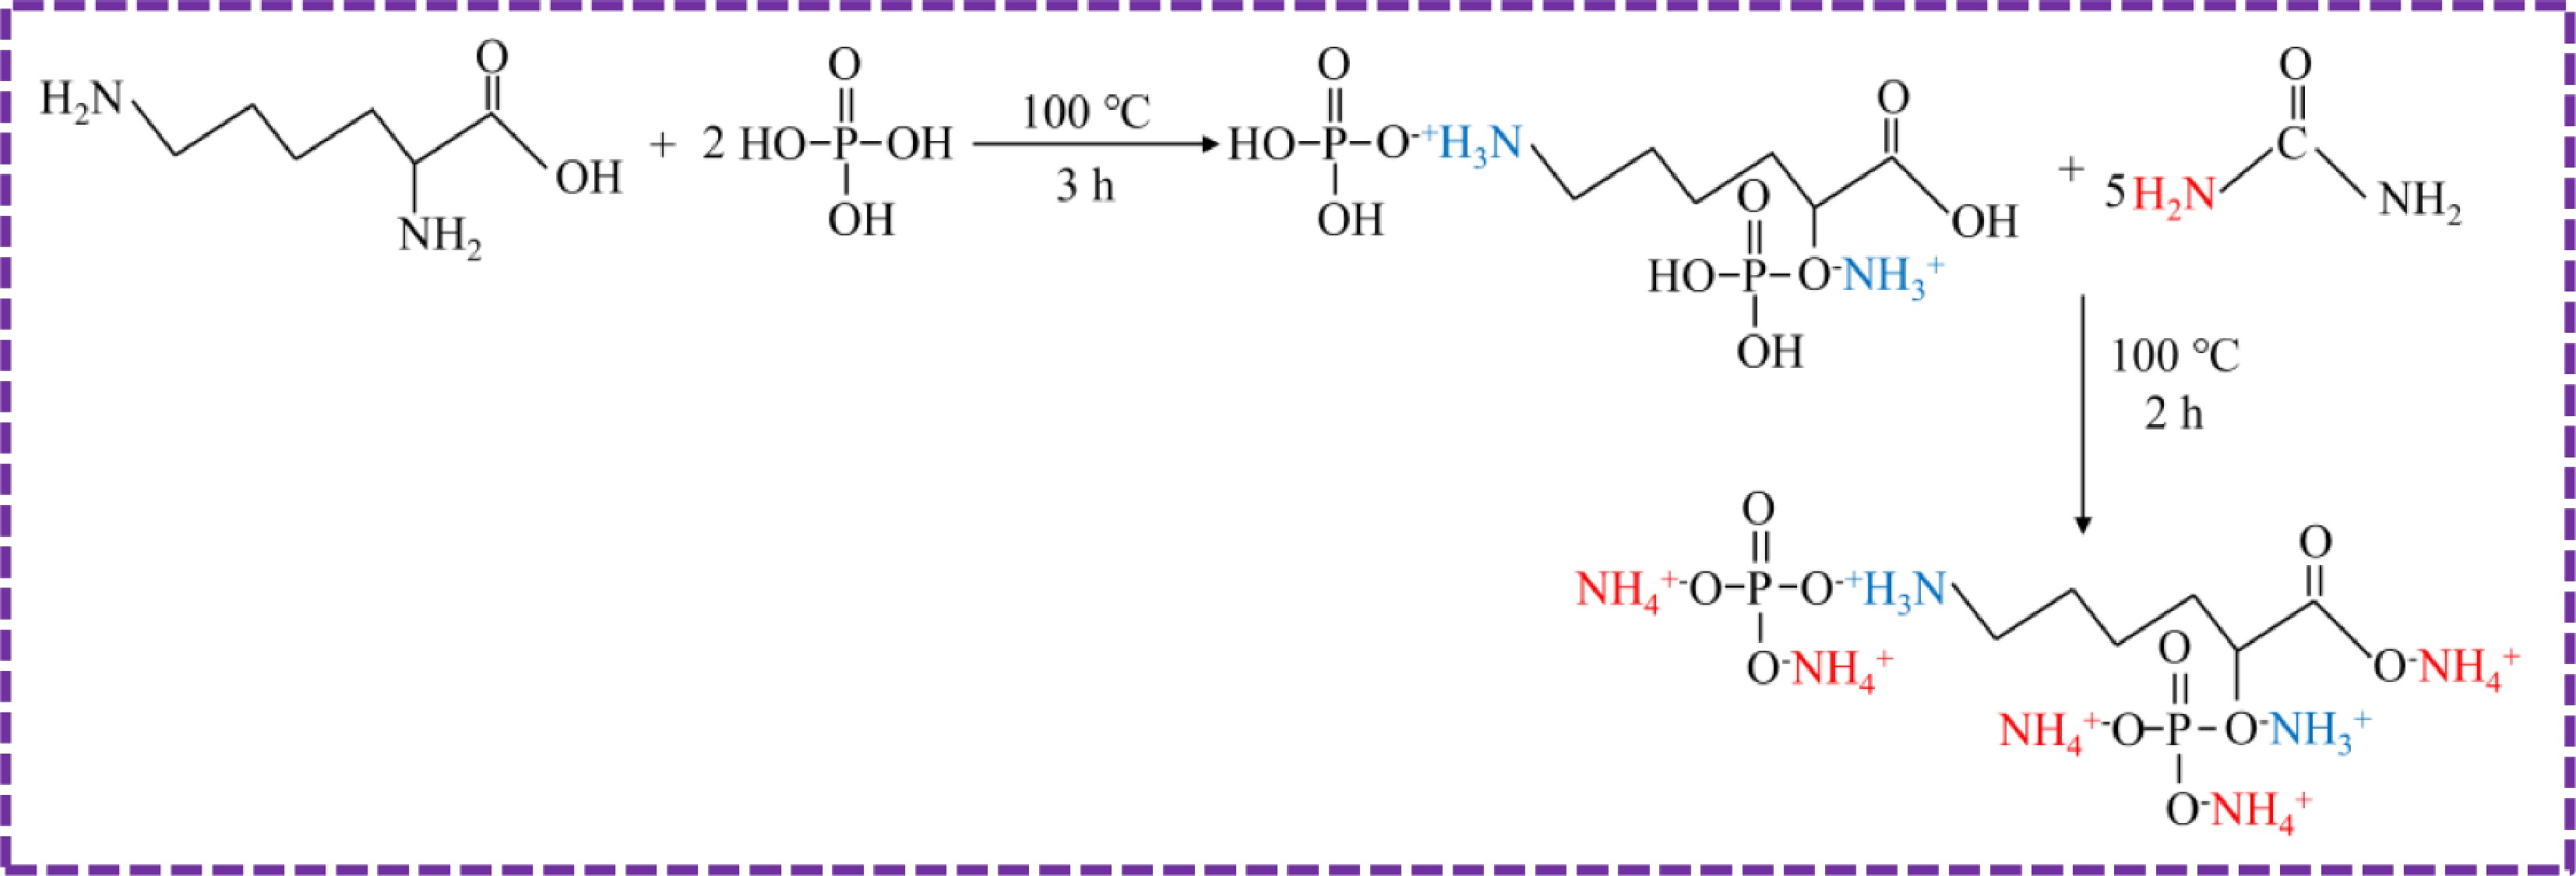
Figure 3.
Reaction equation of the flame retardant LPU.
-
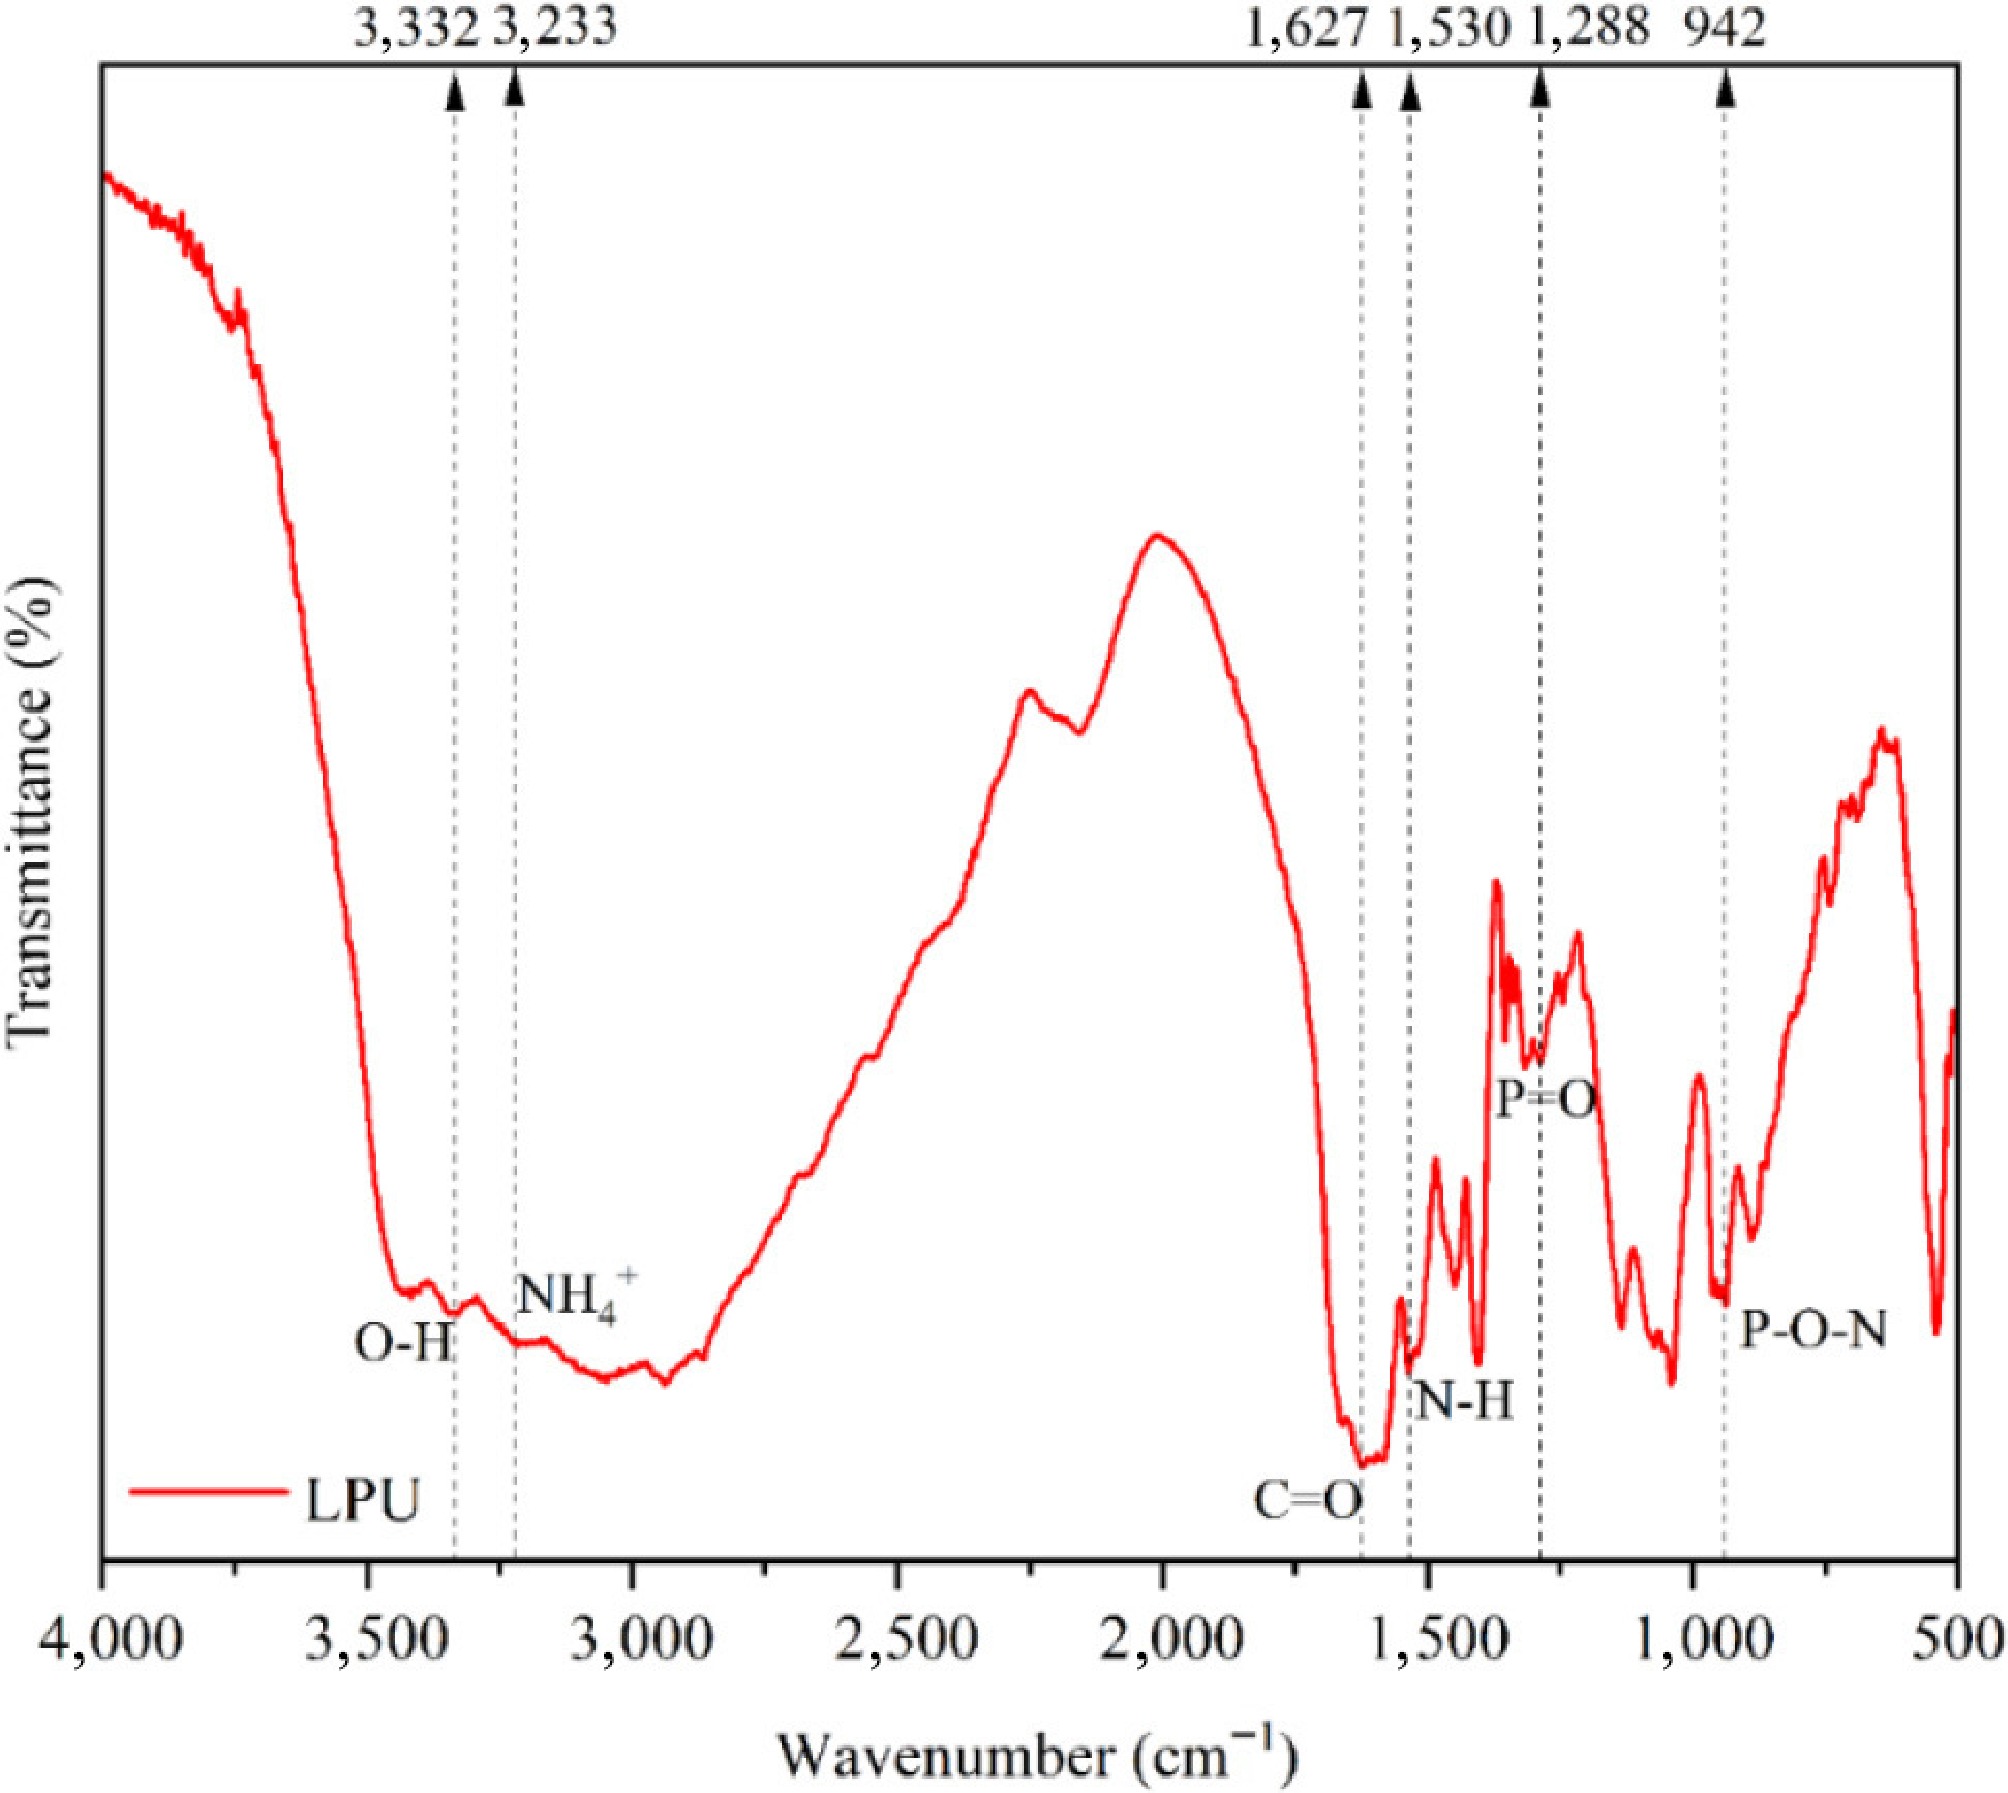
Figure 4.
FTIR spectra of the flame retardant LPU.
-
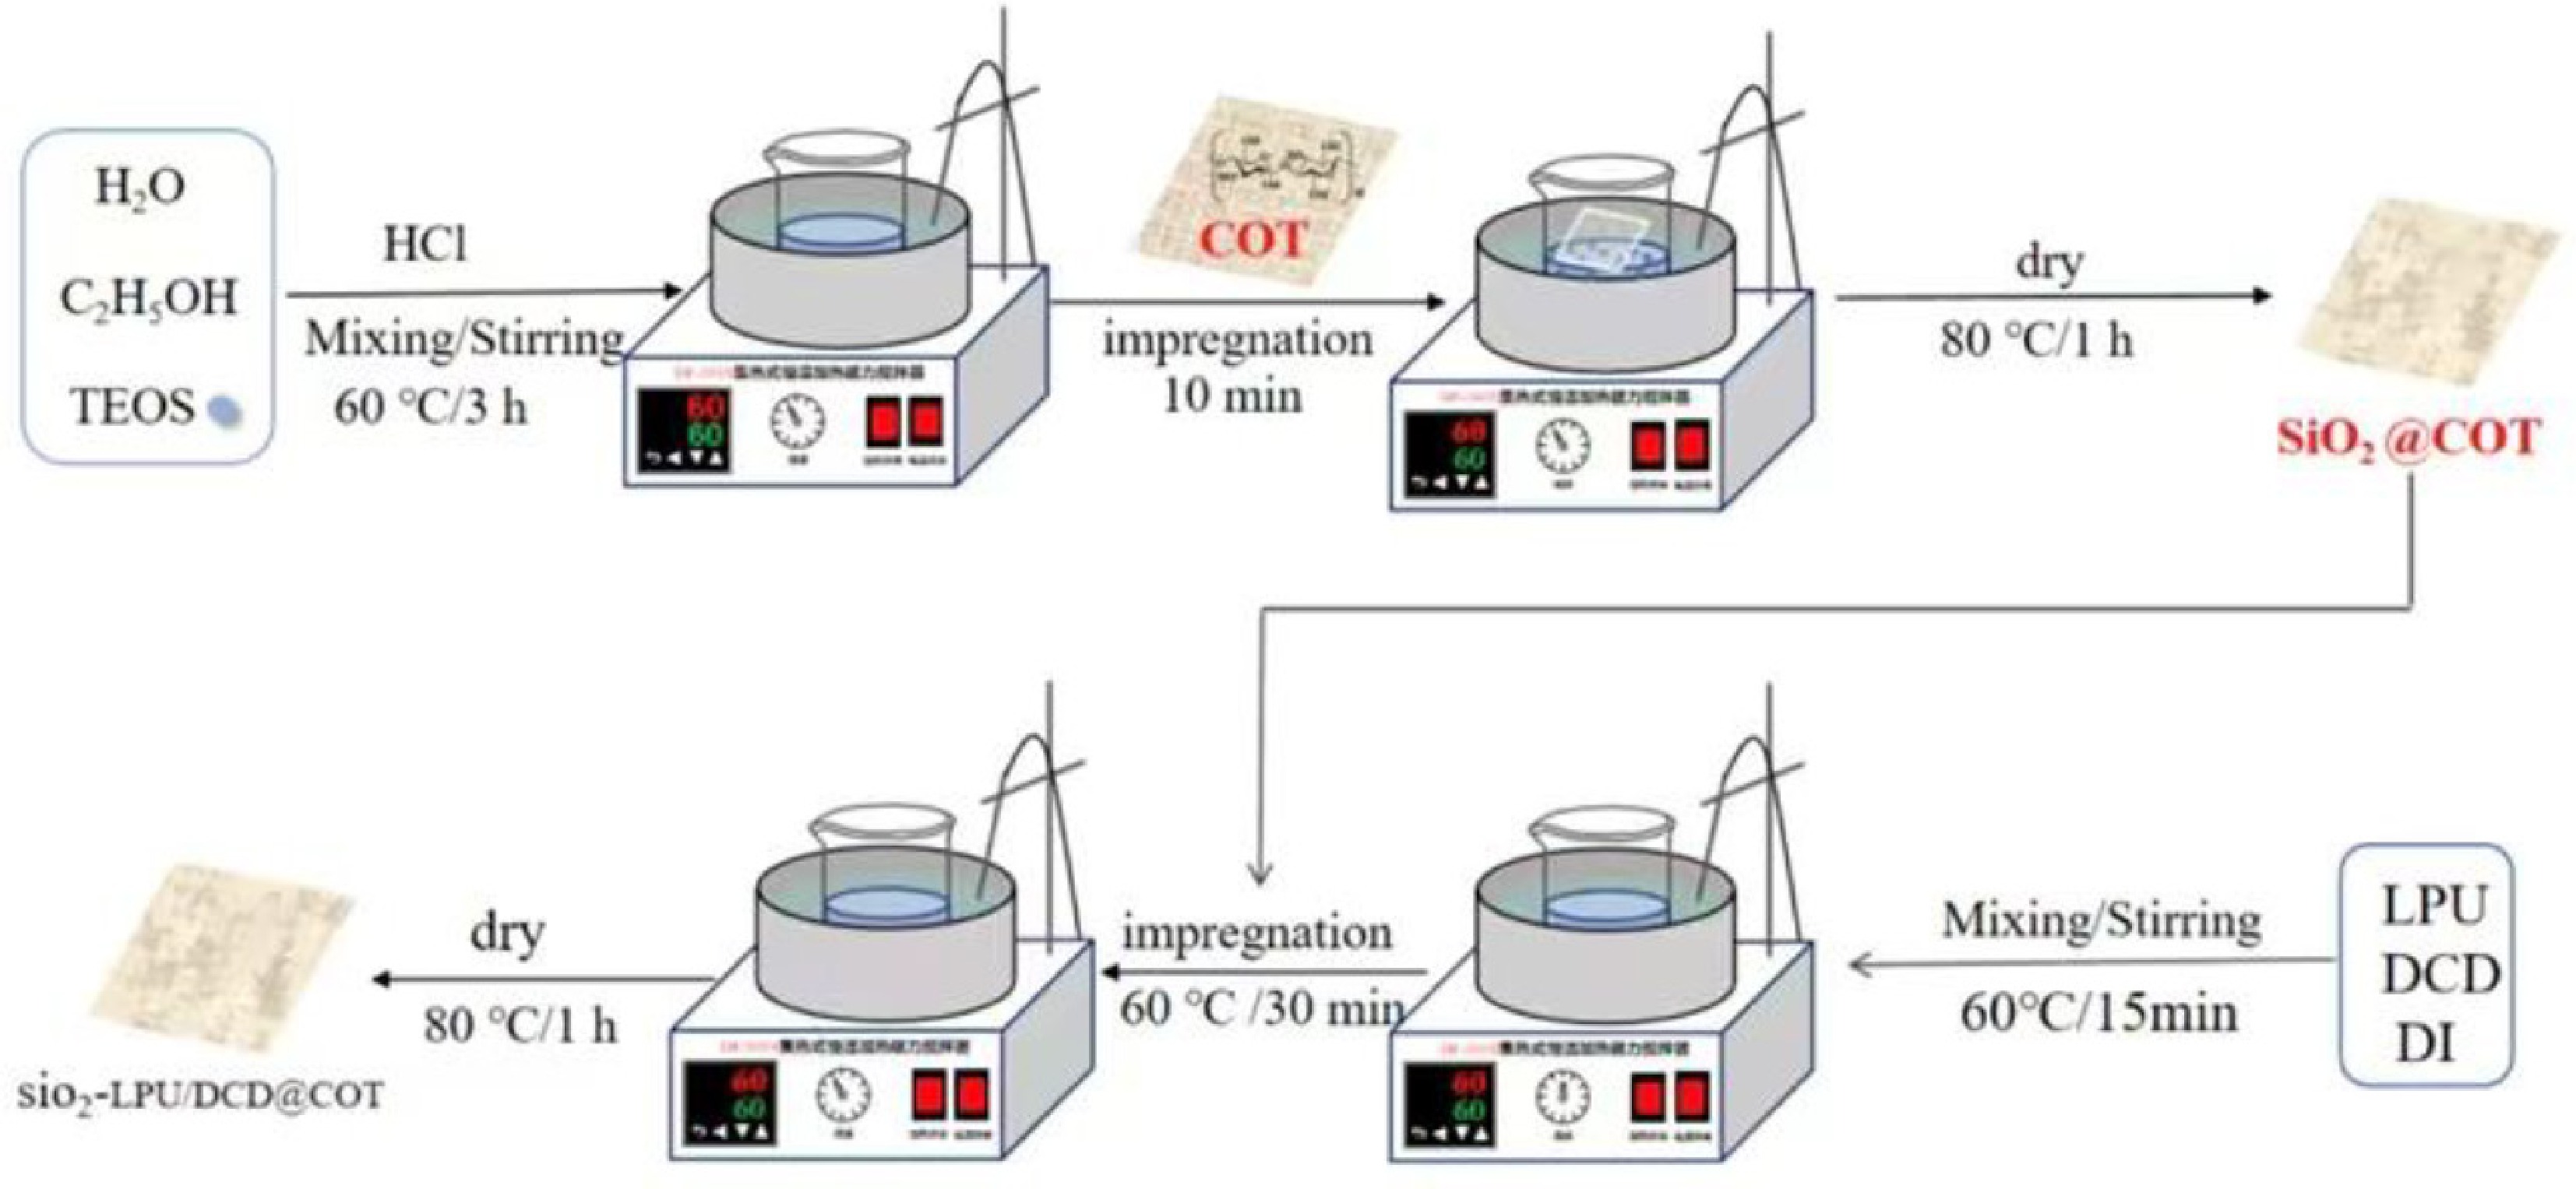
Figure 5.
Process diagram of cotton fabric treated with SiO2-LPU/DCD solution.
-
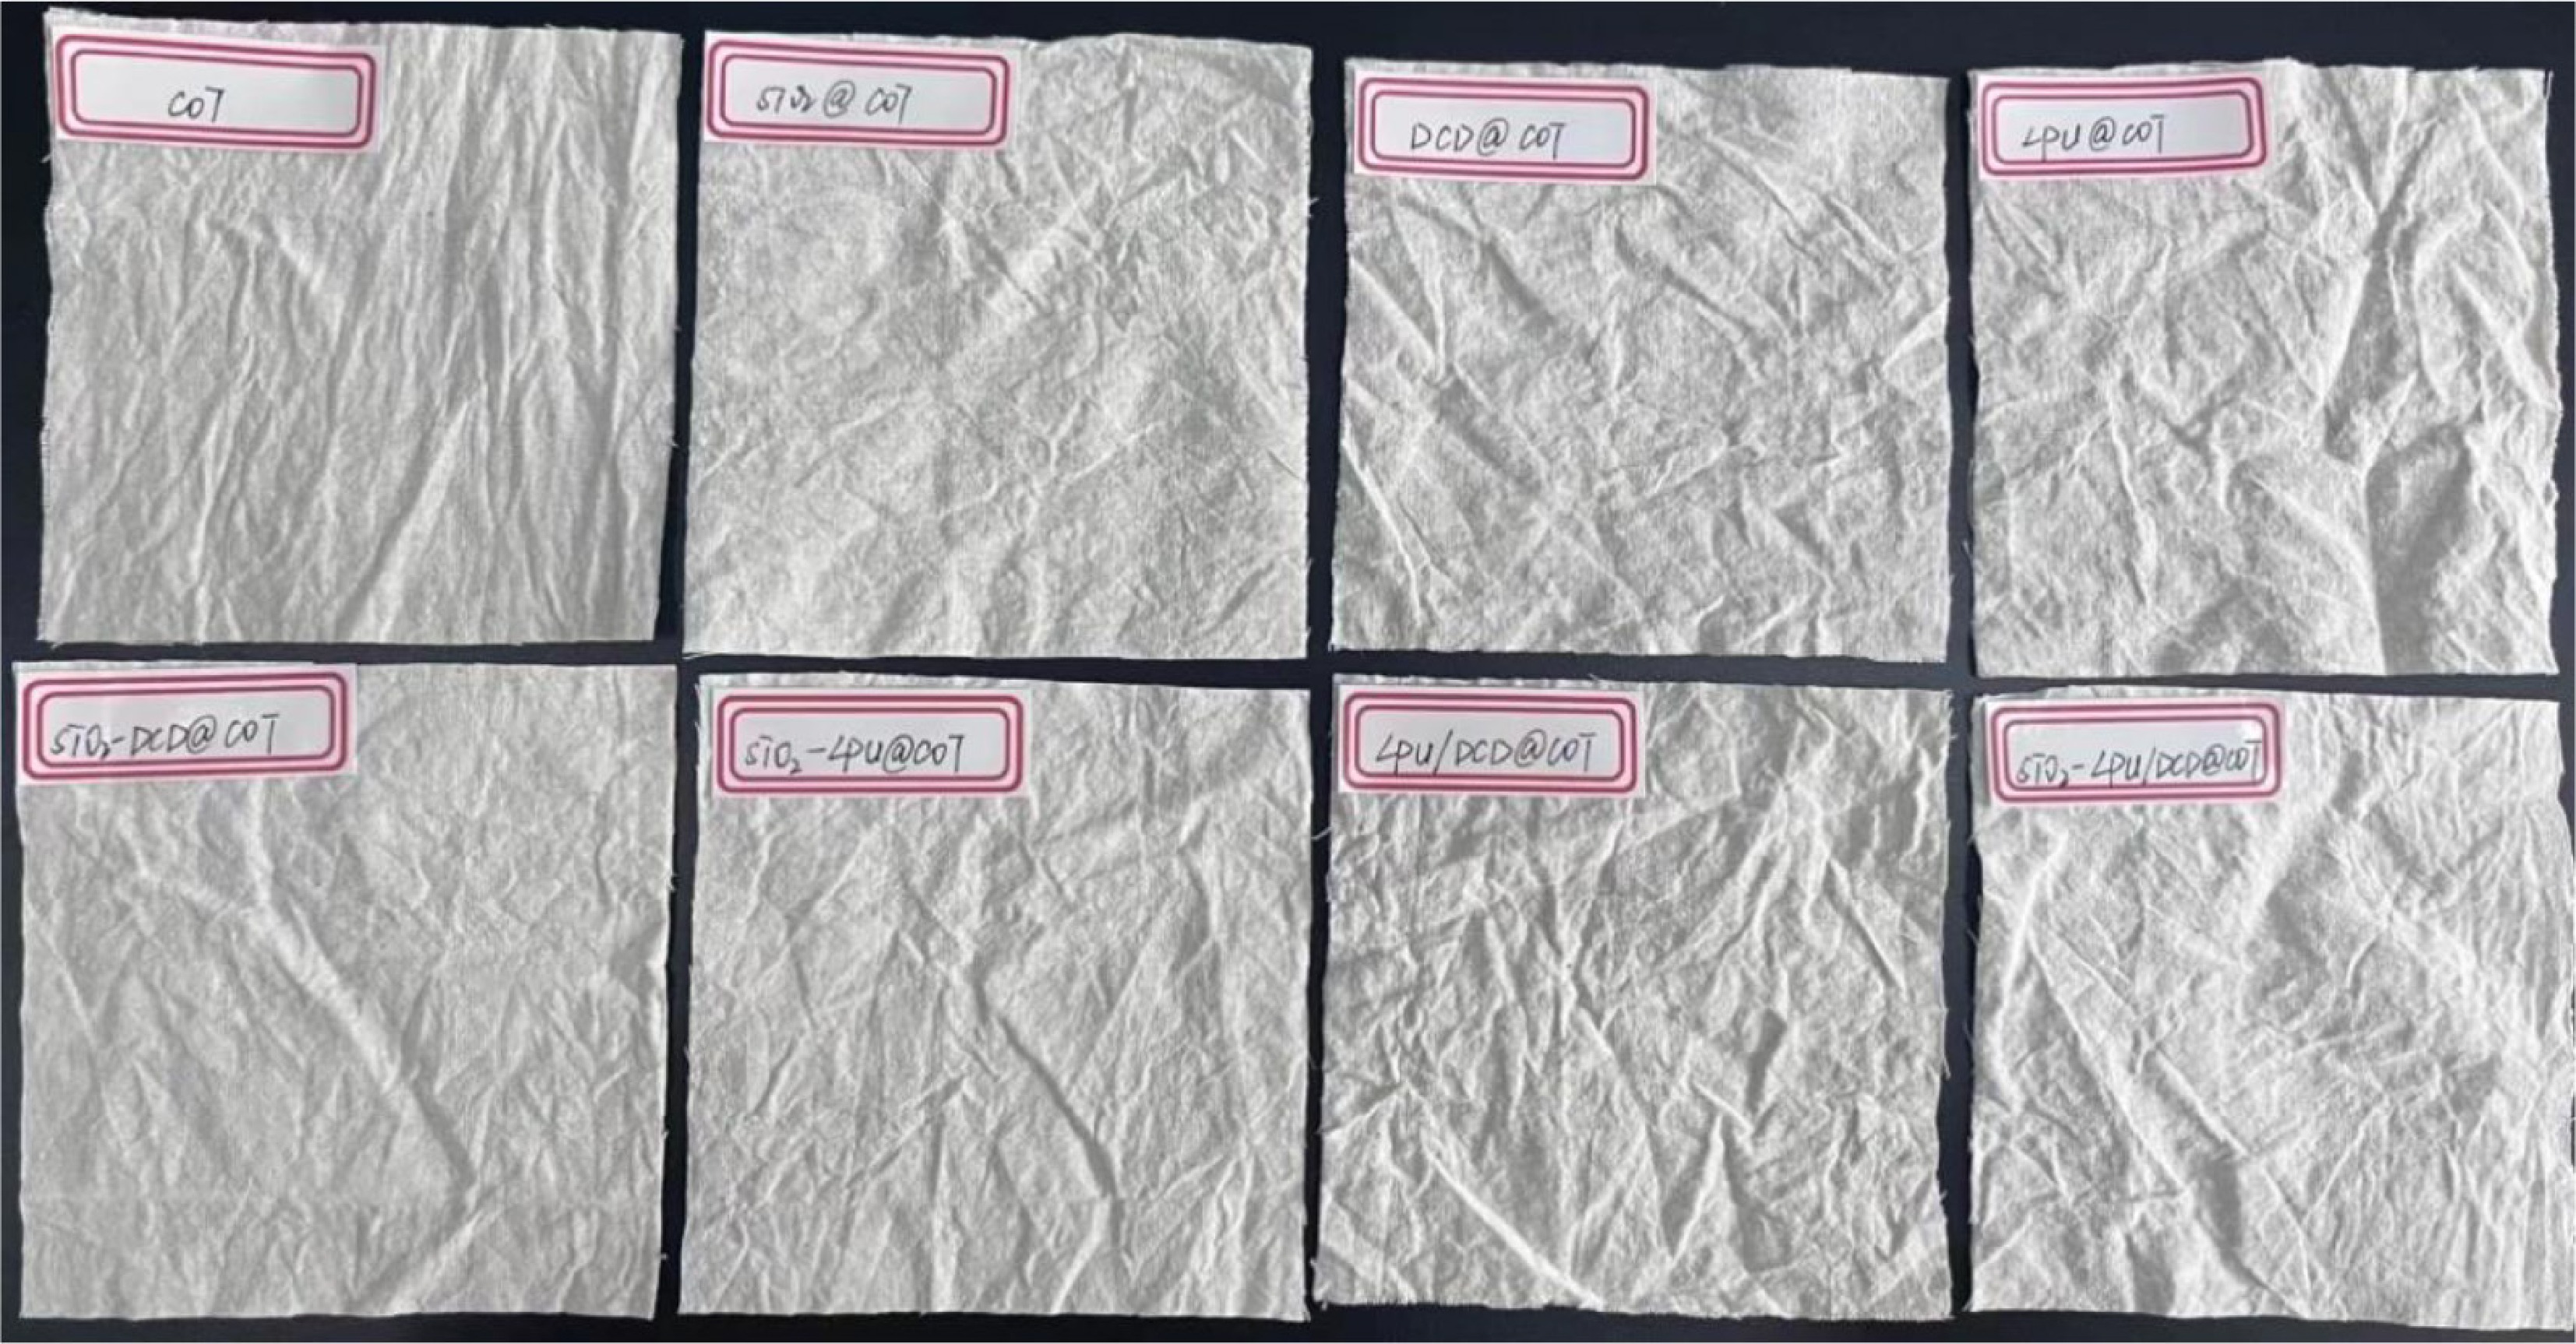
Figure 6.
Appearance of cotton fabric before and after flame retardant finishing.
-
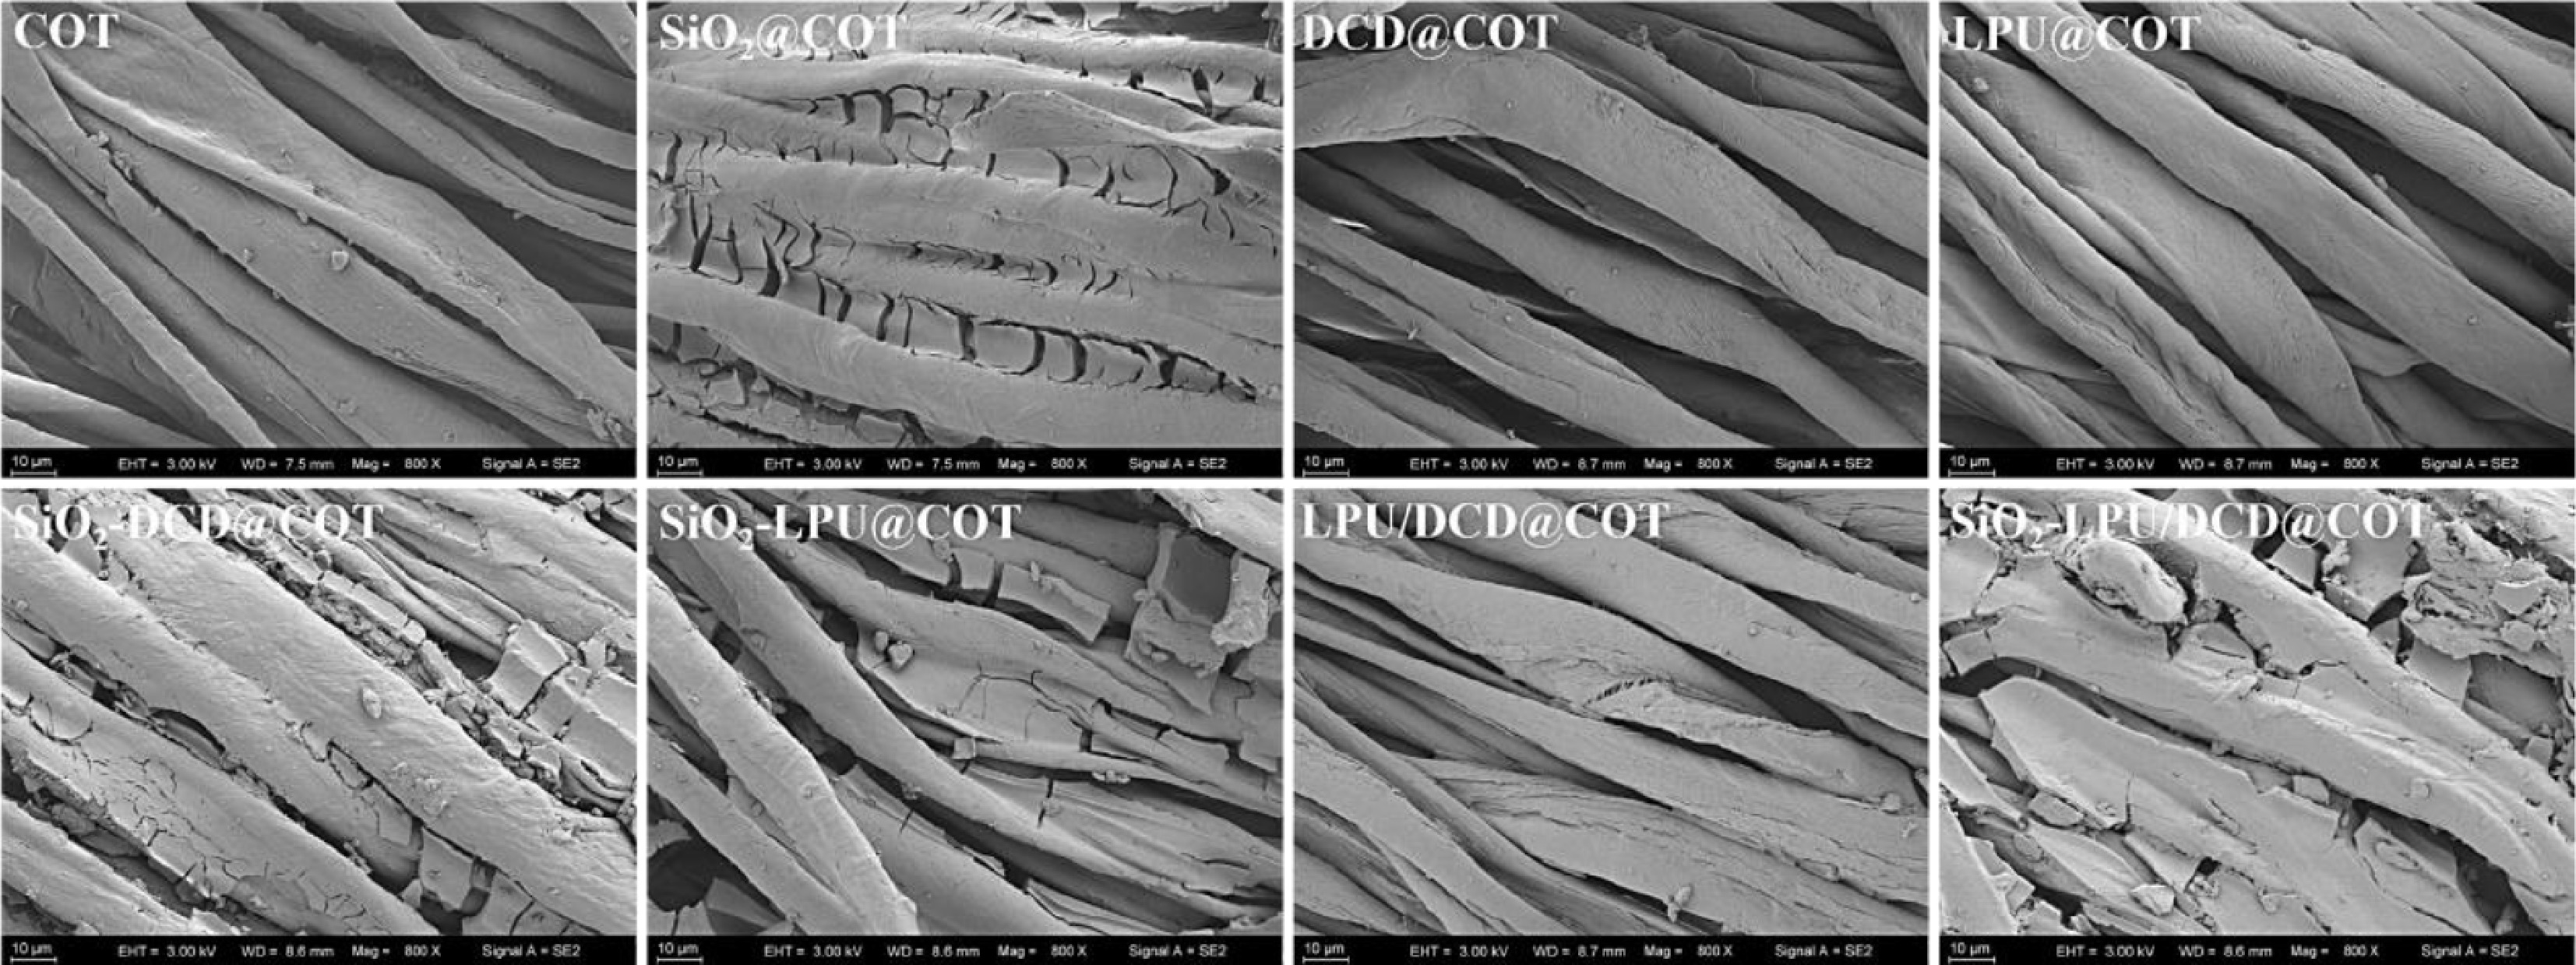
Figure 7.
SEM images of cotton fabrics after original and flame retardant finishing.
-
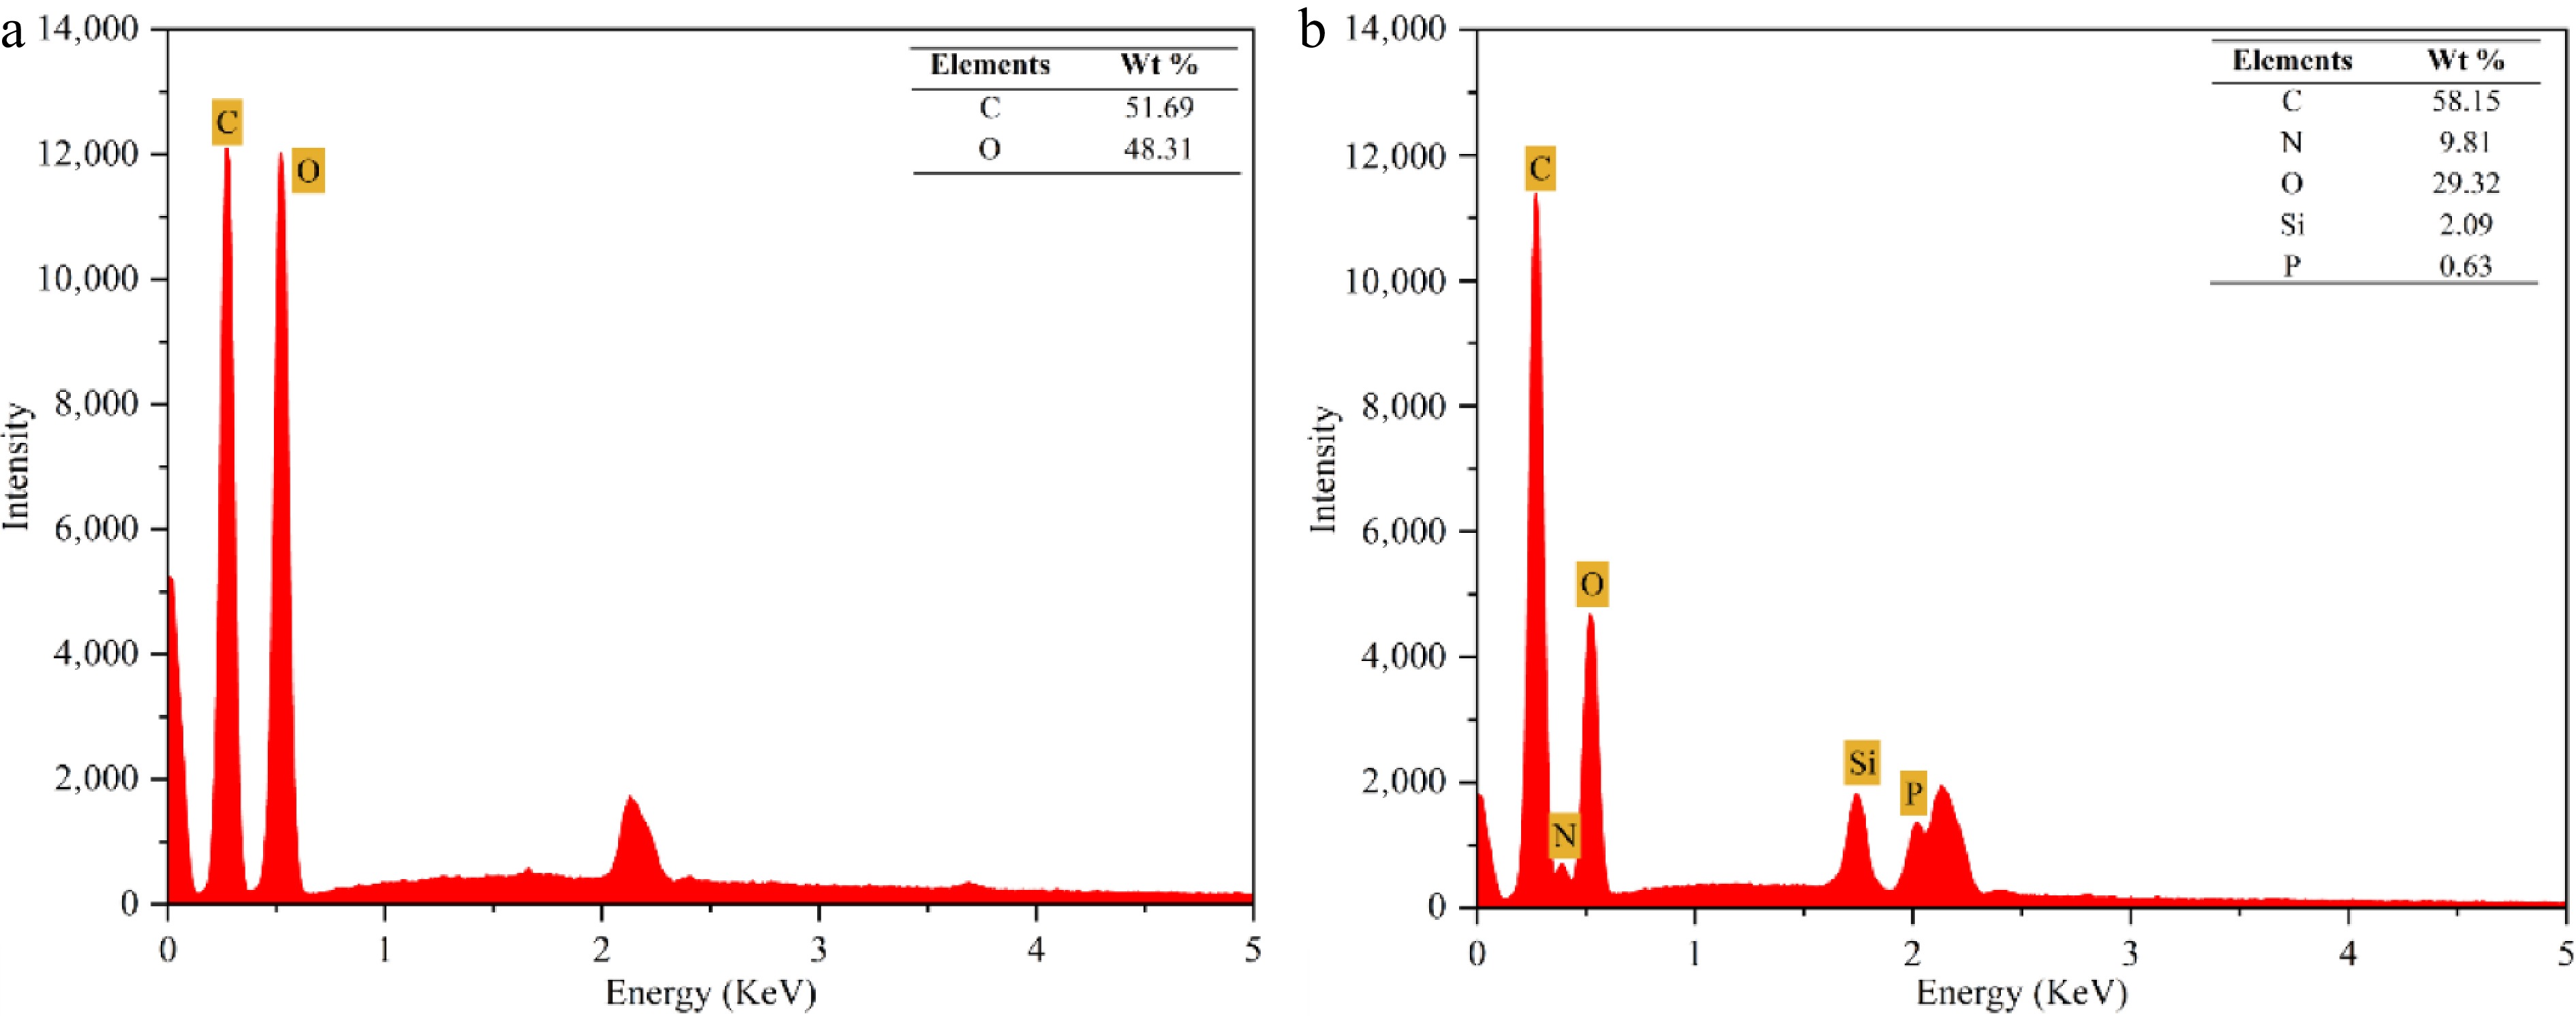
Figure 8.
EDX images of (a) COT, and (b) SiO2-LPU/DCD@COT.
-
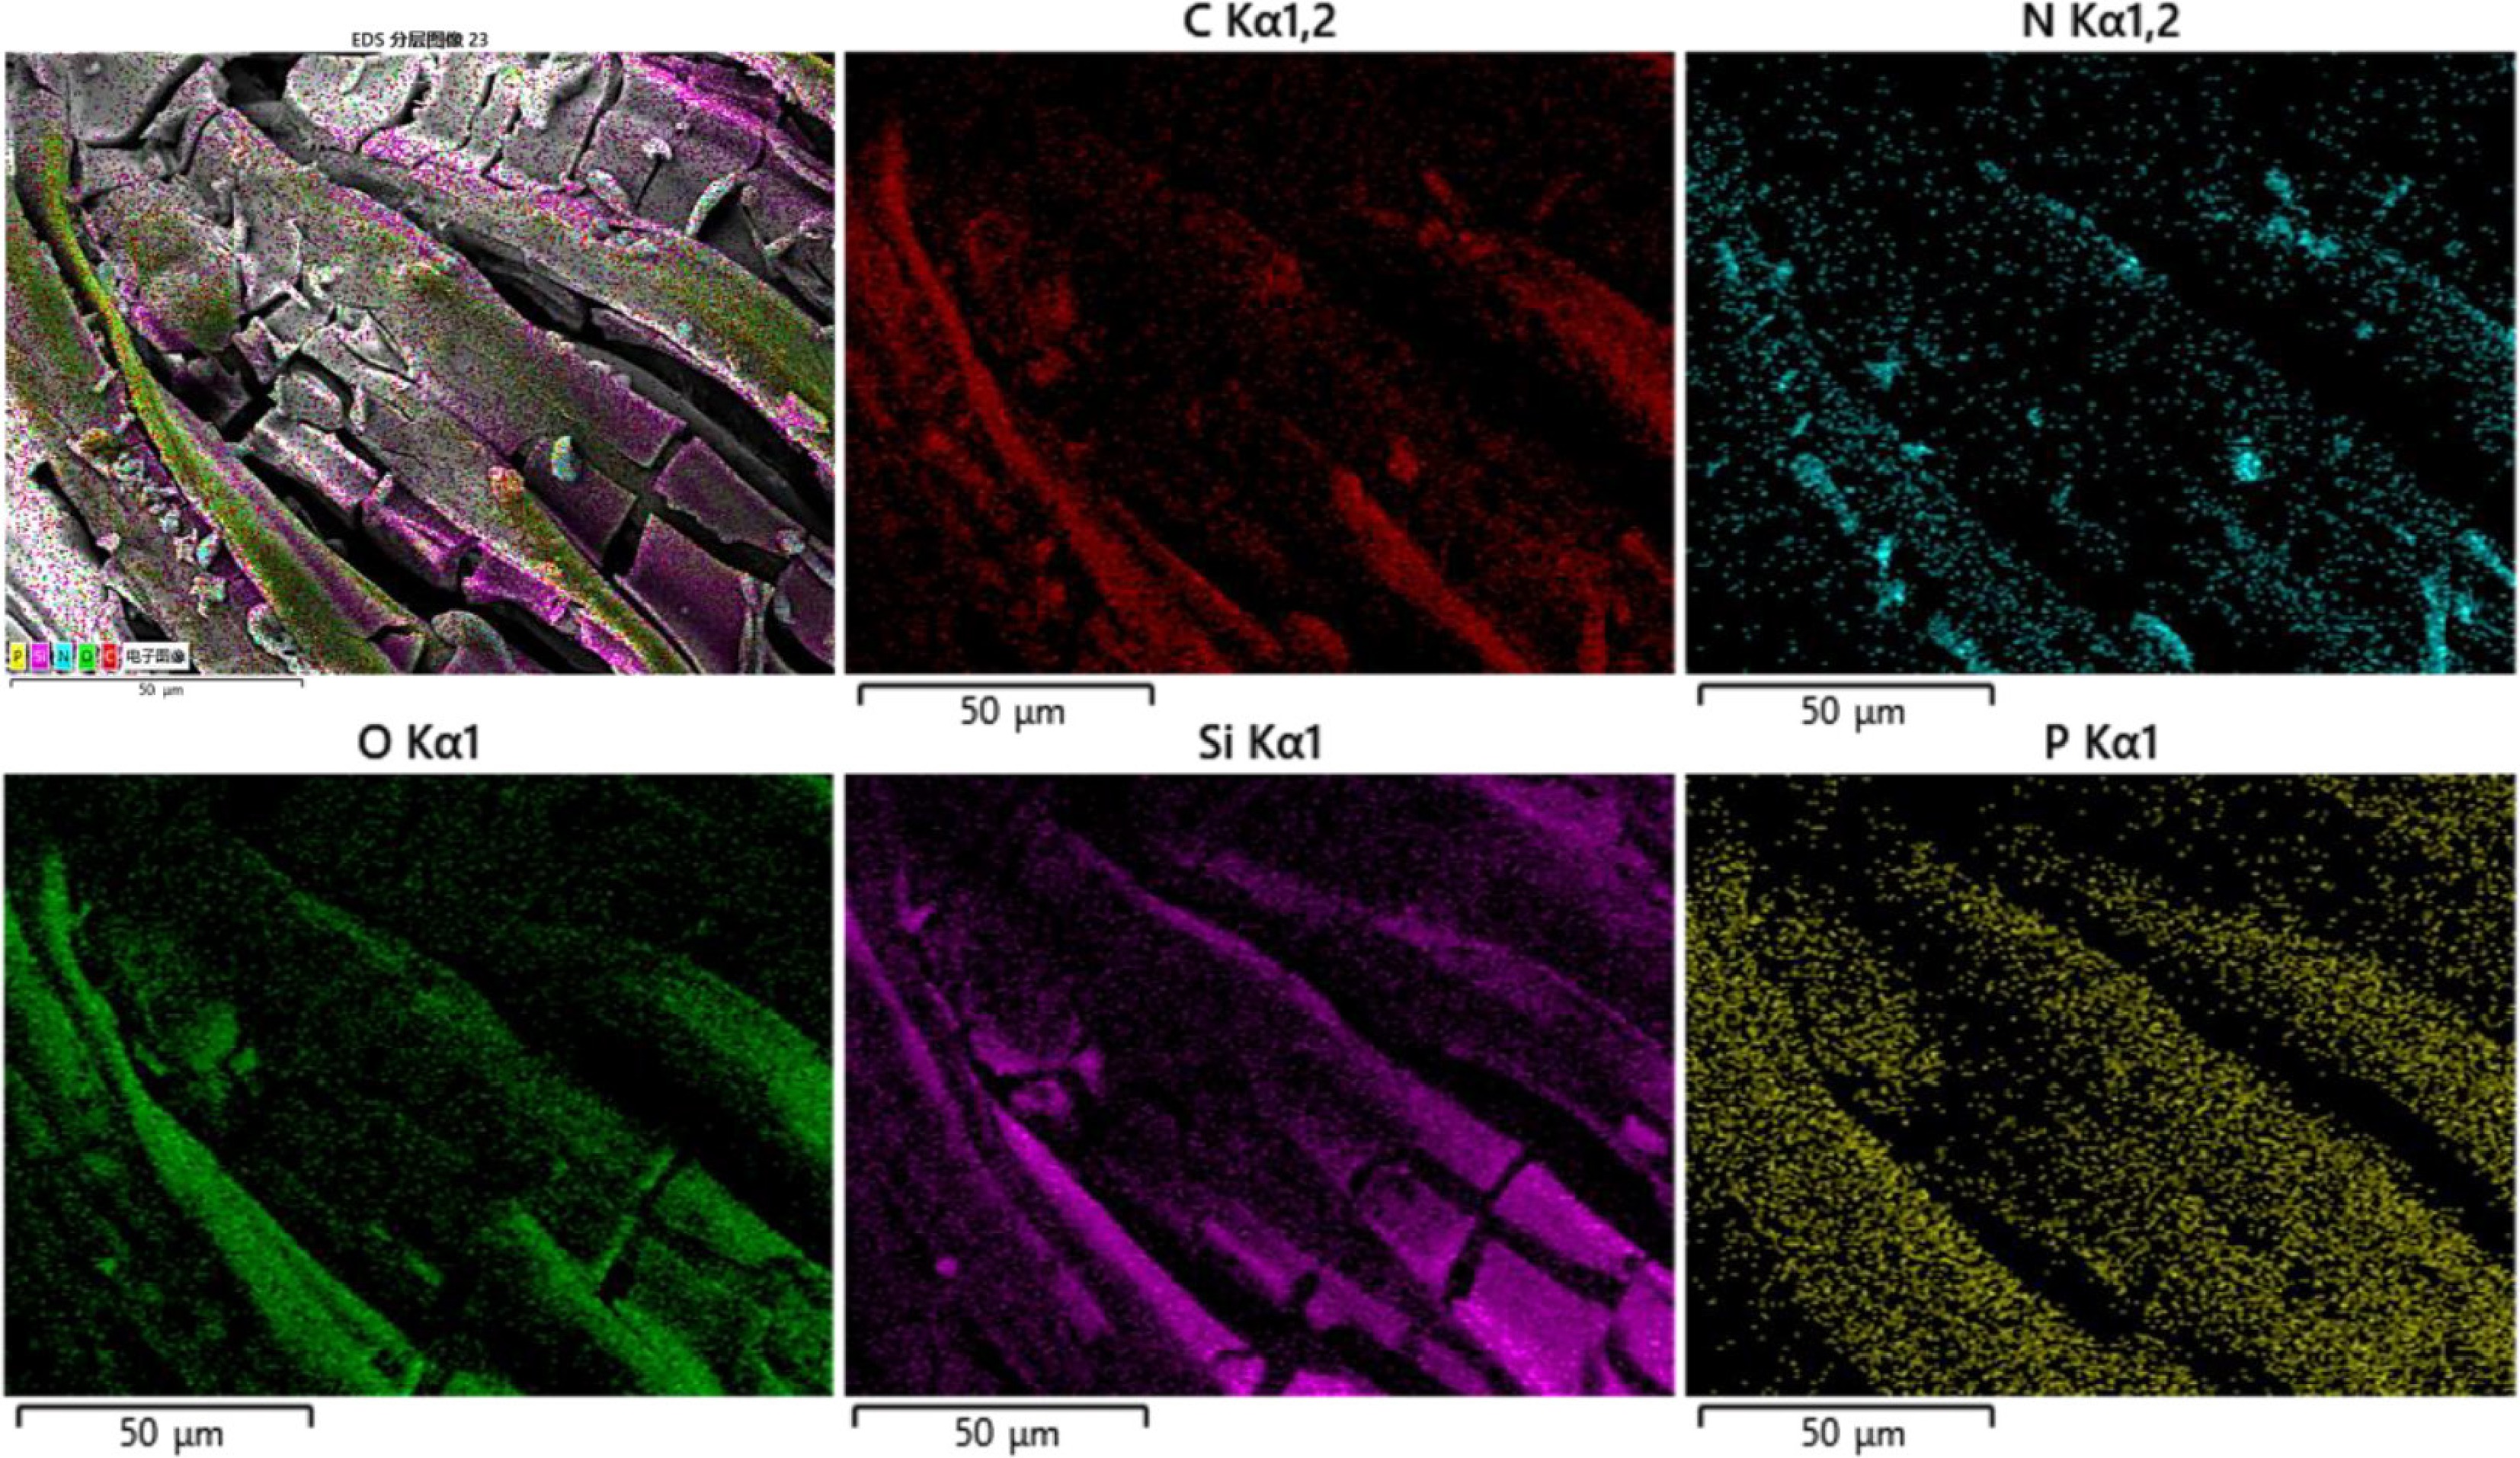
Figure 9.
Element point scan of SiO2-LPU/DCD@COT.
-
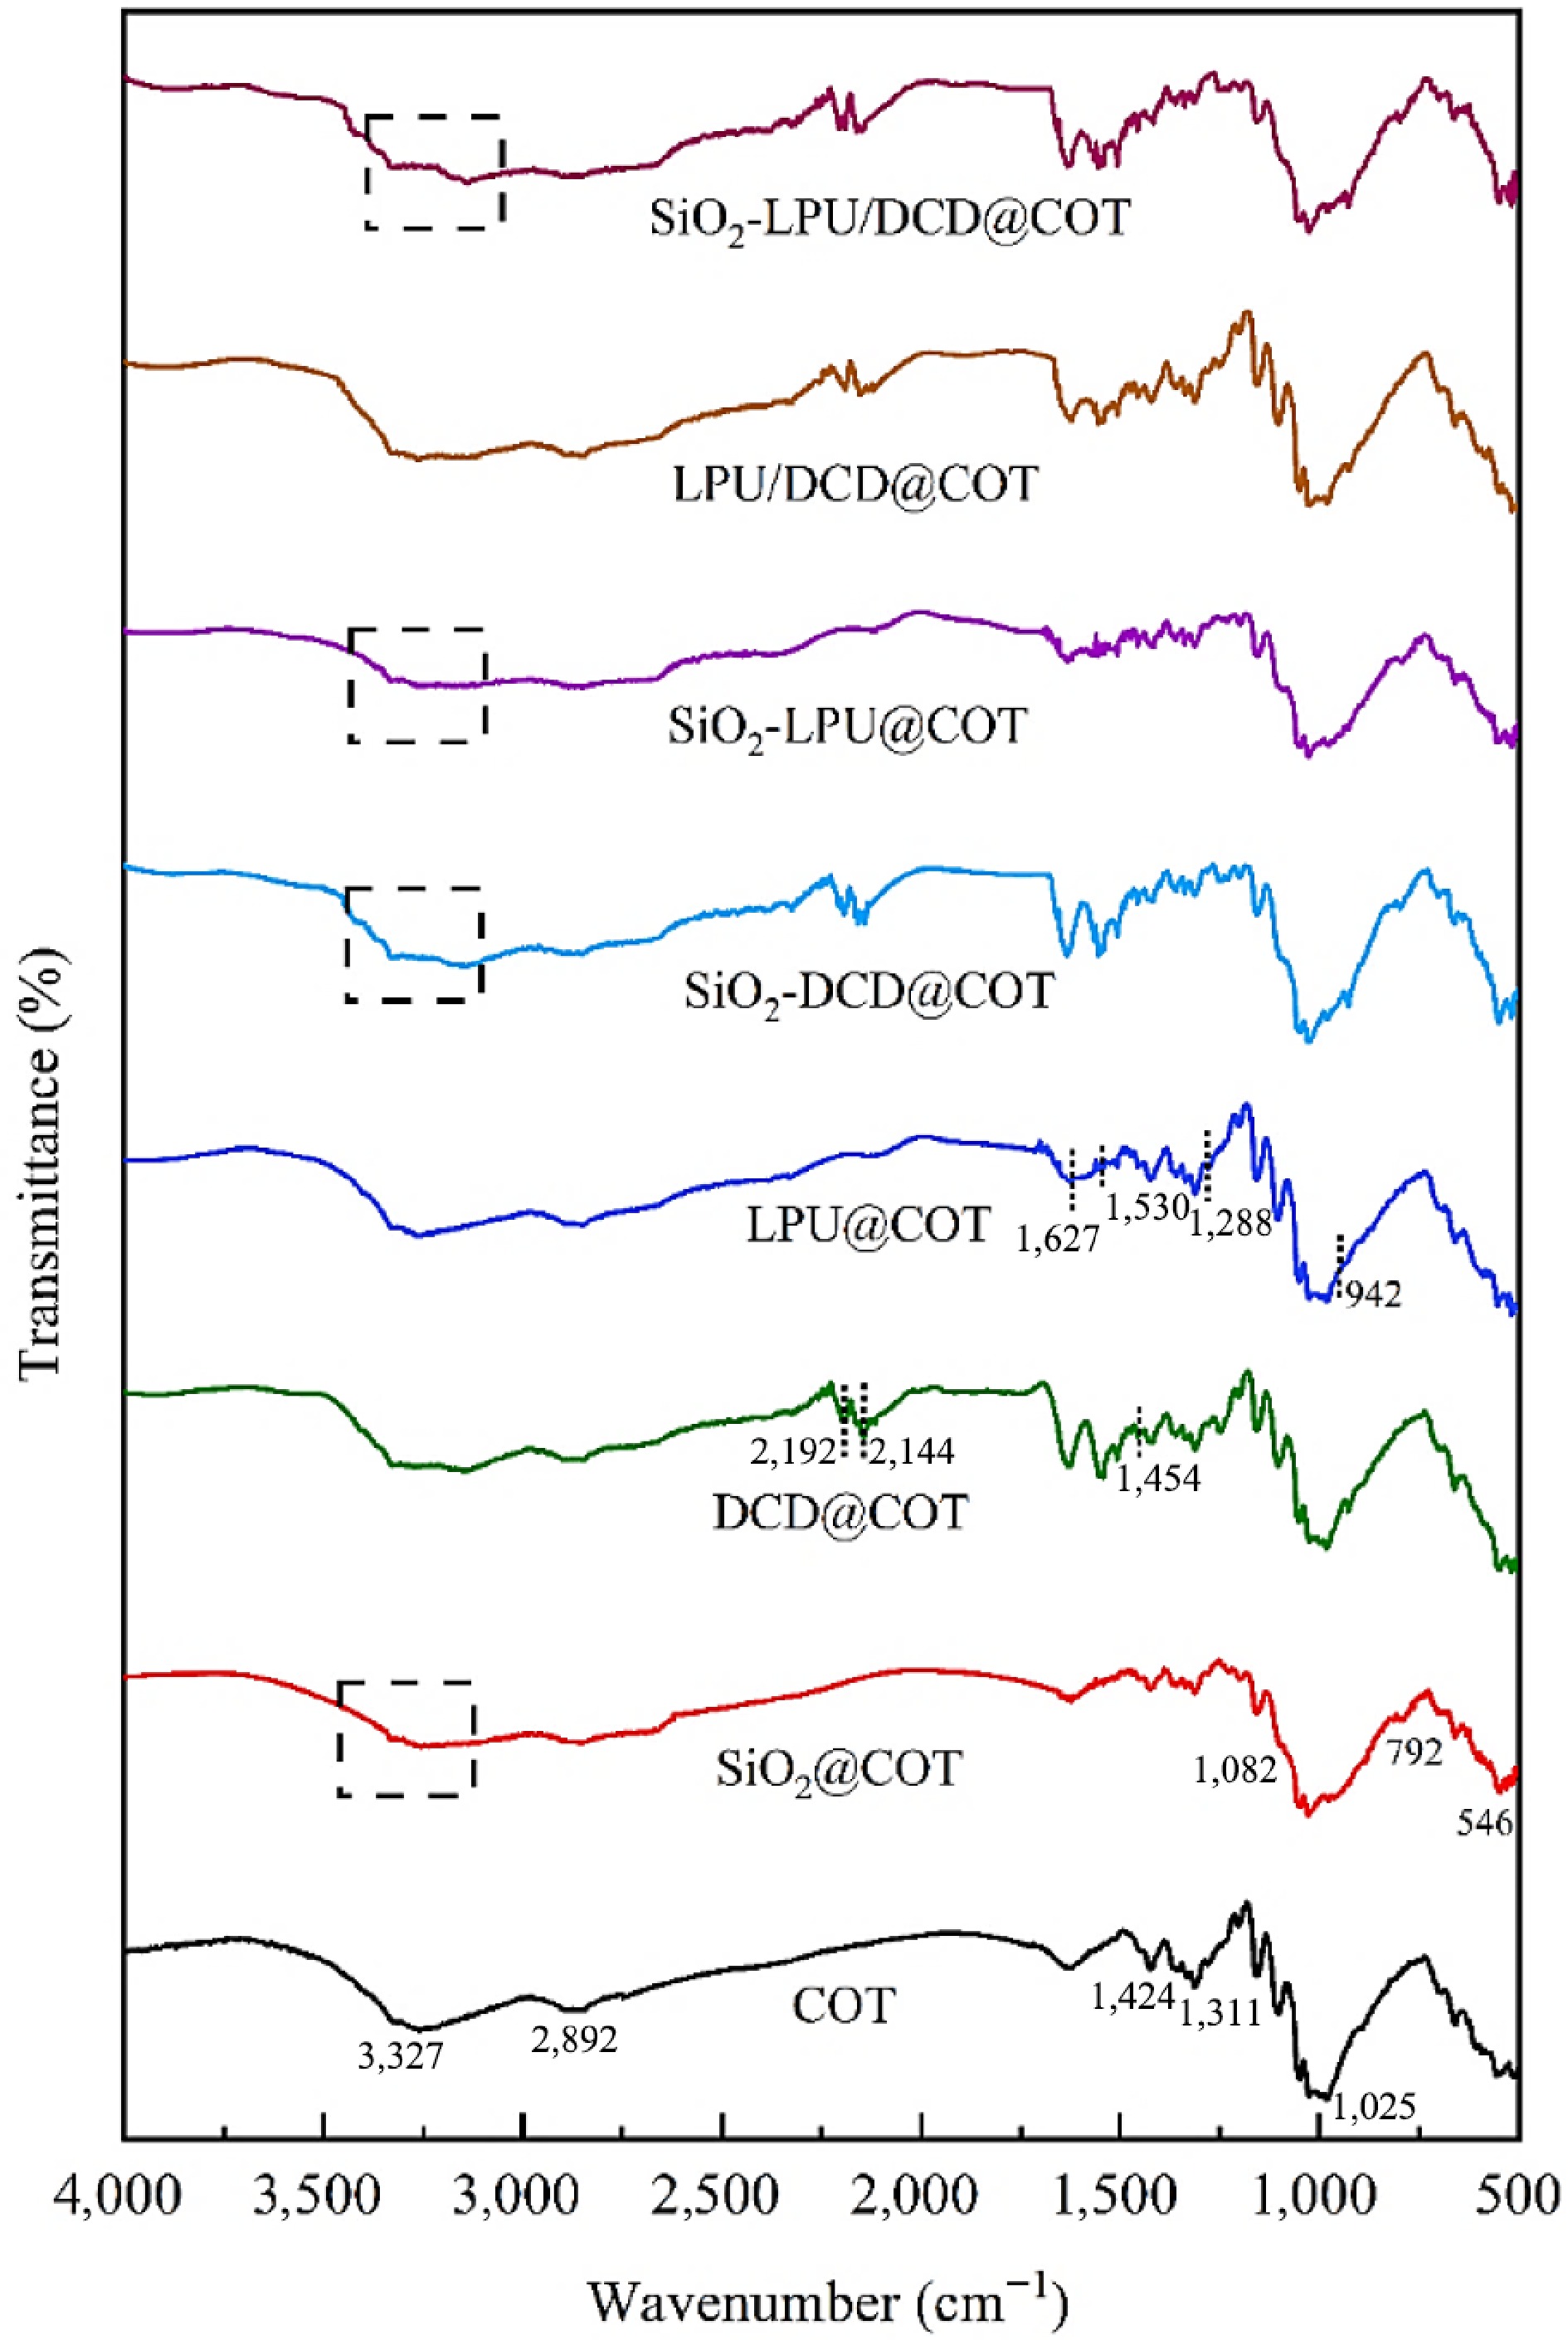
Figure 10.
FTIR spectra of cotton fabrics before and after flame retardant finishing.
-
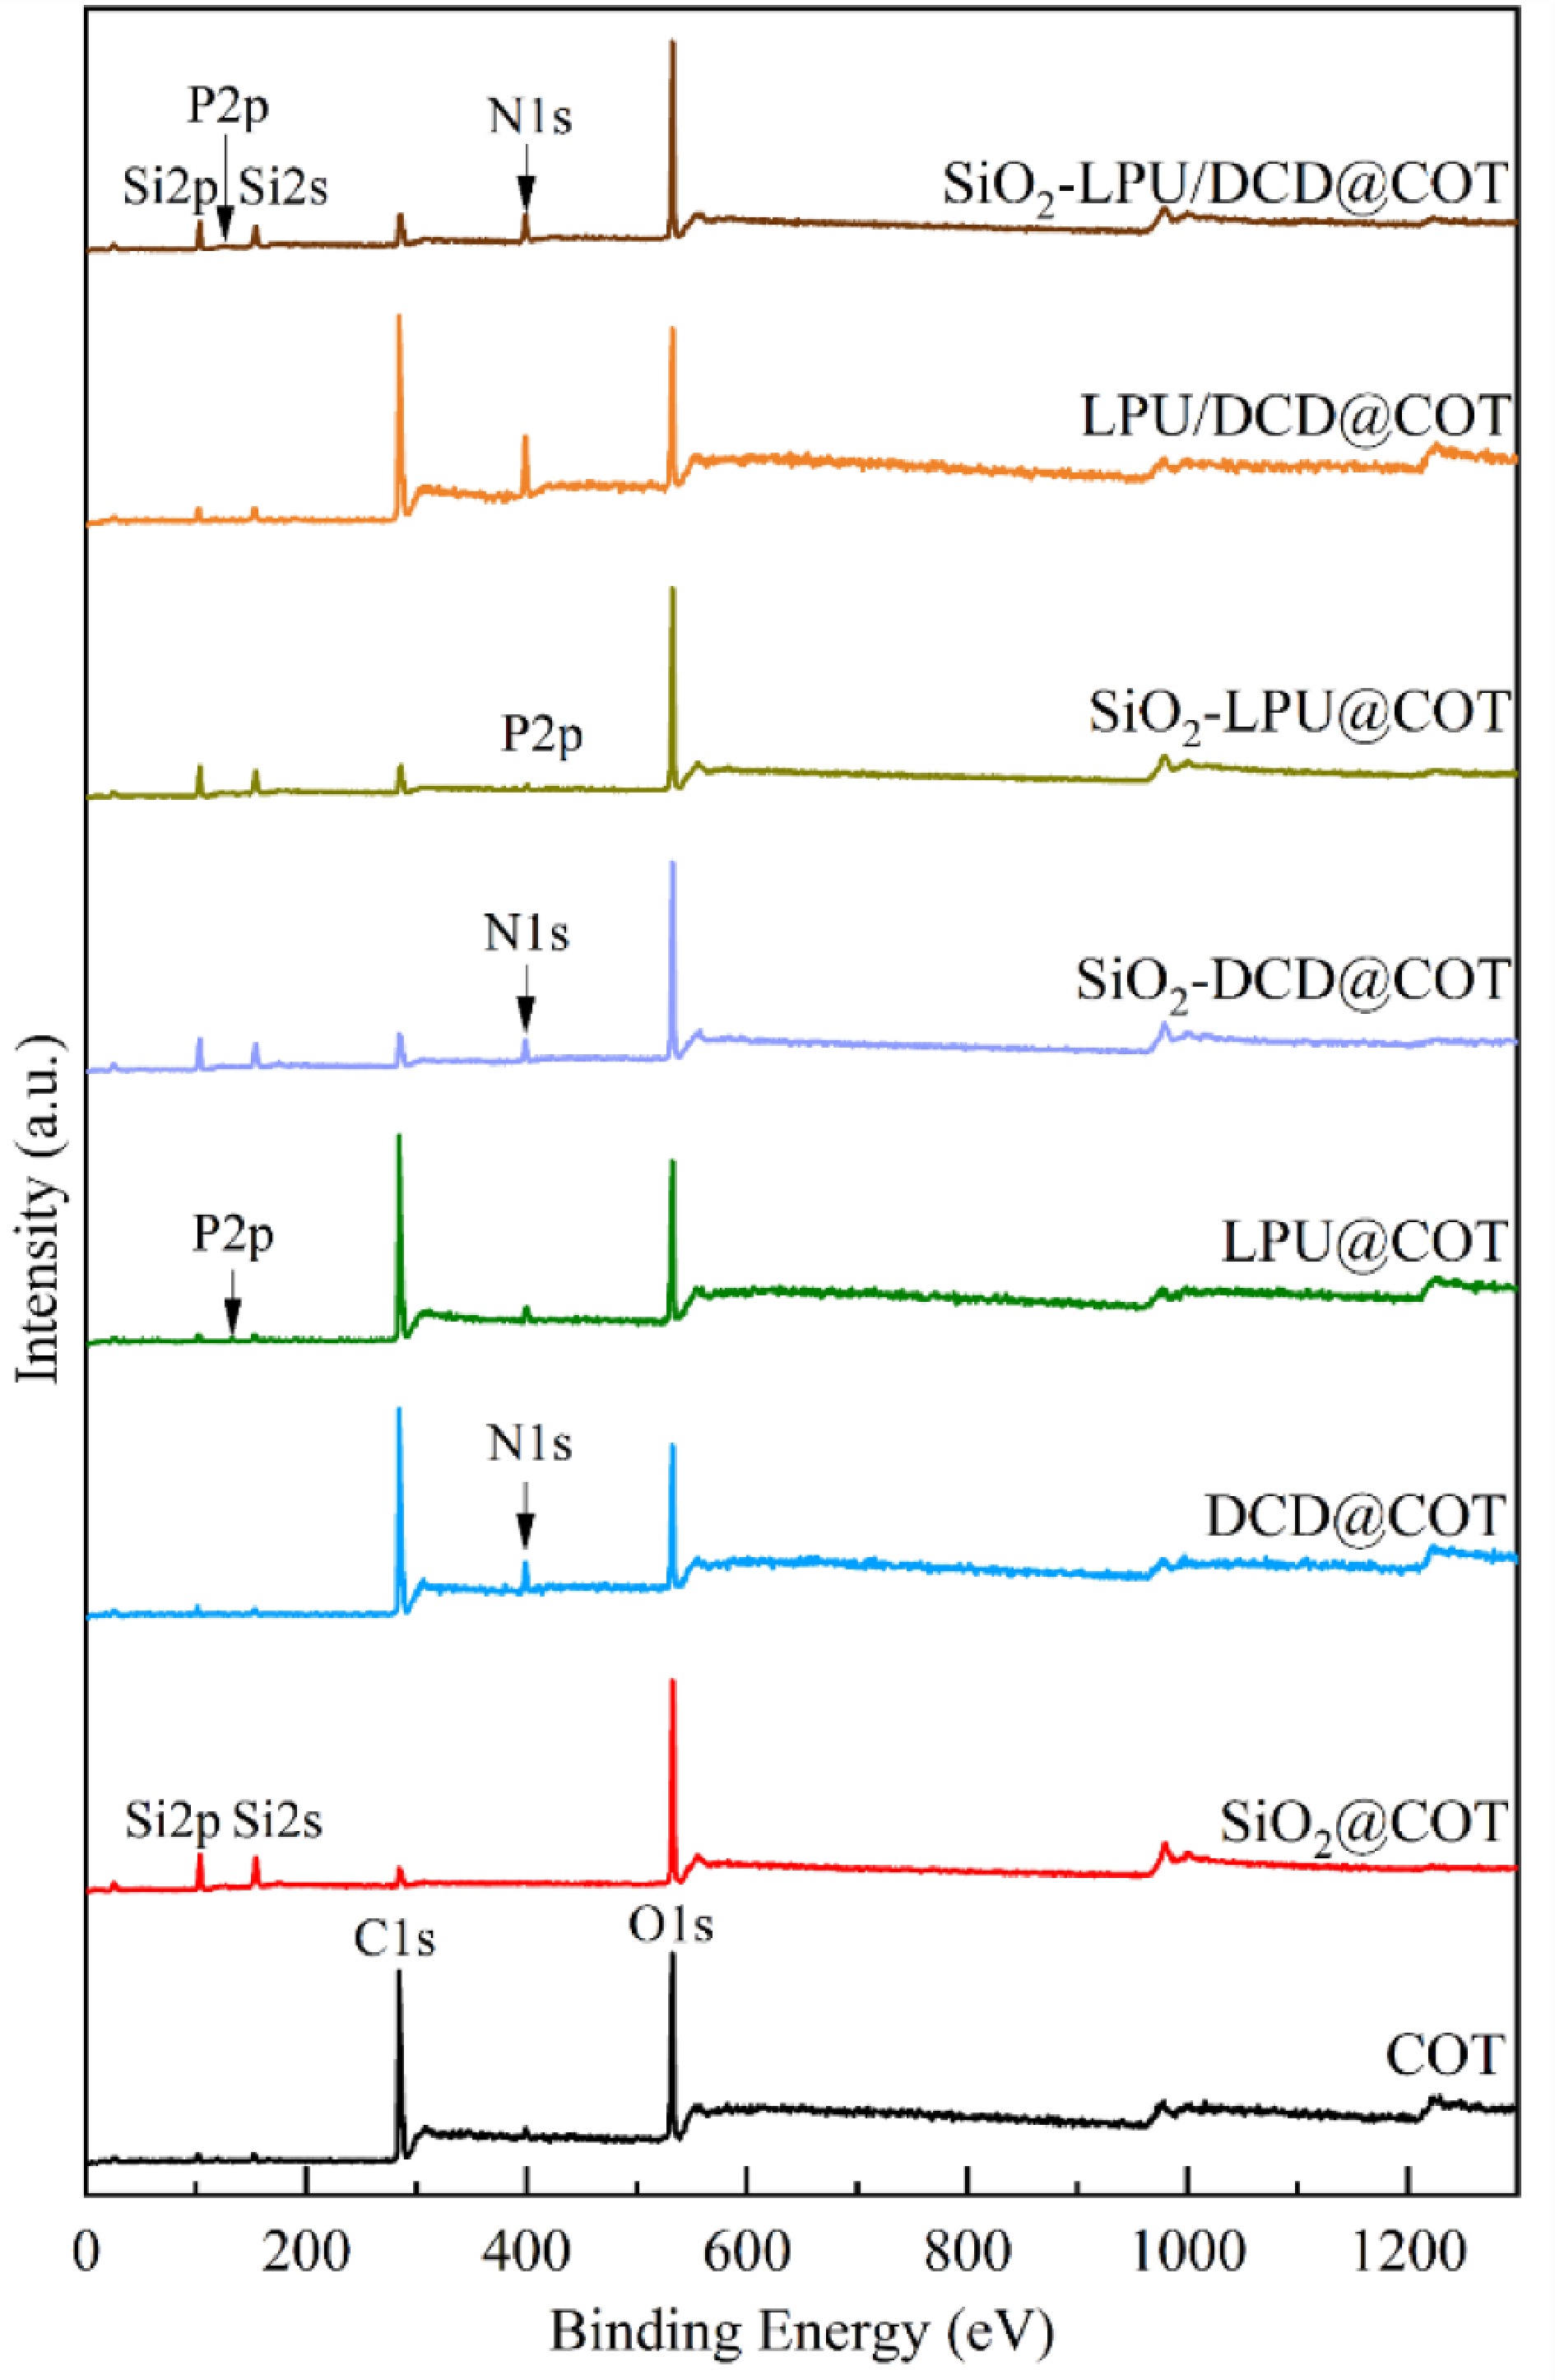
Figure 11.
XPS spectroscopic analysis of original and flame-retardant finished cotton fabrics.
-
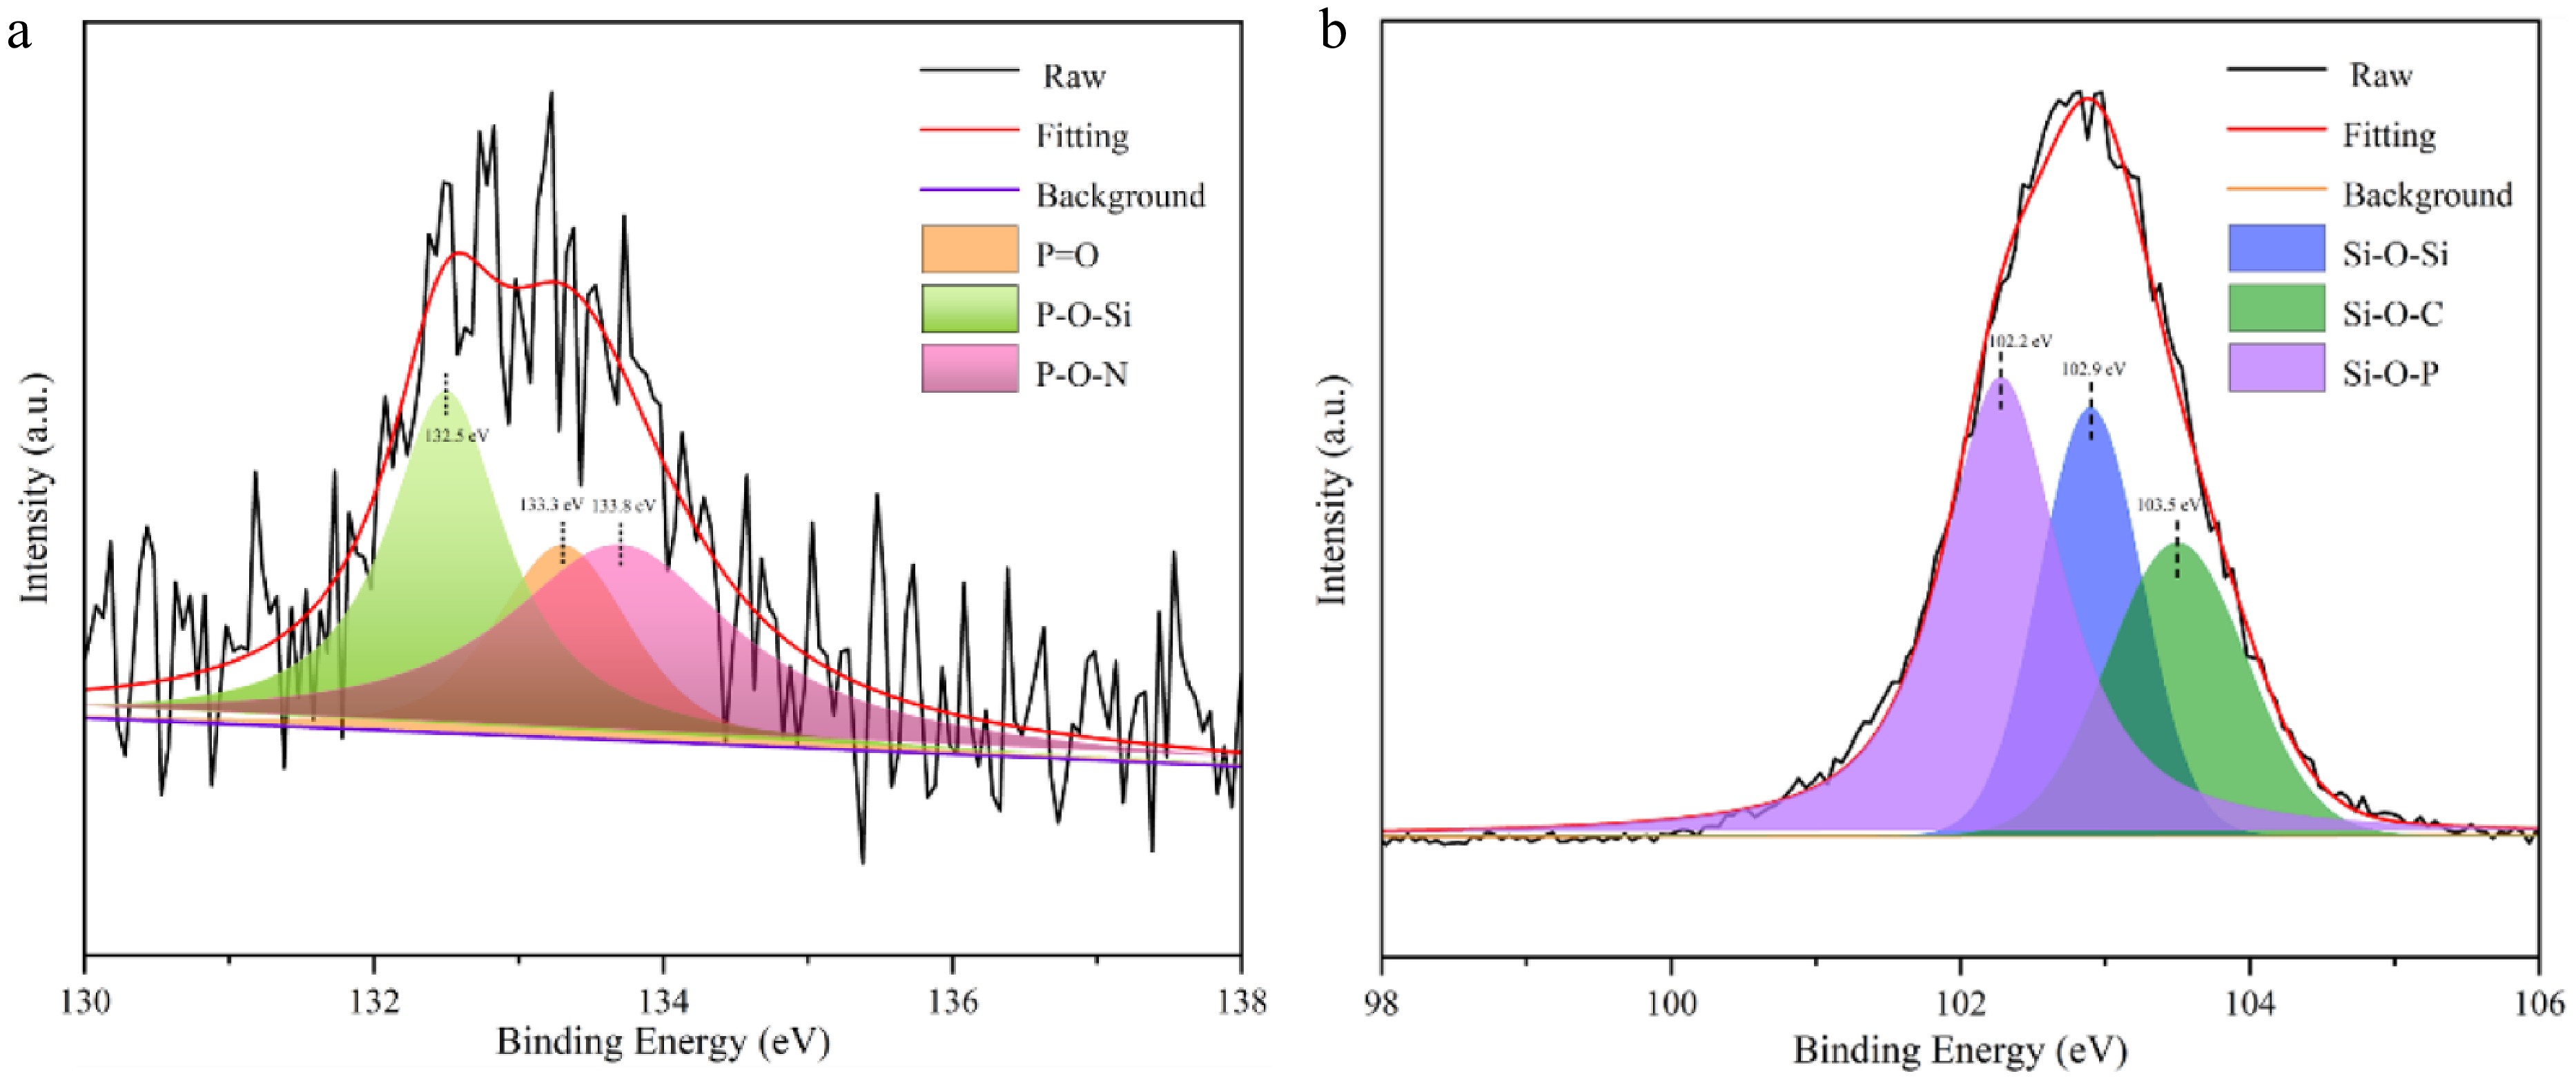
Figure 12.
High resolution spectra of (a) P2p, and (b) Si2p for SiO2-LPU/DCD@COT.
-
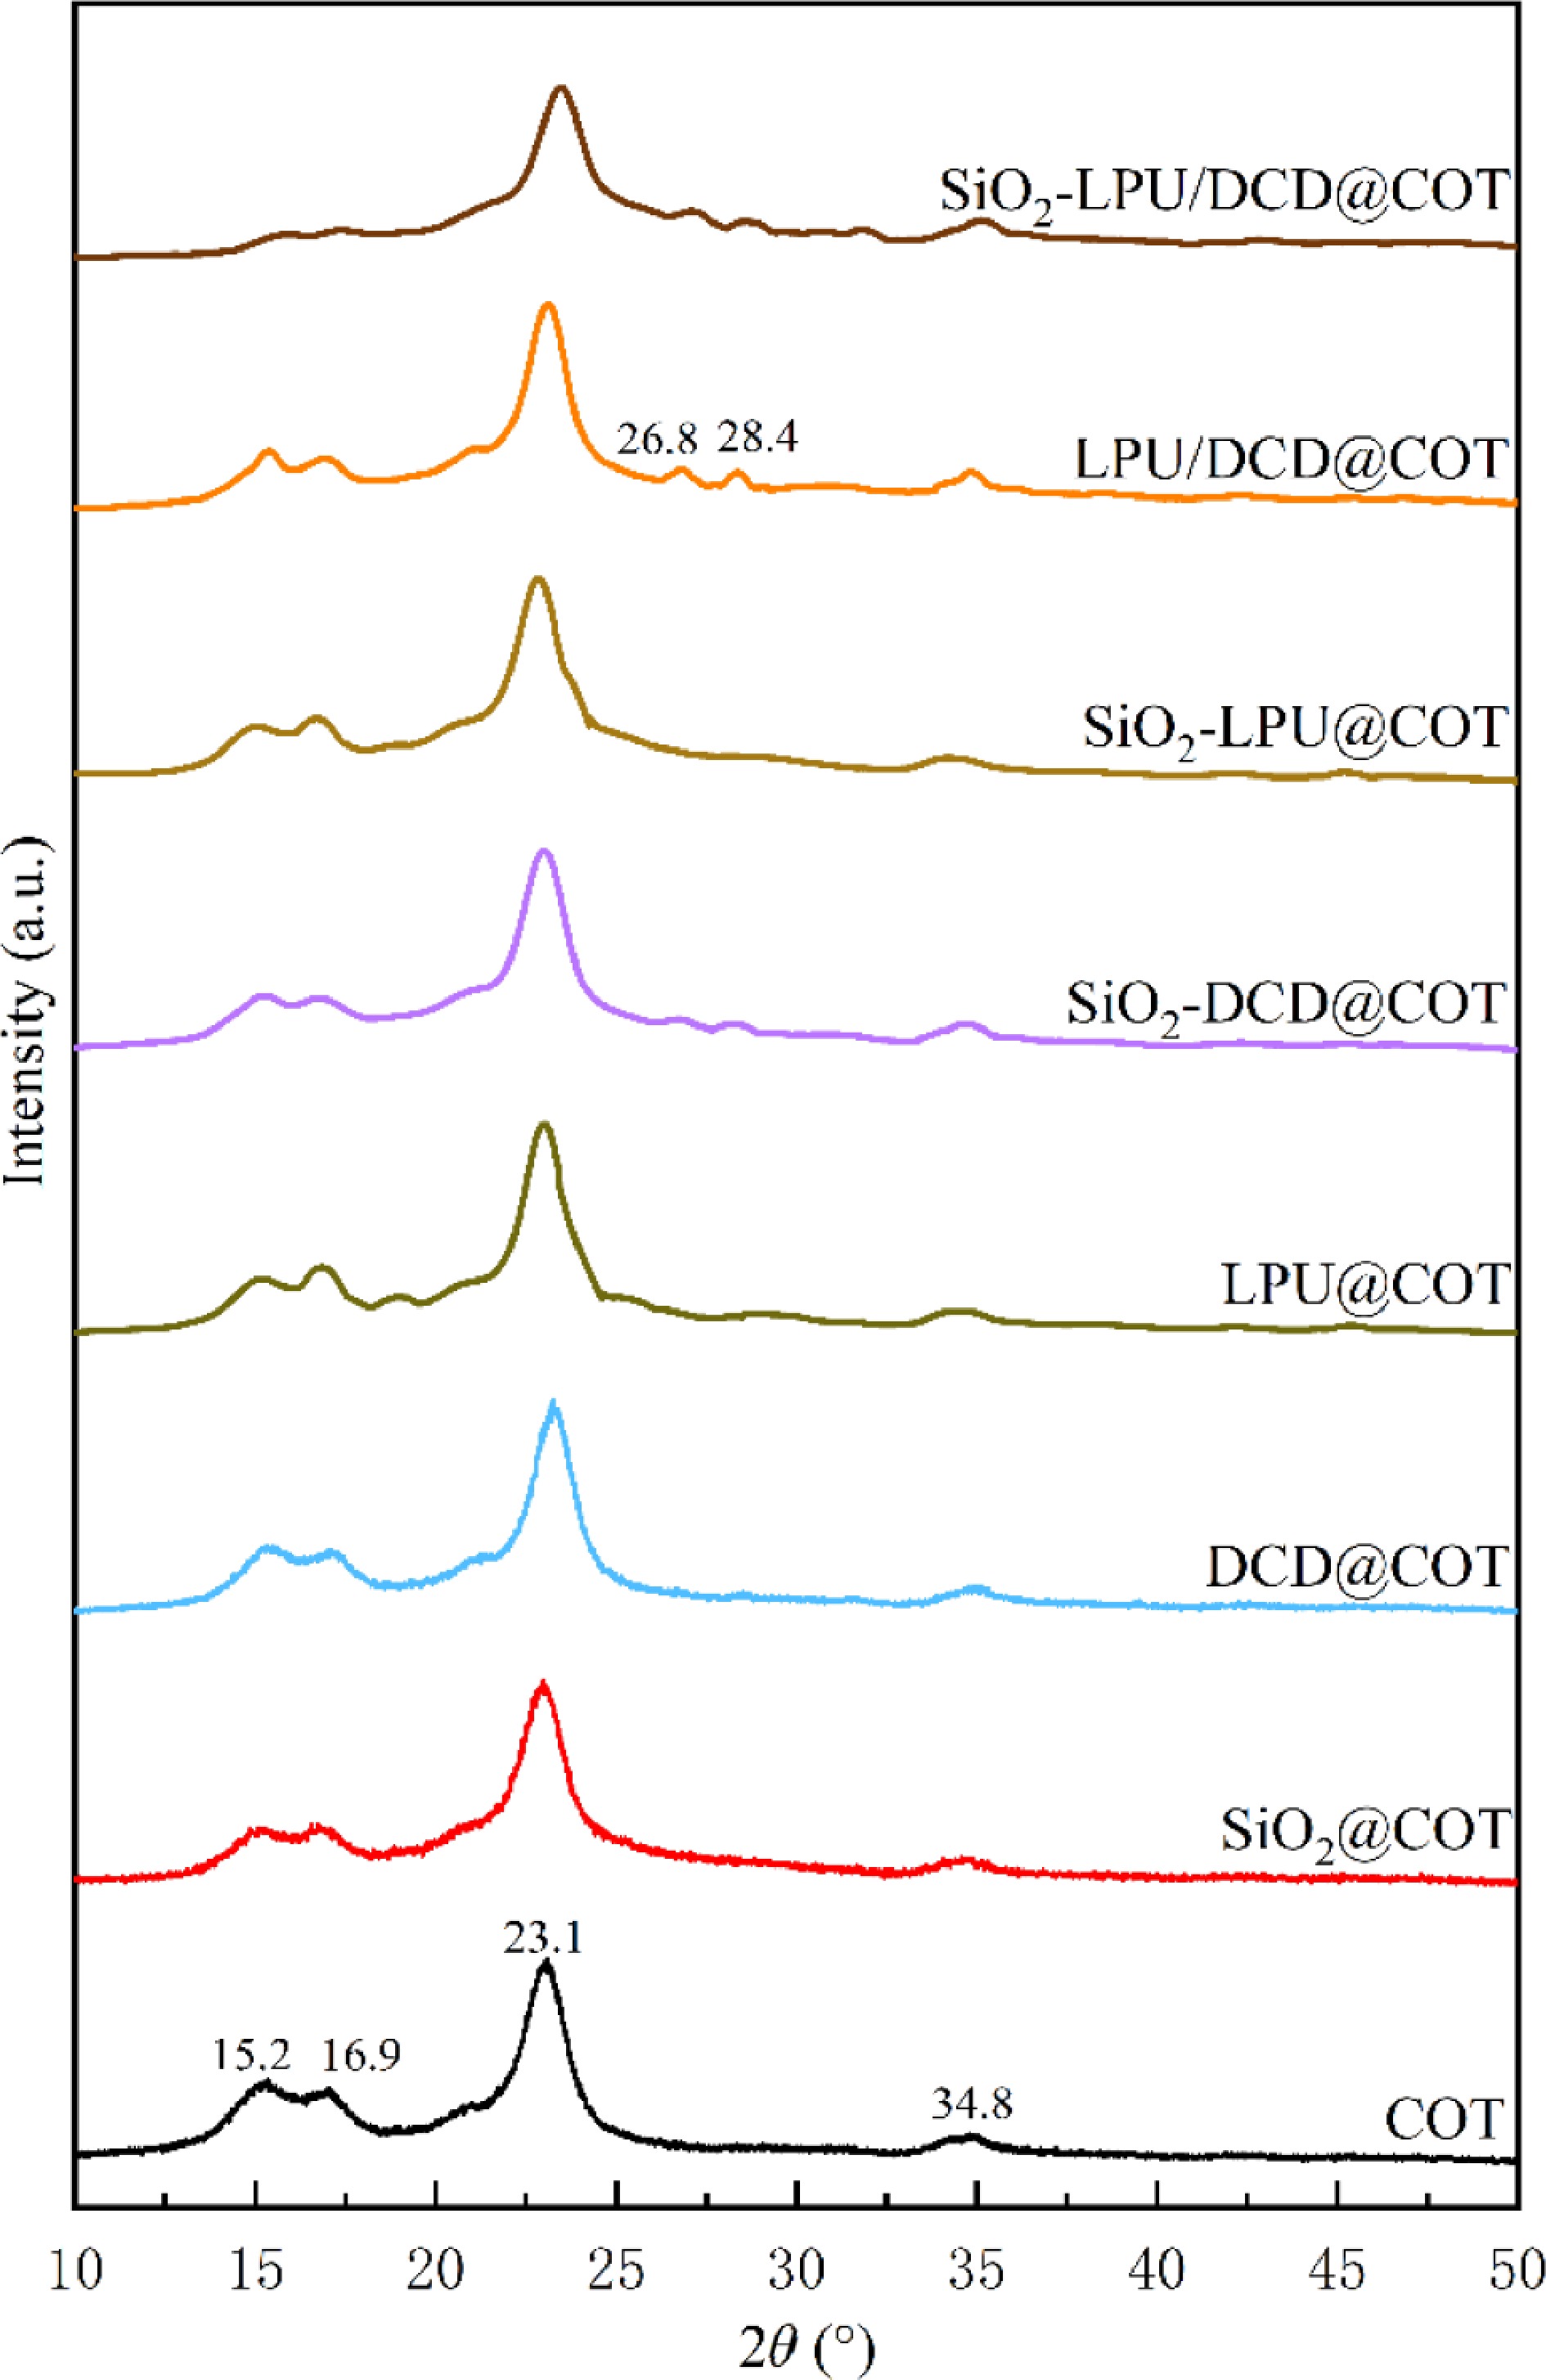
Figure 13.
XRD patterns of original and flame retardant treated cotton fabrics.
-
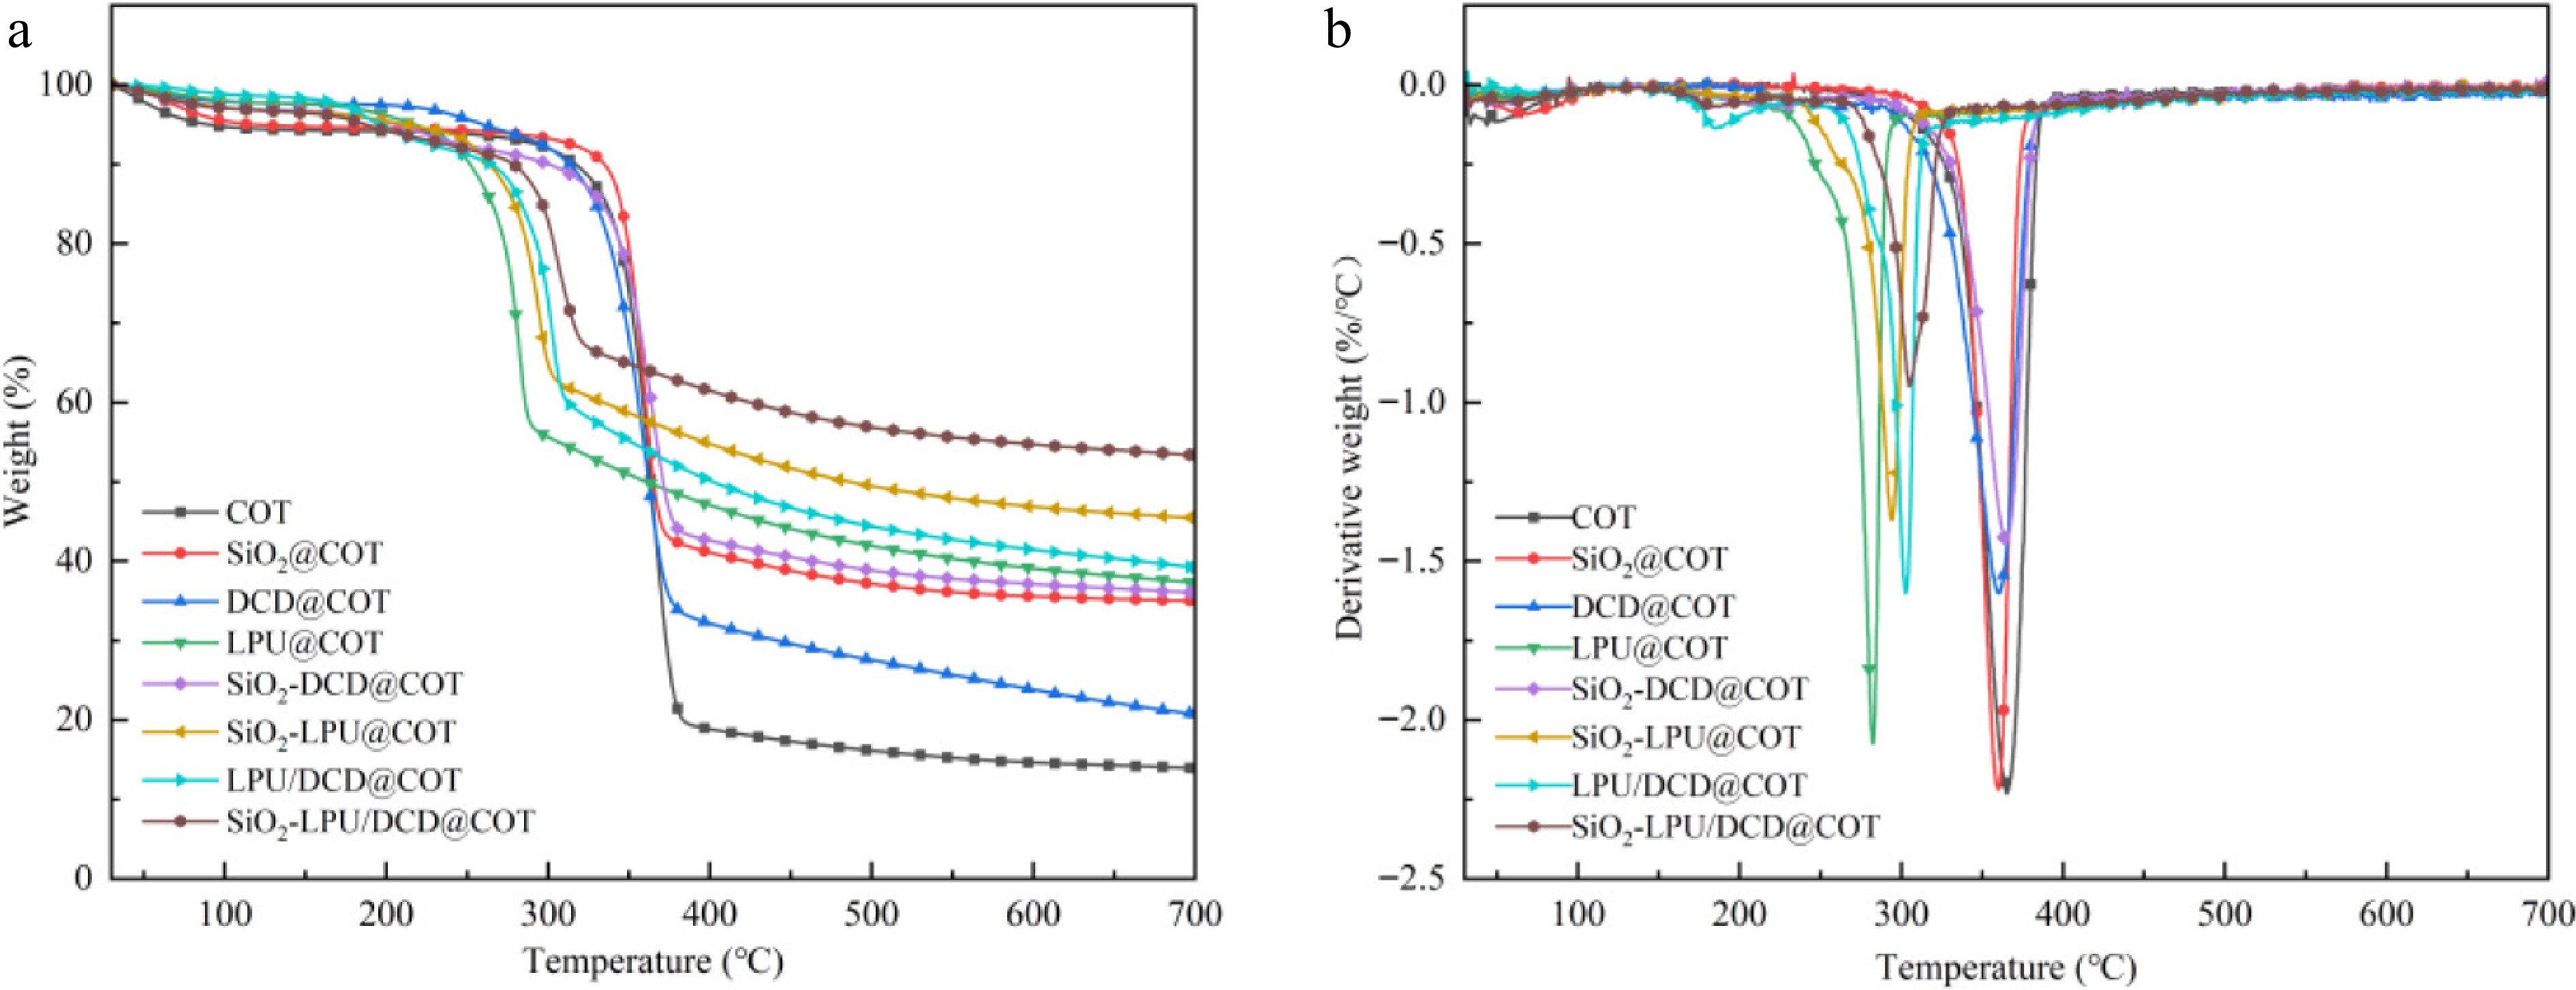
Figure 14.
TGA curves of original and flame retardant treated cotton fabrics. (a) TGA curves in nitrogen. (b) DTG curves in nitrogen.
-
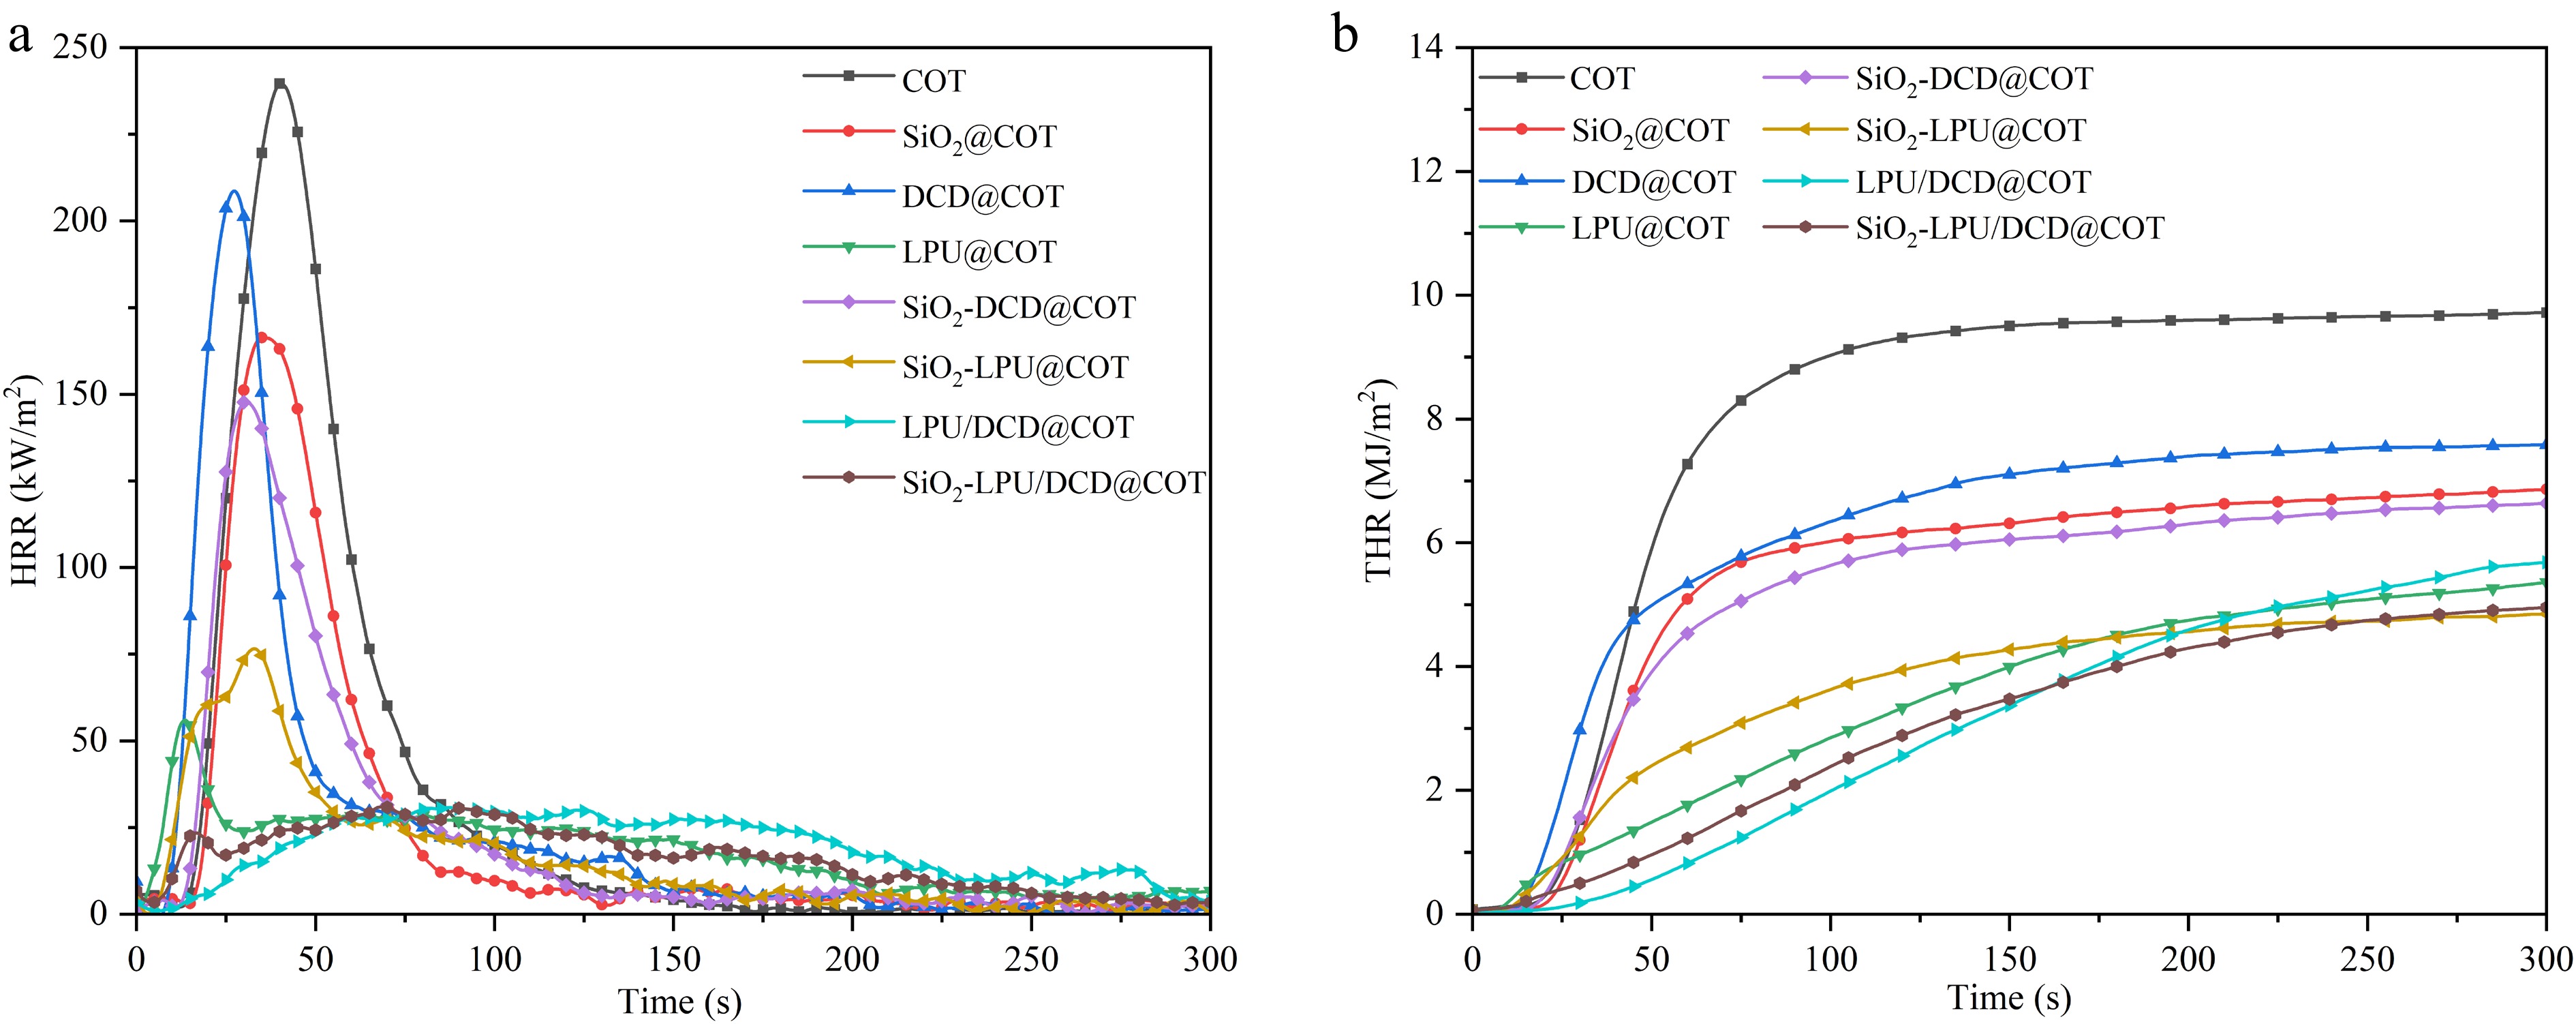
Figure 15.
(a) Heat release rate, and (b) total heat release of original and flame-retardant finished cotton fabrics.
-
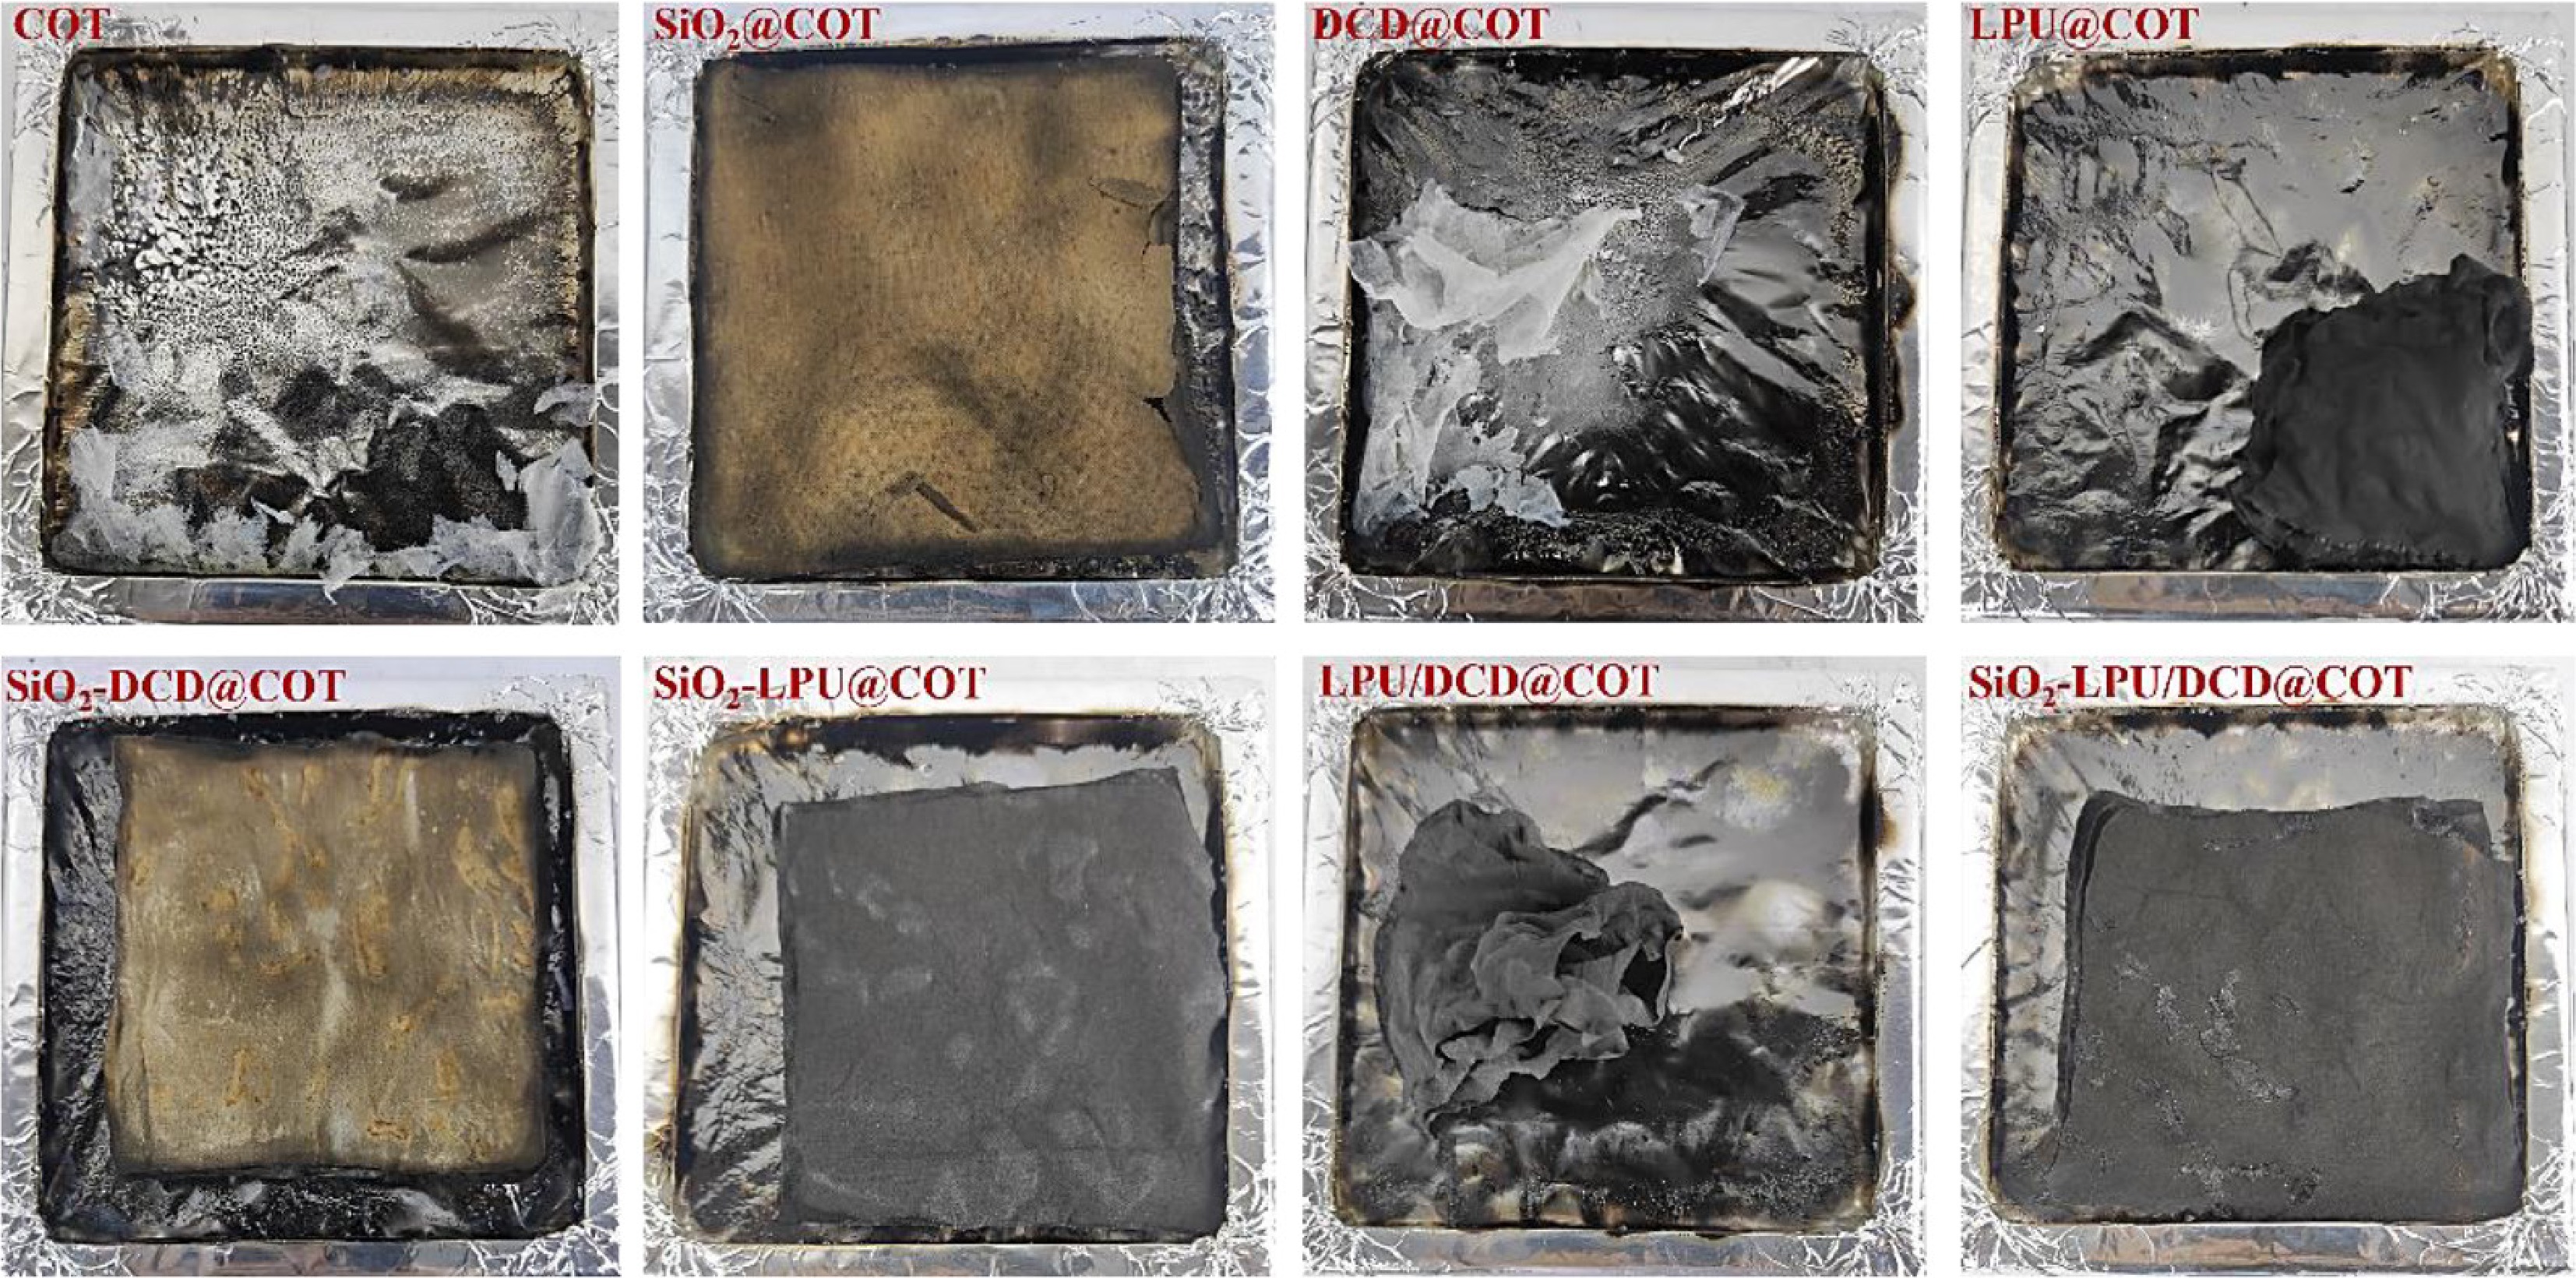
Figure 16.
Cone calorimetry test images of original and flame retardant finished cotton fabrics.
-
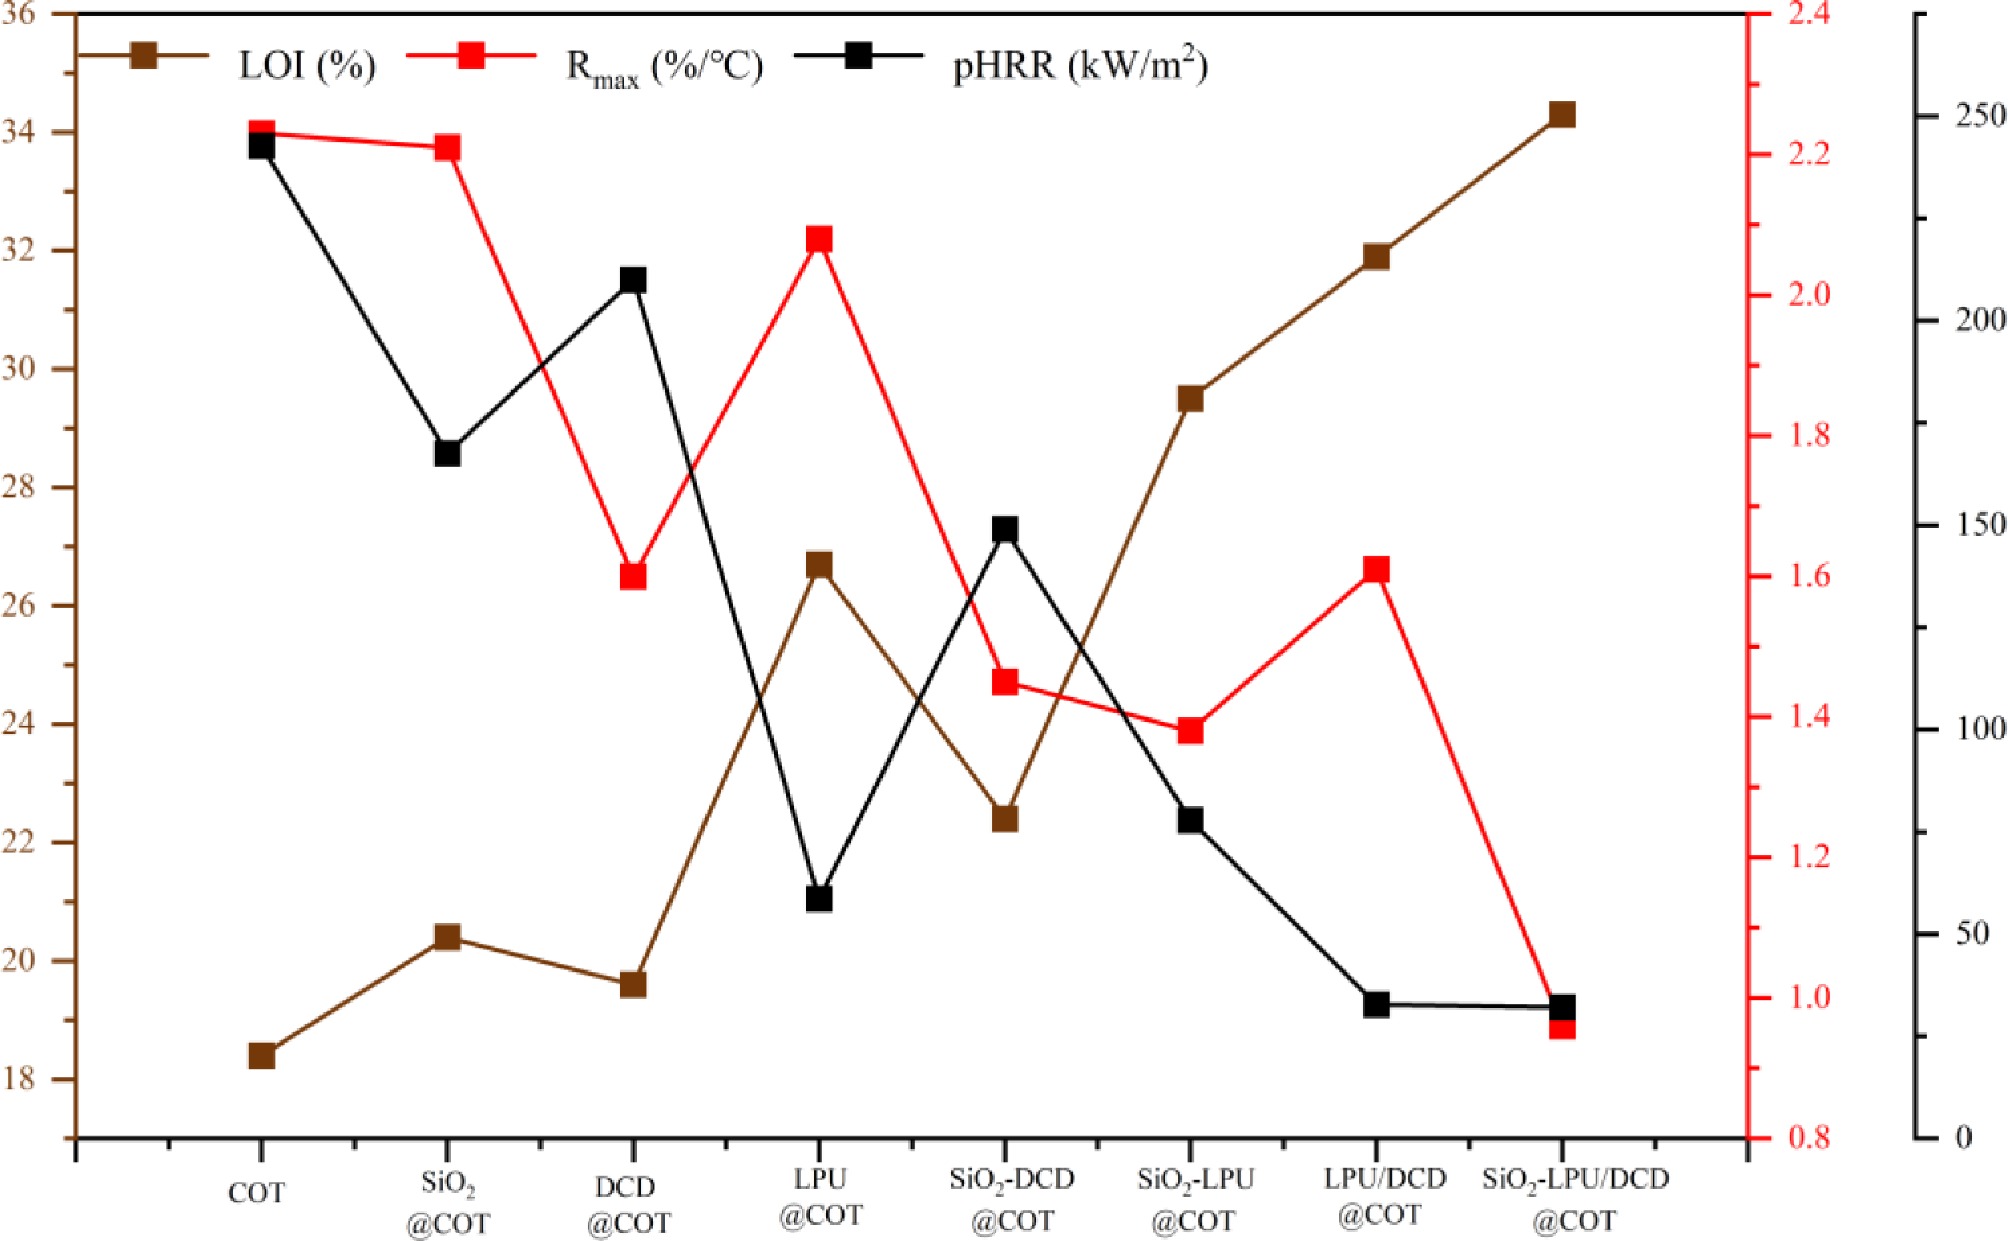
Figure 17.
Relationship between LOI, Rmax, and pHRR of original and flame retardant cotton.
-
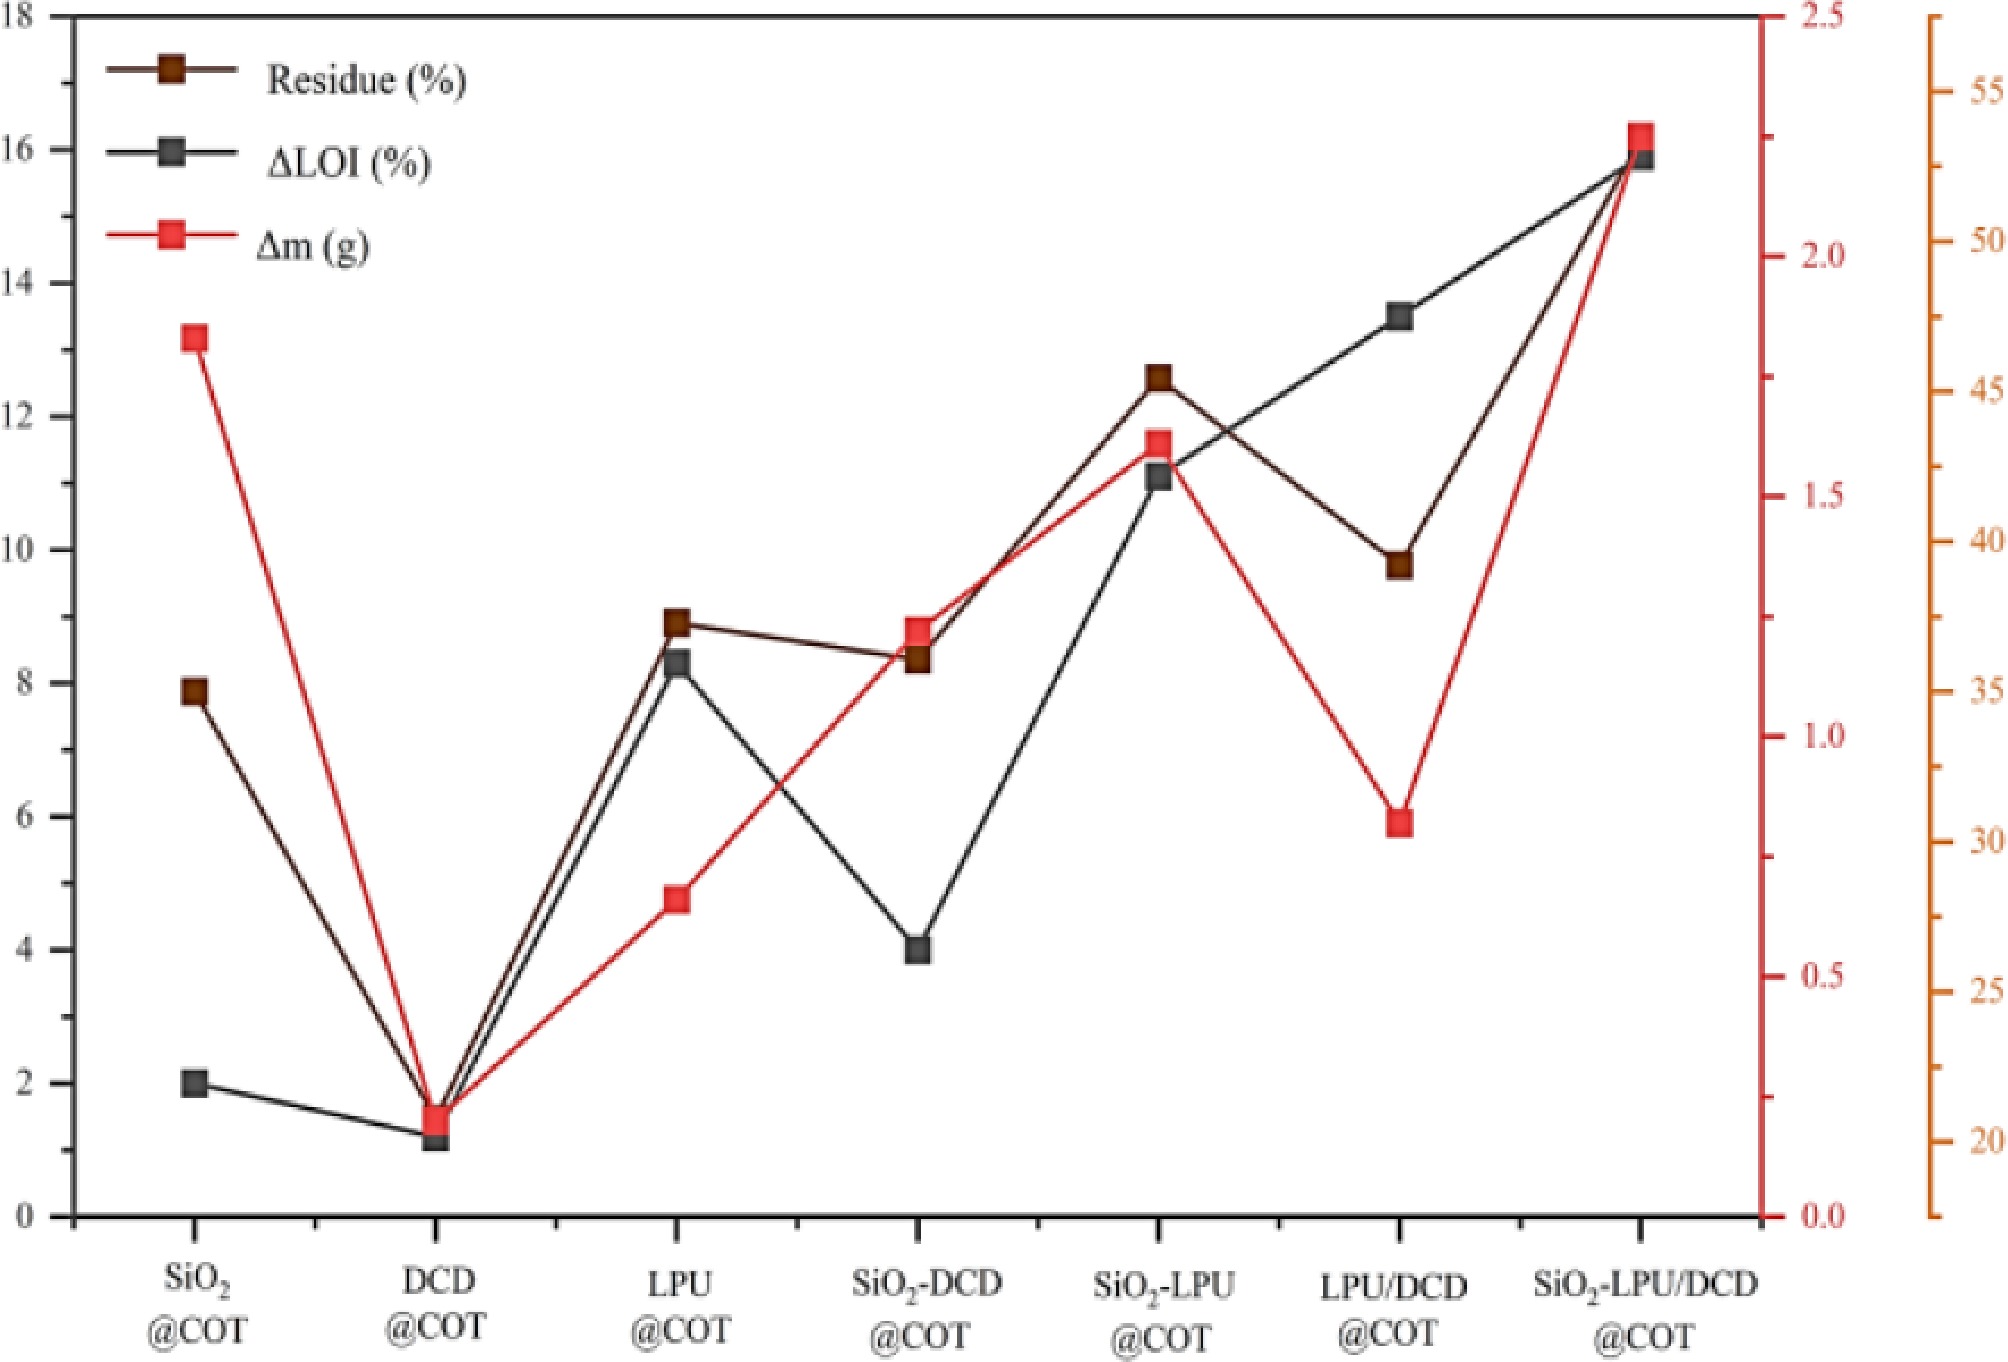
Figure 18.
Residue, ΔLOI and Δm of treated cotton fabrics.
-
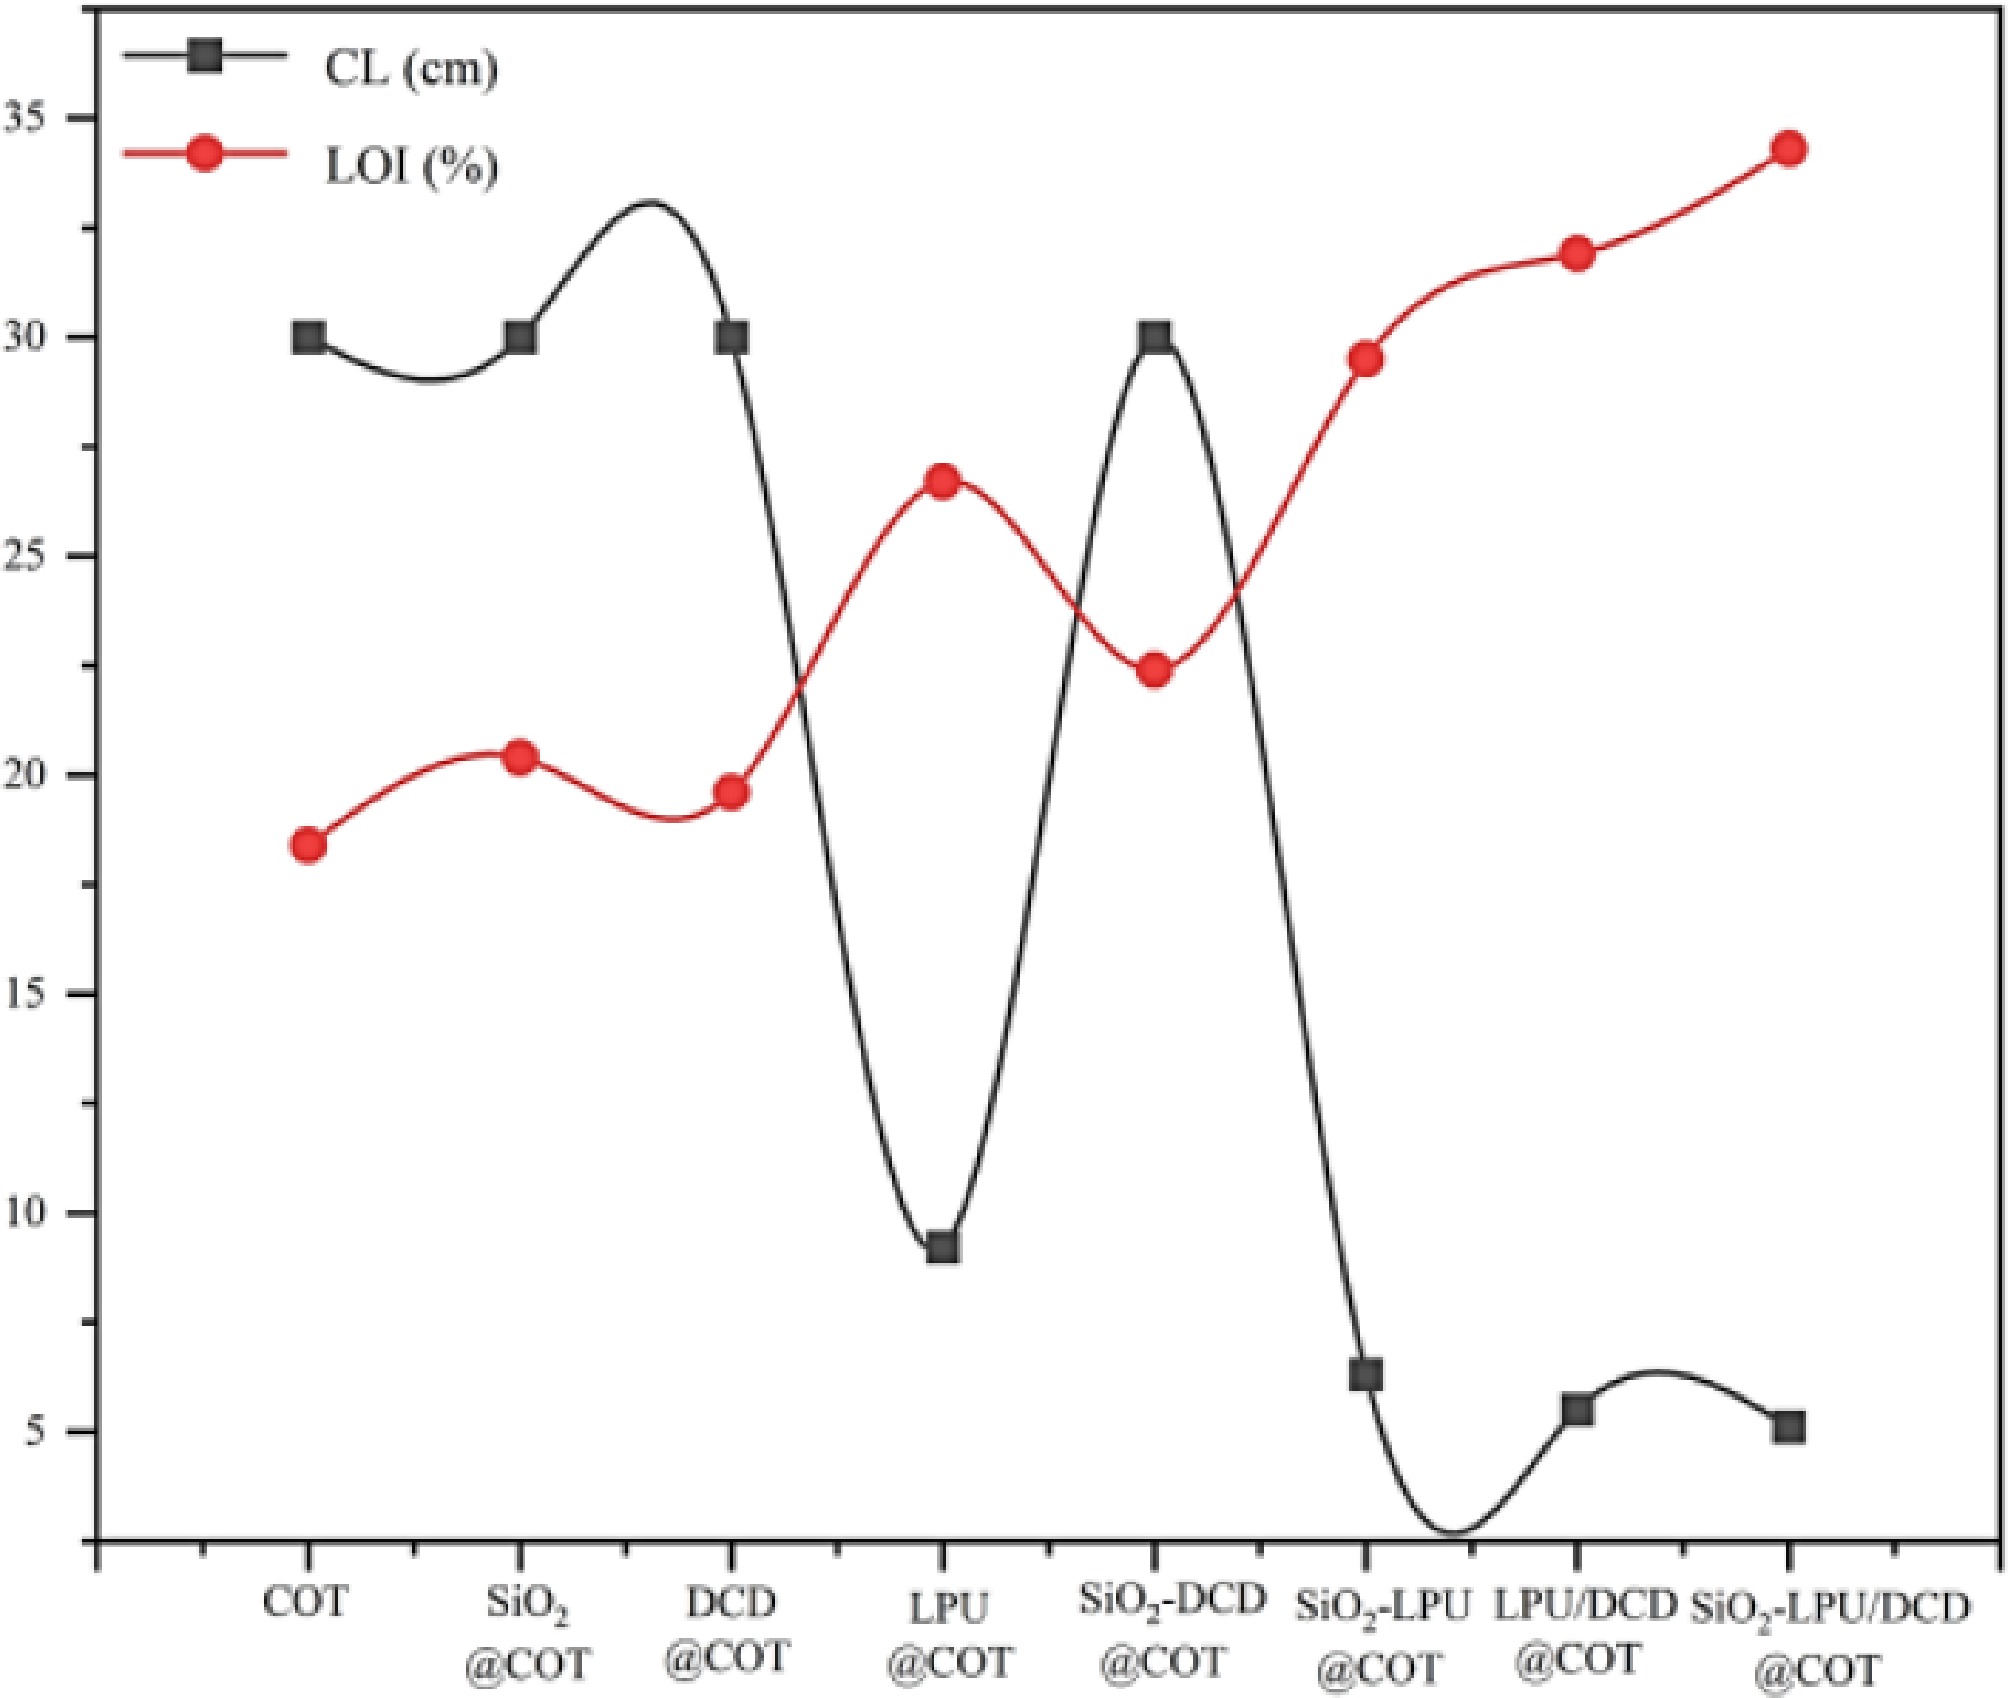
Figure 19.
CL and LOI of original and treated cotton fabrics.
-

Figure 20.
Vertical burning photographs of original and flame-retardant finished cotton fabrics. (a) COT, (b) SiO2@COT, (c) DCD@COT, (d) LPU@COT, (e) SiO2-DCD@COT, (f) SiO2-LPU@COT, (g) LPU/DCD@COT, (h) SiO2-LPU/DCD@COT.
-
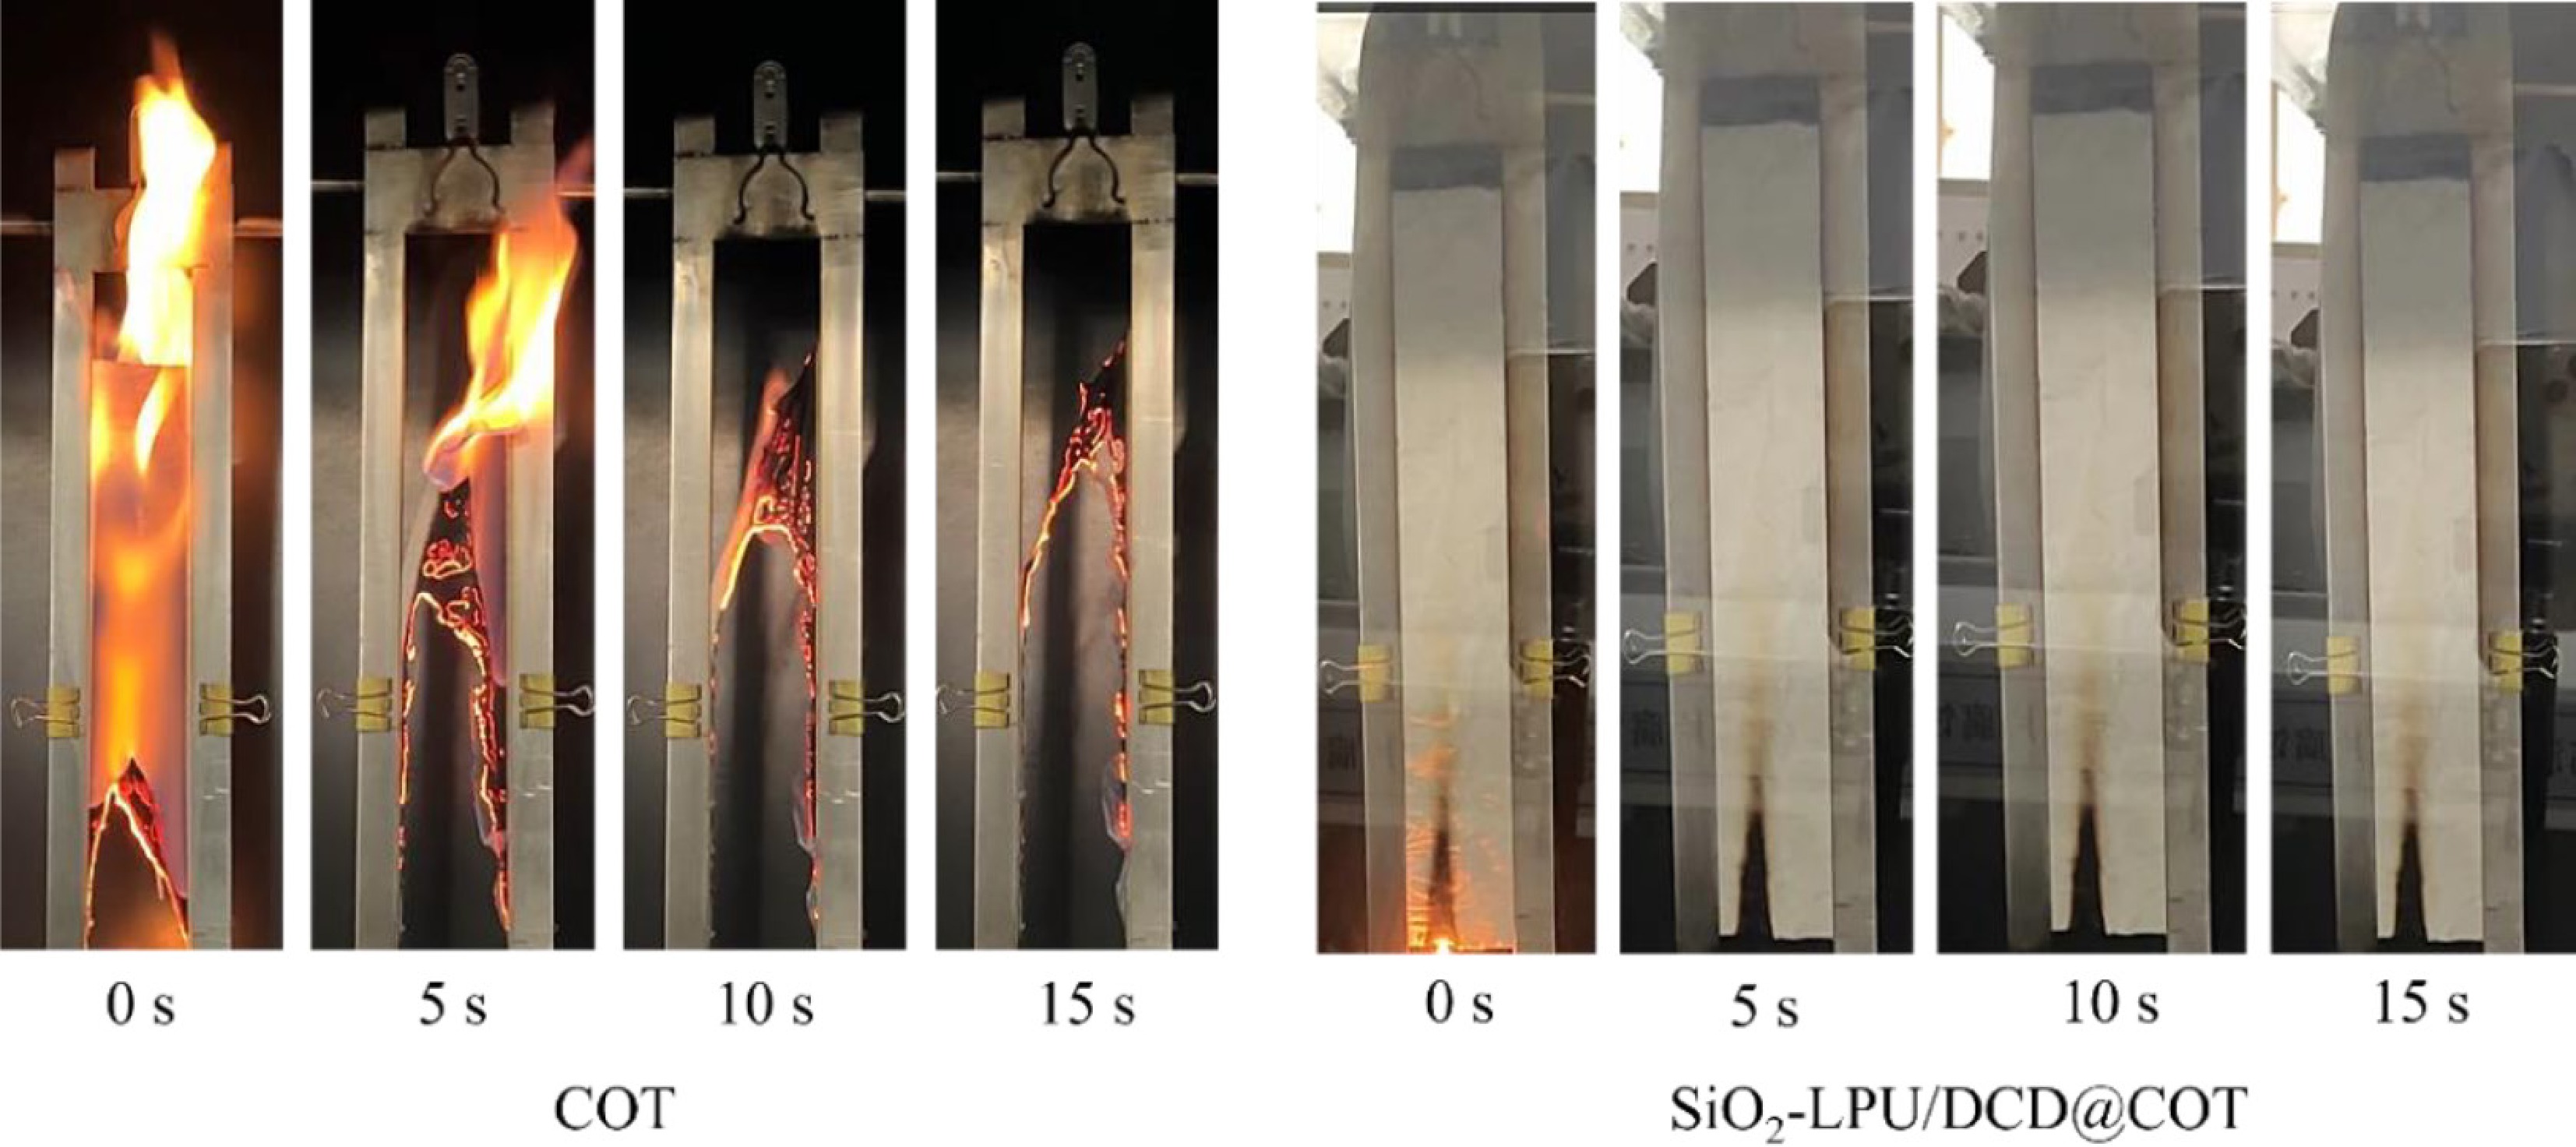
Figure 21.
Schematic diagram of vertical burning process of original and flame-retardant finished cotton fabric.
-
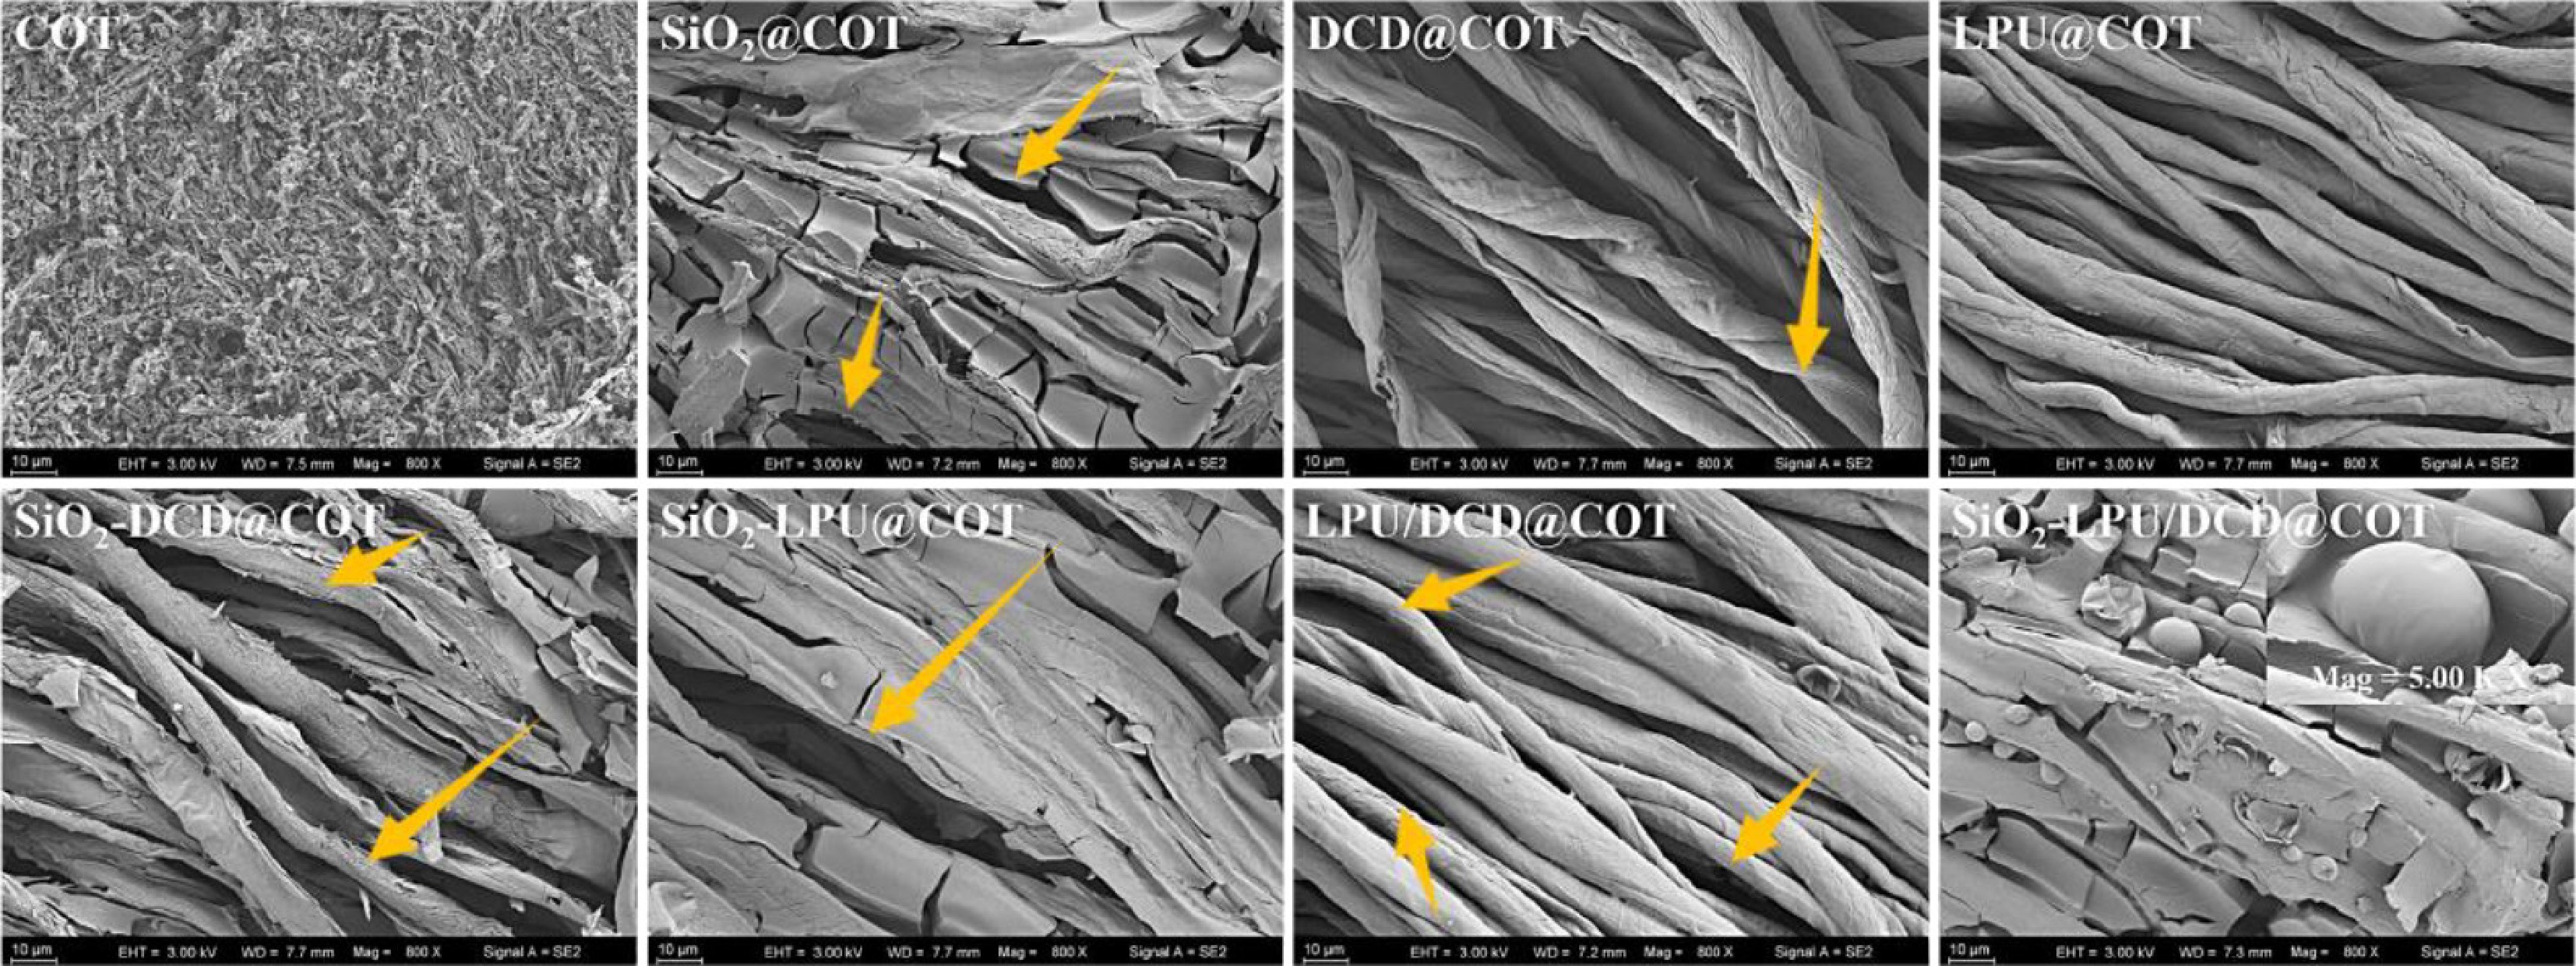
Figure 22.
SEM images of char residues of original and flame-retardant cotton after VBT.
-
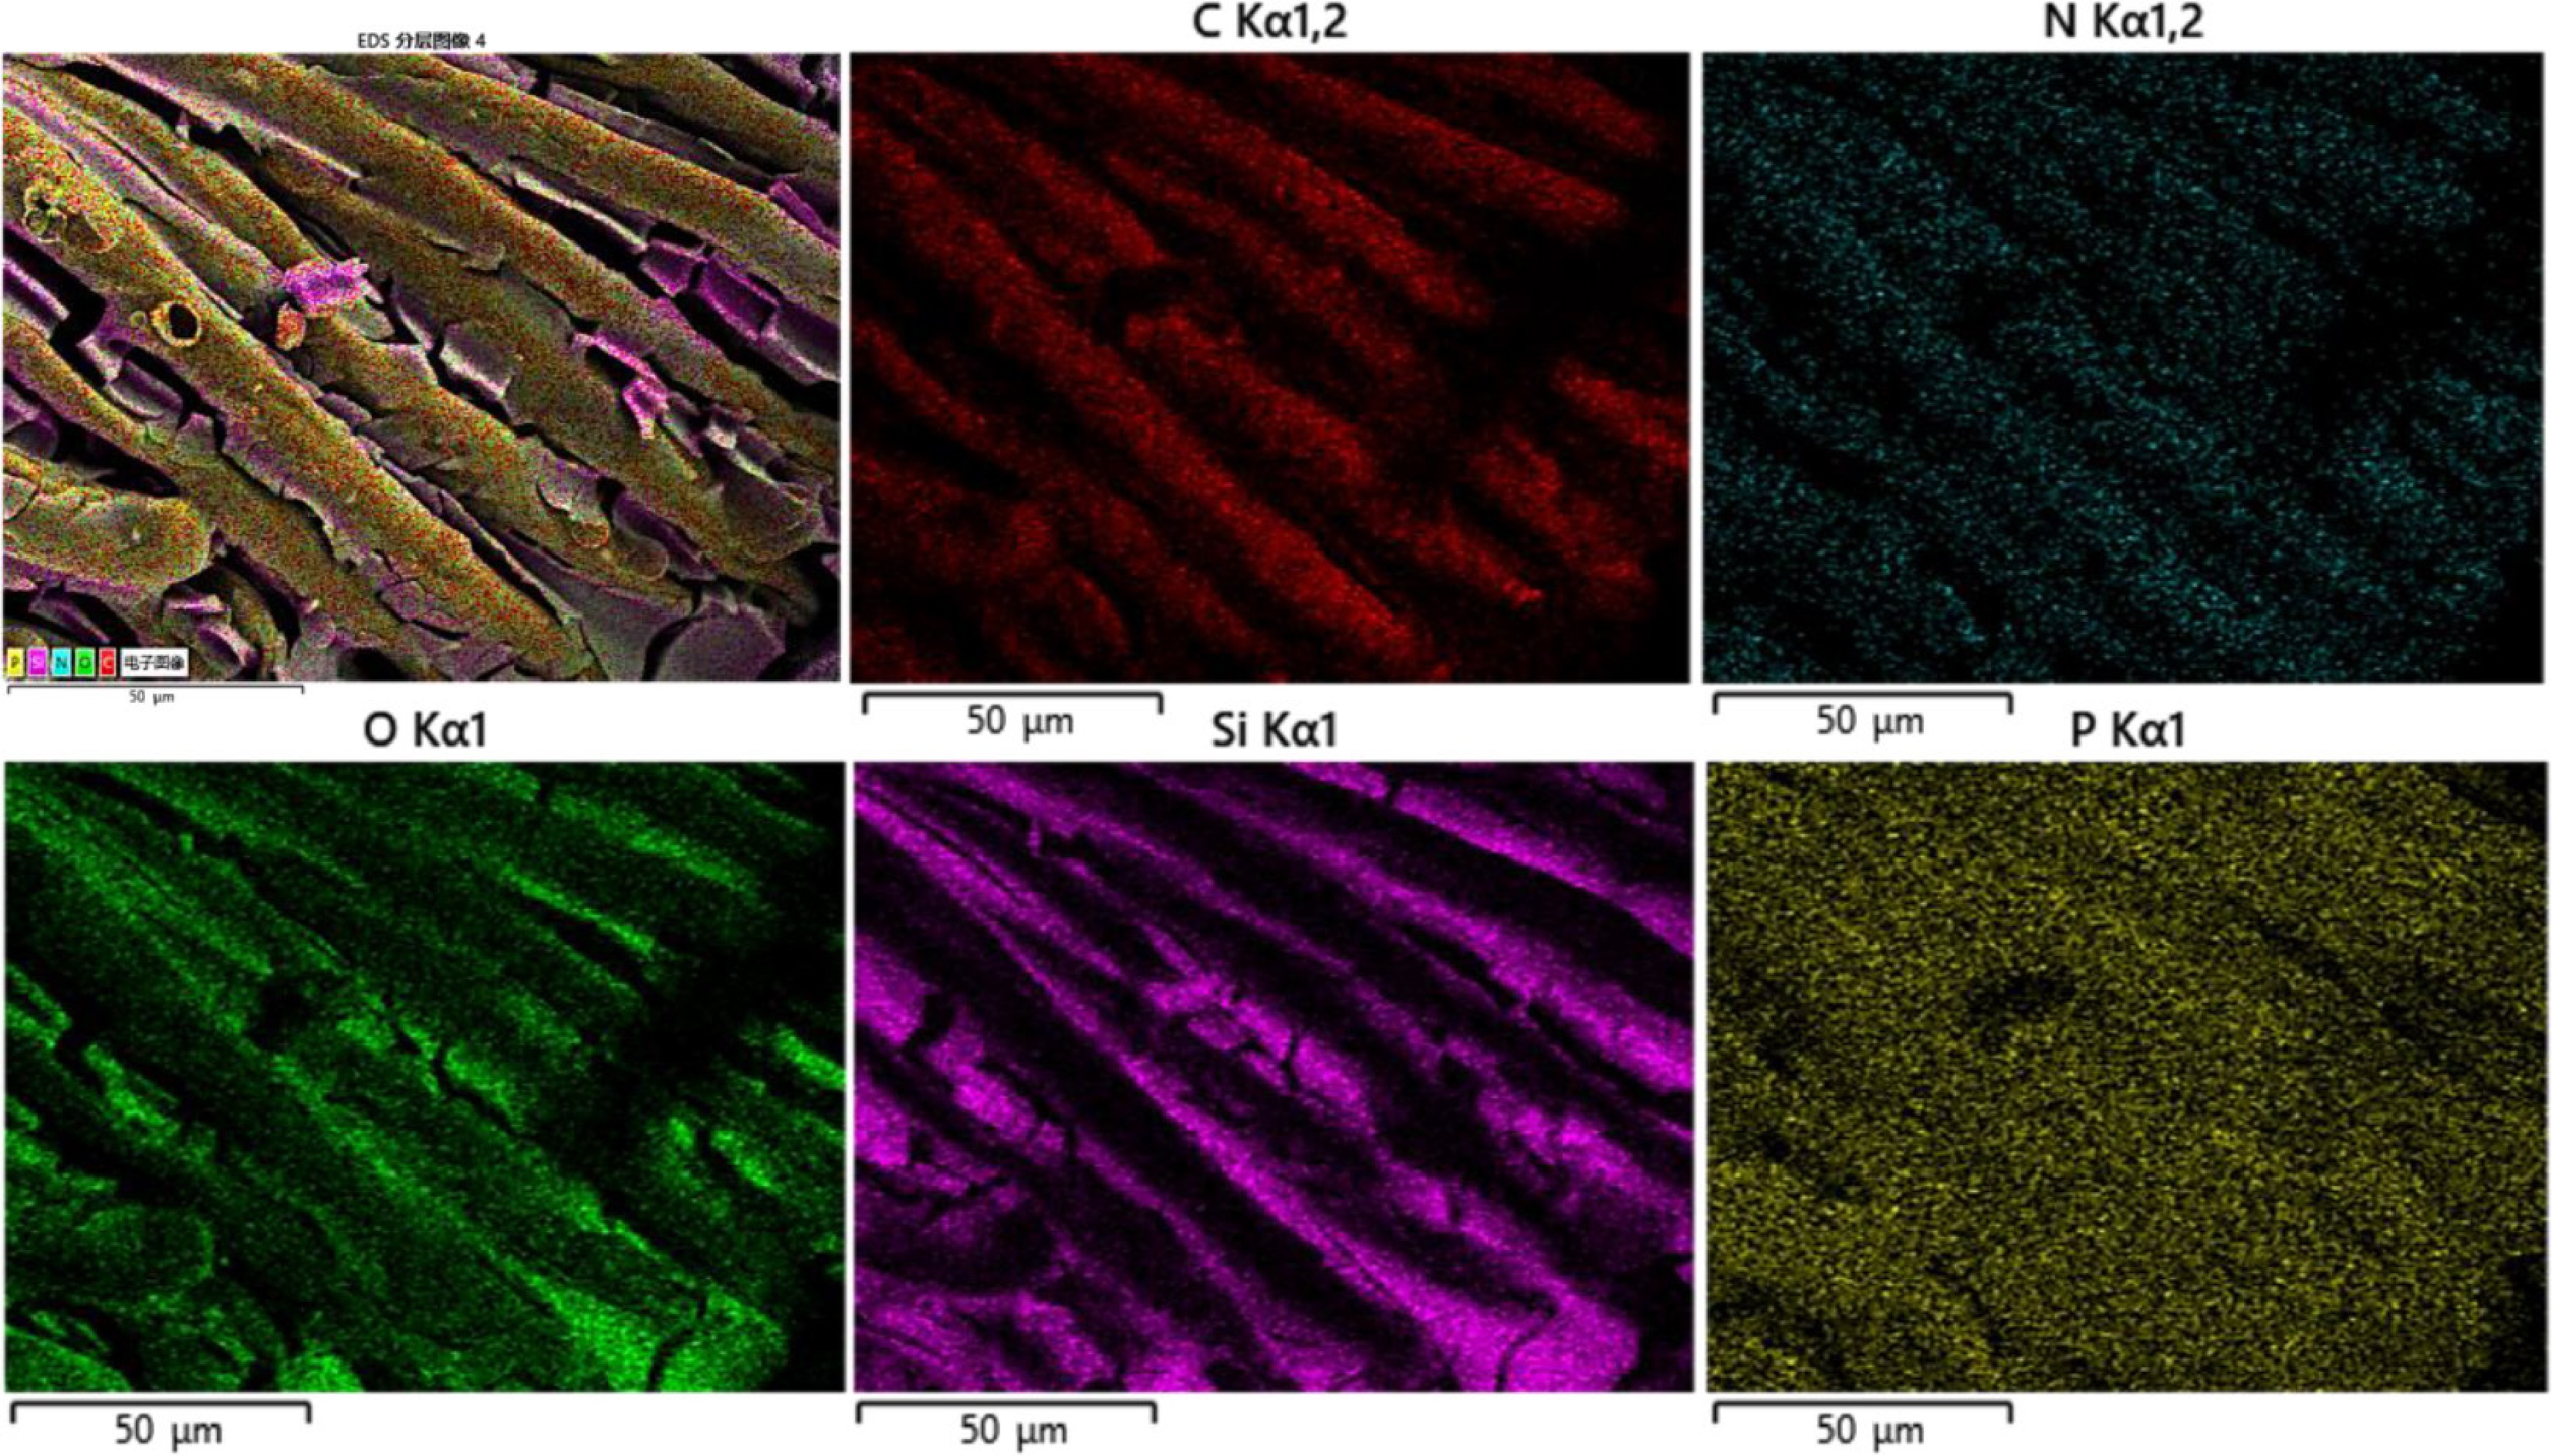
Figure 23.
SiO2-LPU/DCD@COT spot scan of char residue elements.
-
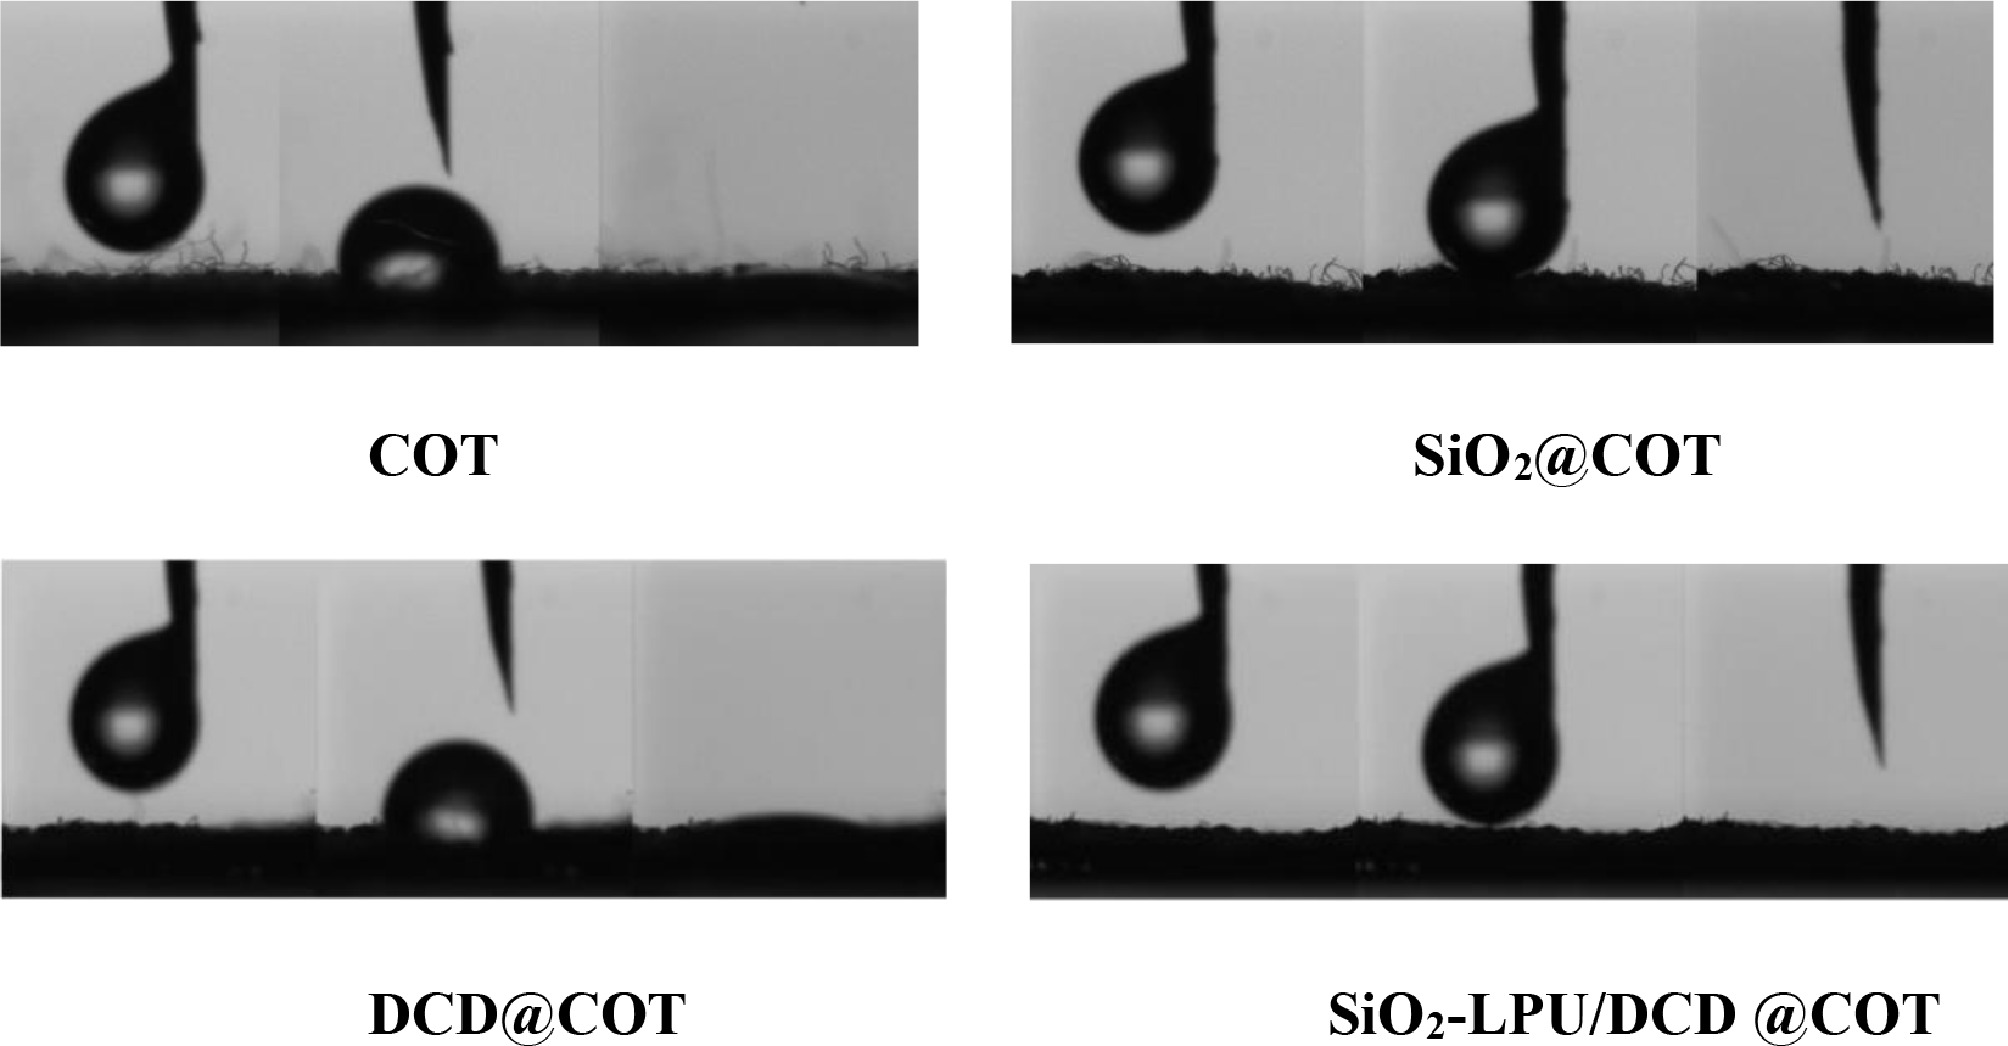
Figure 24.
The WCA test images of COT, SiO2@COT, DCD@COT, and SiO2-LPU/DCD@COT.
-
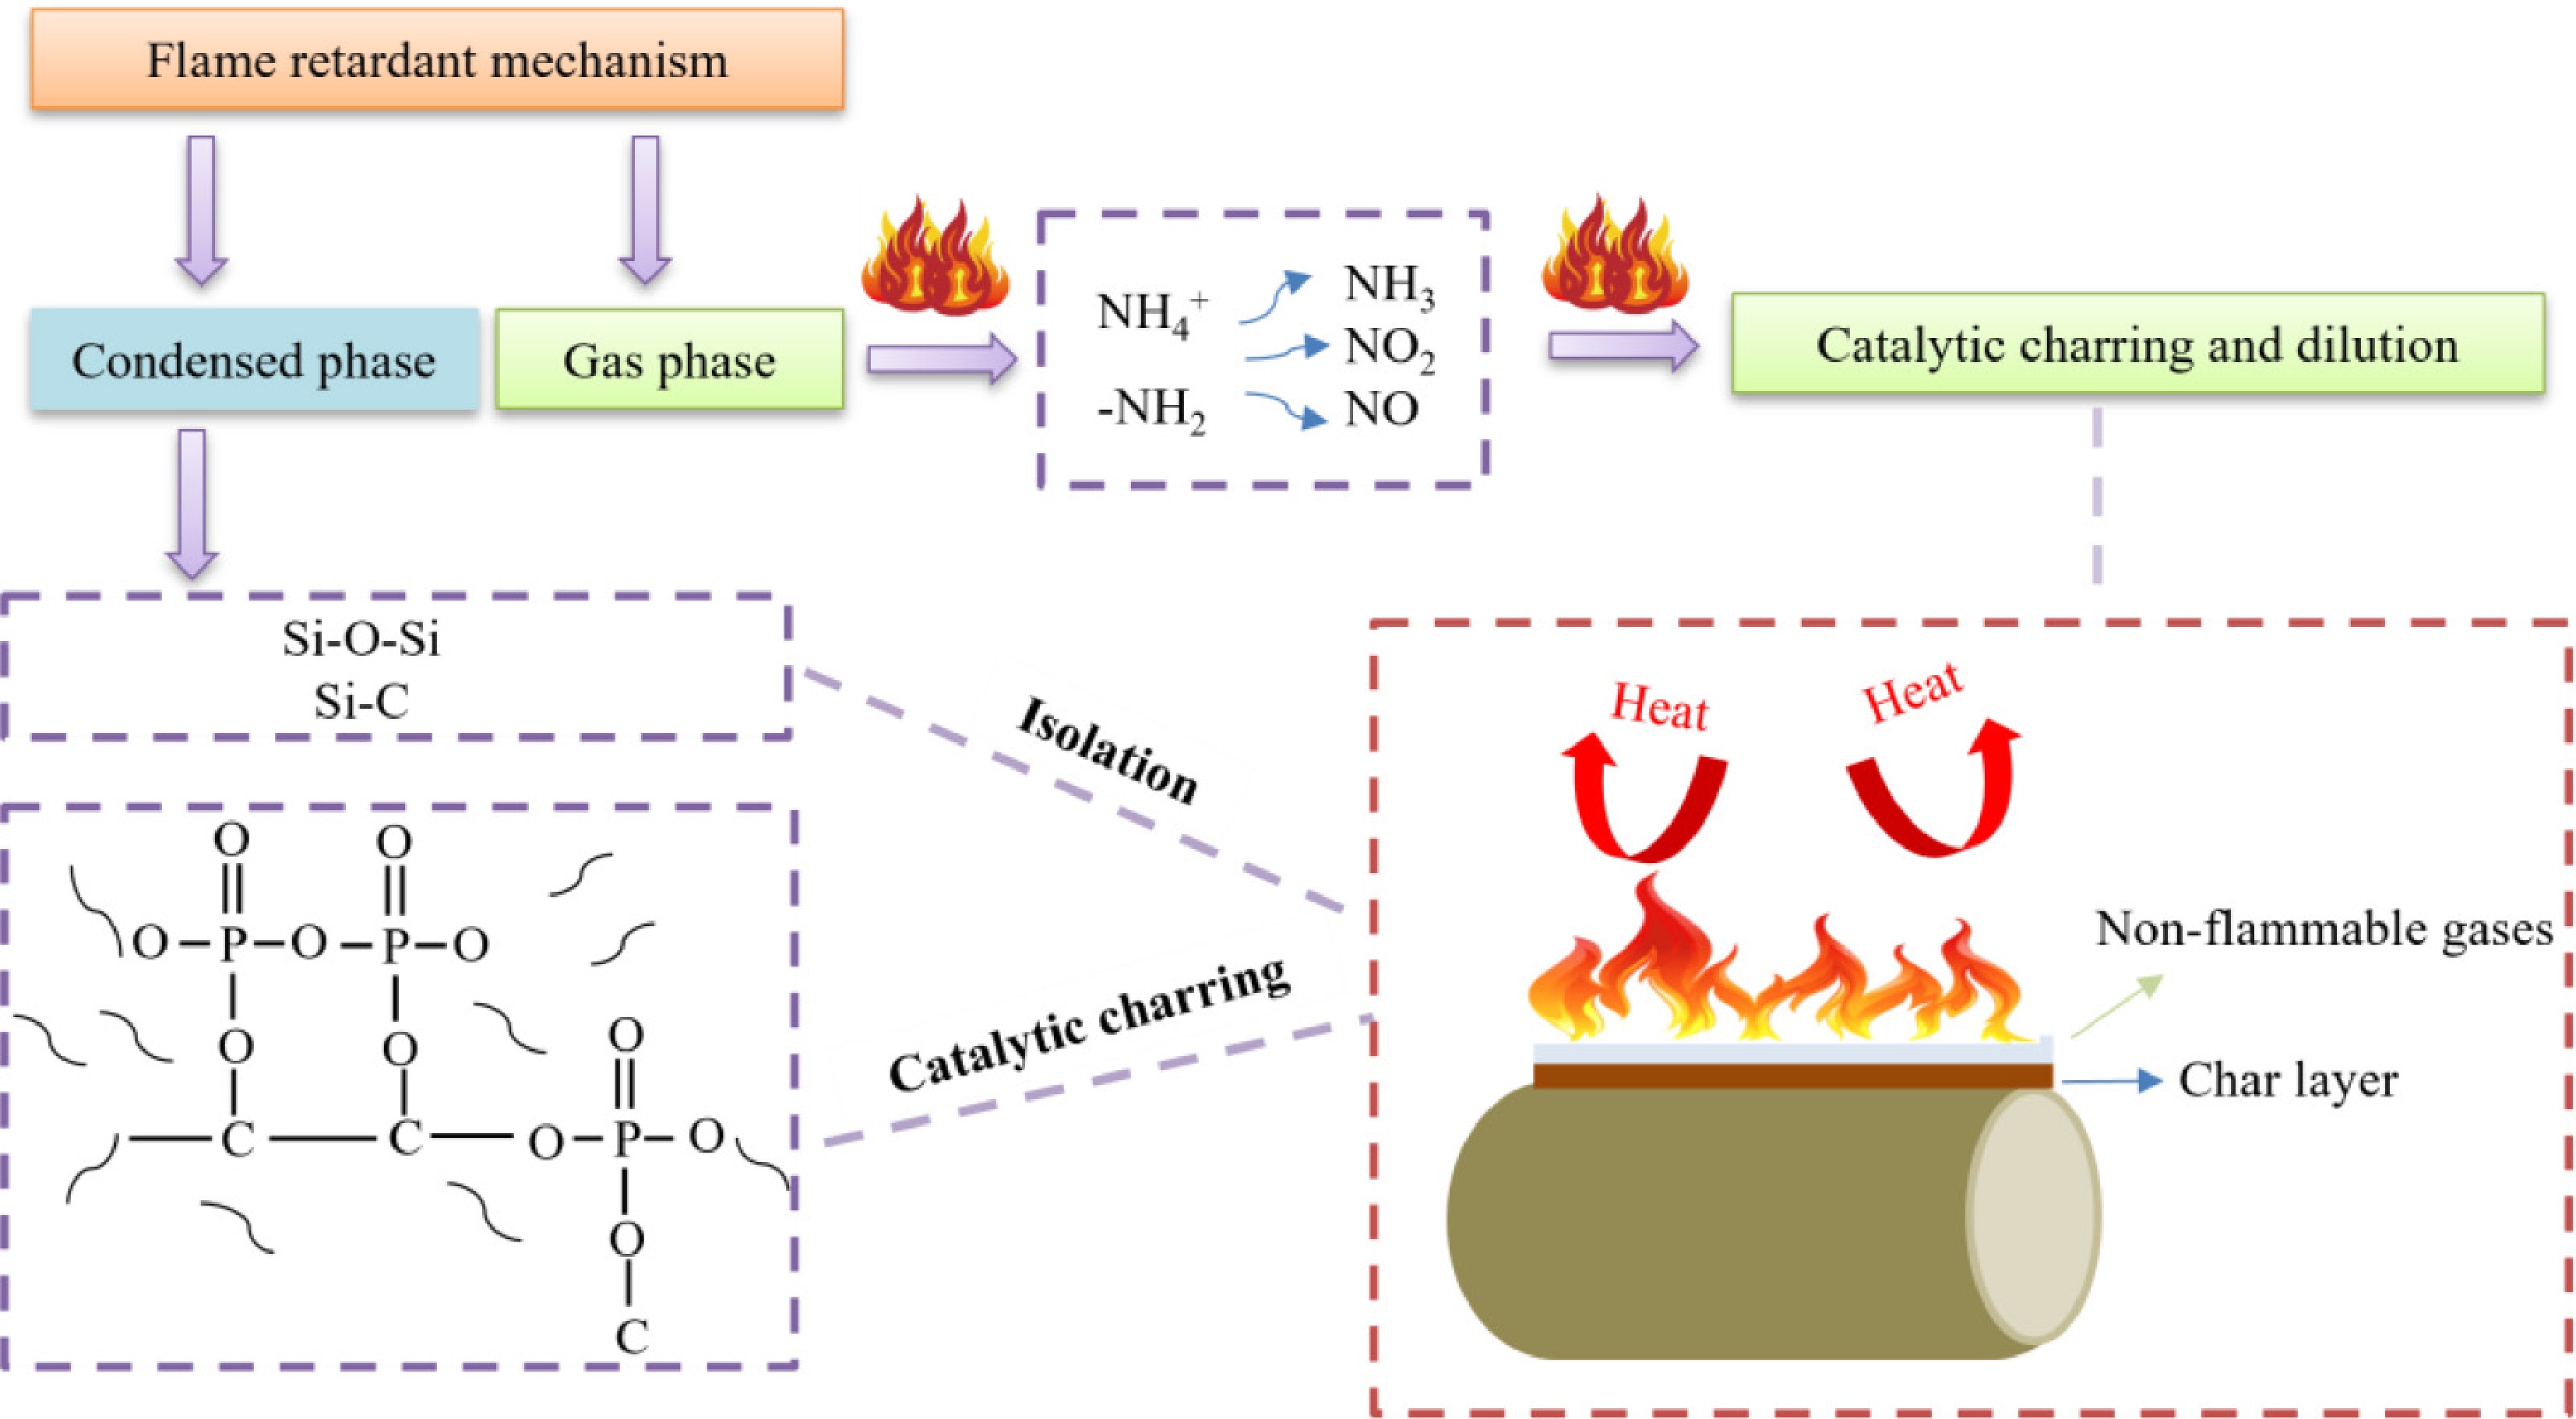
Figure 25.
Possible flame retardant mechanisms during combustion of SiO2-LPU/DCD@COT.
-
Reagent Chemical formula Purity grade Factory owners Quantity contained L-lysine C6H14N2O2 AR Shanghai Aladdin Biochemical Technology Co. 98.0% Phosphoric acid H3PO4 AR Shanghai Aladdin Biochemical Technology Co. 85.0% Urea CH4N2O AR Shanghai Aladdin Biochemical Technology Co. 99.0% Dicyandiamide C2H4N4 CP Shanghai Lingfeng Chemical Reagent Co. 98.0% Table 1.
Raw materials.
-
Sample C1s O1s N1s Si2p P2p COT 74.20 25.80 − − − SiO2@COT 18.96 57.54 − 23.50 − DCD@COT 74.70 18.88 6.42 − − LPU@COT 72.94 22.43 3.92 − 0.72 SiO2-DCD@COT 30.20 43.49 9.13 17.17 − SiO2-LPU@COT 29.53 49.58 2.69 17.43 0.76 LPU/DCD@COT 67.53 19.54 12.32 − 0.61 SiO2-LPU/DCD@COT 31.36 42.11 10.87 15.01 0.64 Table 2.
Element content of the original and flame-retardant finishing cotton fabrics.
-
Fabric samples Tonset (°C) Tmax (°C) Rmax (%/°C) Residue (%) COT 317.00 366.22 2.23 13.96 SiO2@ COT 293.33 359.81 2.21 35.00 DCD@COT 313.17 360.26 1.60 20.76 LPU@COT 251.67 282.67 2.08 37.29 SiO2-DCD@COT 300.33 364.85 1.45 36.07 SiO2-LPU@COT 264.00 294.12 1.38 45.45 LPU/DCD@COT 264.33 302.67 1.61 39.20 SiO2- LPU/DCD@COT 278.50 304.66 0.96 53.37 Table 3.
TG and DTG data of original and flame-retardant finished cotton fabrics under N2.
-
Sample TTI (s) pHRR (kW/m2) TP (s) THR (MJ/m2) TSP (m2/m2) CO2/CO (kg/kg) CR (%) FIGRA (kW/m2·s) COT 10 242.74 32 9.72 0.15 30.17 3.01 7.59 SiO2@ COT 17 167.54 36 6.86 0.04 20.21 25.15 4.65 DCD@COT 10 210.01 28 7.59 0.07 103.15 3.50 7.50 LPU@COT 5 58.59 14 5.36 0.52 42.62 6.94 4.19 SiO2-DCD@COT 14 149.06 30 6.64 0.06 93.23 27.04 4.97 SiO2-LPU@COT 8 77.80 32 4.84 0.13 24.41 31.71 2.43 LPU/DCD@COT − 32.72 83 5.68 0.66 − 6.47 0.39 SiO2-LPU/DCD@COT 9 32.04 72 4.95 0.55 16.25 33.16 0.45 Table 4.
Cone calorimetry test results of original and flame-retardant finished cotton fabrics.
-
Sample name LOI (%) ΔLOI Δm
(g)ΔLOI/Δm
(%/g)Flame retardant
gradeSE COT 18.4±0.1 − − − flammable − SiO2@COT 20.4±0.1 2.0 1.83 1.09 combustible − DCD@COT 19.6±0.1 1.2 0.20 6.00 flammable − LPU@COT 26.7±0.1 8.3 0.66 12.58 refractory − SiO2-DCD@COT 22.4±0.1 4.0 1.22 3.28 combustible 1.25 SiO2-LPU@COT 29.5±0.1 11.1 1.61 6.89 non-flammable 1.08 LPU/DCD@COT 31.9±0.1 13.5 0.82 16.46 non-flammable 1.42 SiO2-LPU/DCD@COT 34.3±0.1 15.9 2.25 7.07 non-flammable 1.03 Table 5.
LOI experimental data of original and flame-retardant-treated cotton fabrics.
-
Sample T1 (s) T2 (s) CL (cm) COTT 14.8 34.5 30 SiO2@COT 25.2 1.5 30 DCD@COT 22.1 57.3 30 LPU@COT 2.3 0 9.2 SiO2-DCD@COT 16.5 3.1 30 SiO2-LPU@COT 0 0 6.3 LPU/DCD@COT 0 0 5.5 SiO2- LPU/DCD @COT 0 0 5.1 Table 6.
Vertical burning test data of original and flame-retardant finished cotton fabrics.
Figures
(25)
Tables
(6)