-
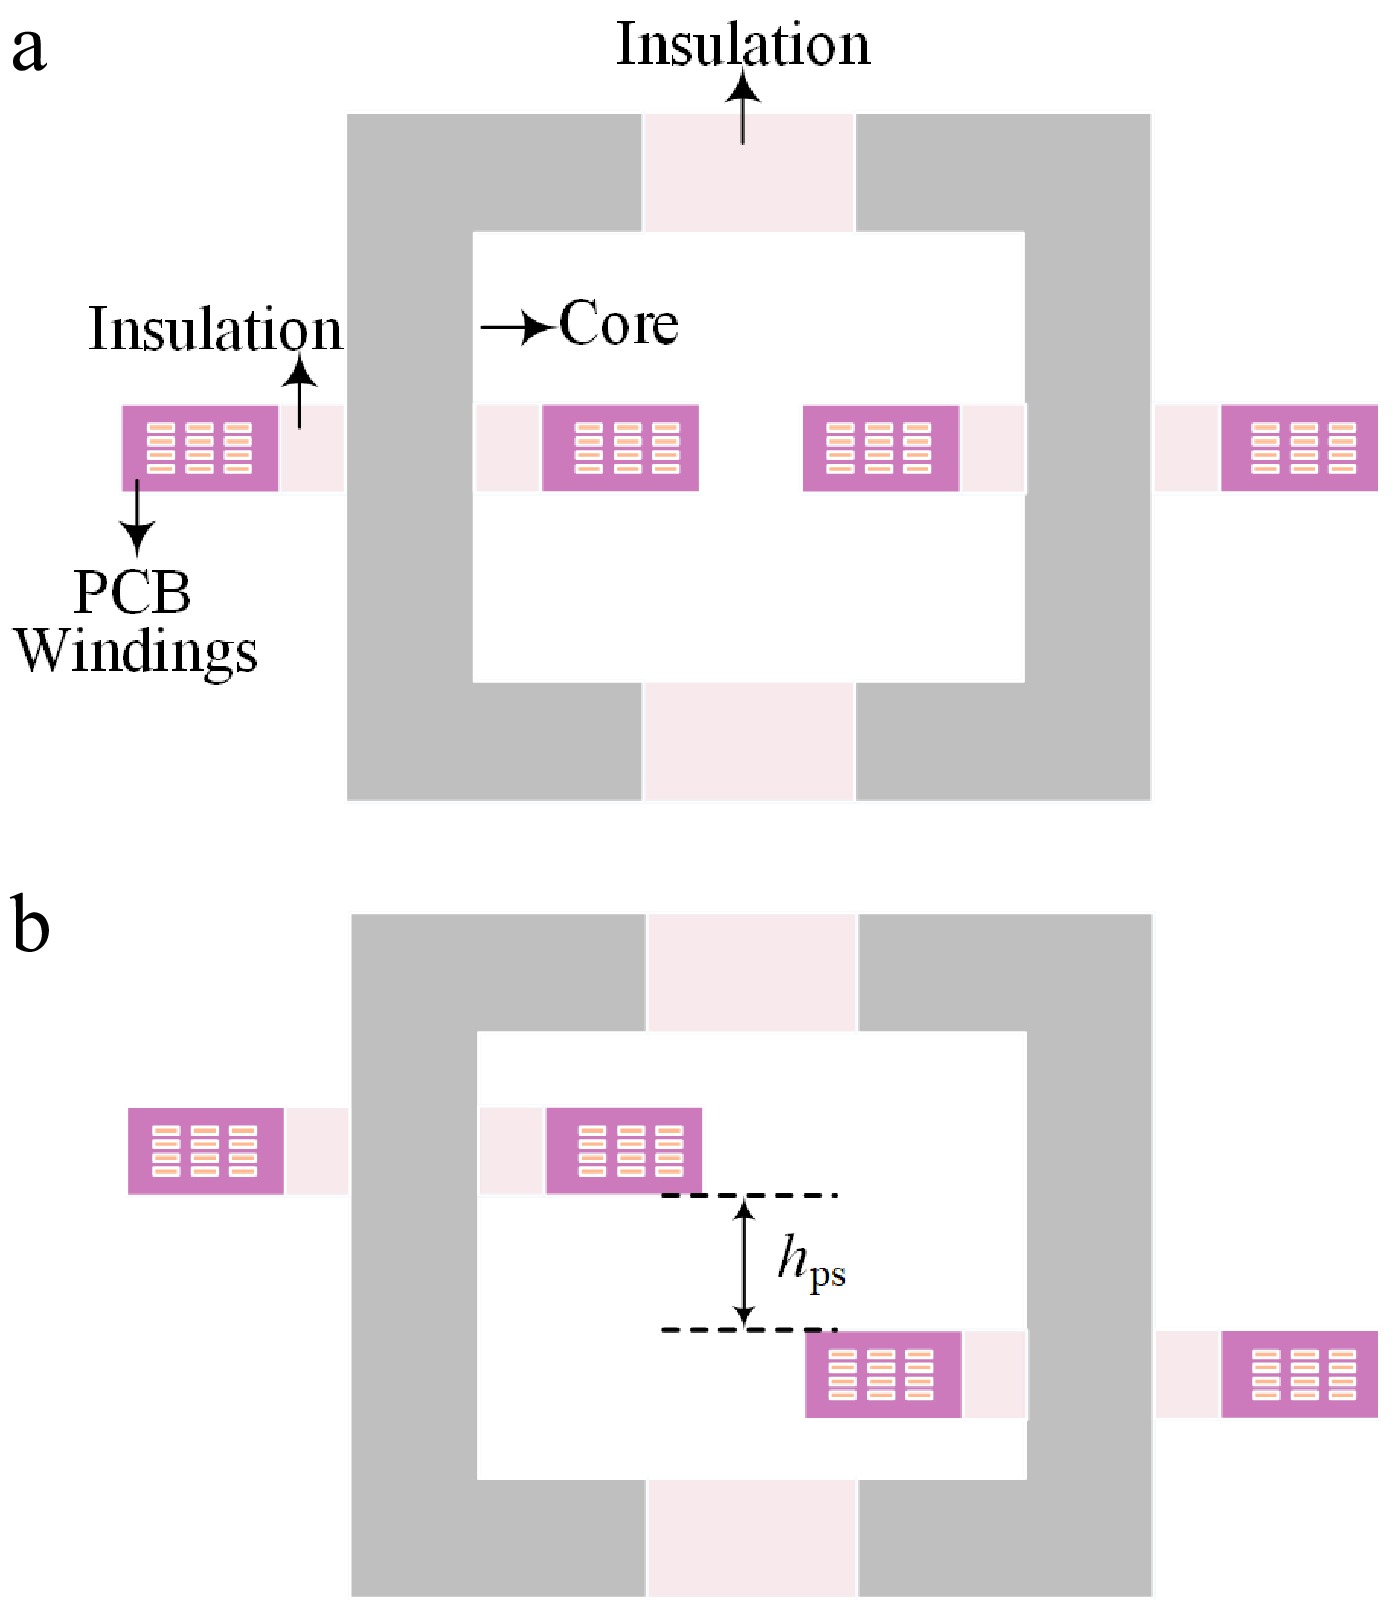
Figure 1.
Derivation of the basic structure of the isolation unit. (a) Not arranged in an alternating pattern. (b) Interlaced arrangement.
-
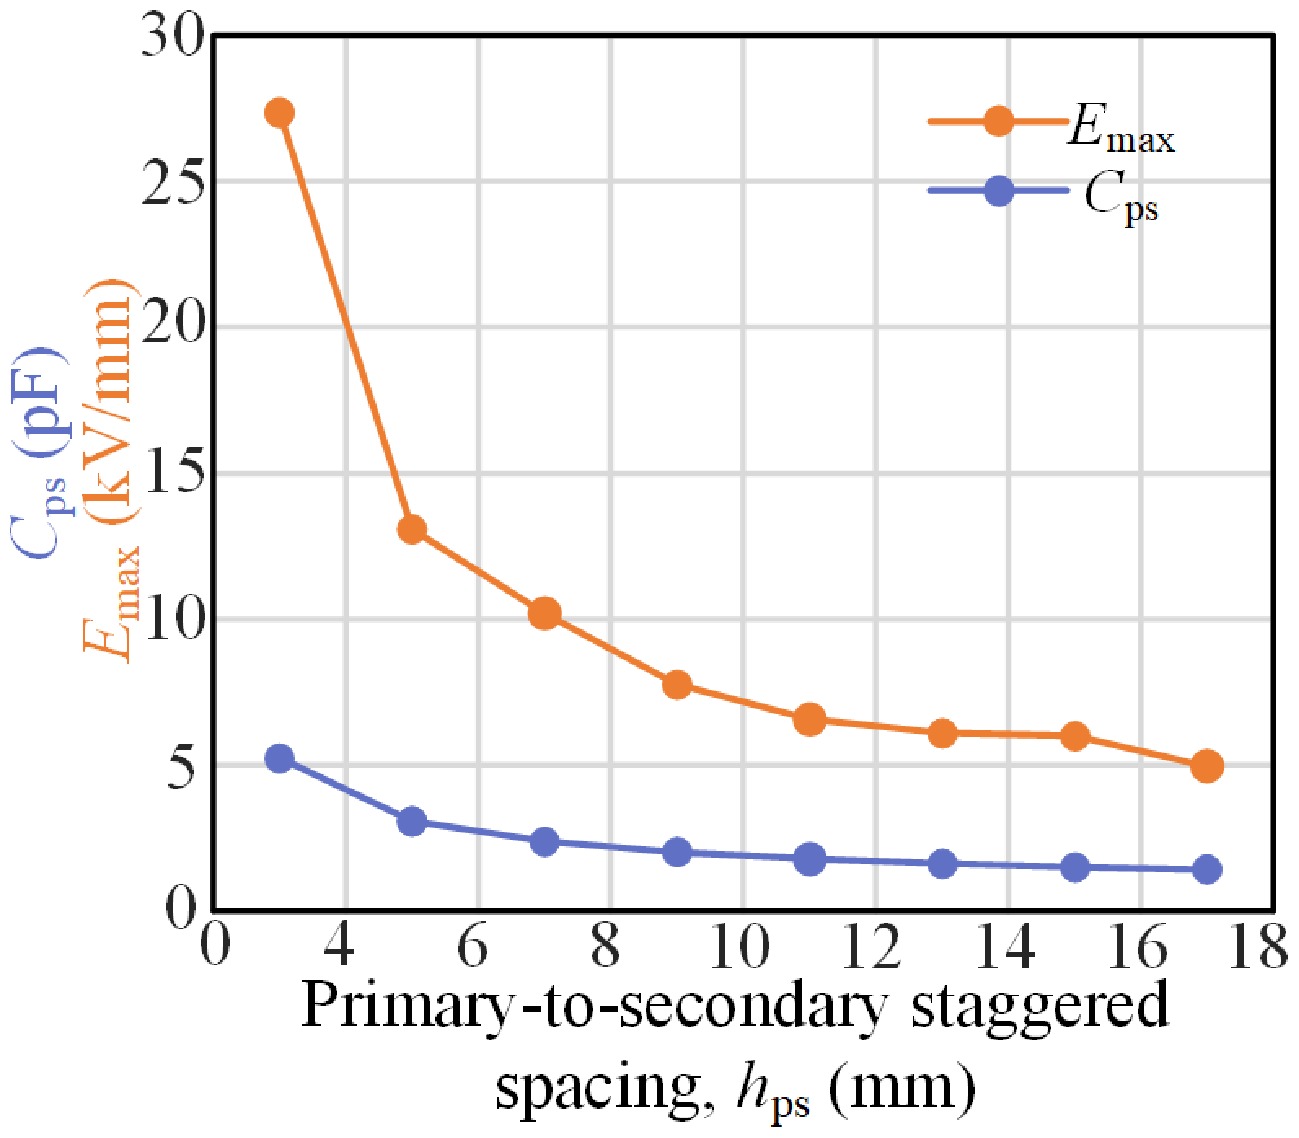
Figure 2.
Impact of hps on coupling capacitor and electric field.
-
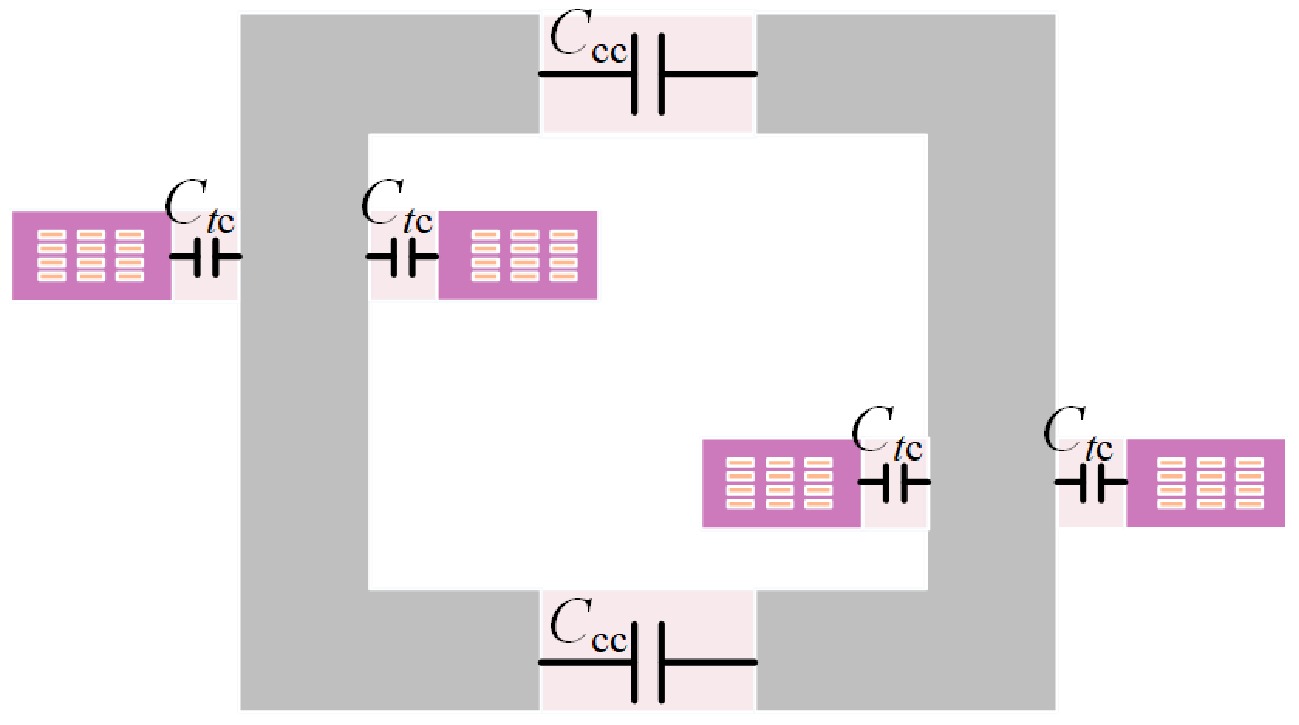
Figure 3.
Parasitic capacitance distribution.
-
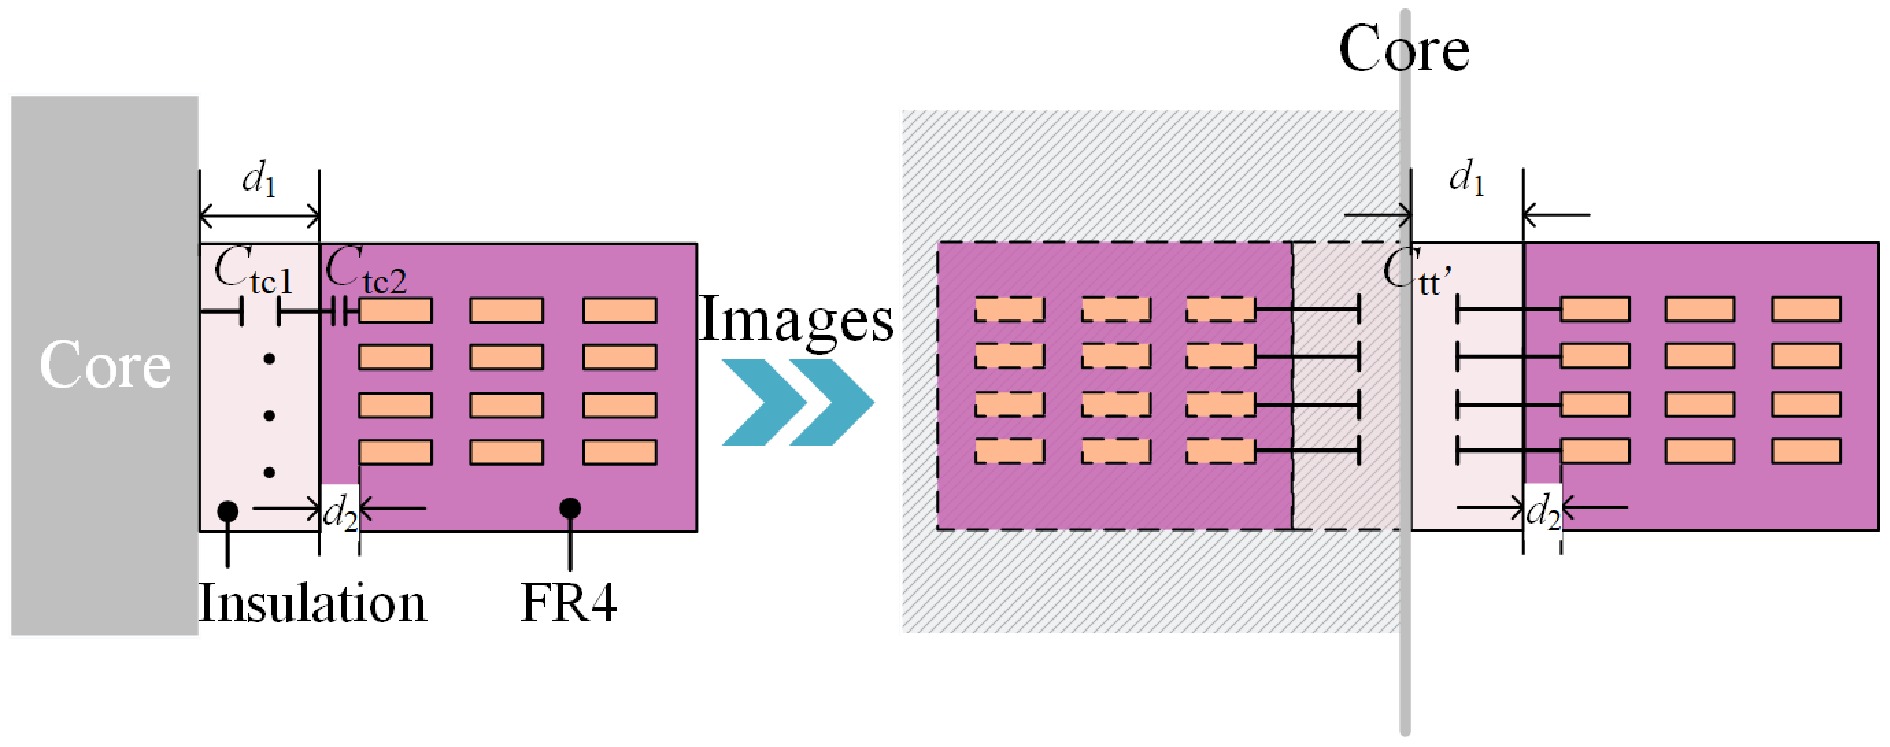
Figure 4.
Mirror image equivalent of the capacitance Ctc between the winding and the core.
-
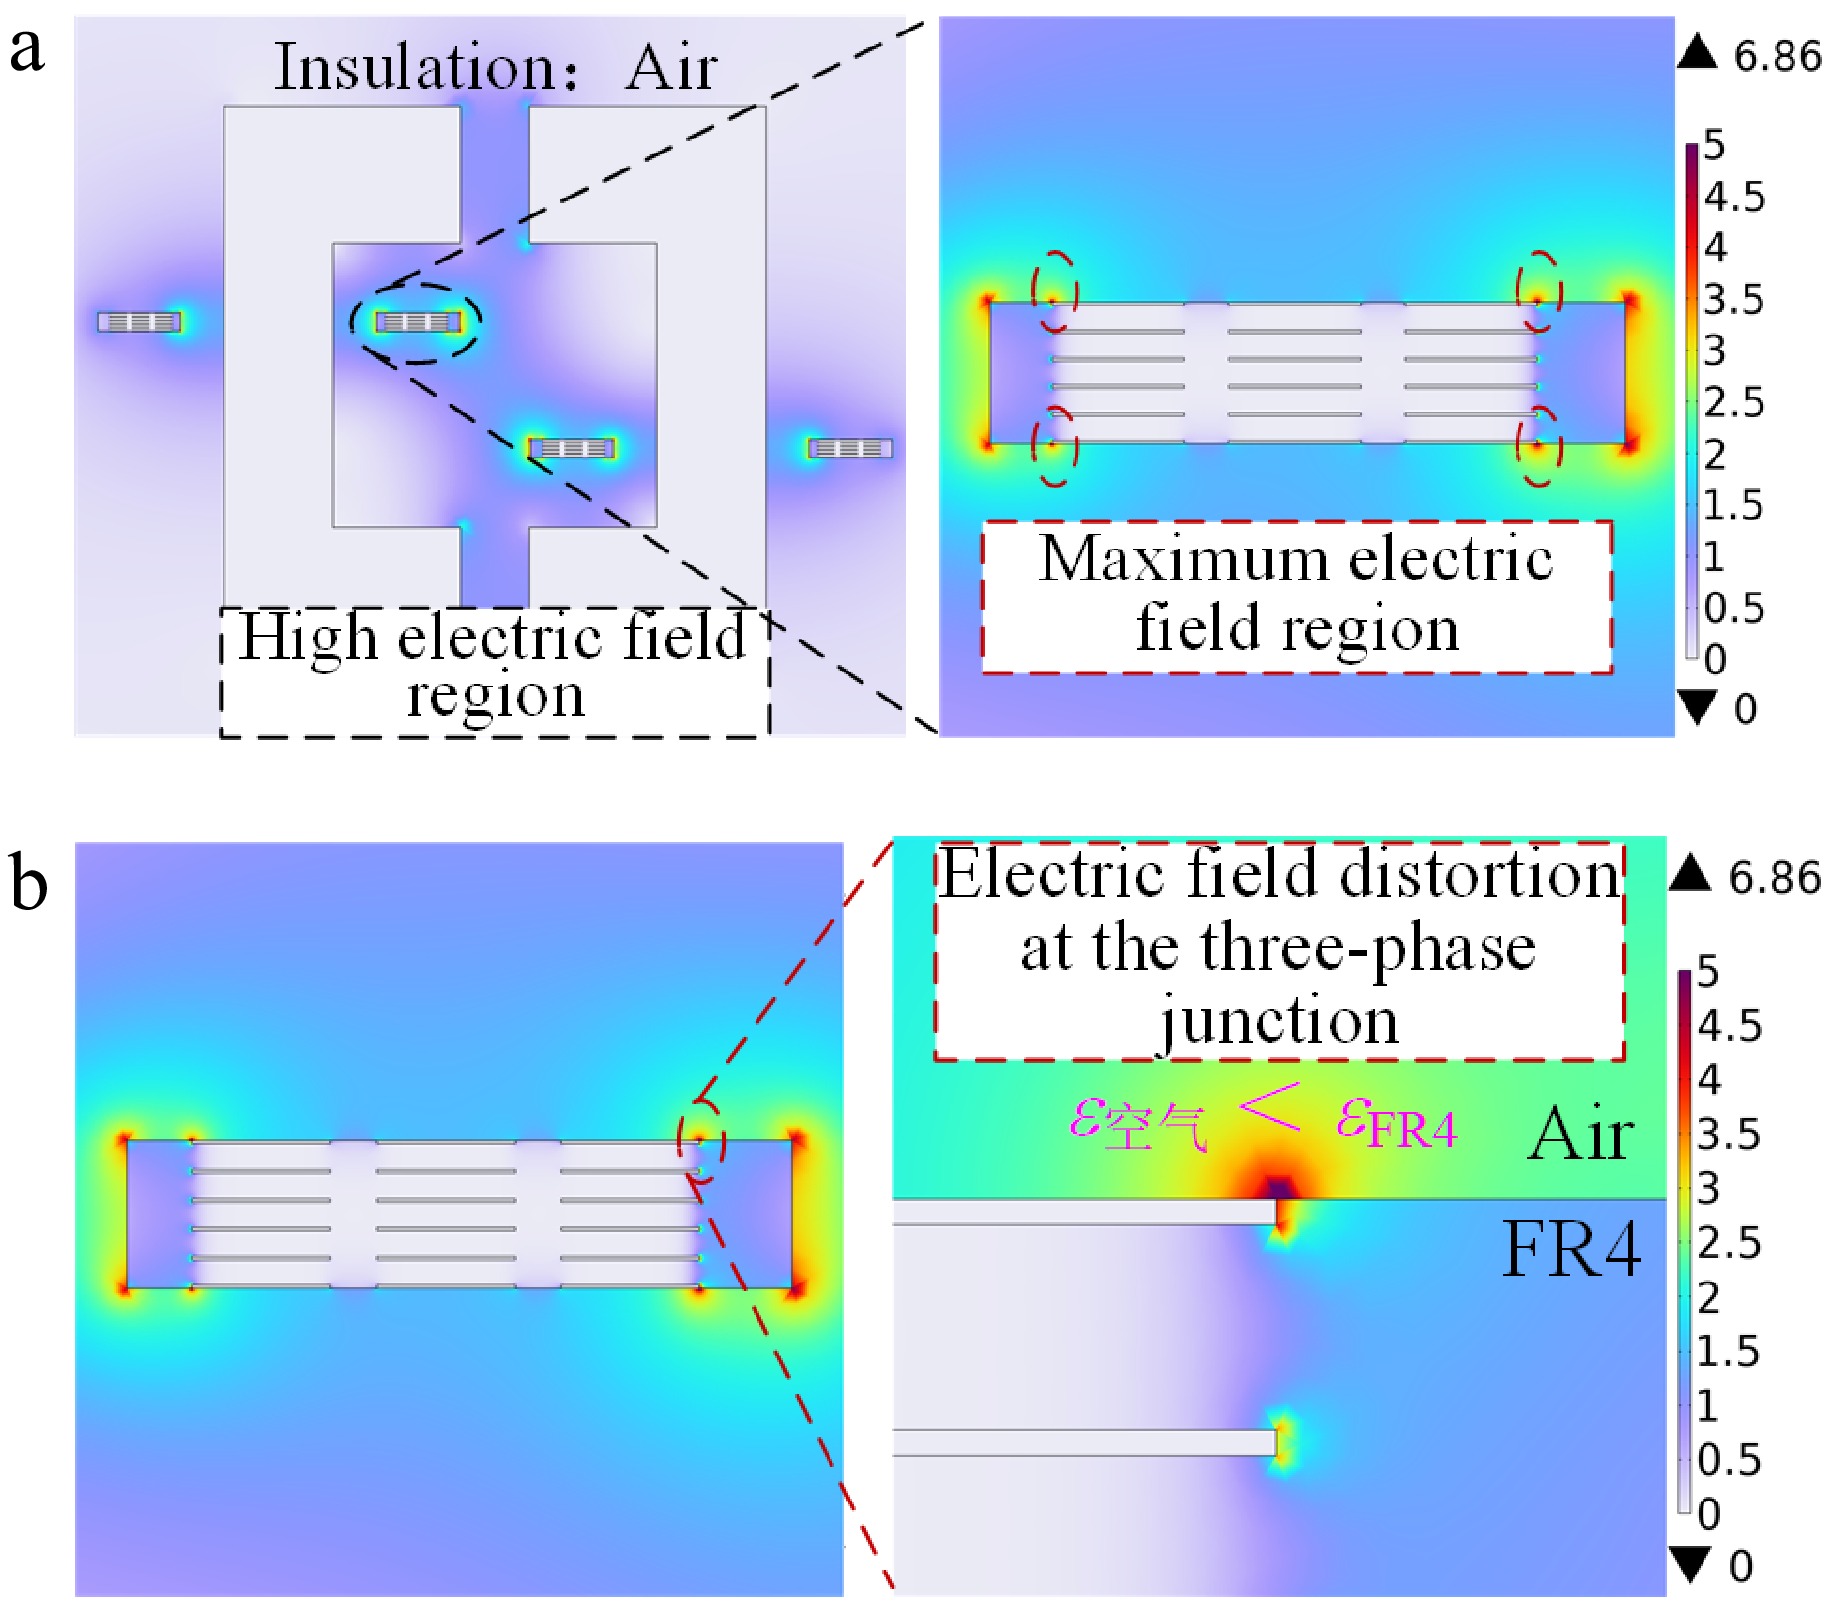
Figure 5.
Electric field distribution in key areas of the isolation unit. (a) Details of the electric field distribution of the isolation unit. (b) Three-phase point distorted electric field.
-
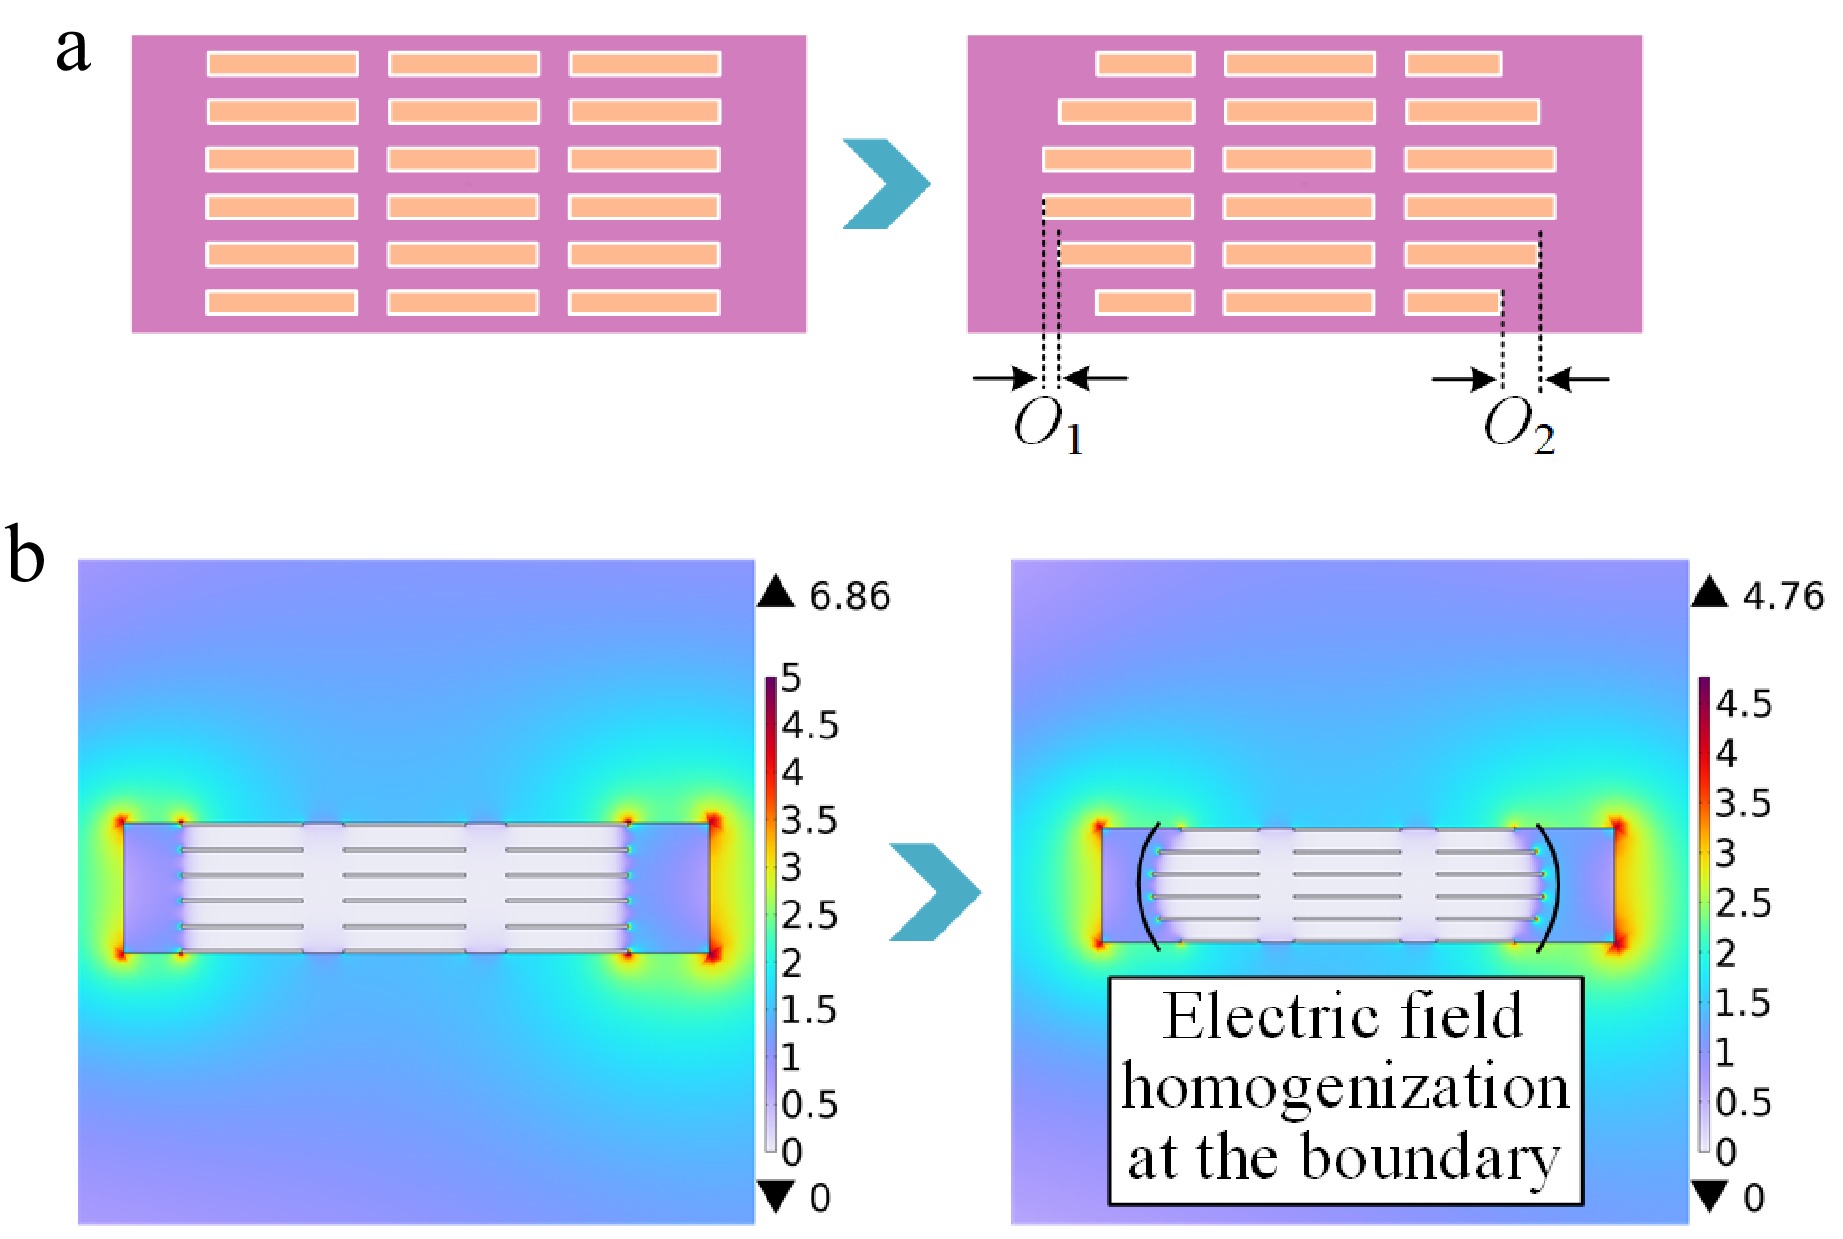
Figure 6.
Boundary electric field homogenization and parameter scanning. (a) Boundary homogenization. (b) Boundary electric field parameter scanning.
-
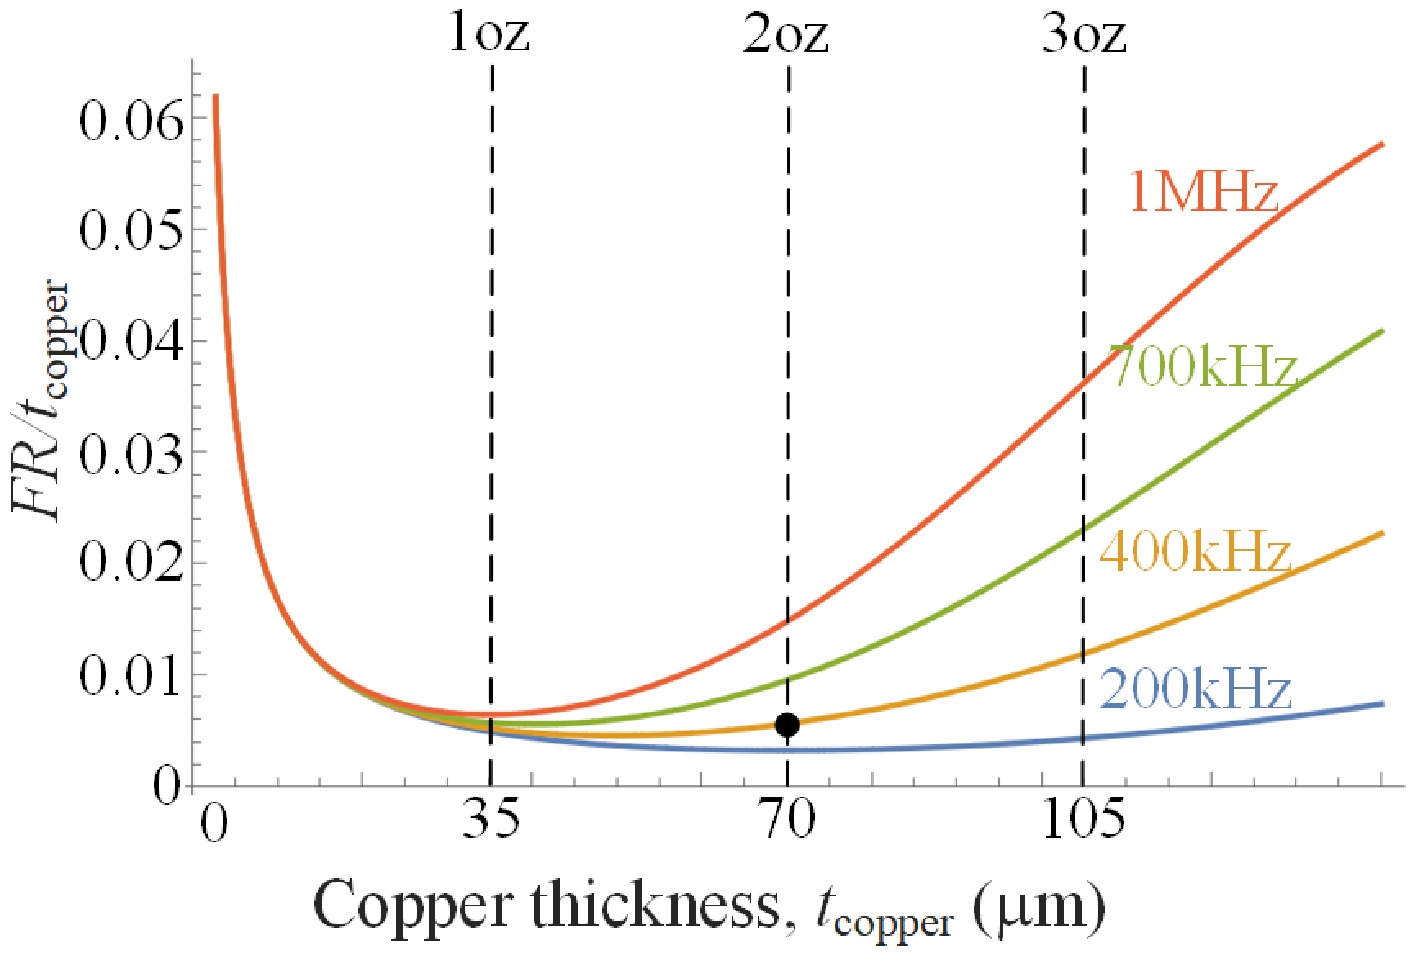
Figure 7.
Relationship between AC coefficient FR and winding thickness of tcopper at different frequencies.
-
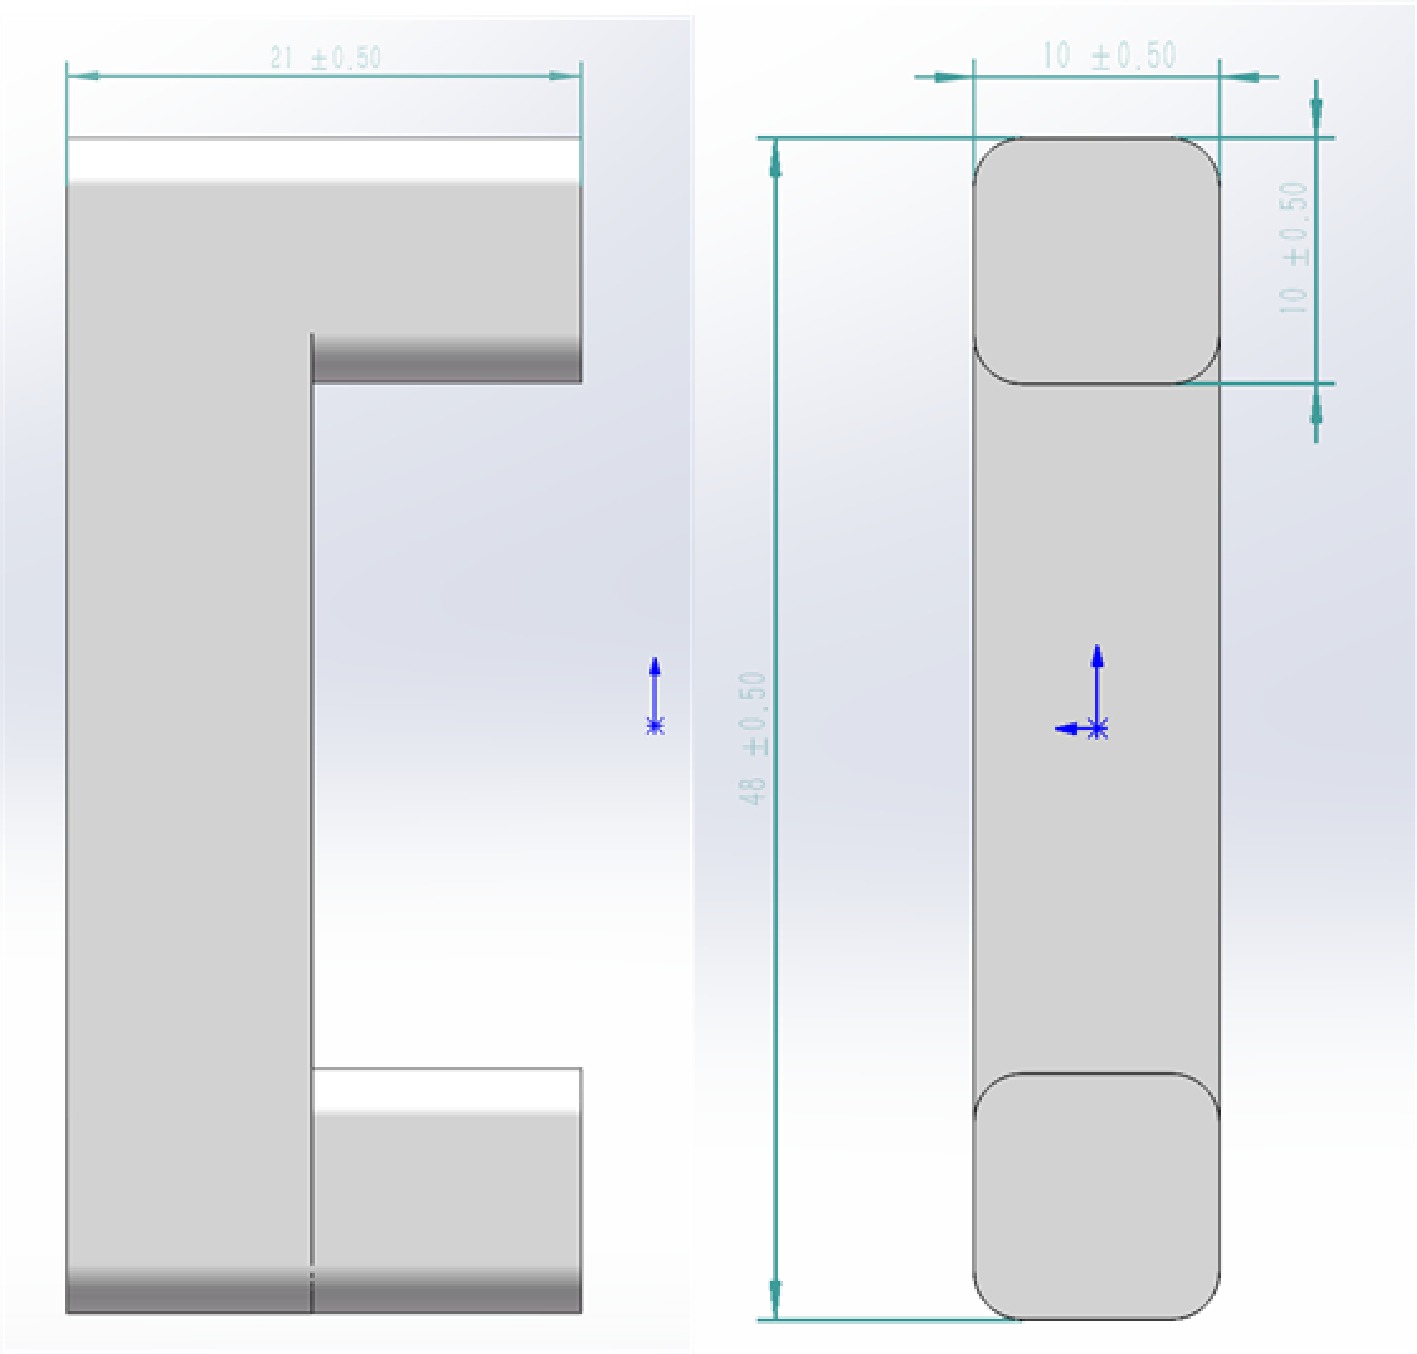
Figure 8.
Core structure.
-
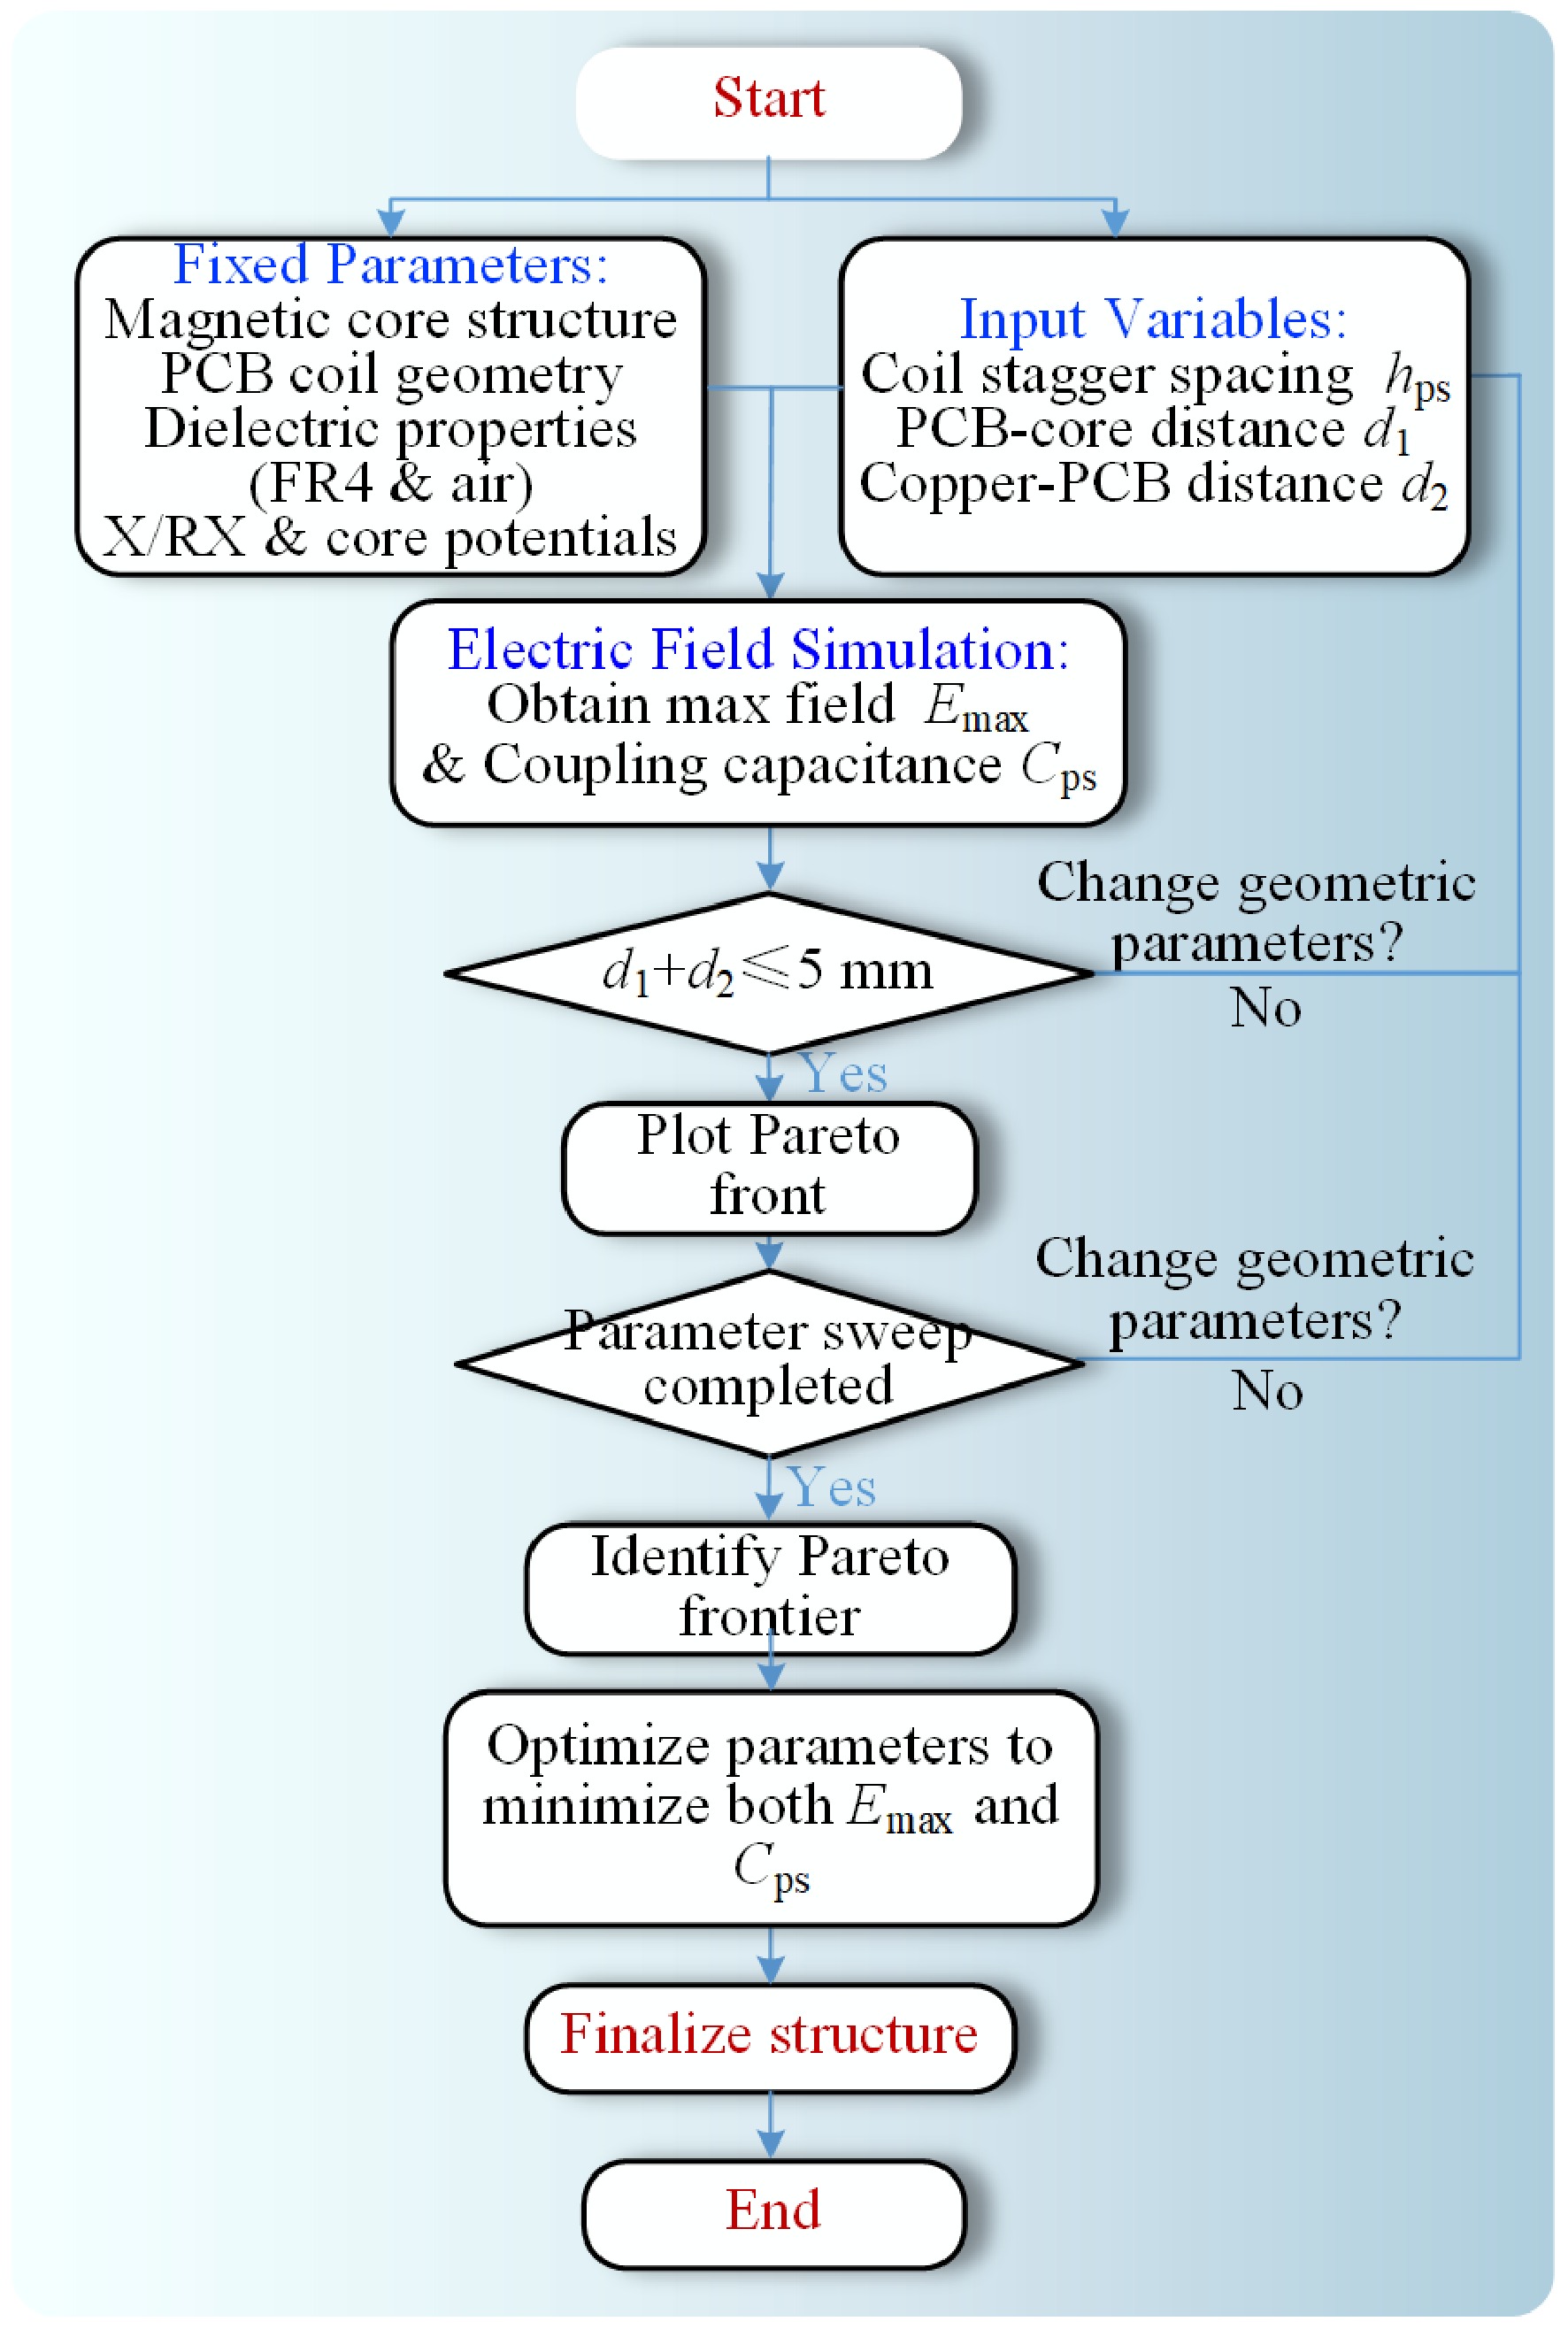
Figure 9.
Multi-objective flowchart.
-
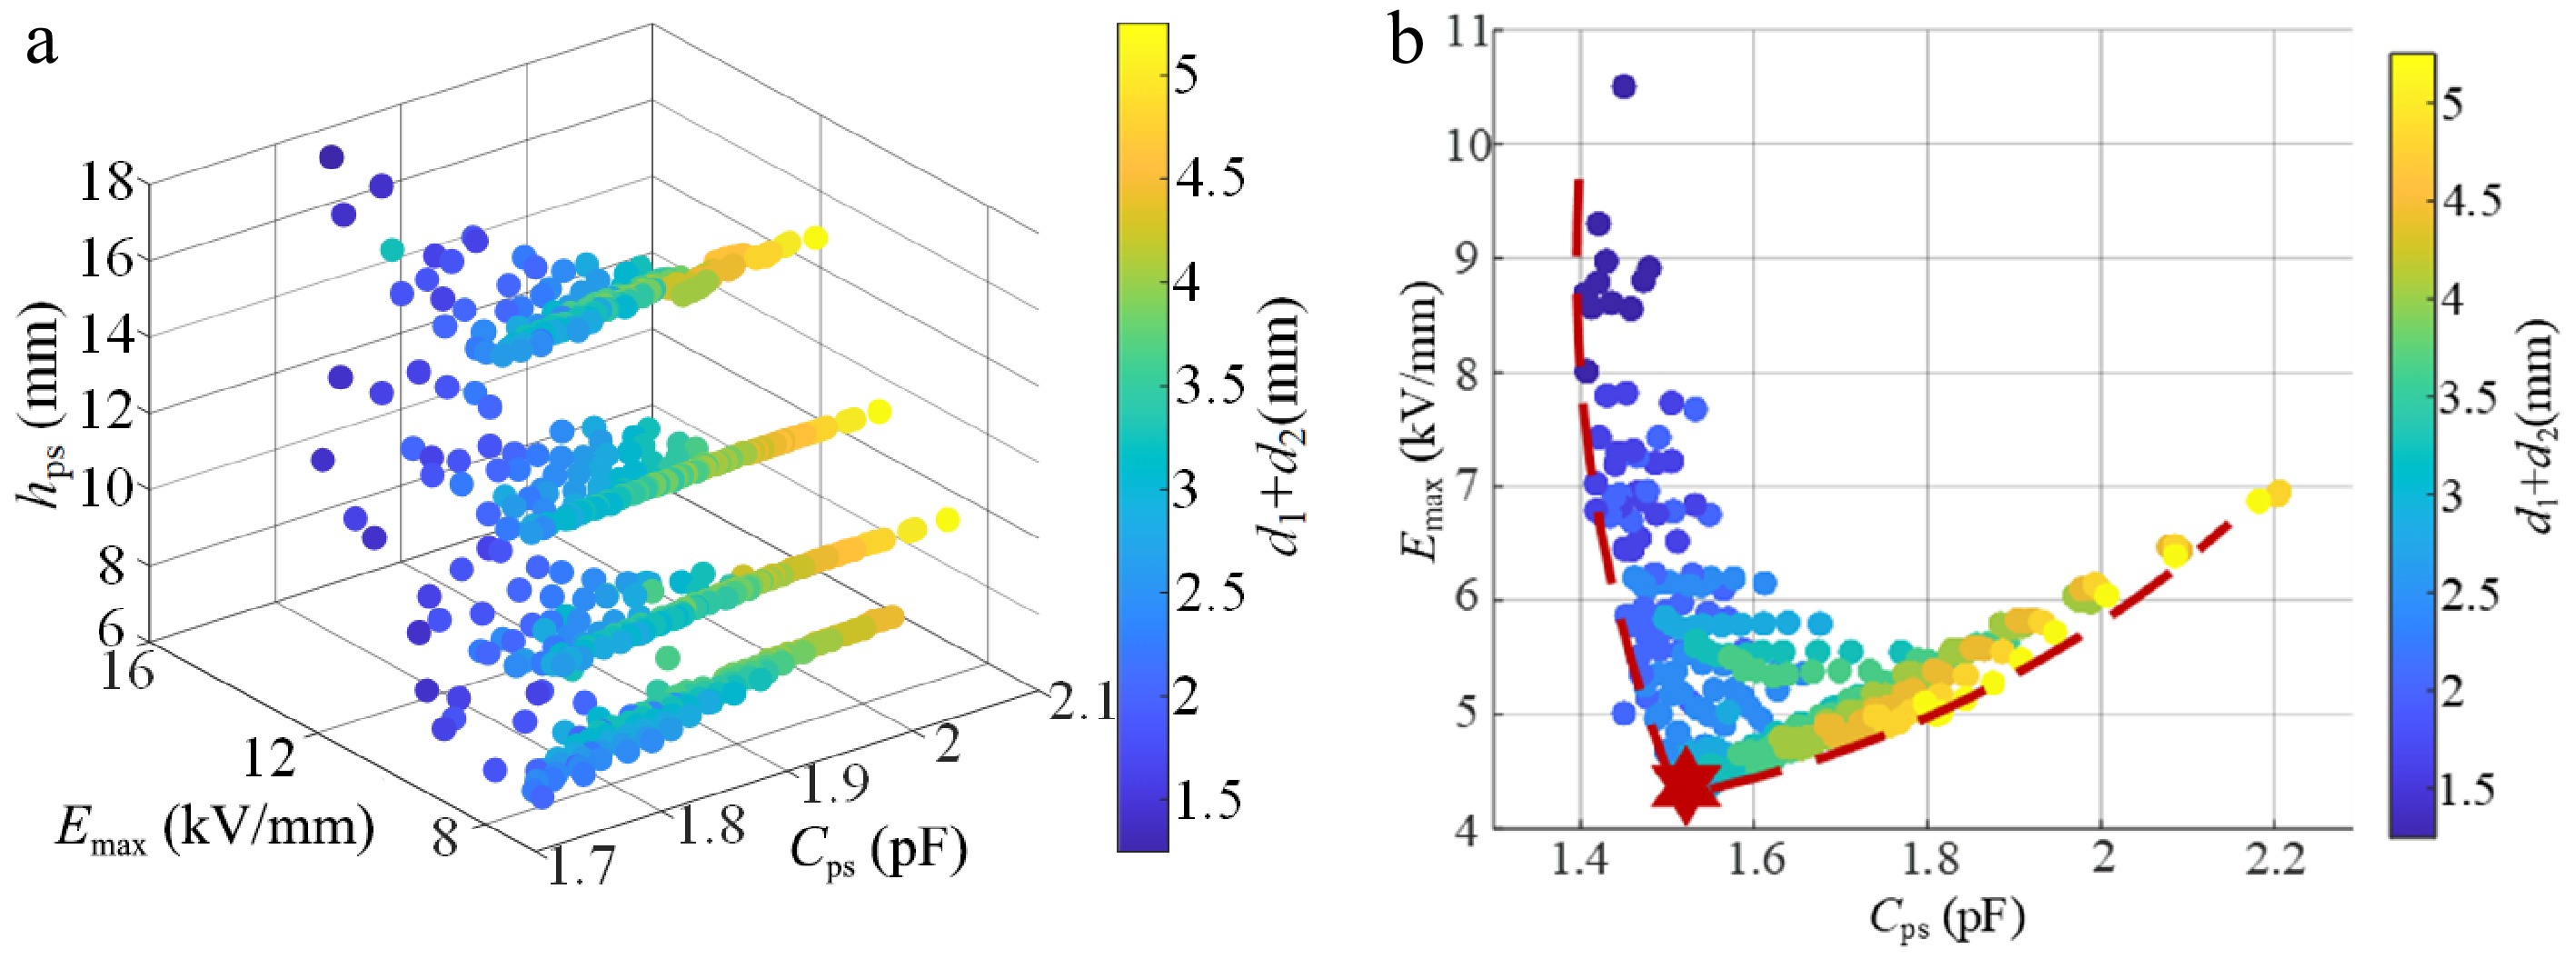
Figure 10.
Multi-objective optimal result. (a) Pareto. (b) Selection of the optimal parameter group.
-
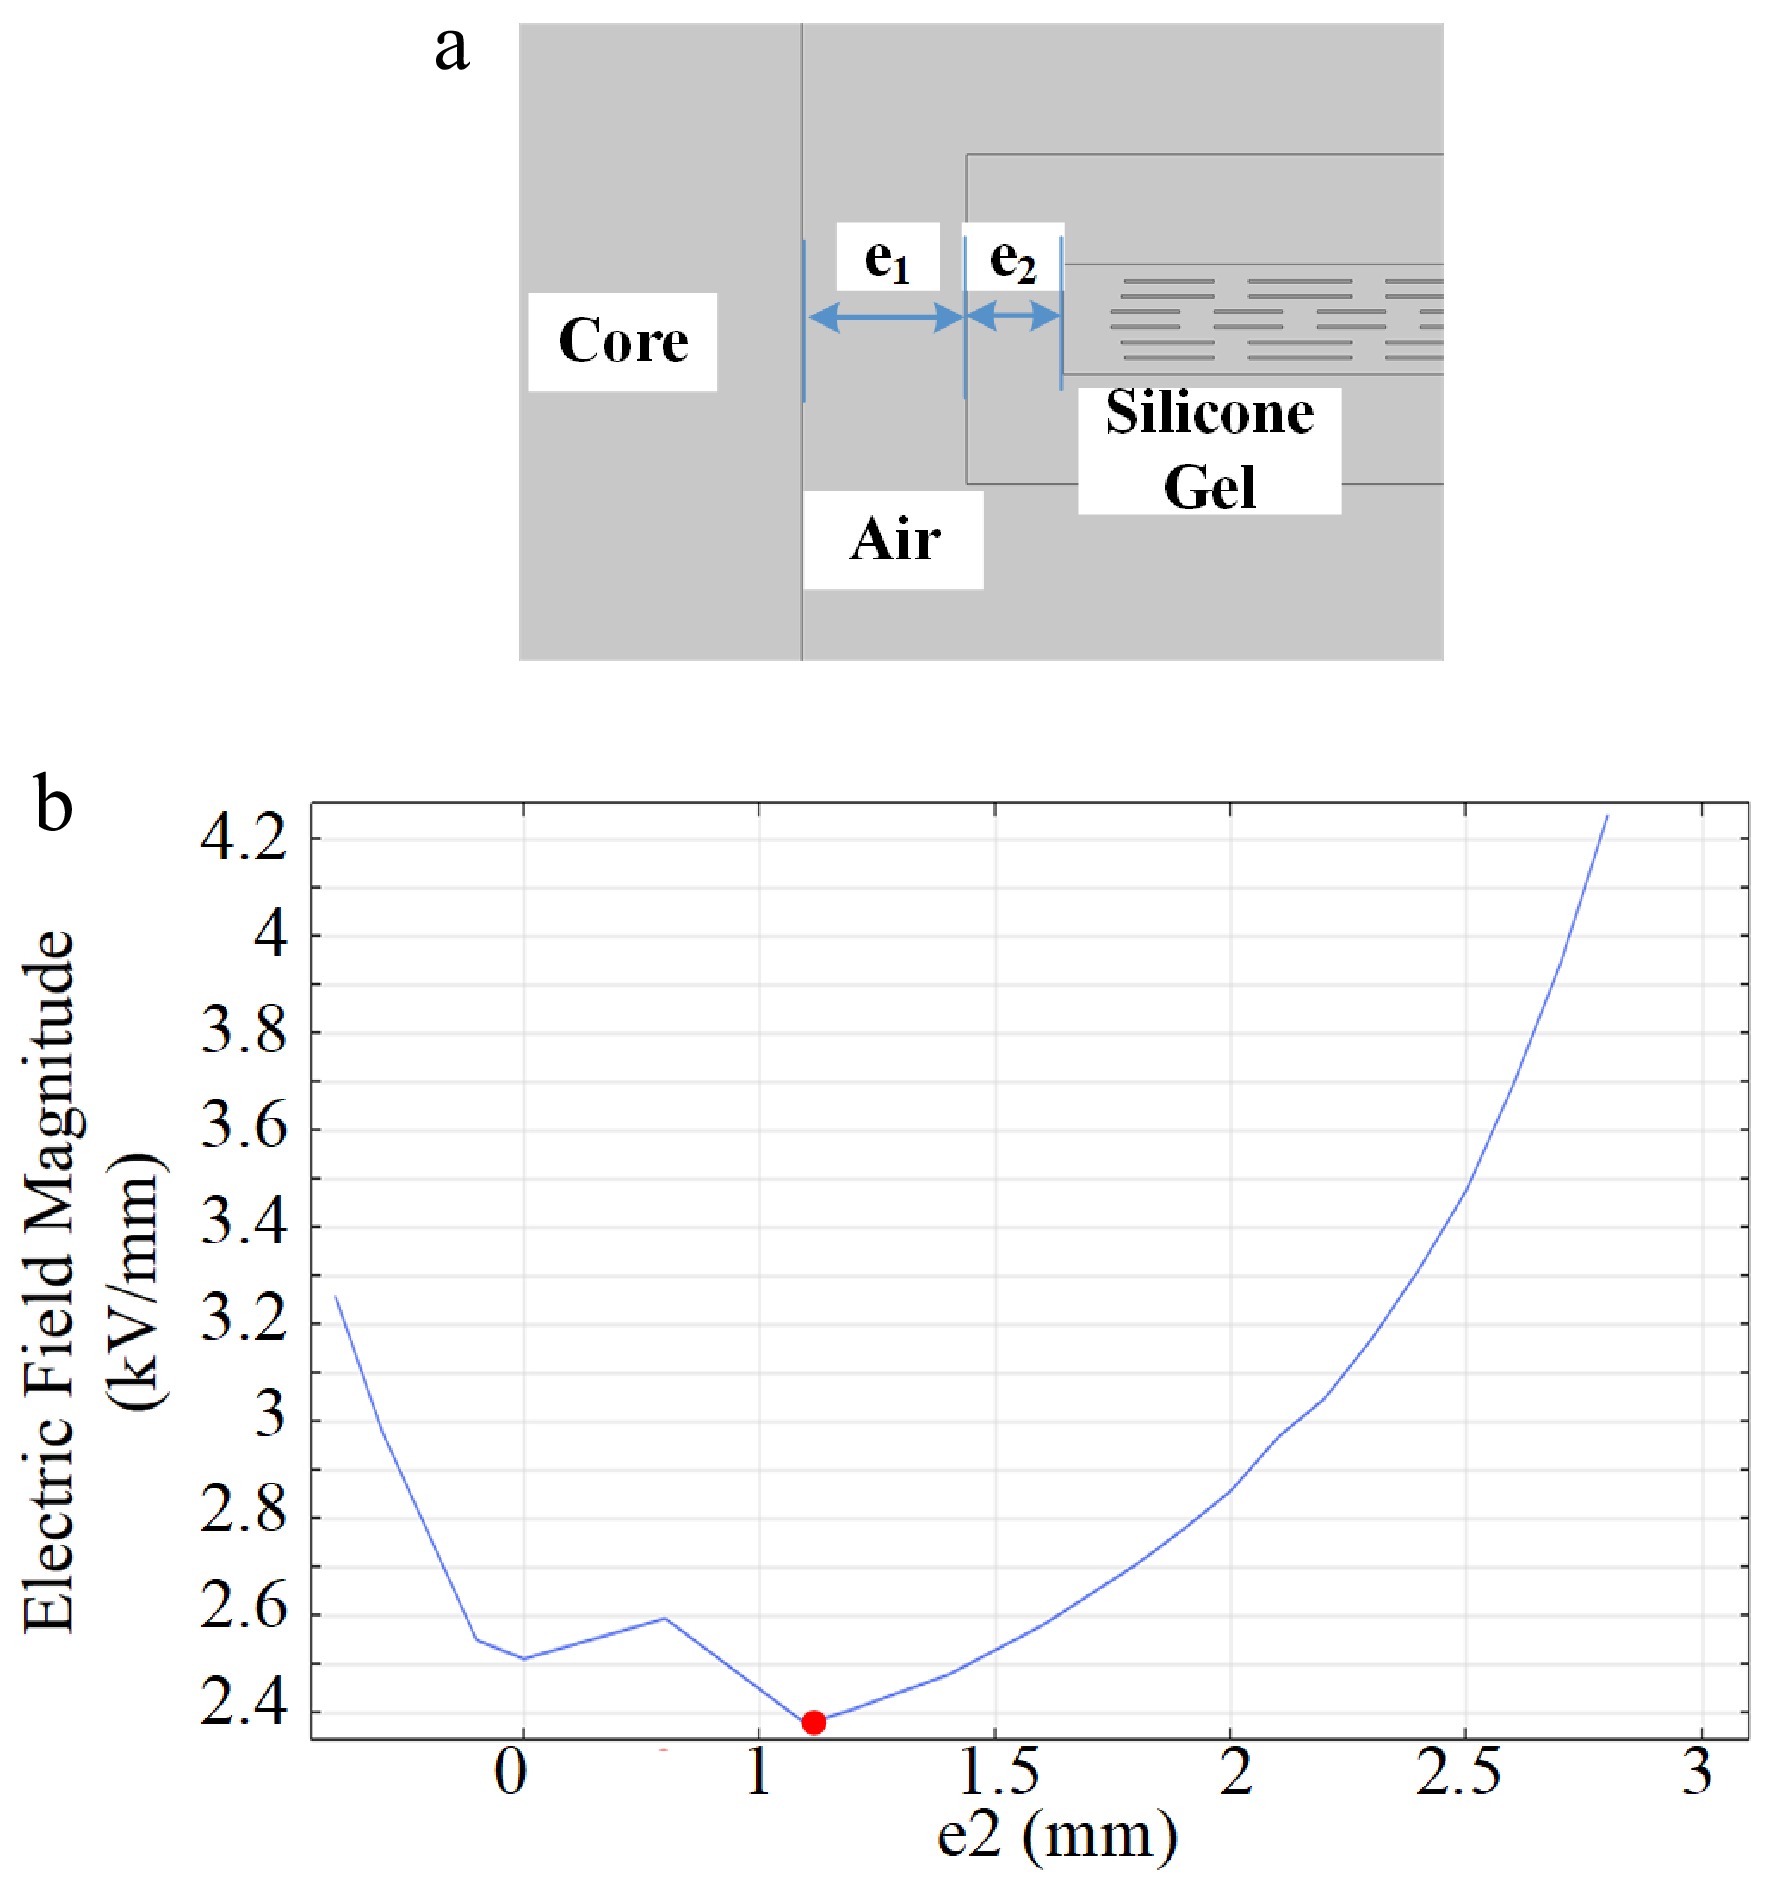
Figure 11.
Optimization of the distribution of insulating medium between the core and PCB during partial glue filling. (a) Schematic diagram of the distribution of partial sealing and filling media. (b) Medium distribution scanning results.
-
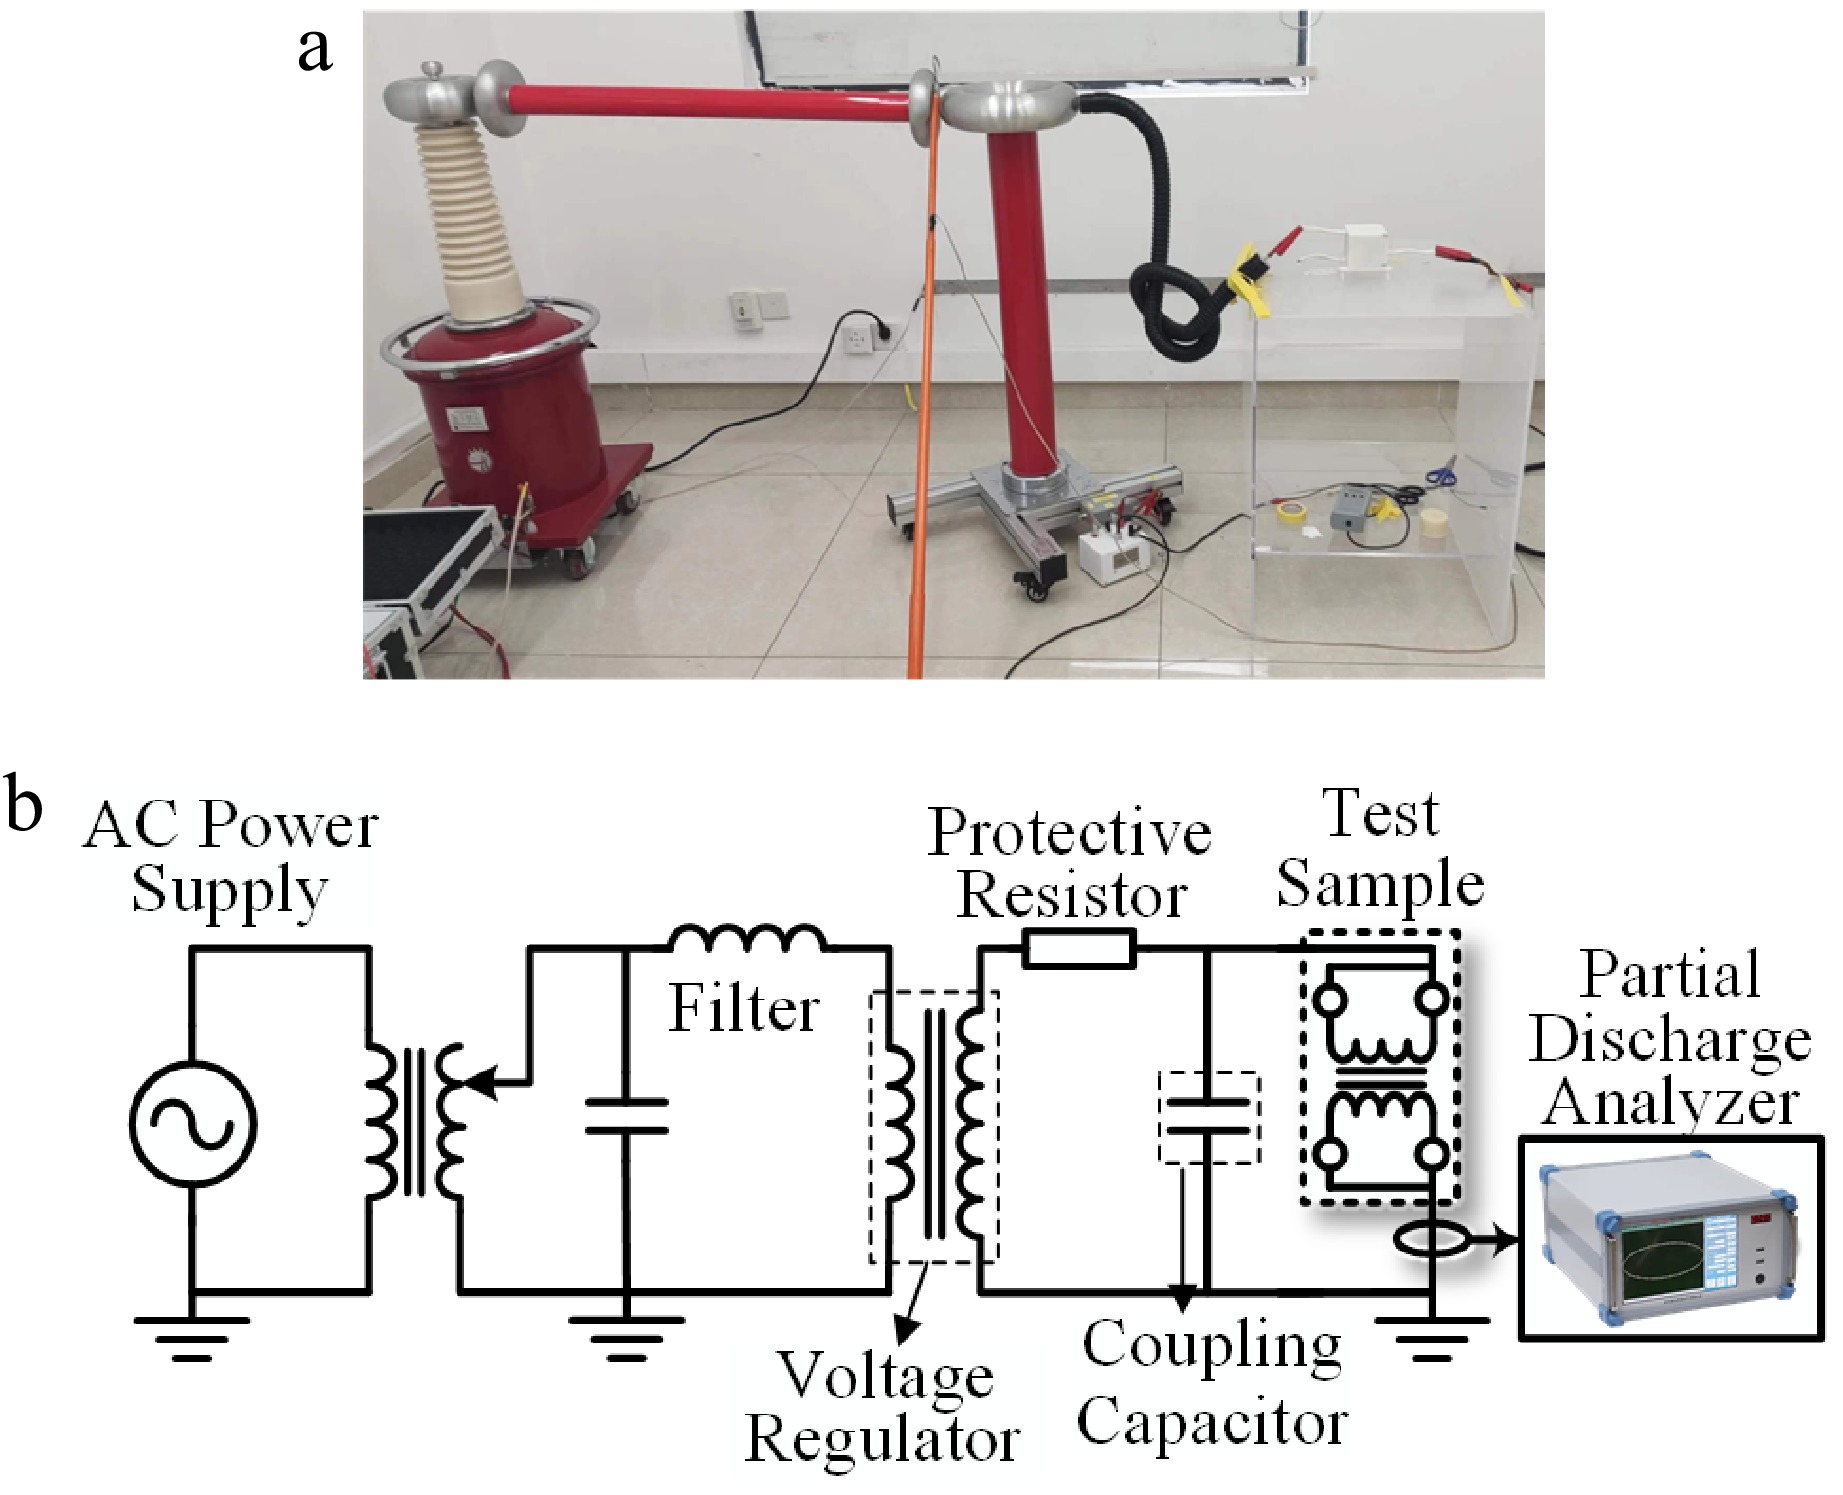
Figure 12.
(a) Partial discharge device and (b) partial discharge test schematic diagram test principle.
-
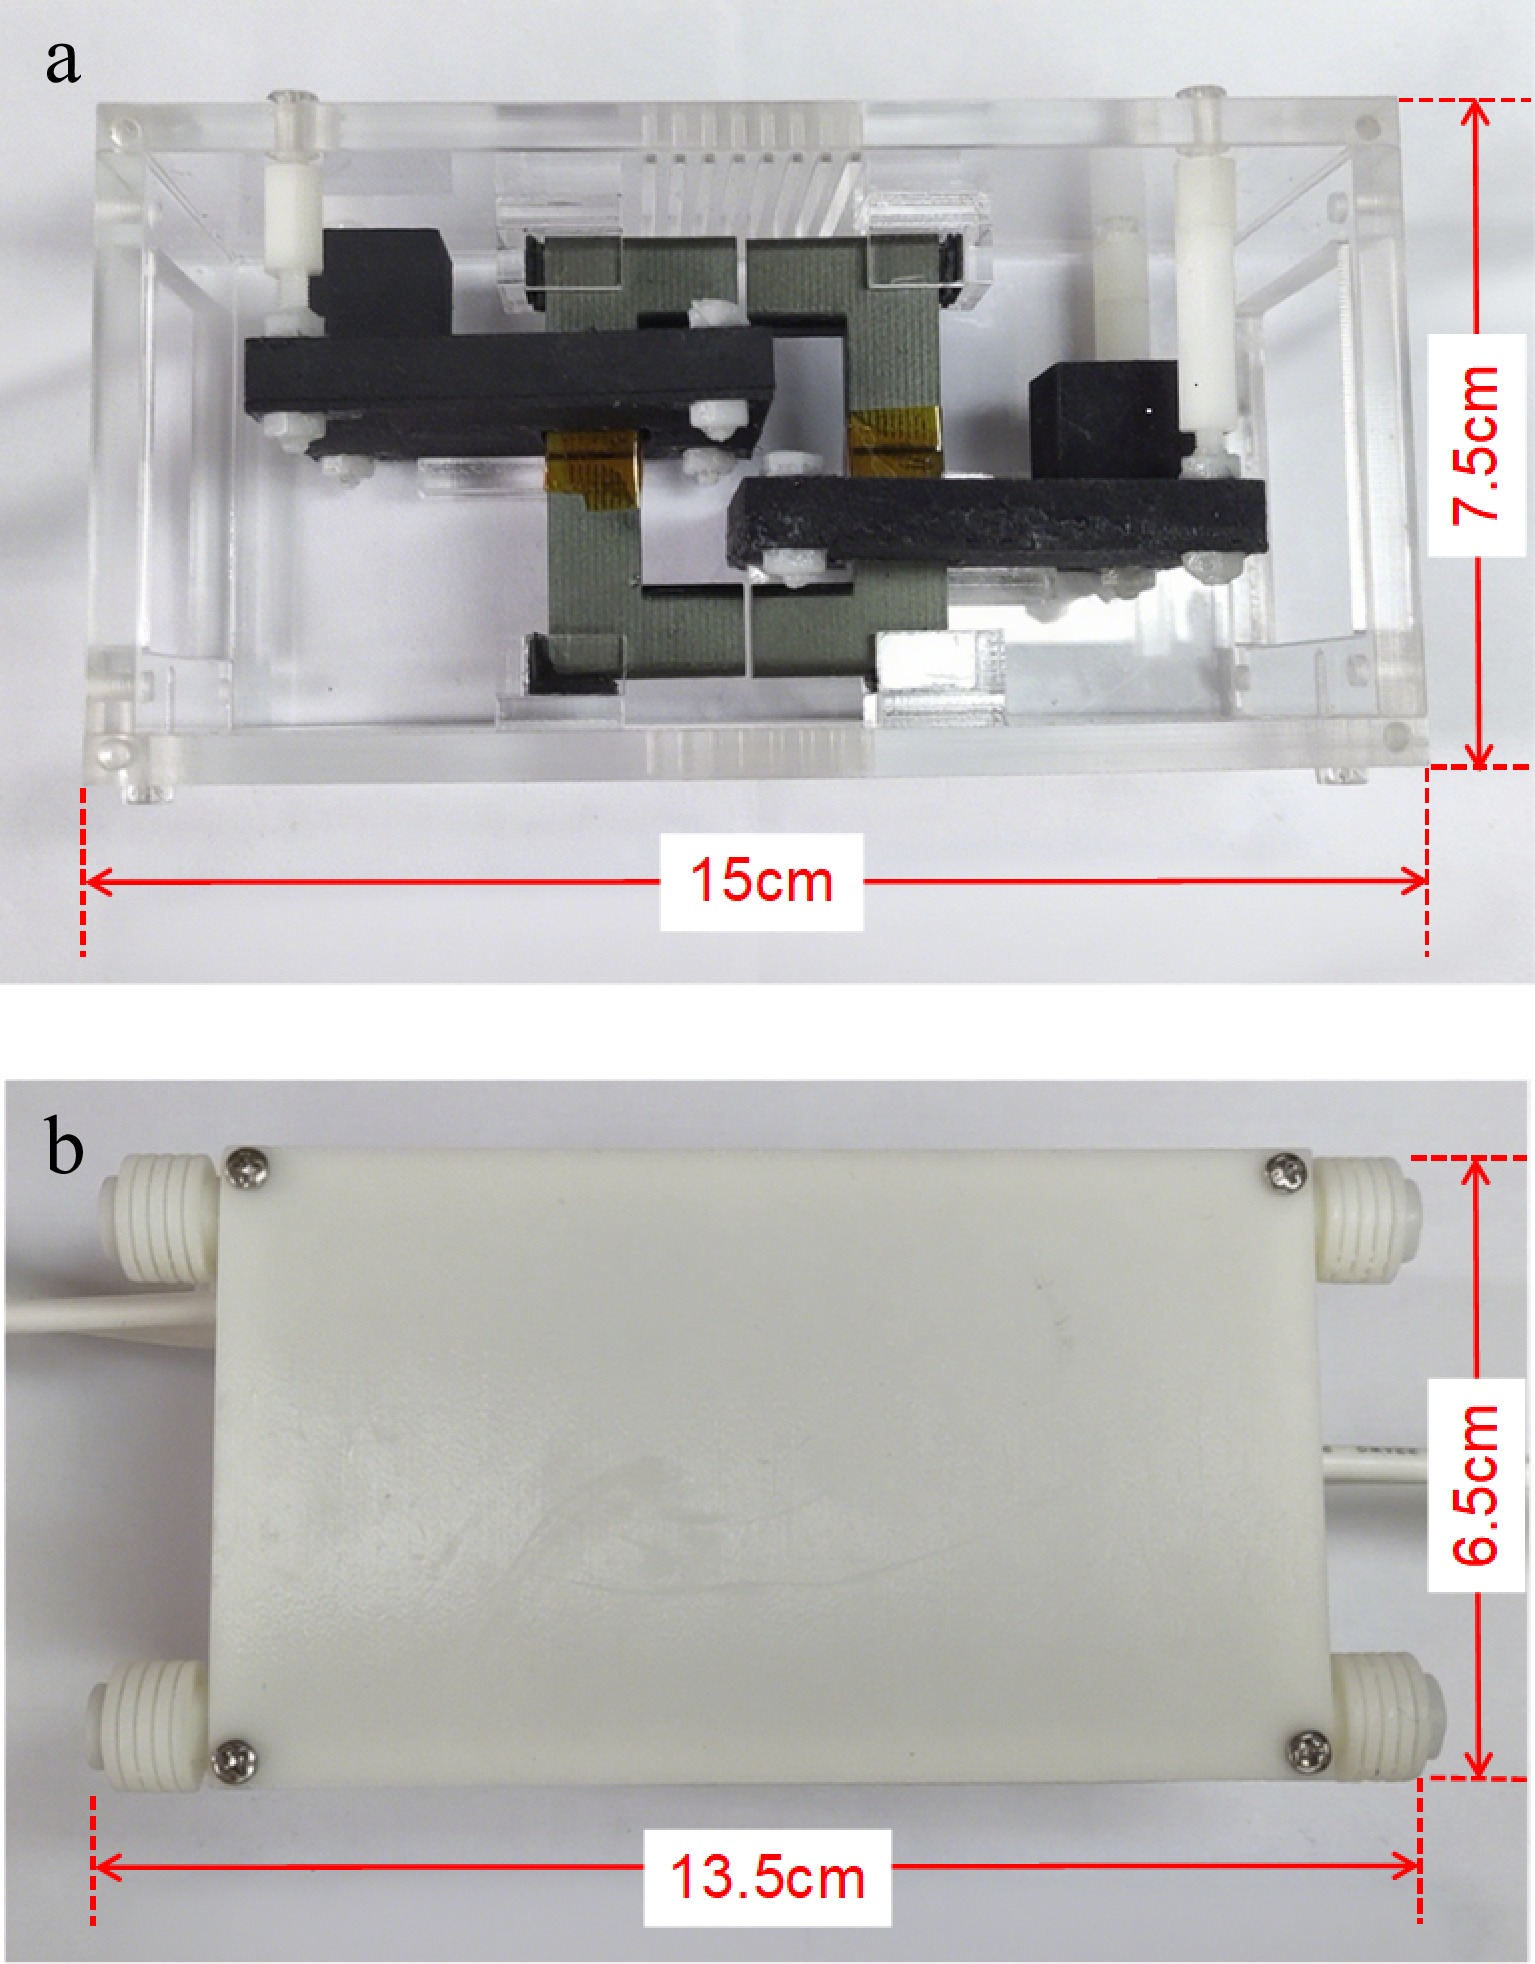
Figure 13.
Isolation unit samples under different sealing schemes. (a) Local sealing and filling. (b) Overall sealing and filling.
-
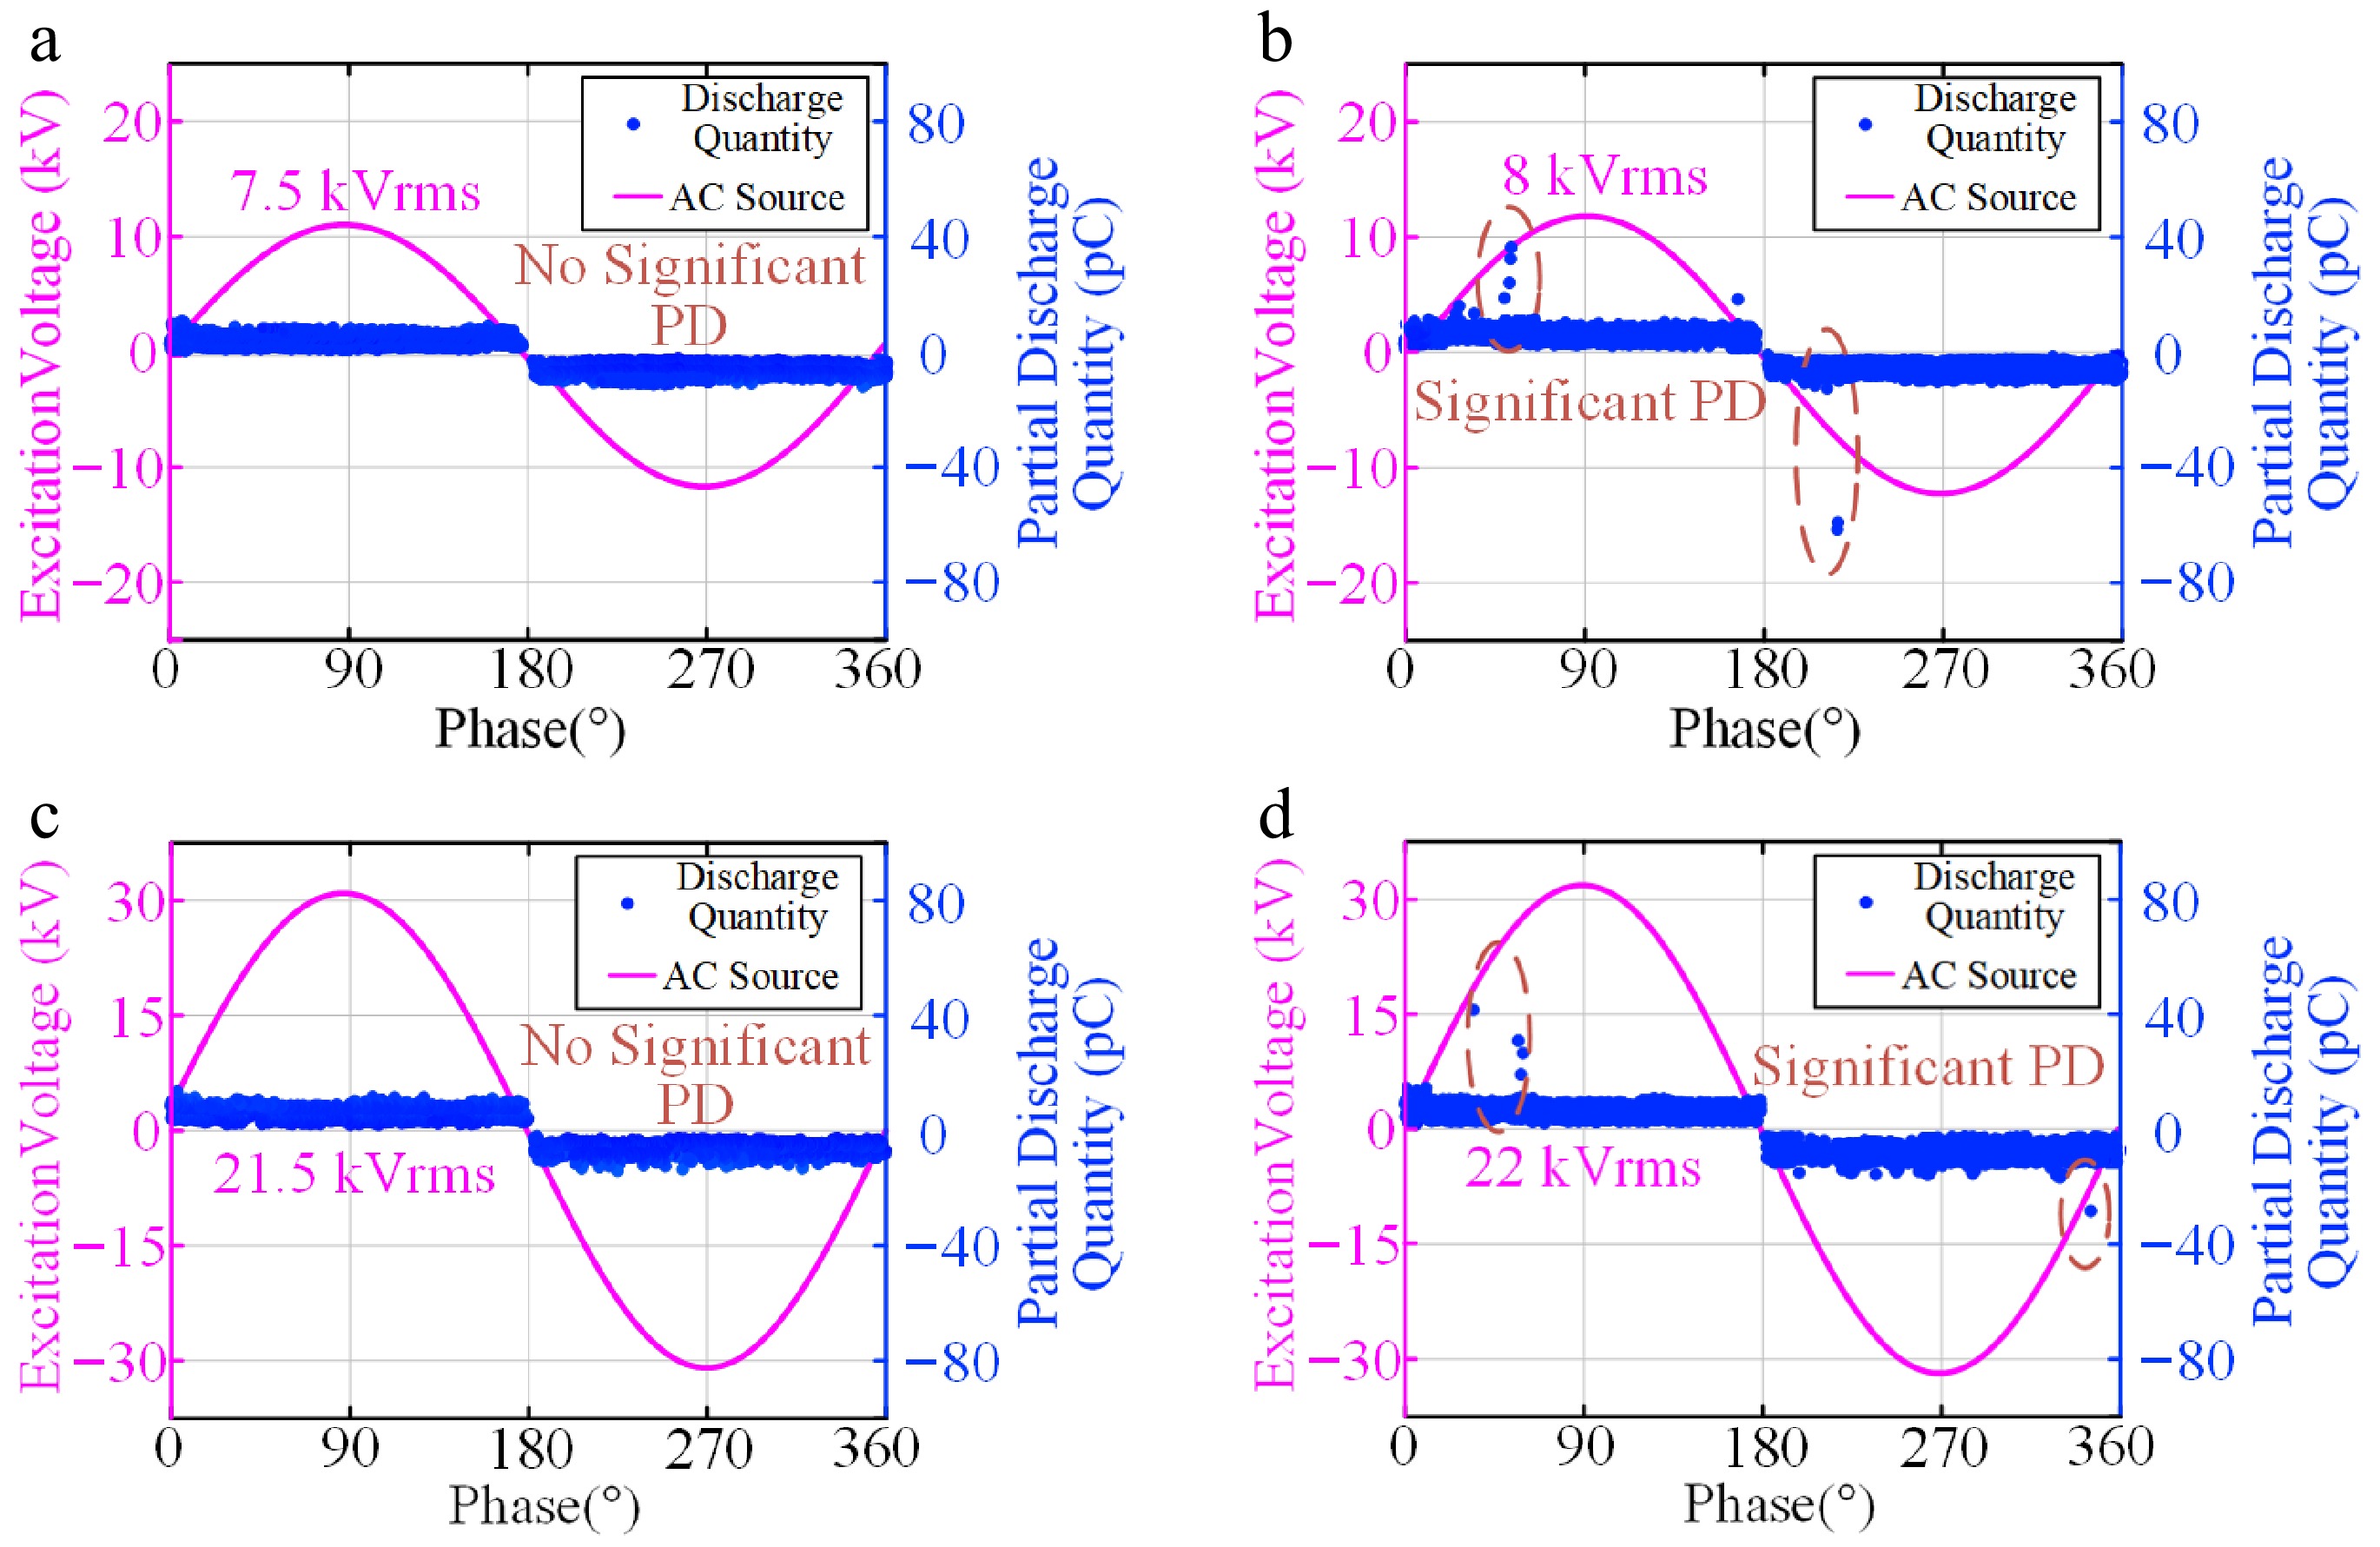
Figure 14.
PDIV levels of isolation units under different sealing schemes. Partial discharge test of local sealing and filling under a voltage of (a) 7.5 kVrms, (b) 8 kVrms, (c) 21.5 kVrms, (d) 22 kVrms.
-
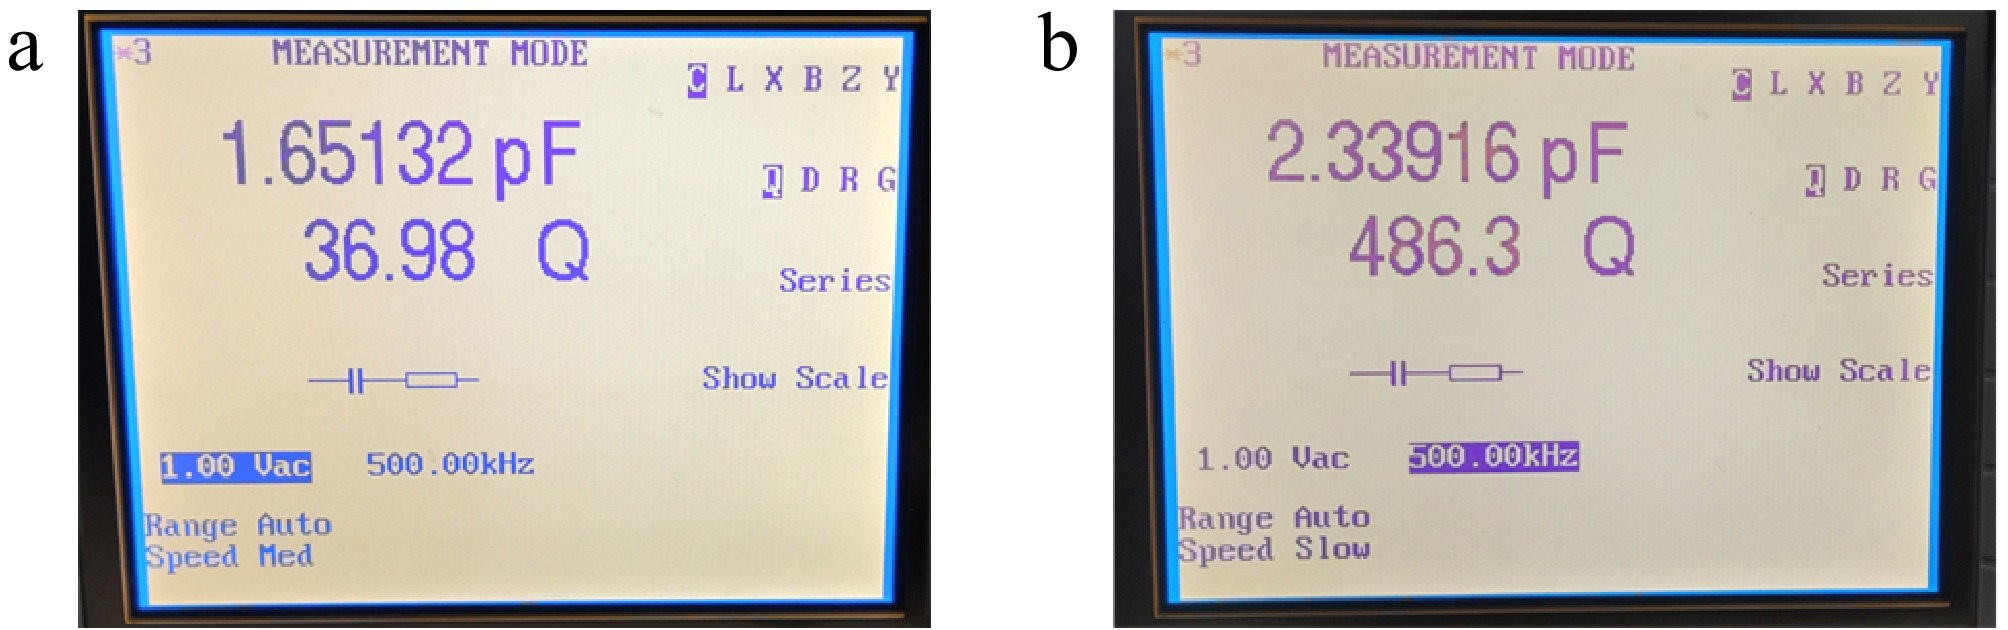
Figure 15.
Coupling capacitor experiment under different sealing schemes. (a) Test data of local sealing and filling. (b) Test data of overall sealing and filling.
-
Figure 16.
Proposed prototype.
-
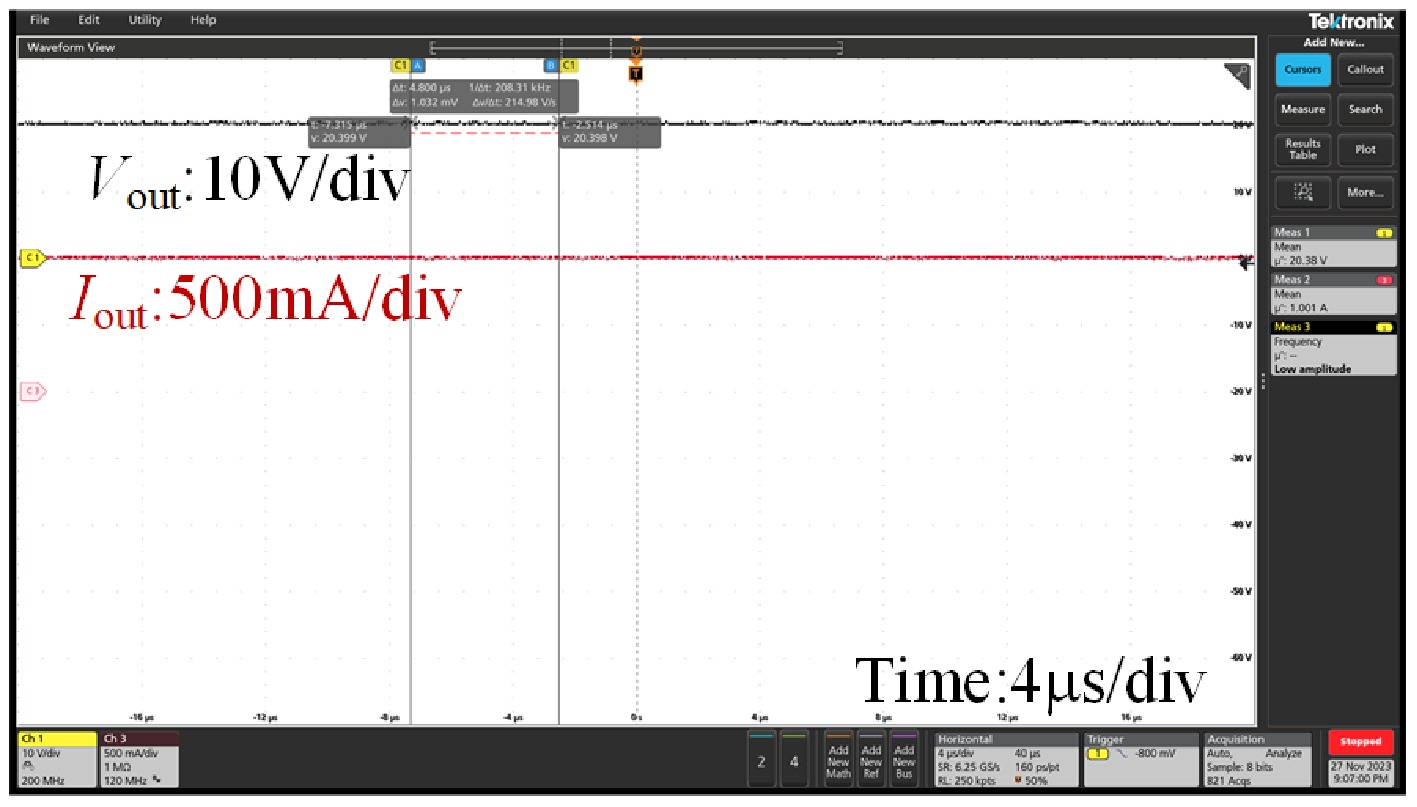
Figure 17.
Isolation drive voltage, output voltage, and current waveform.
-
Parameter name Numerical value/description TX potential 0 V RX potential 20 kV Magnetic core potential Floated potential Coil mesh partitioning More detailed Core grid division More detailed FR4/Air grid partitioning Extremely detailed Table 1.
Key parameter settings for finite element simulation of electric field.
-
Material Dielectric strength @25 °C Relative dielectric constant Viscosity FR4 45 kV/mm 4.6 − Epoxy resin 18 kV/mm 4.5 2,000 cps Polyurethane 20 kV/mm 3.7 1,600 cps Silicon gel 25 kV/mm 2.8 1,000 cps Air 3 kV/mm 1 − Table 2.
Key characteristics of common insulating media.
-
Parameter name Numerical value Copper layer thickness 70 μm Number of coil layers Six floors Core length 21 mm Core height 48 mm Air gap 4 mm Cross-sectional length of the magnetic core 10 mm The cross-sectional width of the magnetic core 10 mm Coil interlacing spacing hps (3 mm, 8 mm) PCB-Core spacing d1 (0.5 mm, 3 mm) Copper layer-PCB spacing d2 (0.5 mm, 3 mm) Table 3.
Key parameters of magnetic components.
-
Parameter name Numerical value Number of turns of the primary side coil n1 20 Number of turns of the secondary side coil n2 20 Self-induction of the primary side coil L1 47.2 mH Self-induction of the secondary side coil L2 47.2 mH The mutual inductance between the primary and secondary coils M 12.7 mH Coupling coefficient k12 0.27 Switching frequency fsw 400 kHz Output power Pout 20 W Isolation voltage level 21.5 kVrms Table 4.
Isolate the key parameters of the drive power supply.
-
Materials and
insulation strategyPDIV Cps Pout Ref. Air insulation, no encapsulation > 33 kV (no
obvious discharge)2.76 pF 2*60 W [22] Silicone + NOMEX + local encapsulation structure 21.5 kVrms
(effective value)2.34 pF 2*20 W This paper Table 5.
Performance comparison of existing multi-output isolated power supply.
Figures
(17)
Tables
(5)