-
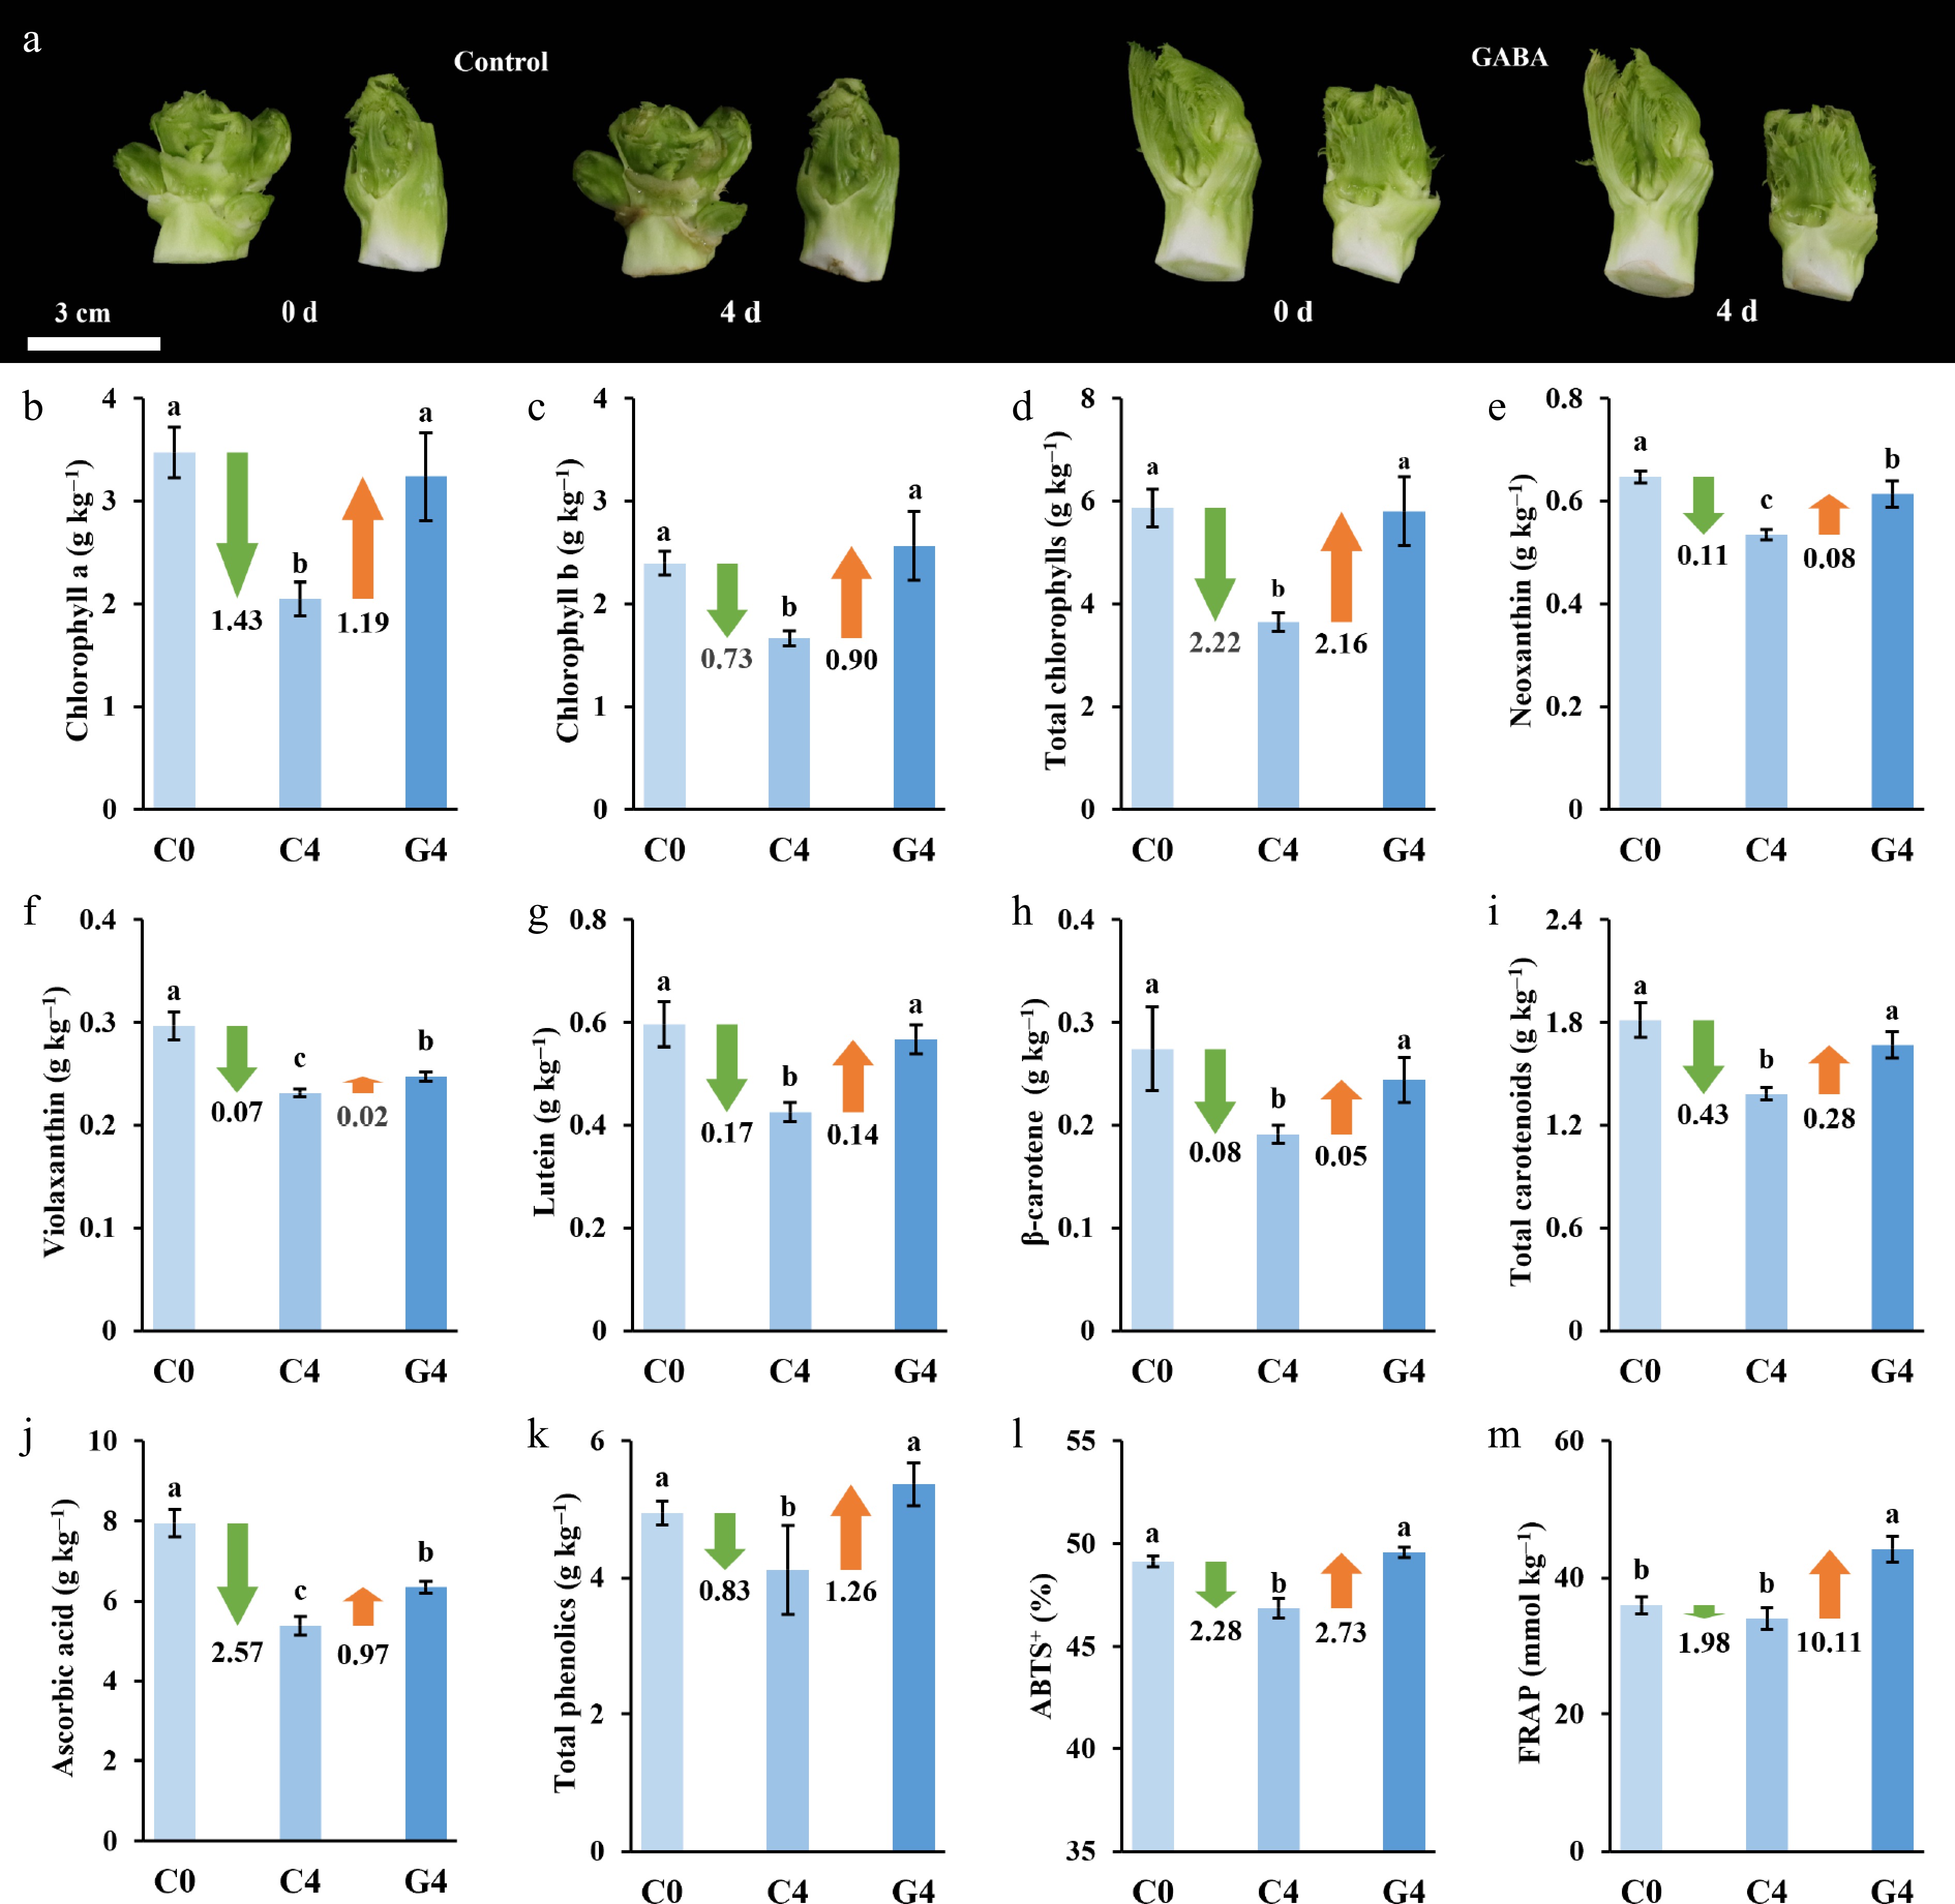
Figure 1.
Effects of GABA treatment on the visual appearance and physiological quality of baby mustard during postharvest storage. (a) Representative images of lateral buds at 0 days, and after 4 days of storage under the control and GABA treatment conditions. (b)–(m) Changes in physiological indicators, including (b) chlorophyll a, (c) chlorophyll b, (d) total chlorophylls, (e) neoxanthin, (f) violaxanthin, (g) lutein, (h) β-carotene, (i) total carotenoids, (j) ascorbic acid, (k) total phenolics, (l) ABTS, and (m) FRAP. Values are the means ± SD (n = 3). Different letters indicate significant differences at p < 0.05.
-
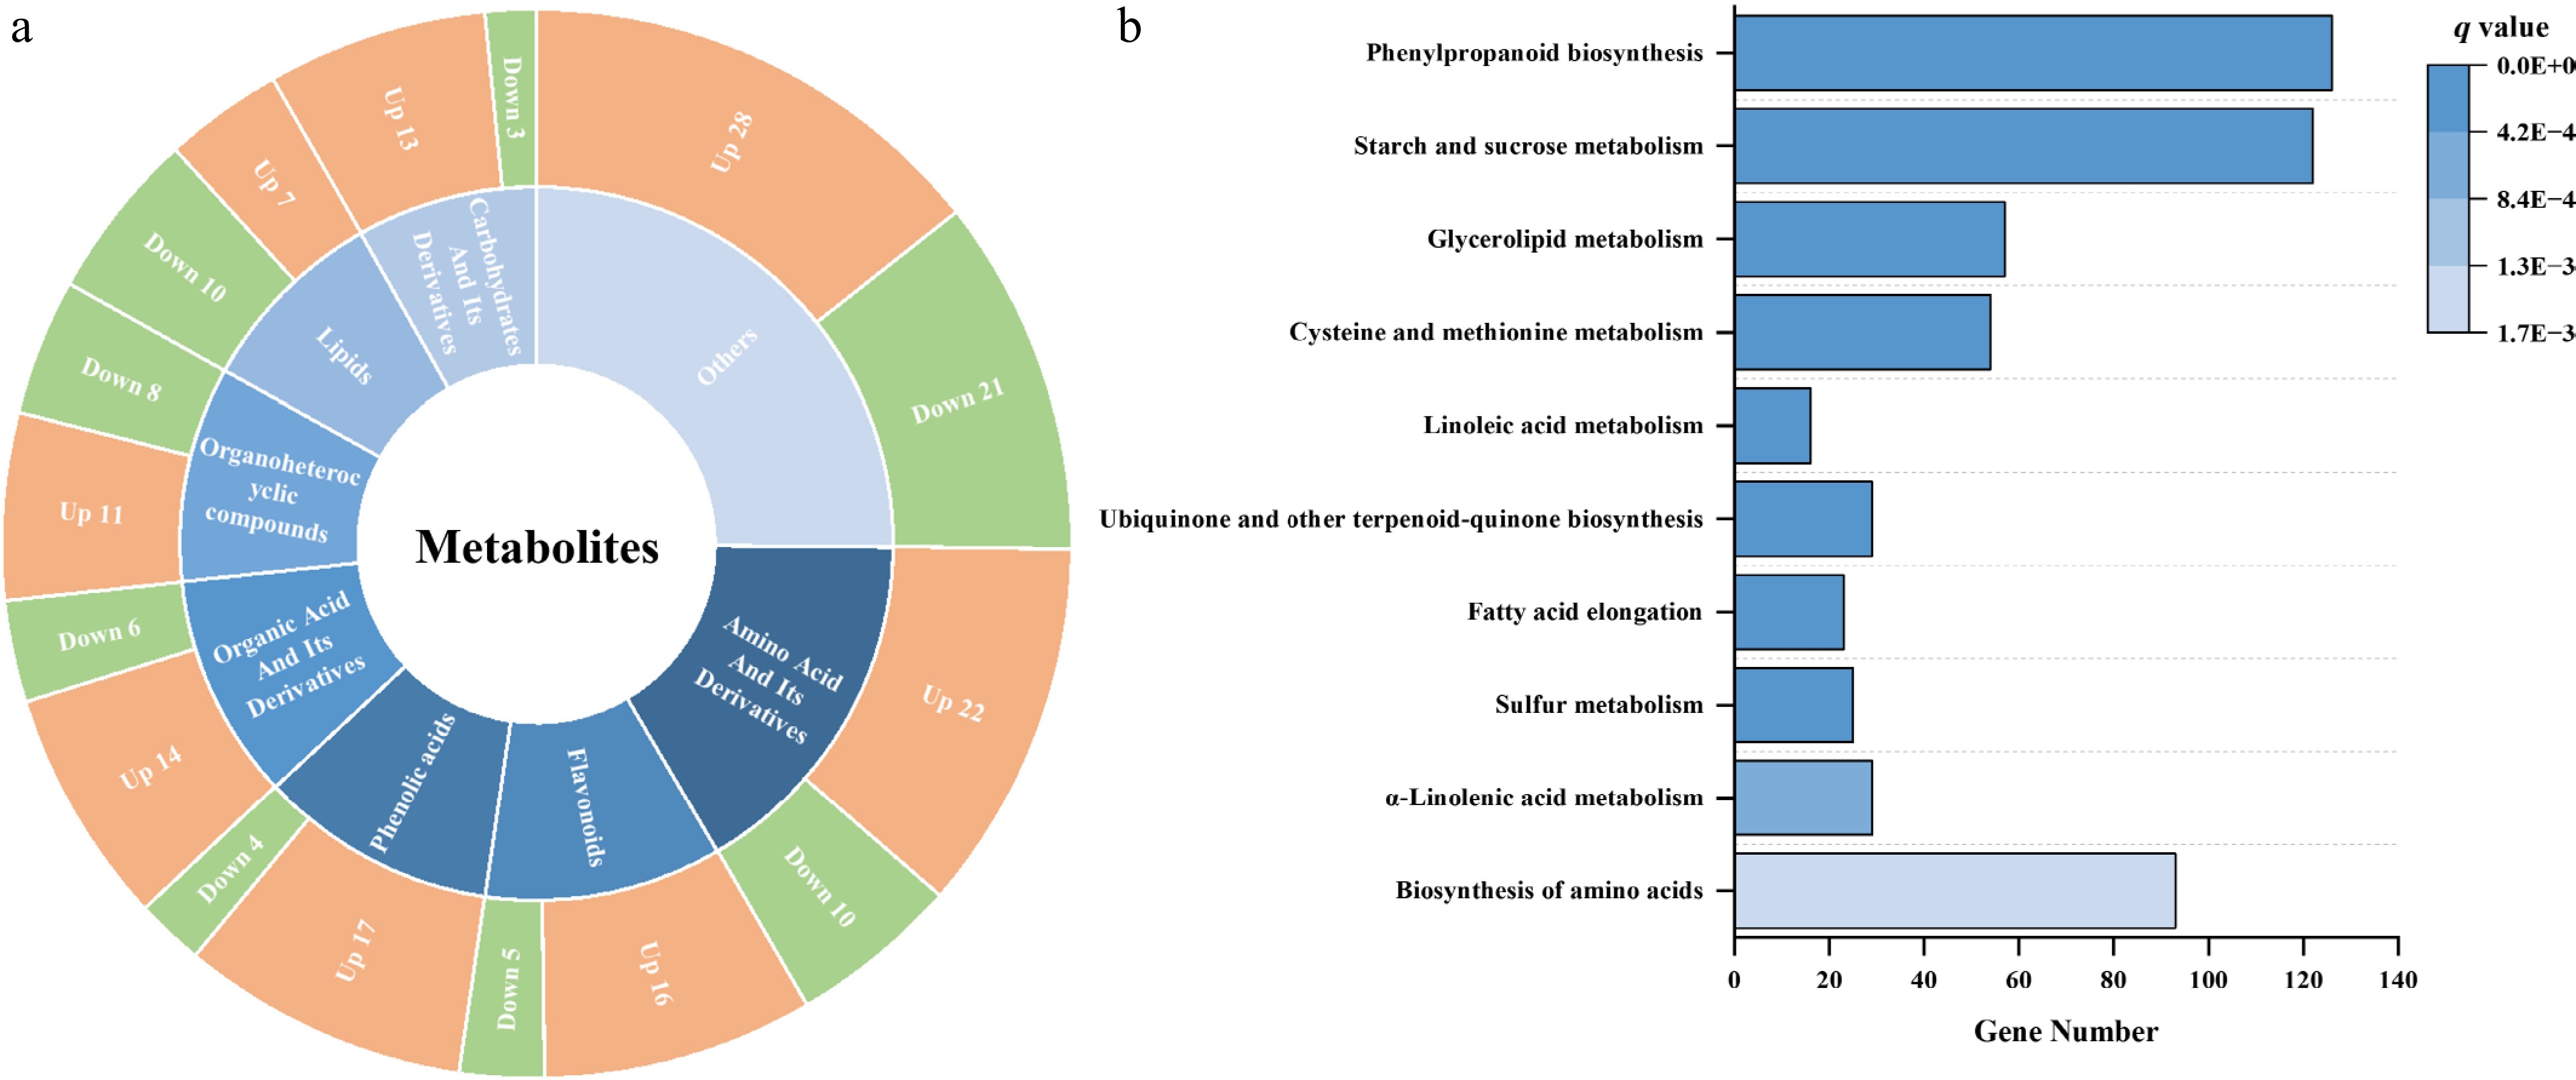
Figure 2.
Overview of differentially accumulated metabolites (DAMs) and gene enrichment between the control and GABA-treated samples after 4 days of storage. (a) Pie chart summarizing the classification and number of upregulated and downregulated DAMs between control and GABA-treated baby mustard. (b) KEGG enrichment analysis of differentially expressed genes (DEGs) identified between the control and GABA treatment groups after 4 days.
-
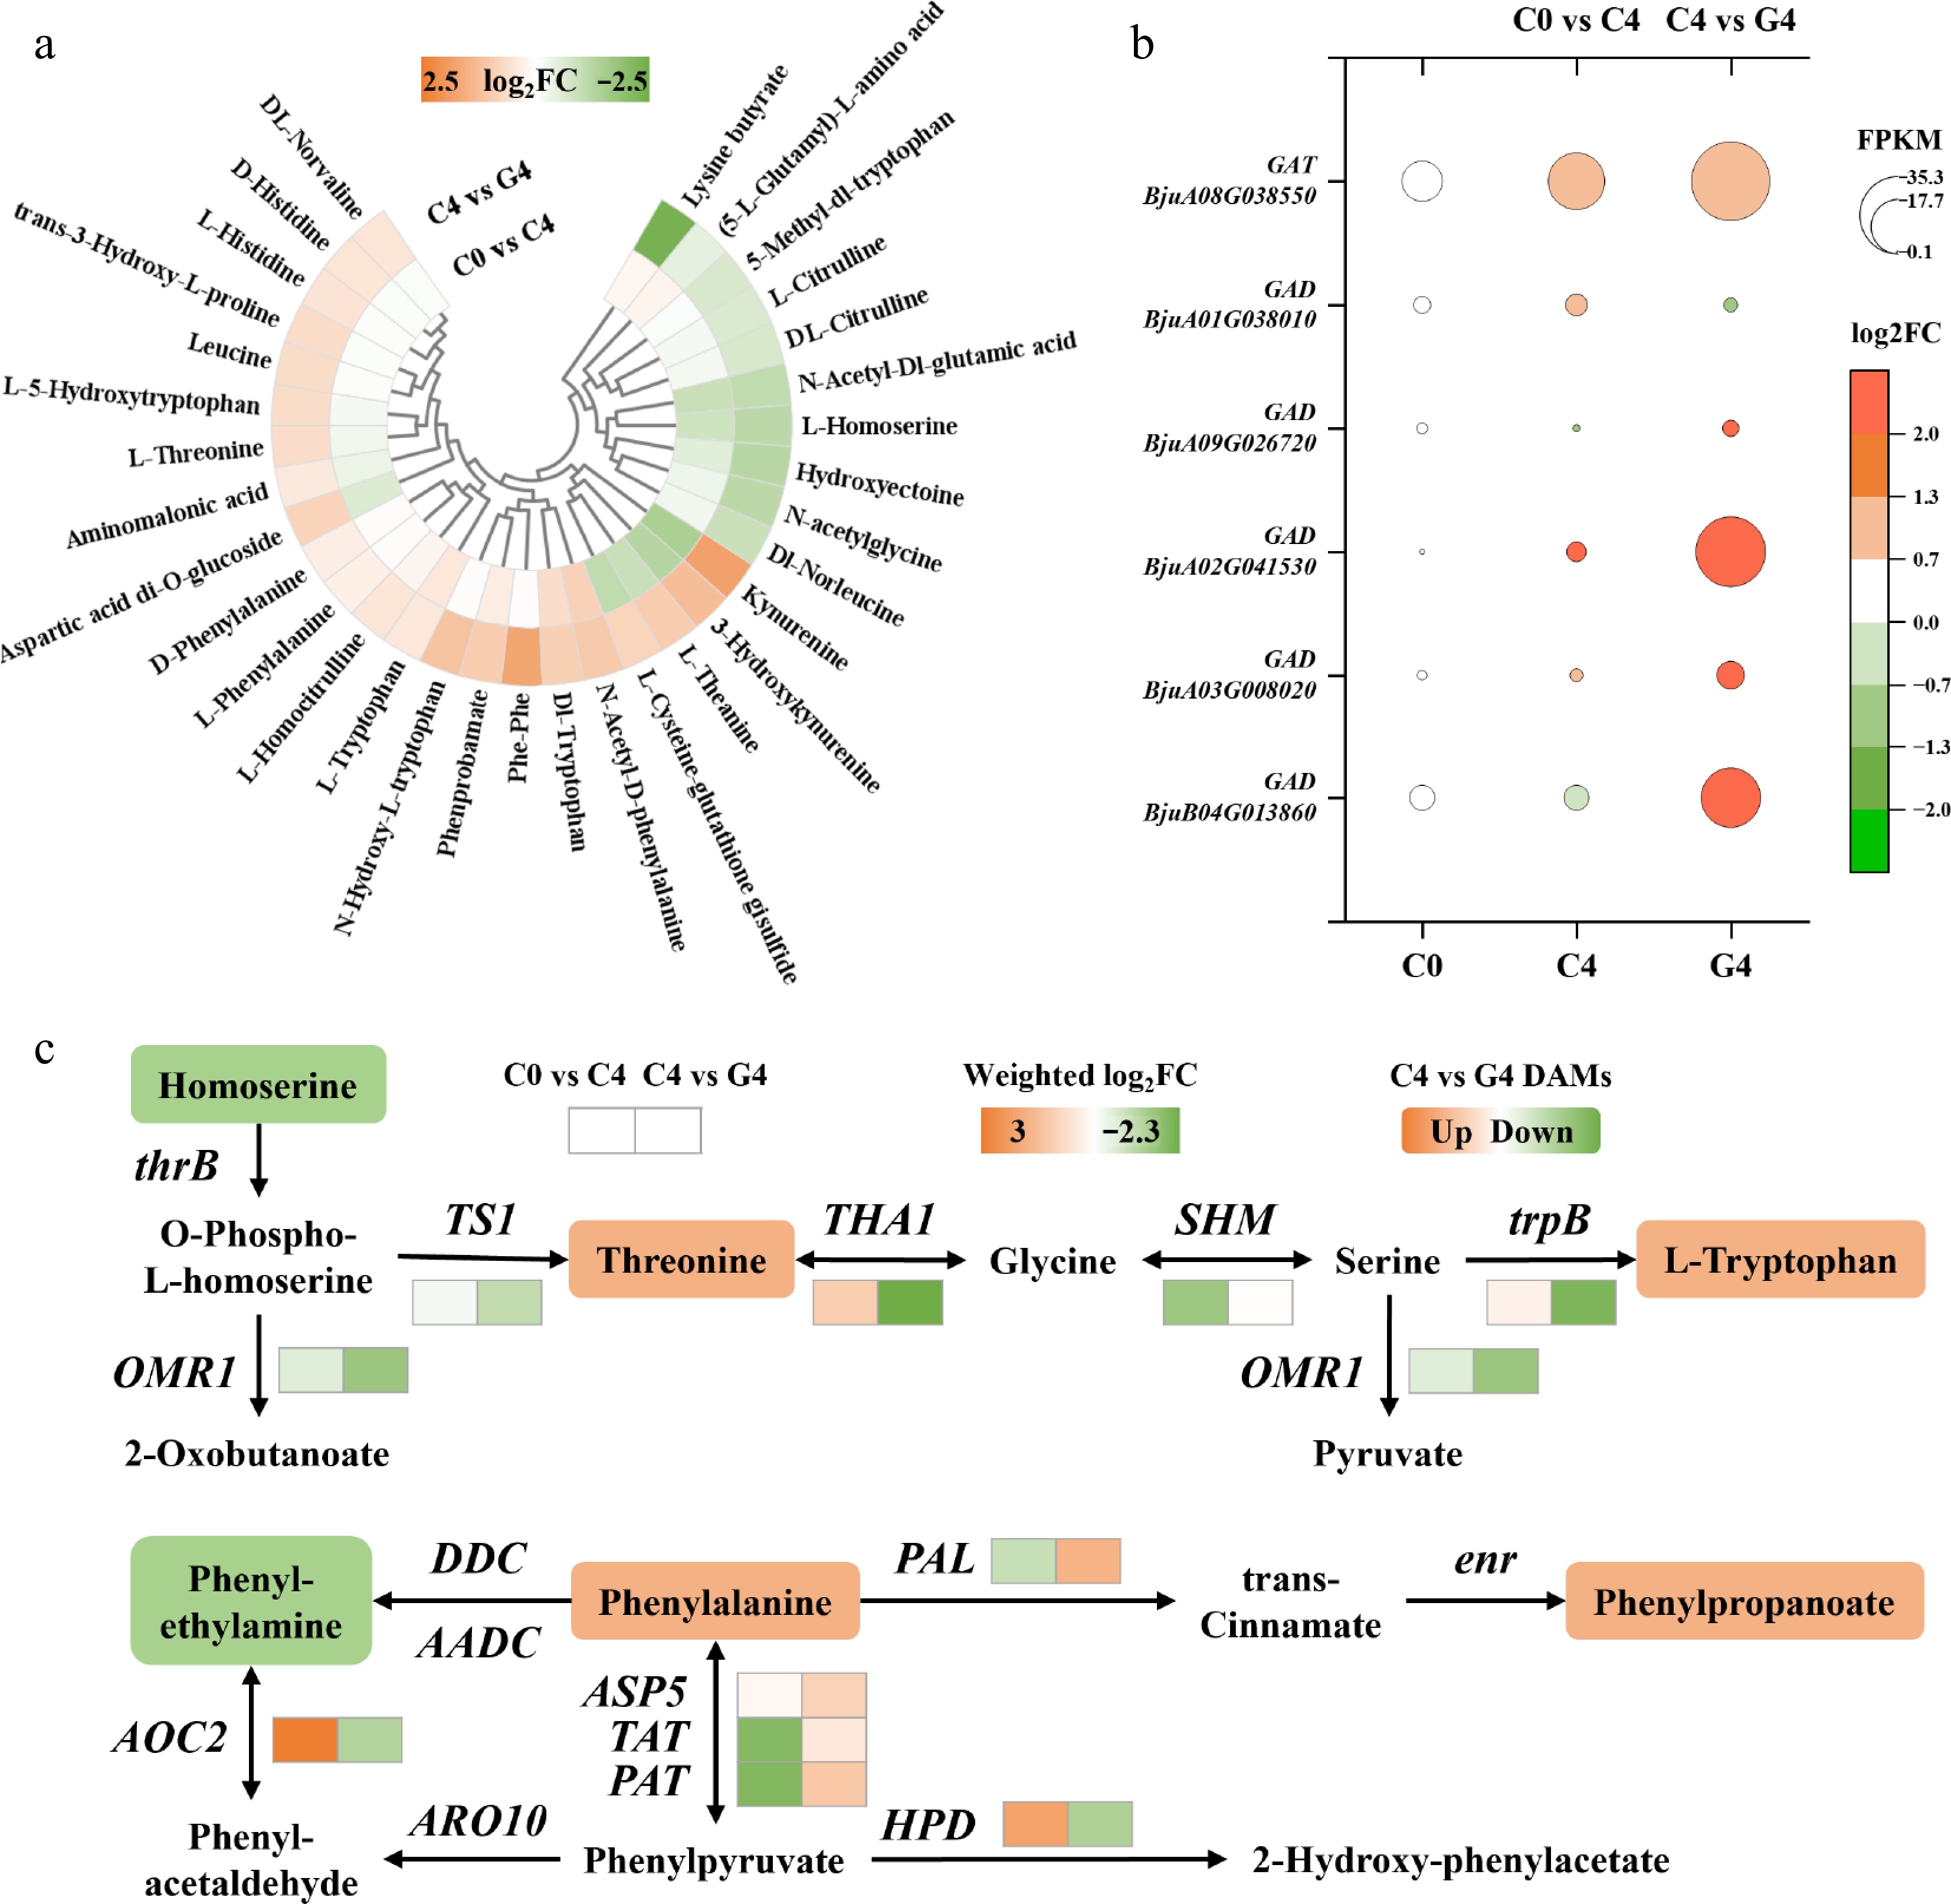
Figure 3.
Effects of the GABA treatment on amino acid metabolism in baby mustard during postharvest storage. (a) Heatmap of differentially accumulated amino acids and their derivatives. (b) Expression levels (FPKM) of key genes involved in GABA biosynthesis and metabolism. (c) Heatmap of transcript changes in genes associated with amino acid metabolic pathways.
-
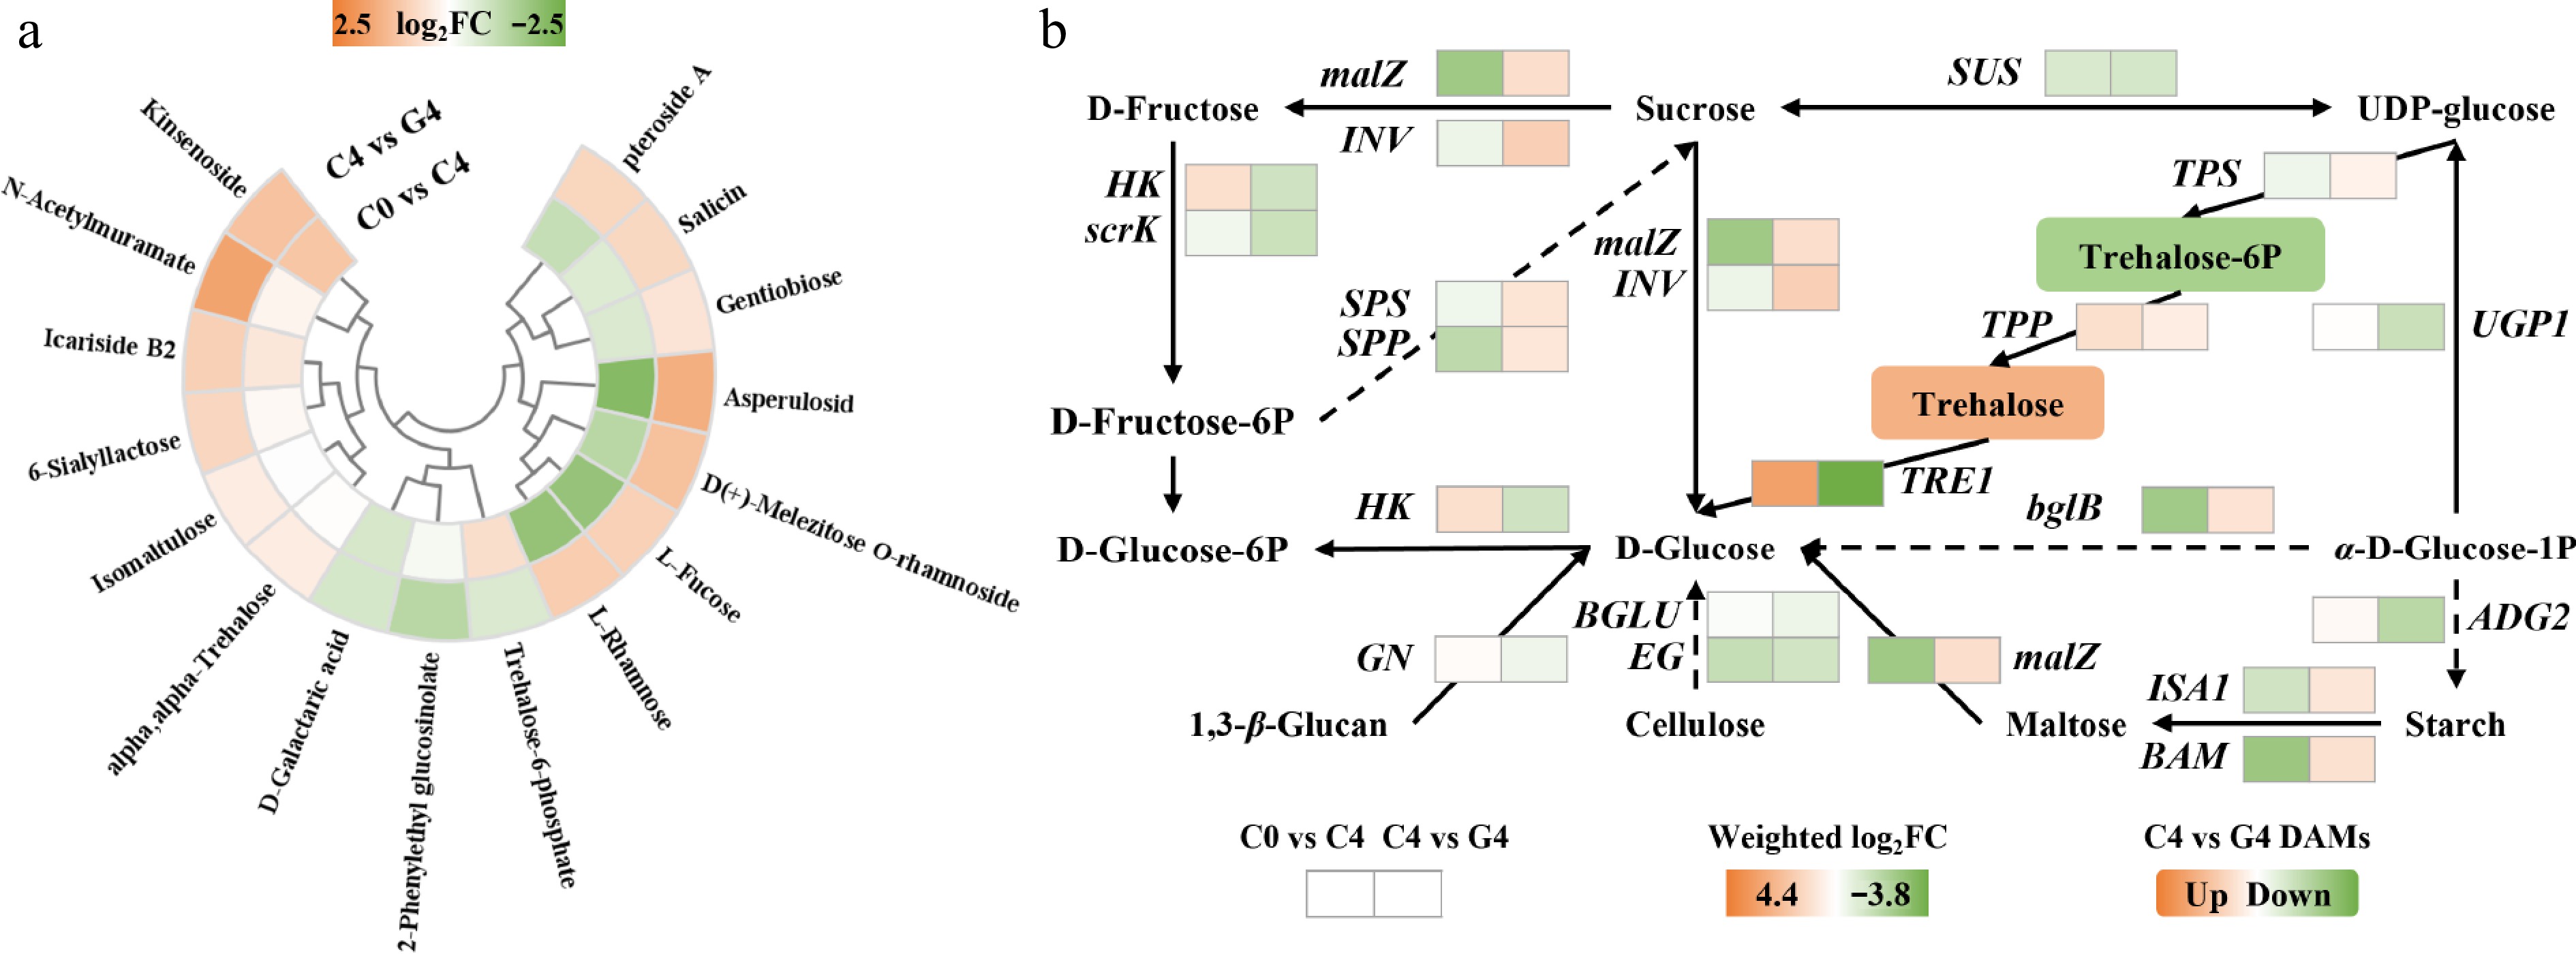
Figure 4.
Effects of GABA treatment on carbohydrate metabolism in baby mustard during postharvest storage. (a) Heatmap of differentially accumulated carbohydrate metabolites. (b) Heatmap of transcript changes in genes involved in starch and sucrose metabolism pathway.
-
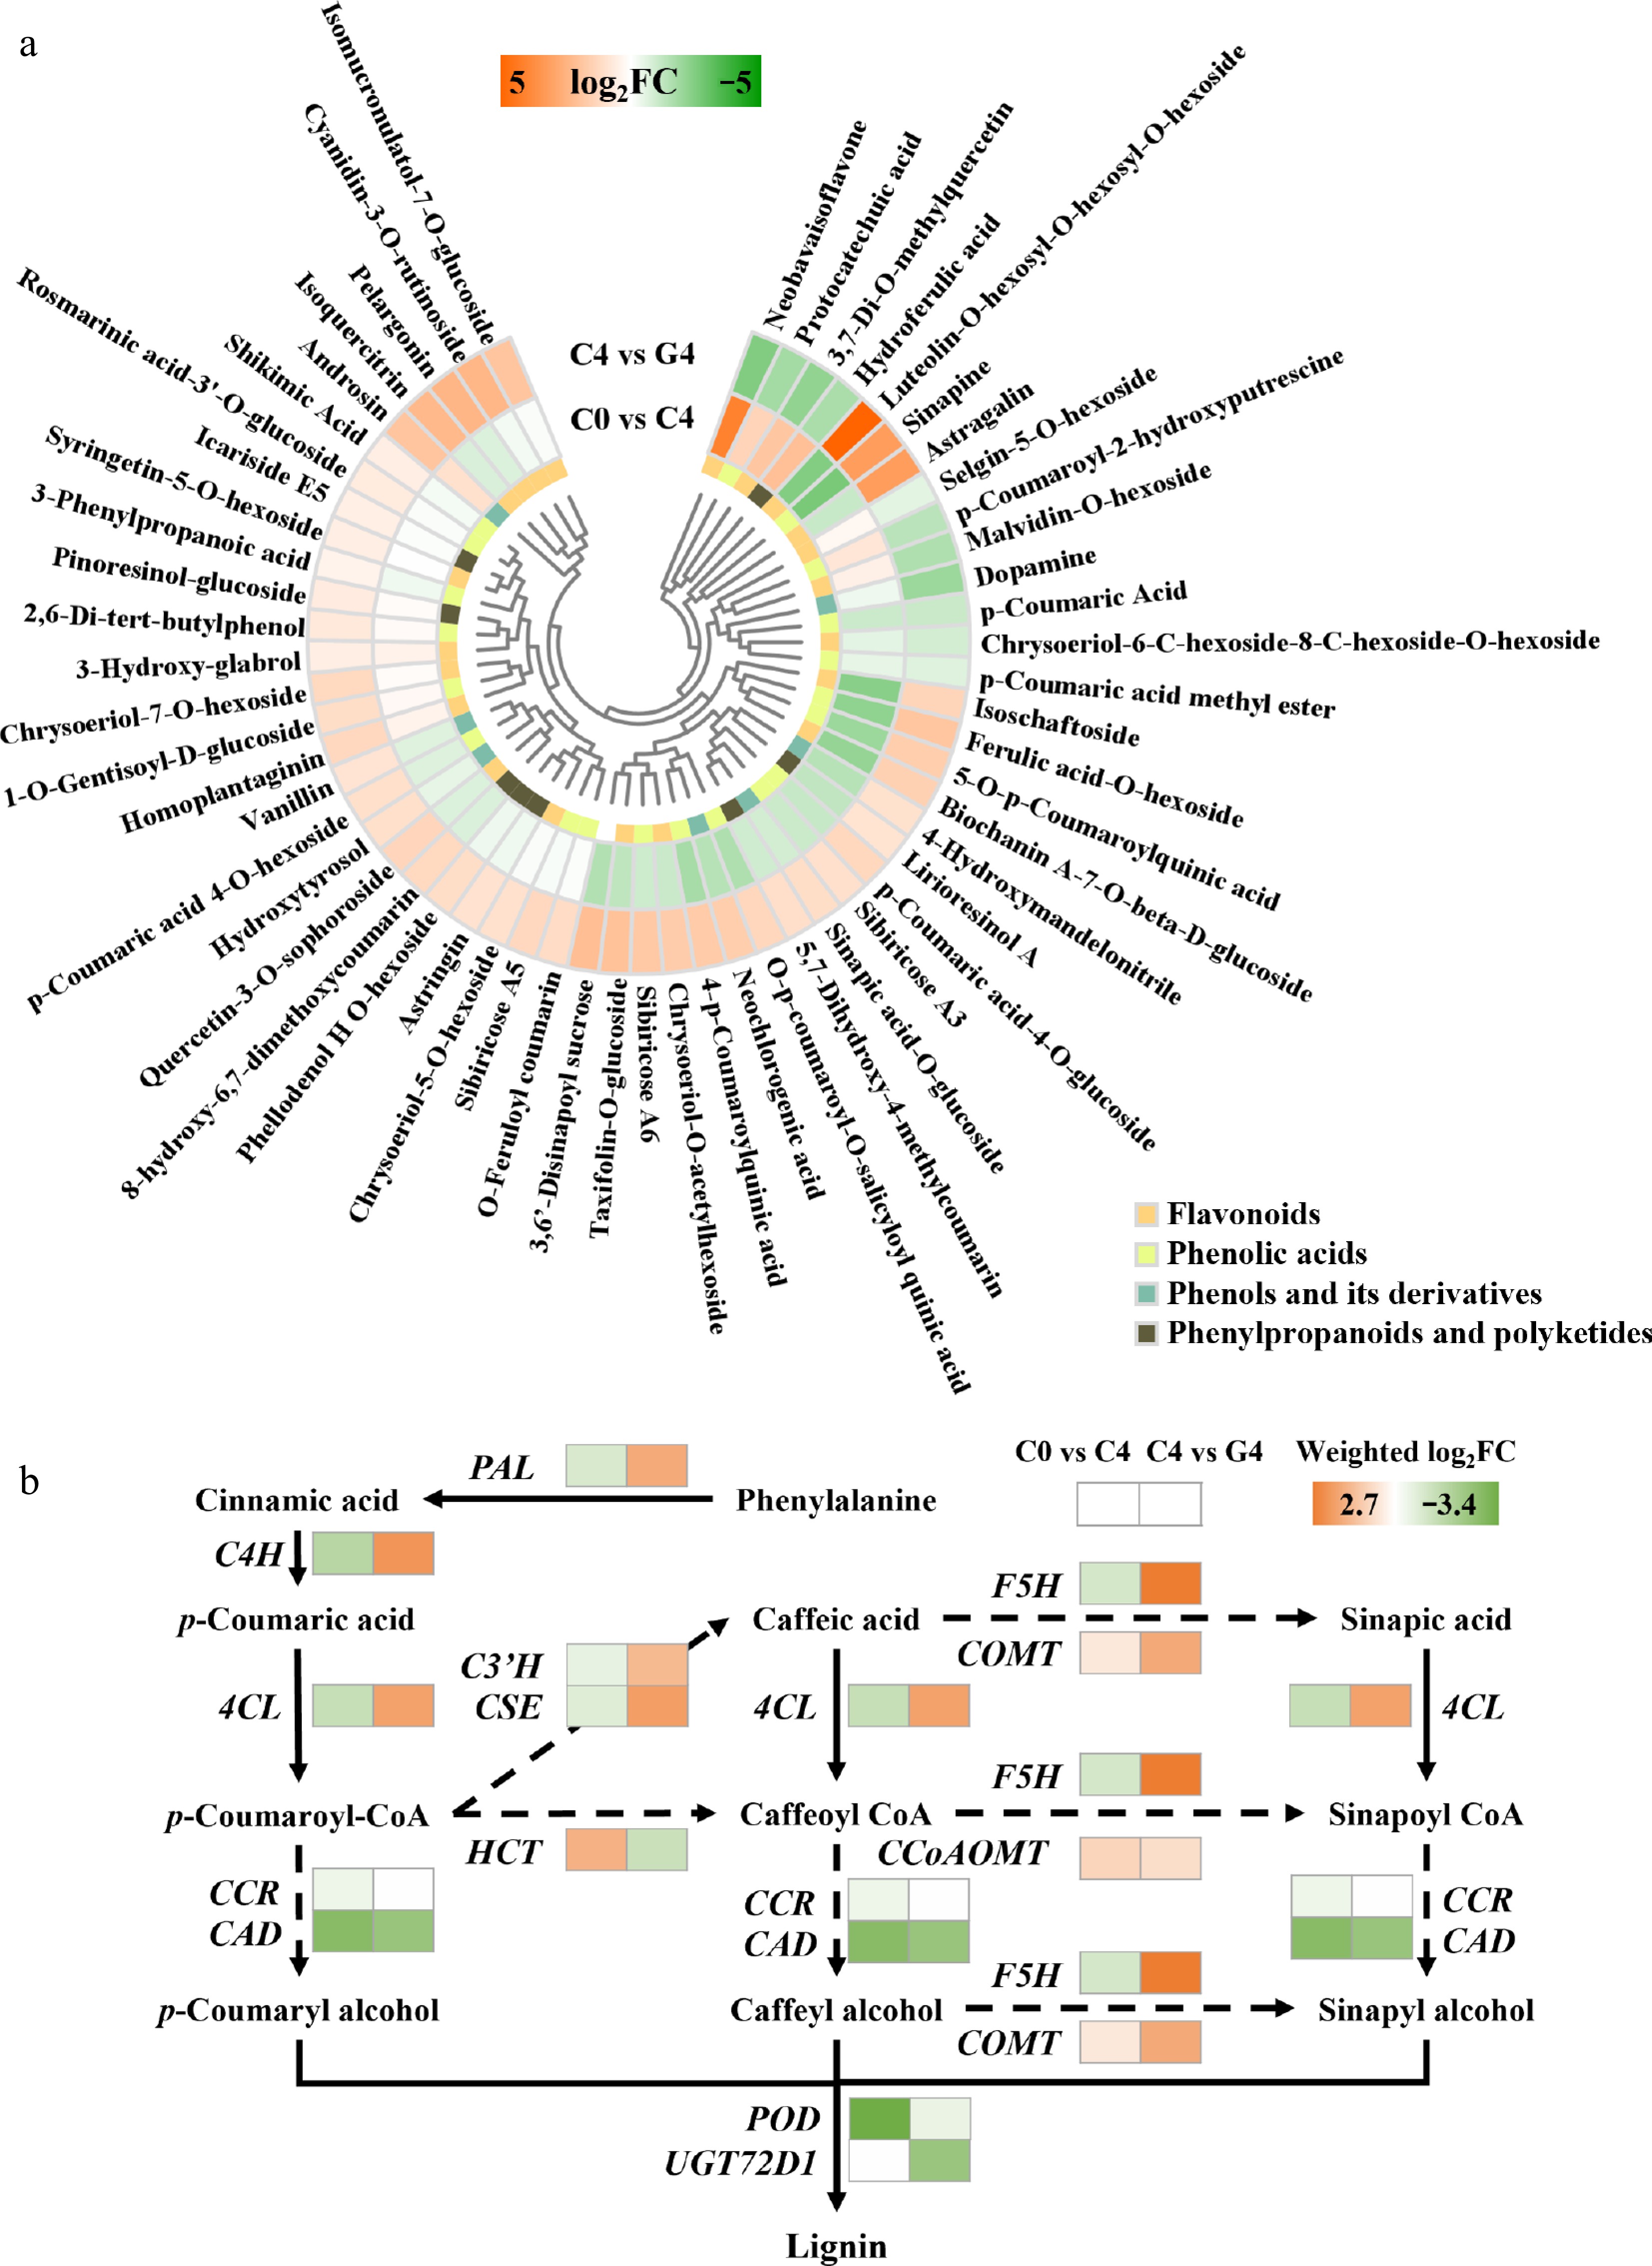
Figure 5.
Effects of GABA treatment on phenylpropanoid metabolism in baby mustard during postharvest storage. (a) Heatmap of differentially accumulated phenylpropanoid-related metabolites. (b) Heatmap of transcript changes in genes involved in the phenylpropanoid biosynthesis pathway.
-
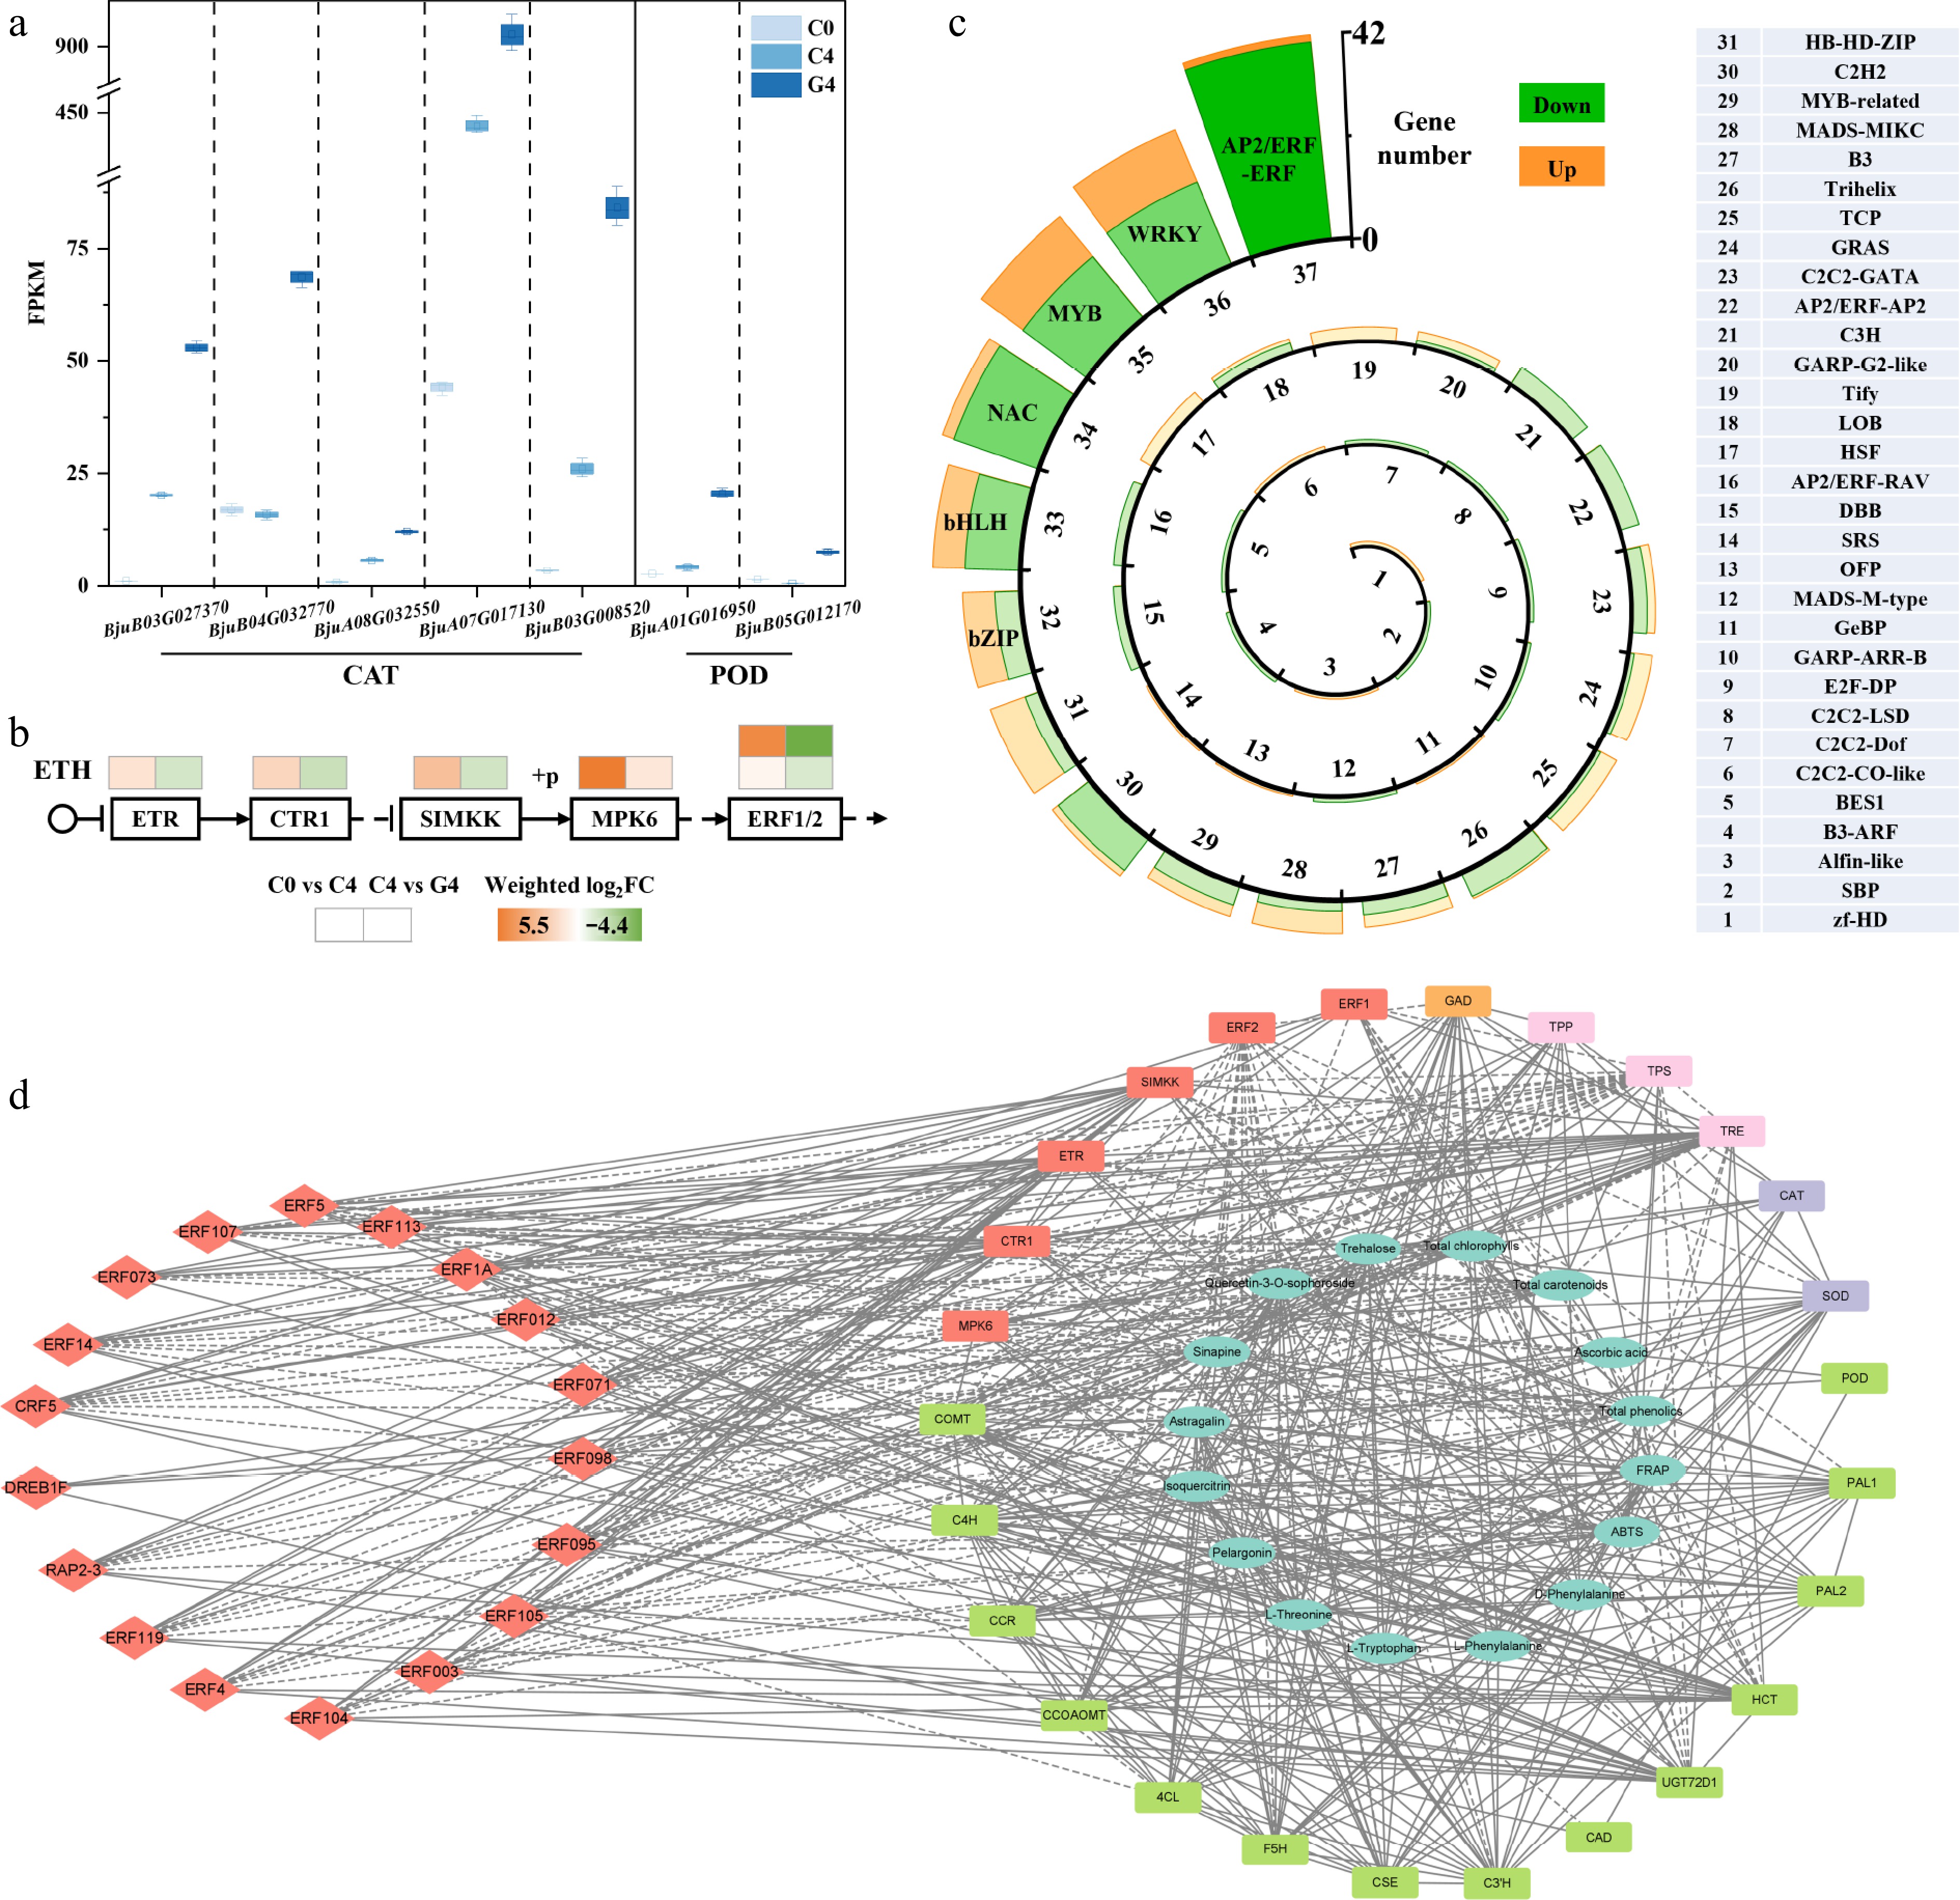
Figure 6.
Effect of GABA treatment on transcriptional regulation related to antioxidant defense and ethylene signaling in baby mustard. (a) FPKM values of differentially expressed catalase (CAT) and superoxide dismutase (SOD) genes. (b) Heatmap of transcript changes in genes involved in the ethylene signaling pathway. (c) Classification and number of differentially expressed transcription factors with opposite trends between C0 and C4 and between C4 and G4. (d) Correlation network illustrating the relationships among physiological traits, metabolites, key genes, and transcription factors. The dashed lines between indices represent negative correlations, whereas solid lines represent positive correlations. All correlations in the figure reflect Pearson correlation coefficient values above the threshold (|ρ| > 0.9).
-
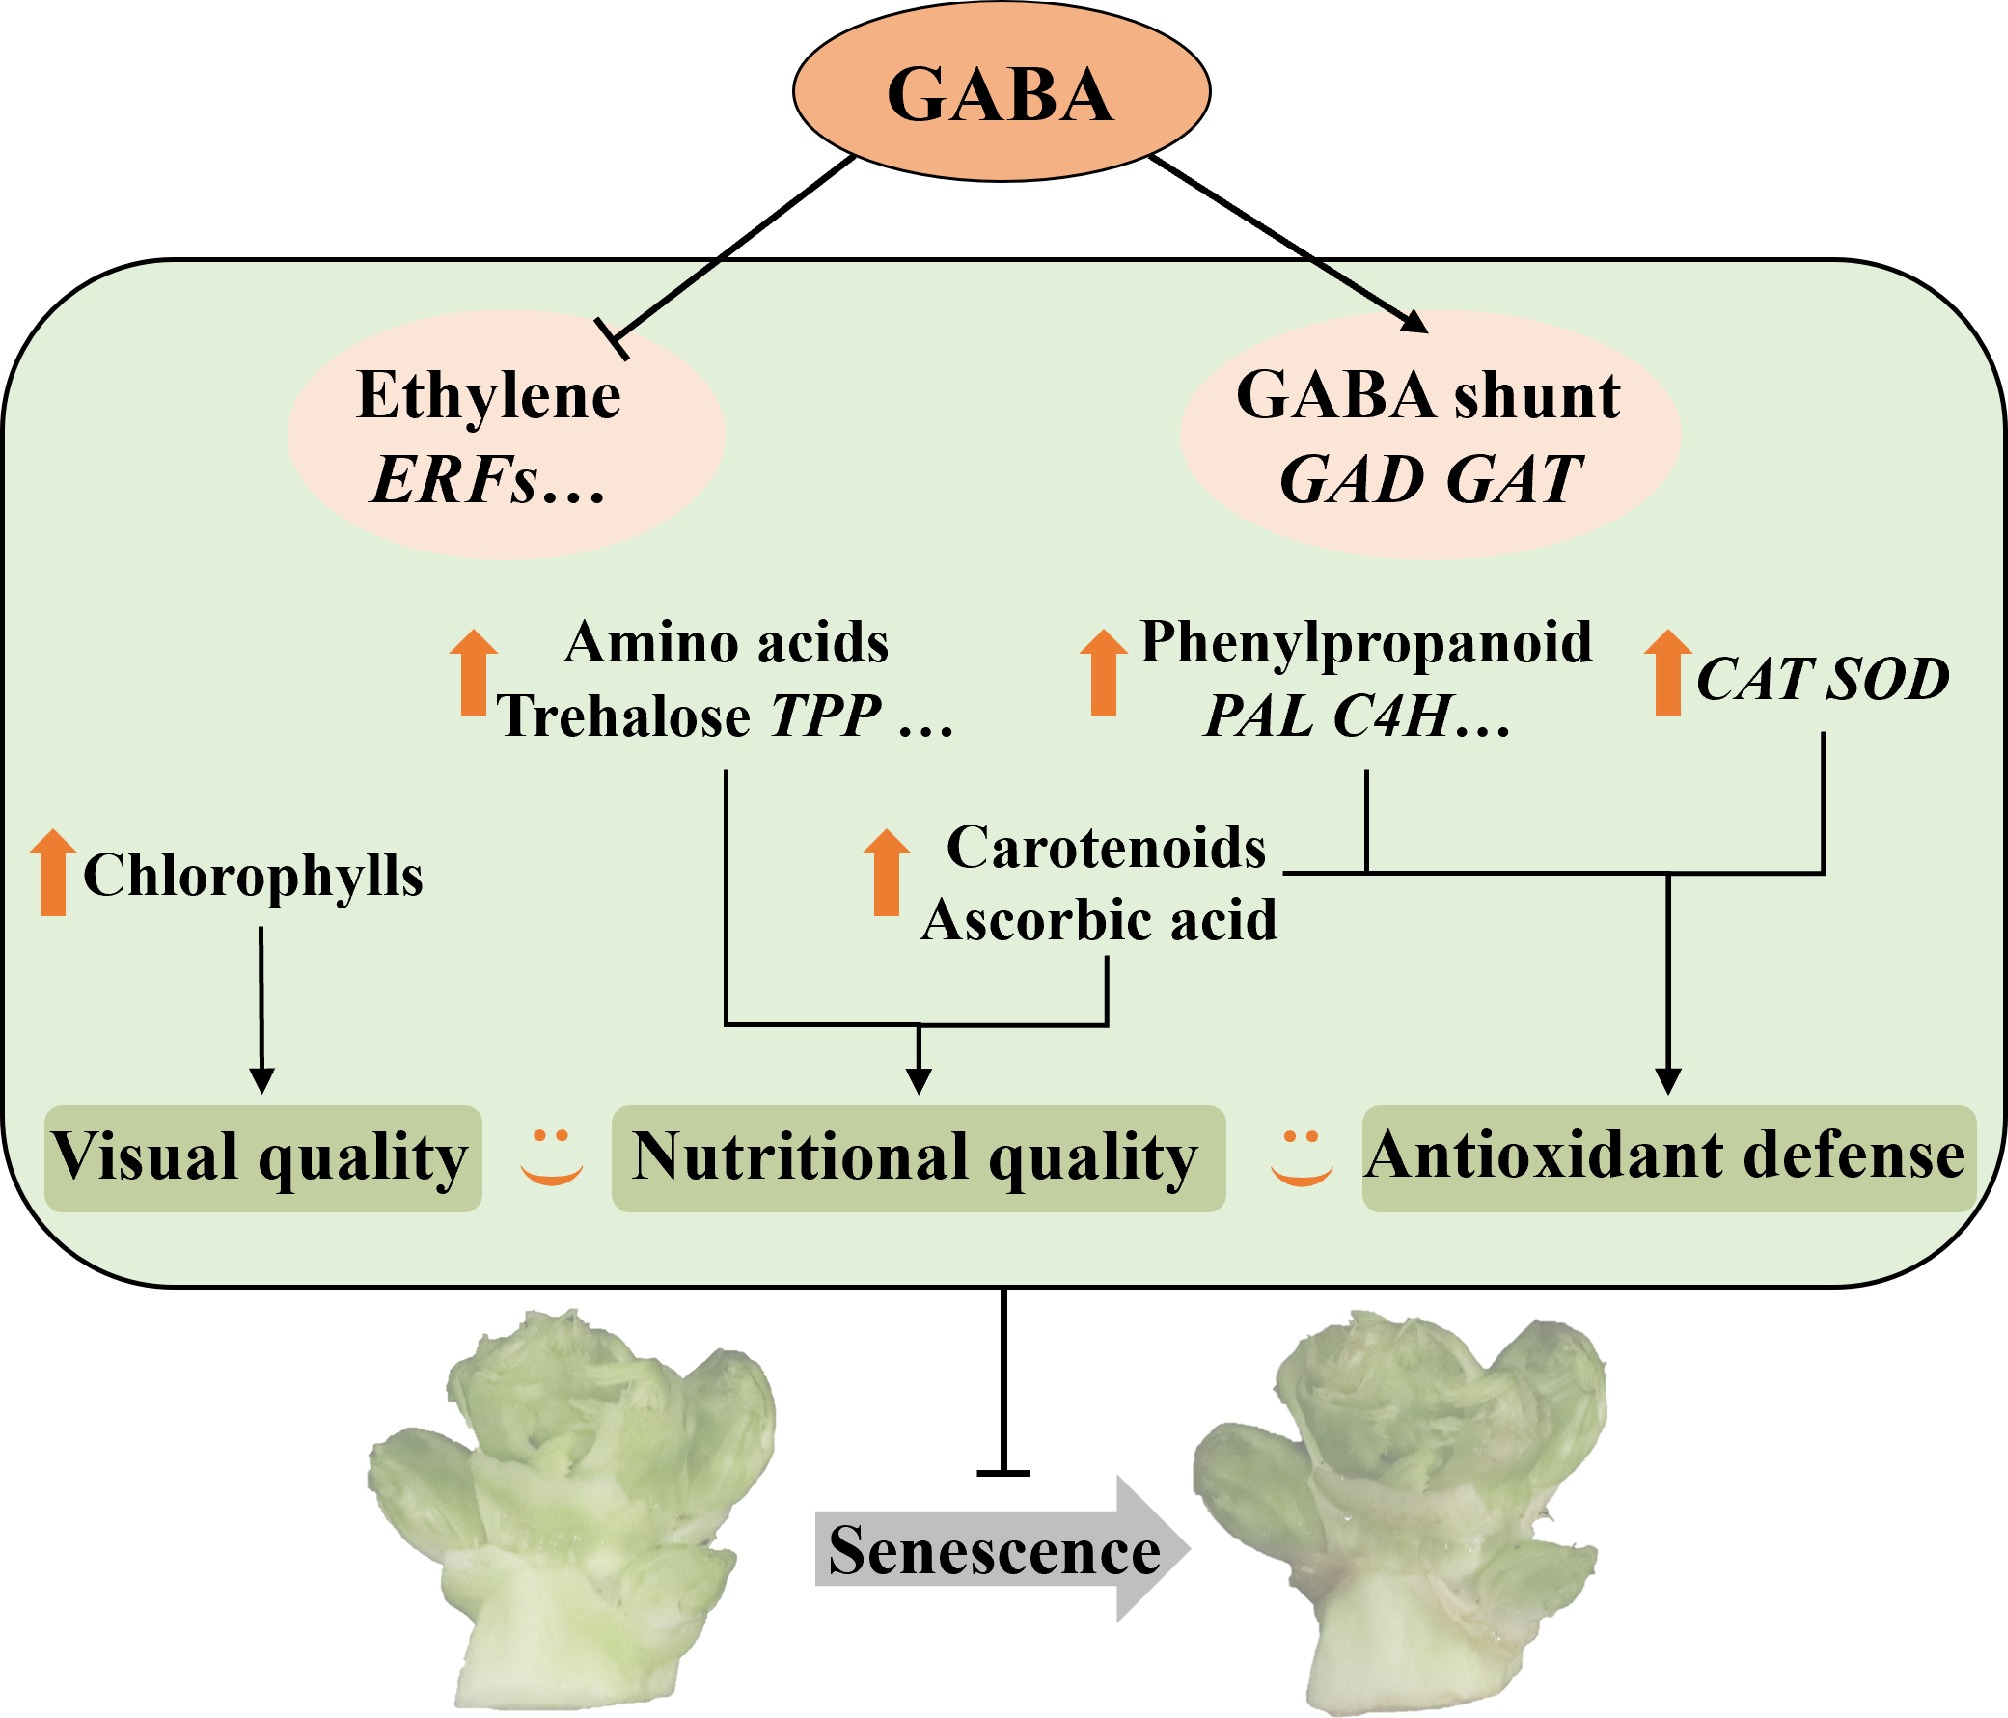
Figure 7.
Proposed model for maintaining quality and the regulation mechanism induced by GABA in baby mustard after harvest.
Figures
(7)
Tables
(0)