-
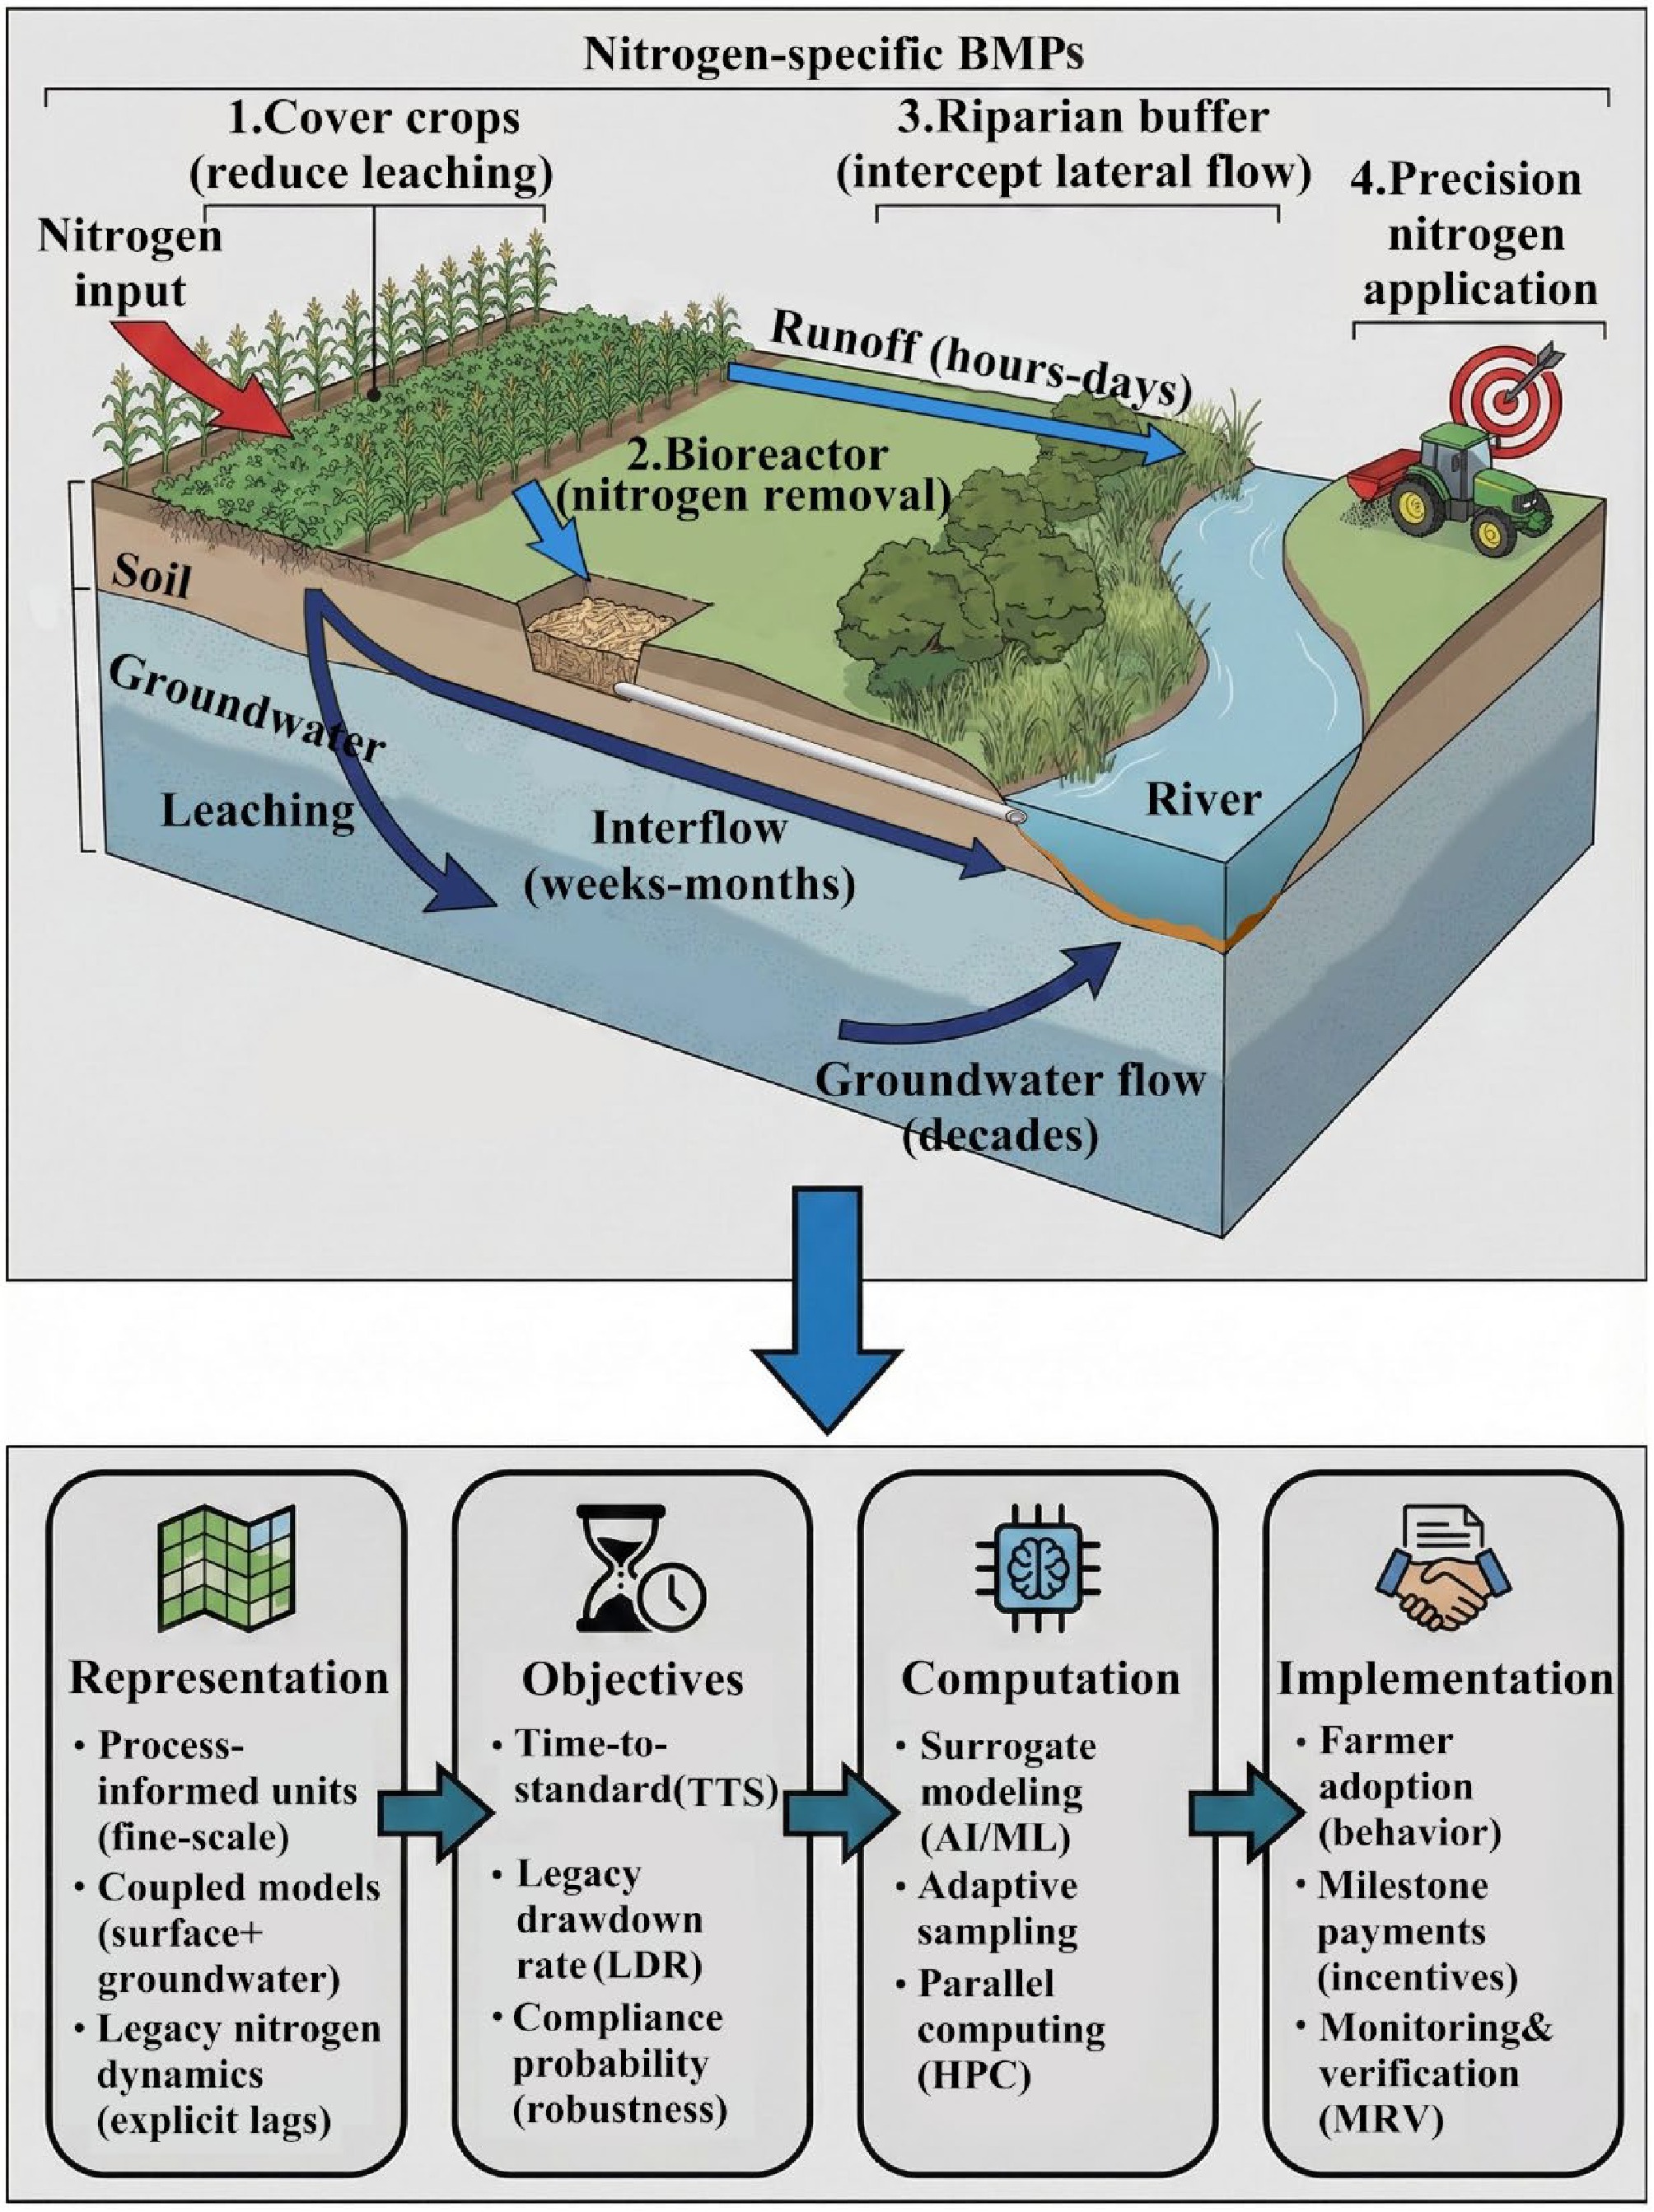
Figure 1.
Conceptual pathways and time scales of agricultural nitrogen transport and a four-layer optimization framework. Upper panel: Nitrogen originating from agricultural lands reaches receiving waters through multiple pathways, including rapid surface runoff (hours to days), intermediate shallow subsurface and interflow (days to weeks), and slow groundwater flow (years to decades). Legacy nitrogen stored in soils and aquifers further prolongs the impacts on water quality. Nitrogen-specific BMPs are strategically placed to intercept these flows, including: (1) cover crops that reduce nitrate leaching; (2) bioreactors treating; (3) riparian buffers intercepting lateral flow; and (4) precision nitrogen application controlling source inputs. Lower panel: The complexity of these spatio-temporal dynamics requires advanced modeling and optimization approaches structured across four integrated dimensions: representation, objectives, computation, and implementation.
-
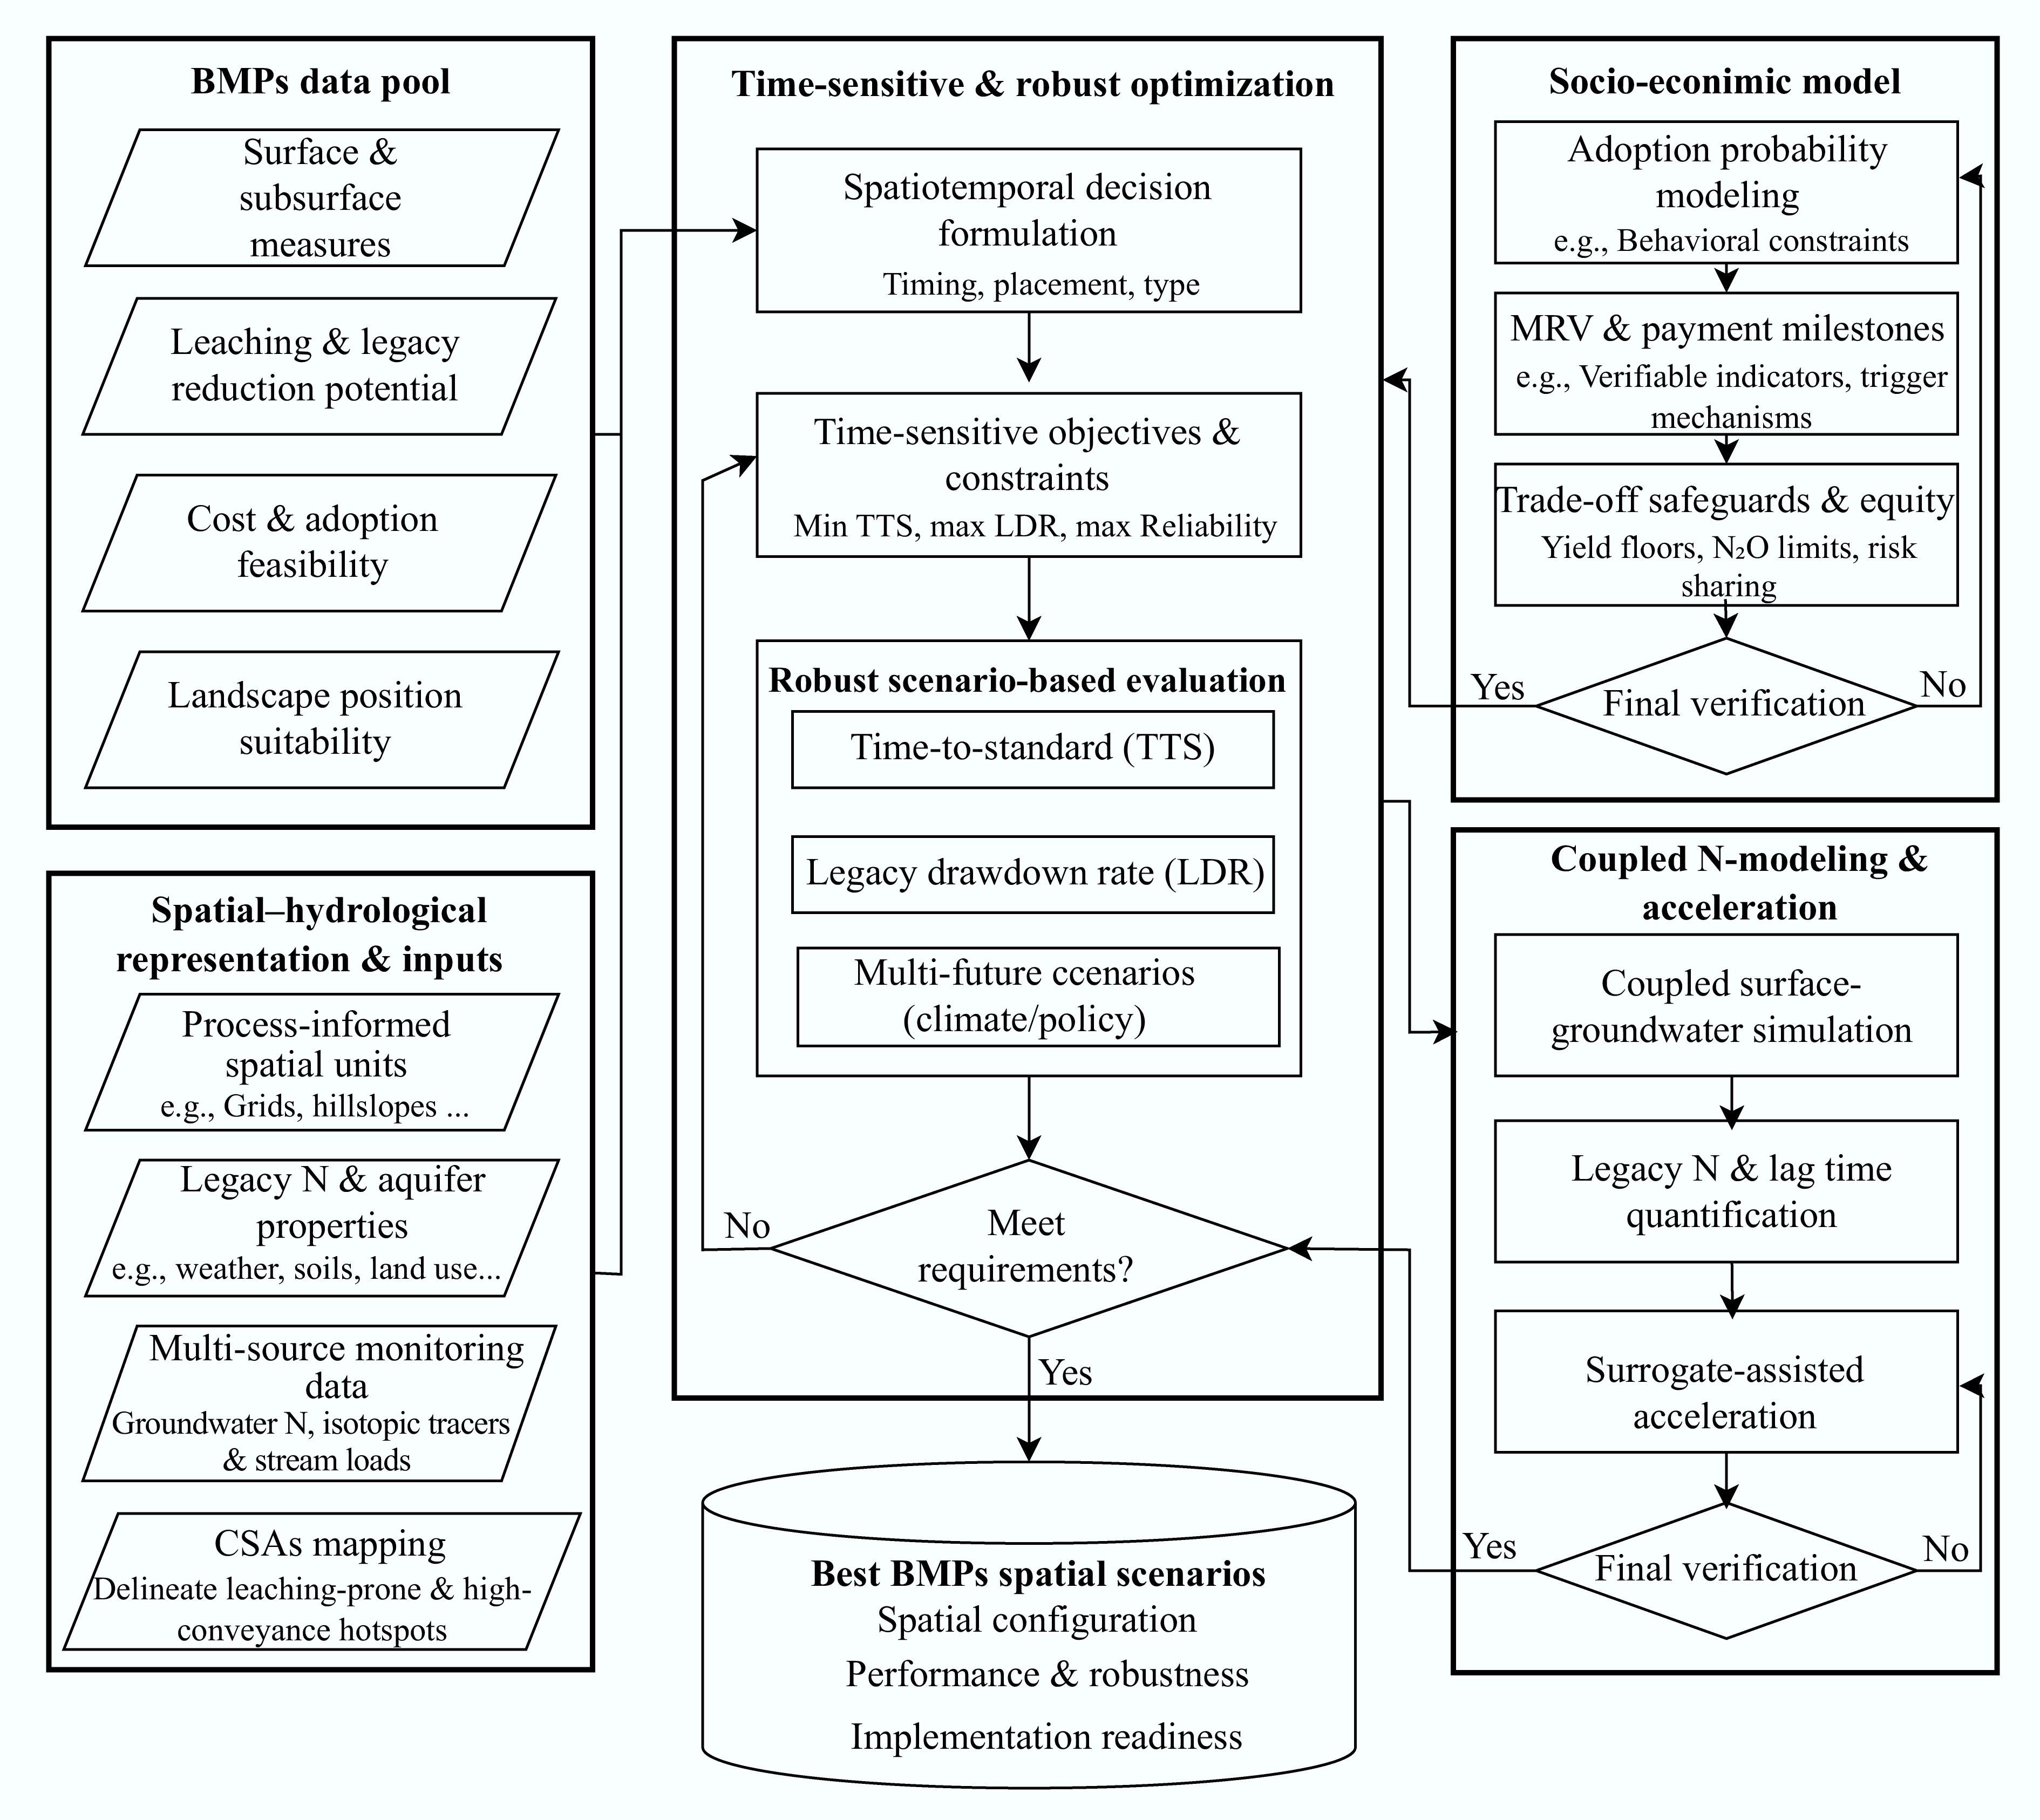
Figure 2.
Spatial configuration framework for implementing best management practices (BMPs) under hydrologic and socio-economic uncertainty. Inputs derived from the BMP data pool and the spatial–hydrological representation are integrated into a comprehensive workflow that combines multi-objective optimization with modeling and simulation. Key metrics, including time-to-standard (TTS), attainment probability, and legacy nitrogen drawdown rate (LDR) are calculated to define clear optimization objectives and constraints, facilitating robust multi-scenario assessments. The socio-economic module embeds policy considerations, evaluates practical feasibility, estimates the likelihood of farmer adoption, analyzes dynamic costs, and addresses equity. The resulting output provides implementable spatial BMP scenarios, clearly delineating spatial planning decisions and readiness for practical application.
-
Key aspects Standard BMPs optimization framework Proposed nitrogen-tailored framework Target processes Primarily targets surface runoff, soil erosion, and particulate transport (e.g., phosphorus, sediment) Explicitly targets subsurface leaching, groundwater transport,
and legacy nitrogen releaseSpatial units Uses aggregated Hydrologic Response Units (HRUs) that
often mask spatial connectivityUses process-informed units (e.g., grid cells, hillslopes) to capture leaching hotspots and subsurface connectivity Simulation models Relies on surface-focused watershed models (e.g., standard SWAT) with simplified groundwater assumptions Integrates coupled surface–groundwater models (e.g., SWAT-MODFLOW) or explicit legacy nitrogen modules Optimization objectives Focuses on static metrics: annual average load reduction and initial implementation cost Focuses on dynamic metrics, such as time-to-Standard (TTS), legacy drawdown rate (LDR), and robustness under uncertainty Implementation strategy Often assumes 100% adoption of theoretically optimal placements Embeds stochastic farmer adoption probabilities, MRV milestones, and risk-sharing safeguards directly into the design Table 1.
Comparison of standard vs nitrogen-tailored frameworks
-
Model Key N processes Groundwater and legacy nitrogen Spatial unit Strengths for nitrogen-BMPs studies Main limitations Ref. SWAT/SWAT+ Hydrology; soil–plant nitrogen cycling; leaching; routing GW linear reservoirs; legacy implicit unless extended Subbasin–HRU; Rich BMPs library; widely validated; suits multi-objective search and scenario analysis HRU mixing masks CSAs; deep GW/lag under-represented; compute-heavy [100] SWAT–MODFLOW/
GWSWEMTwo-way surface–groundwater; refined leaching and transport Explicit groundwater lags and GW-dominated N fluxes Model-dependent; many units Best where legacy/GW dominate; long-horizon realism High parameterization and runtime burden [47] ELEMeNT-N/
legacy-NMulti-pool nitrogen accumulation, residence, and release Focus on soil/GW residence times and release Sub-basin/grid Explains lagged recovery; sets long-horizon targets Needs an engineered linkage to the BMP modules [101] AnnAGNPS Event/daily runoff–erosion–nutrient export Simplified groundwater/lag representation Sub-watershed/
fieldFast scenario screening; field-scale siting Long-term nitrogen cycling simplified; low GW sensitivity [102] Table 2.
Watershed models commonly used to optimize nitrogen-focused BMPs placement
-
Study paradigm Model Spatial units Optimization objectives Consider legacy Key study metrics Relevance to
nitrogen-evolutionRef. Traditional paradigm SWAT HRUs Minimize cost and TN load No TN reduction rate (%) Standard cost-load optimization [98] Representation
evolutionSWAT Finer Units
vs HRUsModel evaluation No Model calibrationa performance Finer units required to capture
N-leaching hotspots[103] Representation
evolutionCoupled
SWATGrid-based Model evaluation Yes Nitrate concentration and flux Coupled model needed for subsurface N pathways [48] Decision evolution SWAT Sub-basins Quantify legacy N Yes Legacy N contribution (%) Case evidence for legacy N dominance; highlights failure of static metrics [87] Decision evolution SWAT Sub-basins Robust optimization No N load reduction (%) Evolution from static-optimal to robust-optimal [104] Computation evolution Surrogate
SWATHRUs Minimize cost and TN load No TN reduction rate (%) Surrogate model used to overcome computational bottleneck [72] Socio-economic
evolutionChoice experiment Farm/contract level Behavioral analysis No Farmer acceptability Links technical optimum to adoption probability and farmer preference [65] Table 3.
Recent case studies in nitrogen non-point source pollution spatial optimization and their methodological evolution
-
Algorithm Typical objectives Strengths Limitations Application context Ref. NSGA-II/NSGA-III Min TN load and cost; constraints on budget/area/compliance Mature; diverse Pareto sets; parallel-friendly Many model calls; tuning sensitive Default workhorse; pair with surrogates [105,106] Surrogate-assisted Min TN load and cost; constraints on budget/area/compliance Orders-of-magnitude
speed-up; UQ possibleExtrapolation risk; needs active learning Focus sampling near the Pareto front [71] Robust/chance-constrained Meet TN goals under uncertainty (climate/params) Low-regret; resilient to extremes Extra computation; risk weighting choices matter Sensitive watersheds; regulatory certainty [107] MILP/MINLP Min cost for target reductions; policy/fairness constraints Global optima for linear/convex; interpretable Hard with strong nonlinearity; needs decomposition Target-based planning; layered with heuristics [108] Table 4.
Optimization algorithms for nitrogen-focused BMPs design
-
Regions Jurisdiction Binding baseline Contracting and incentives MRV footing (milestones) Implications for optimization objectives (left), constraints (middle), and targeting (right) United States Clean Water Act; Farm Bill Basin load budgets via TMDLs; ag-NPS controls voluntary mainly[88] Payments, transaction costs, practice complexity; risk sharing via exemptions/price floors/insurance[65] Near-field nitrate (reach conc./flux), outlet conc./flux, buffer connectivity/vegetation cover Expected abatement/
compliance probabilityConstraints: MRV feasibility and risk-sharing costs Leaching-prone, connectivity-strong parcels European Union Water Framework Directive; Nitrates Directive NVZ action programmes;
basin-scale good status[109]Result-based/hybrid contracts reduce outcome-risk premia[16] Regulatory monitoring enables indicator-linked staged payments Risk-adjusted incremental benefit over baseline Baseline as hard bound Supra-baseline measures with high MRV sensitivity China River Chief System; eco-compensation Administrative accountability; land-conversion limits in prime grain belts[97] Inter-jurisdiction transfers; emphasis on yield-neutral measures[110] Milestones aligned to assessment windows; near-field indicators used to show interim progress Expected abatement with crop-return safeguard Land-use bounds Precision nitrogen and edge-of-field denitrification in connected, leaching-prone parcels Table 5.
Institutional regimes and optimisation implications for nitrogen-focused BMPs spatial configuration
Figures
(2)
Tables
(5)