-
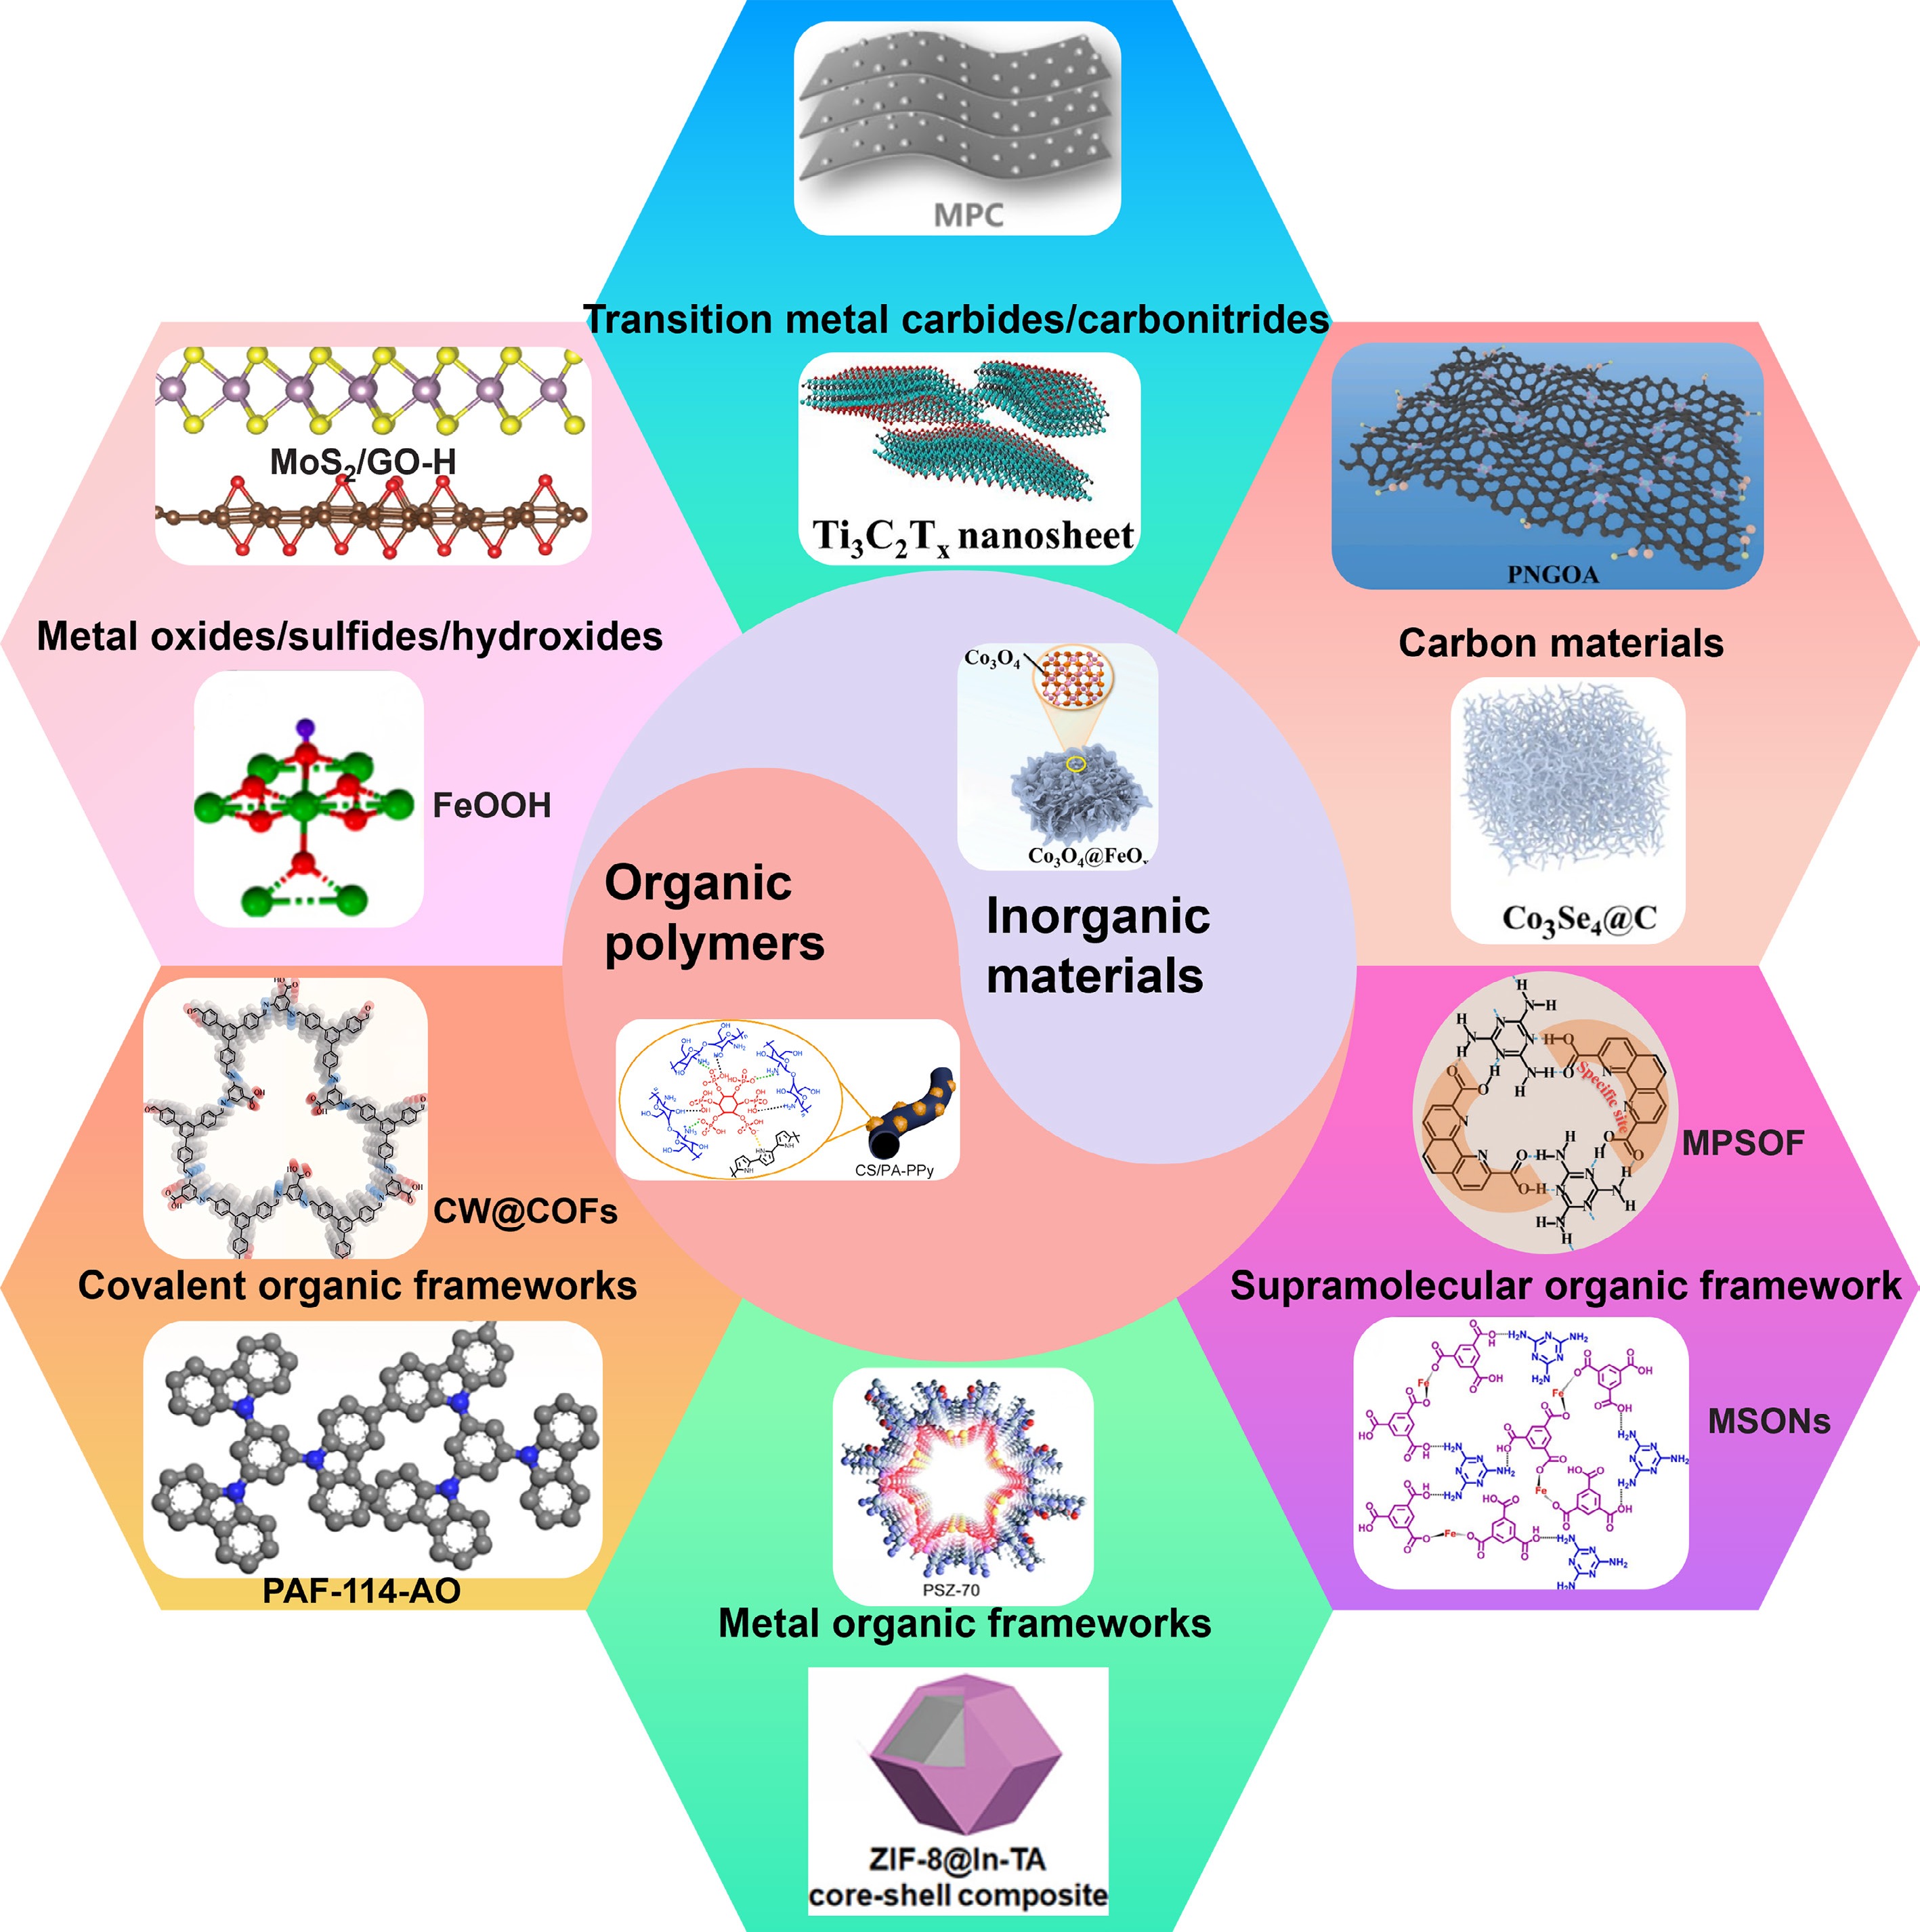
Figure 1.
Common electrode materials for the extraction and removal of uranyl.
-
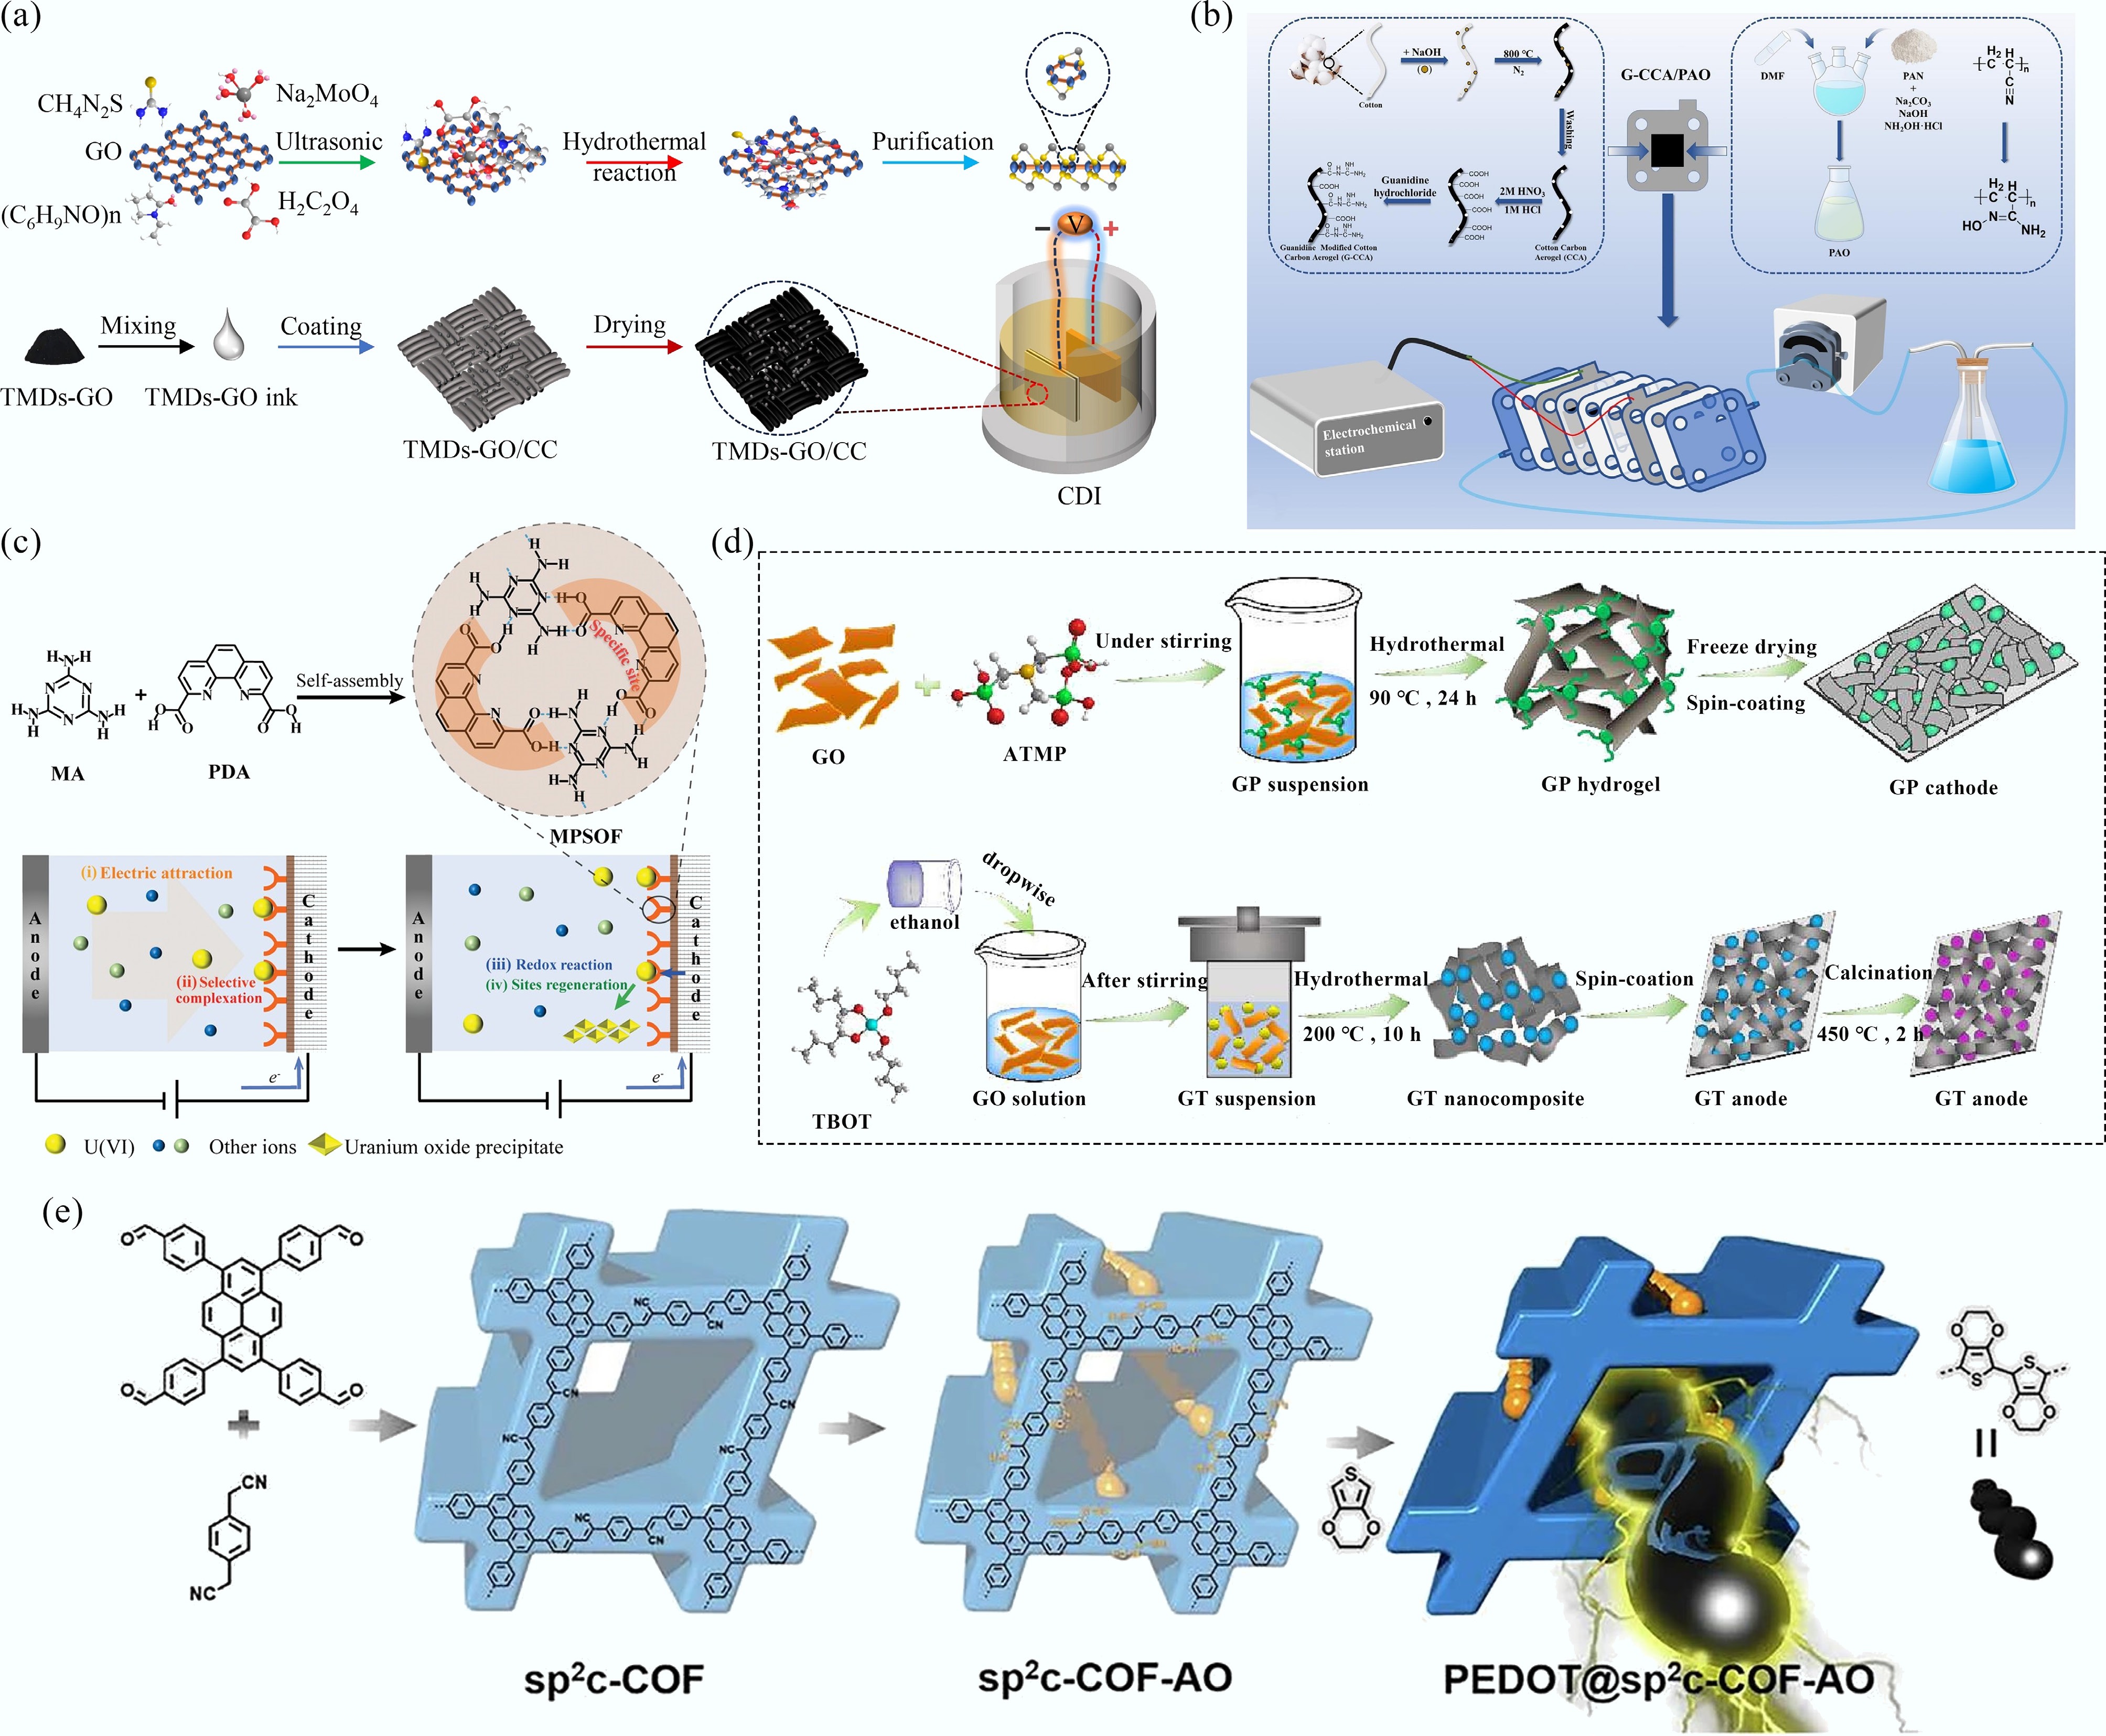
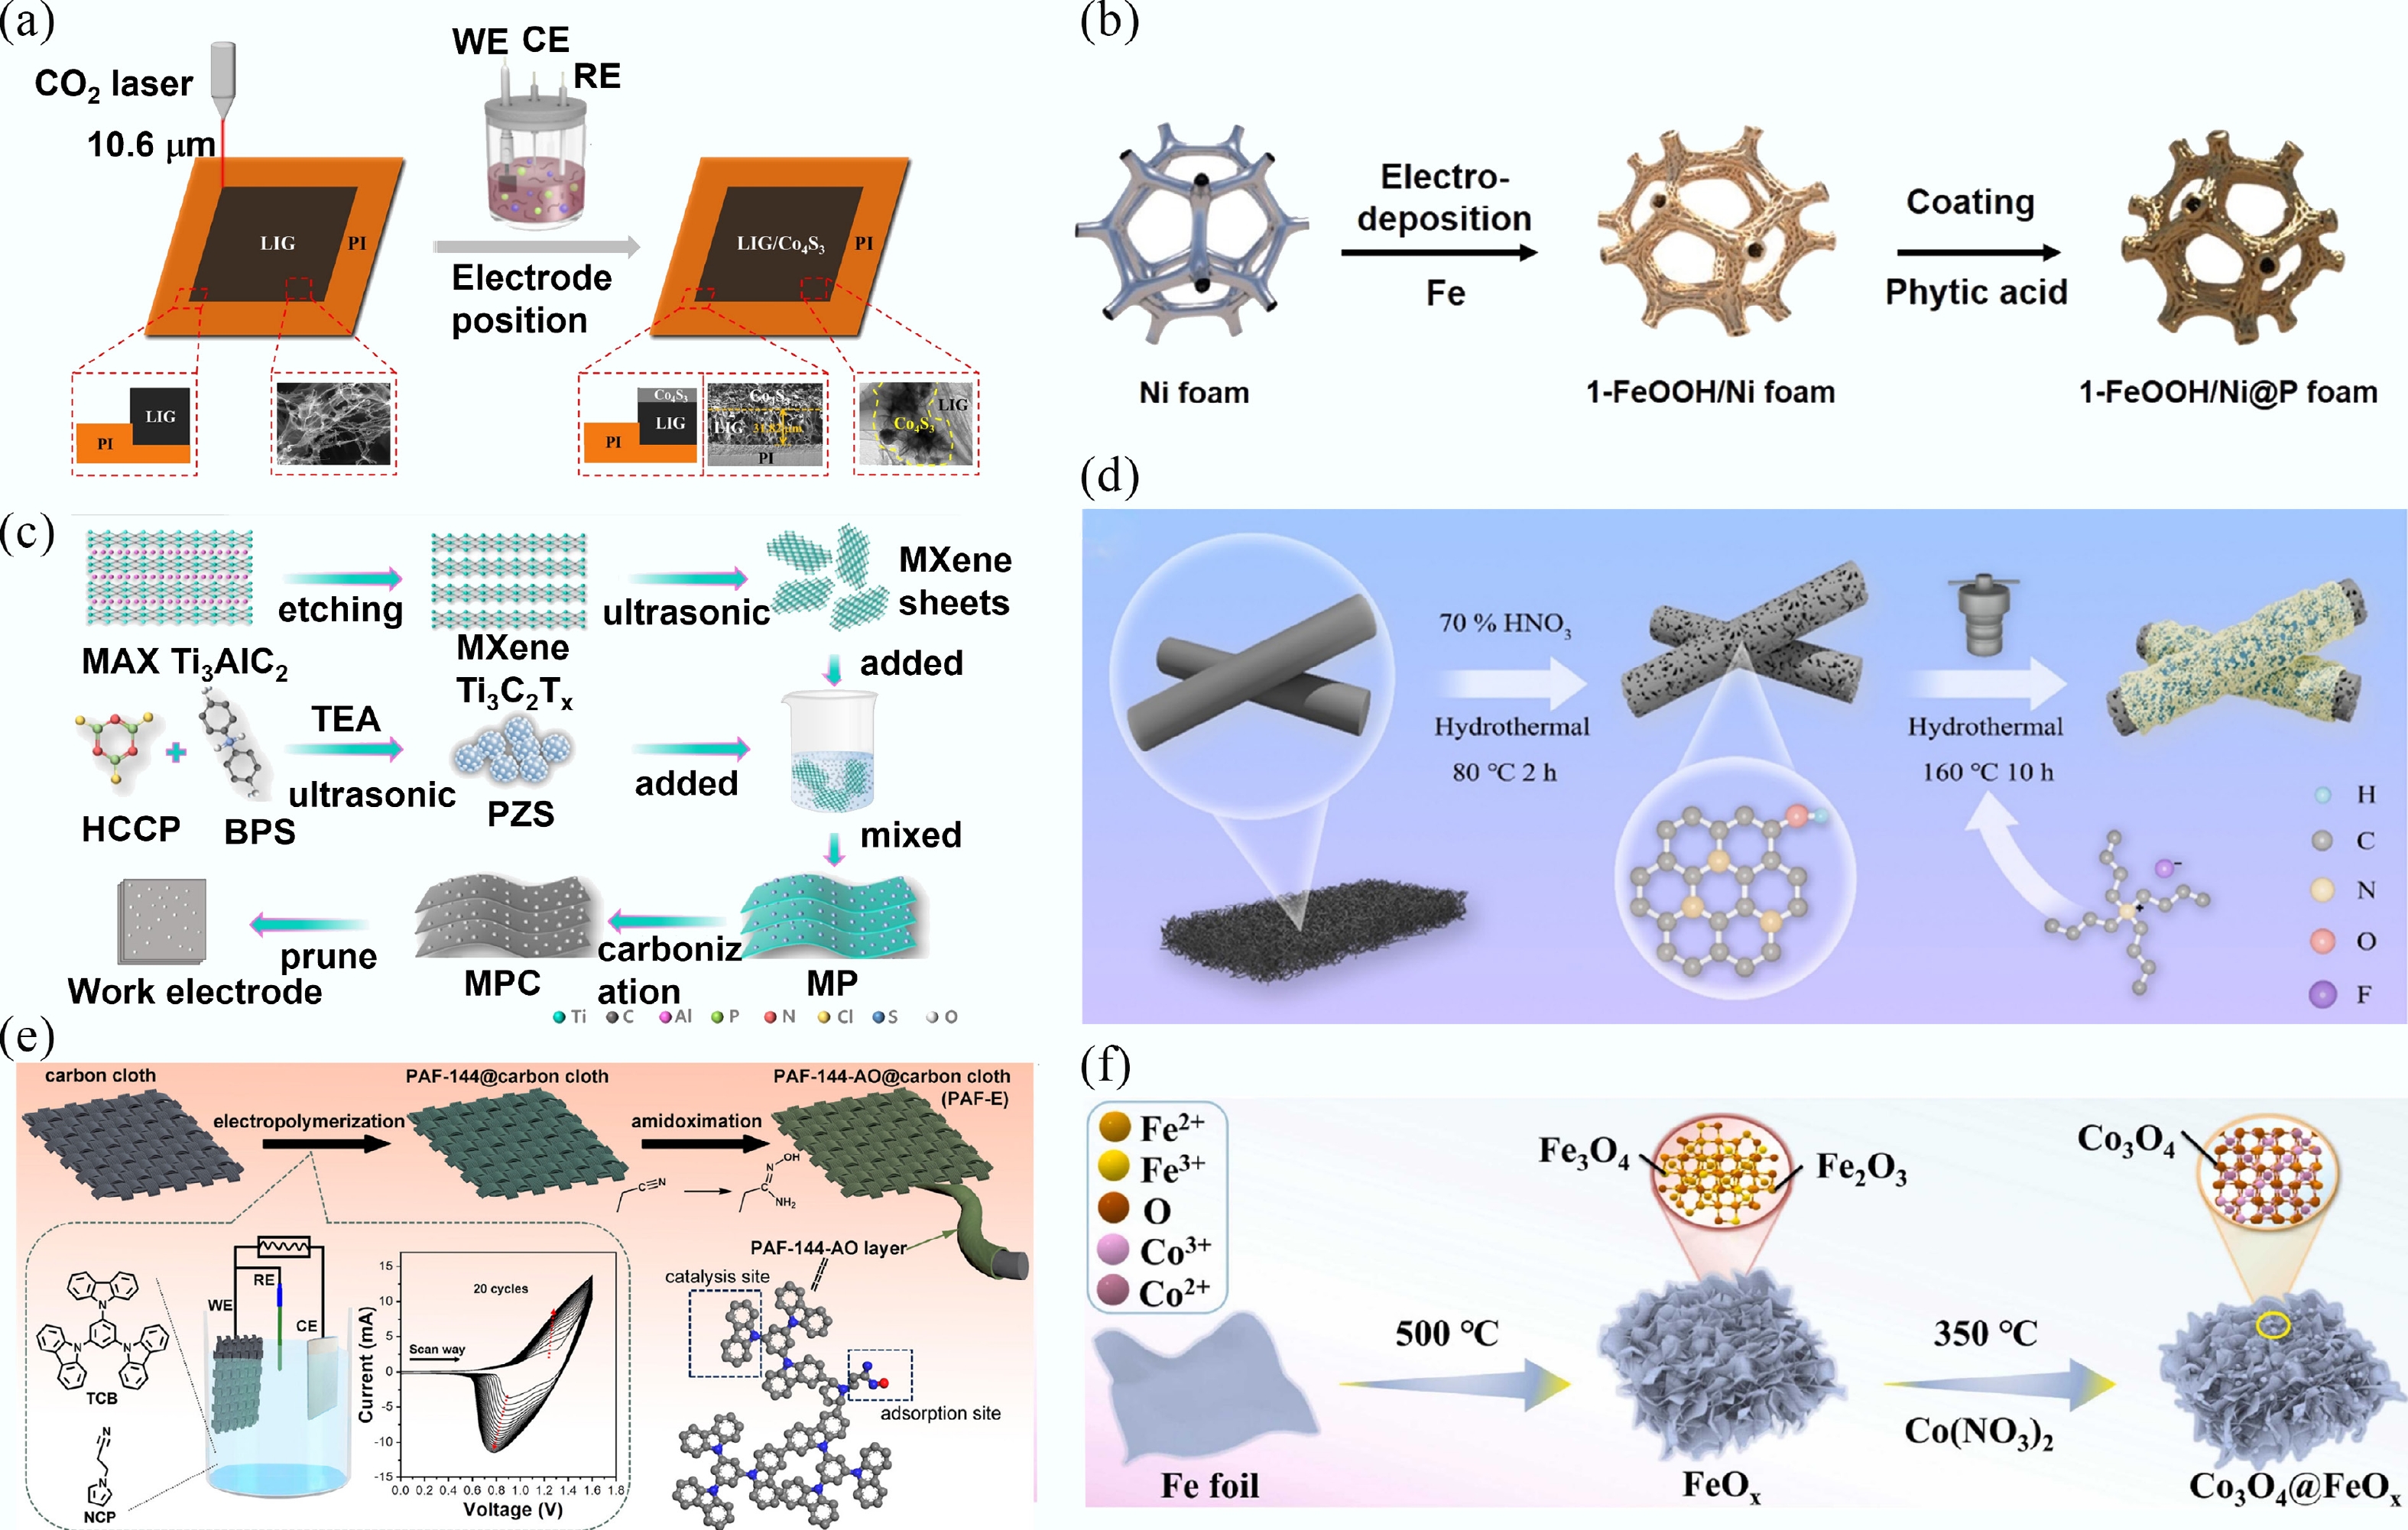
Figure 2.
(a), (b) Schematic illustrations for the synthesis of TMDs-GO and fabrication of TMDs-GO/CC electrodes[32], and G-CCA/PAO electrode[36]. (c) Schematic illustration for the synthesis of SOF and electrochemical uranyl extraction[21]. (d), (e) Schematic illustrations of the synthesis of GP and GT materials[35], COF-based materials[34].
-
-
-
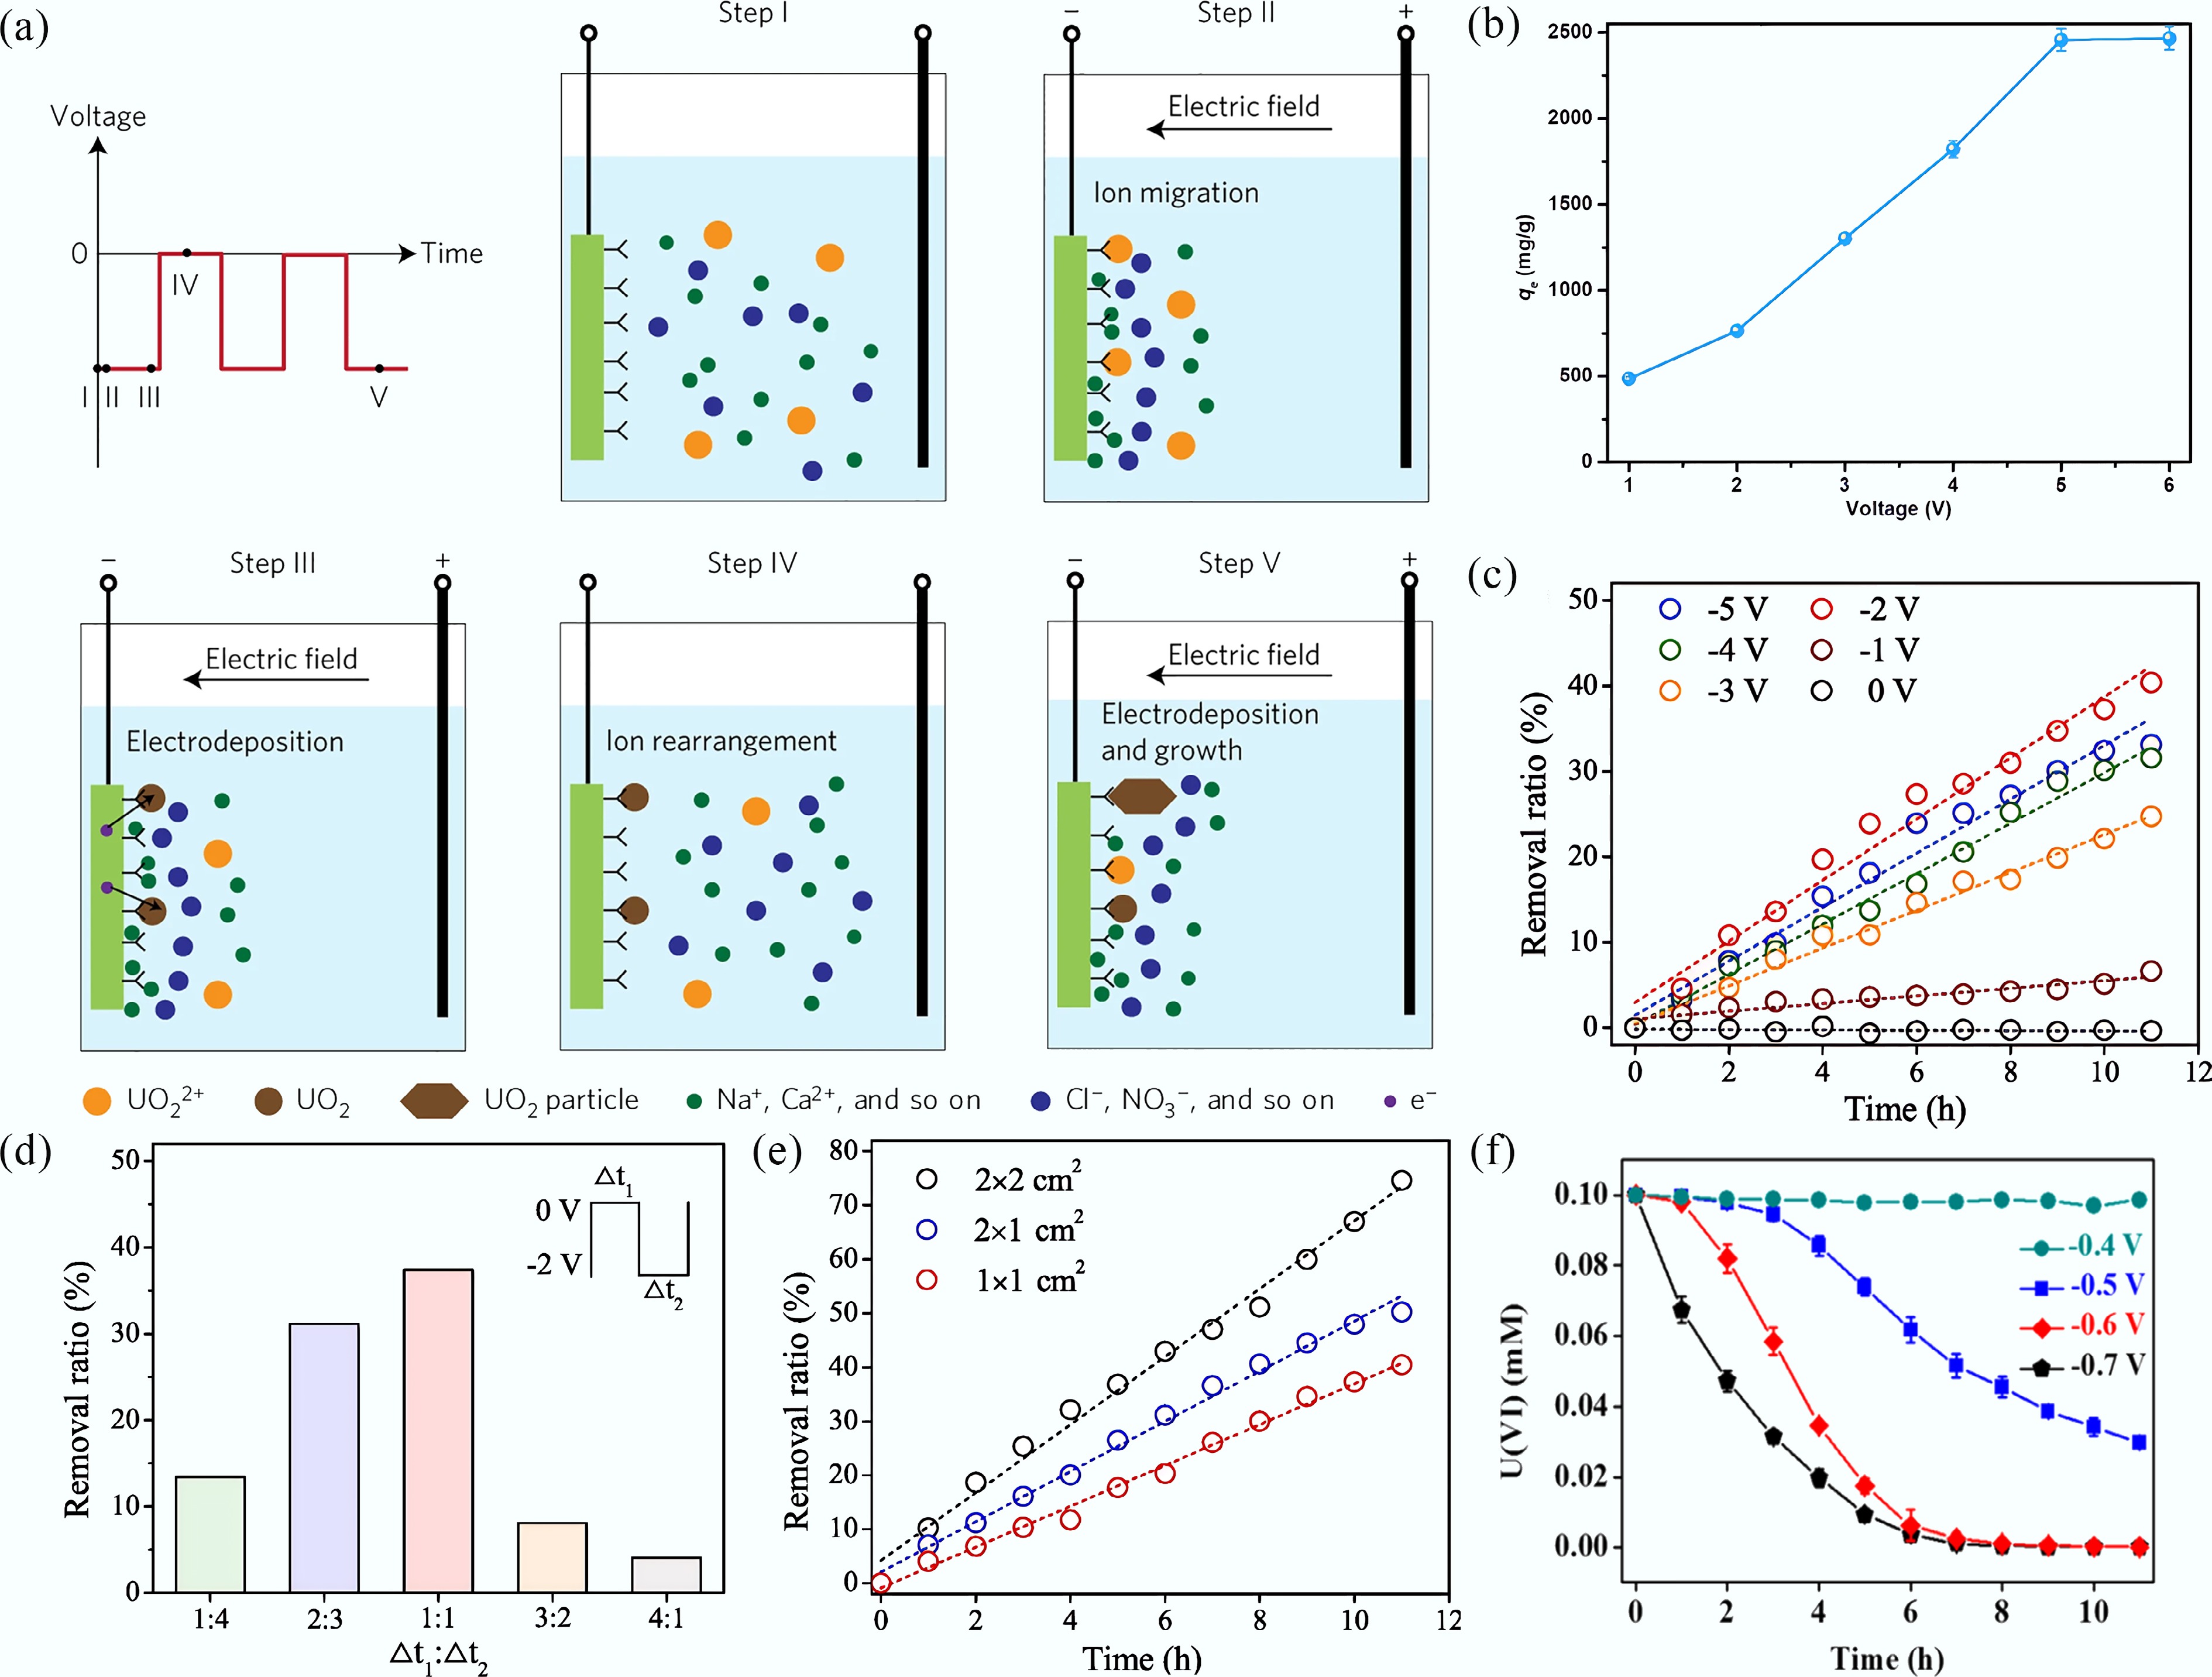
Figure 5.
(a) The uranyl extraction processes in HW-ACE[64]. (b) Effect of the voltage at uranyl-spiked seawater. (c) Electrochemical removal of uranyl at different voltages using HW-ACE method. (d) Electrochemical removal of uranyl at different time ratios of power-off/power-on at the certain frequency (400 Hz). (e), (f) Electrochemical removal of uranyl at different contact areas[65] and different potentials[67].
-
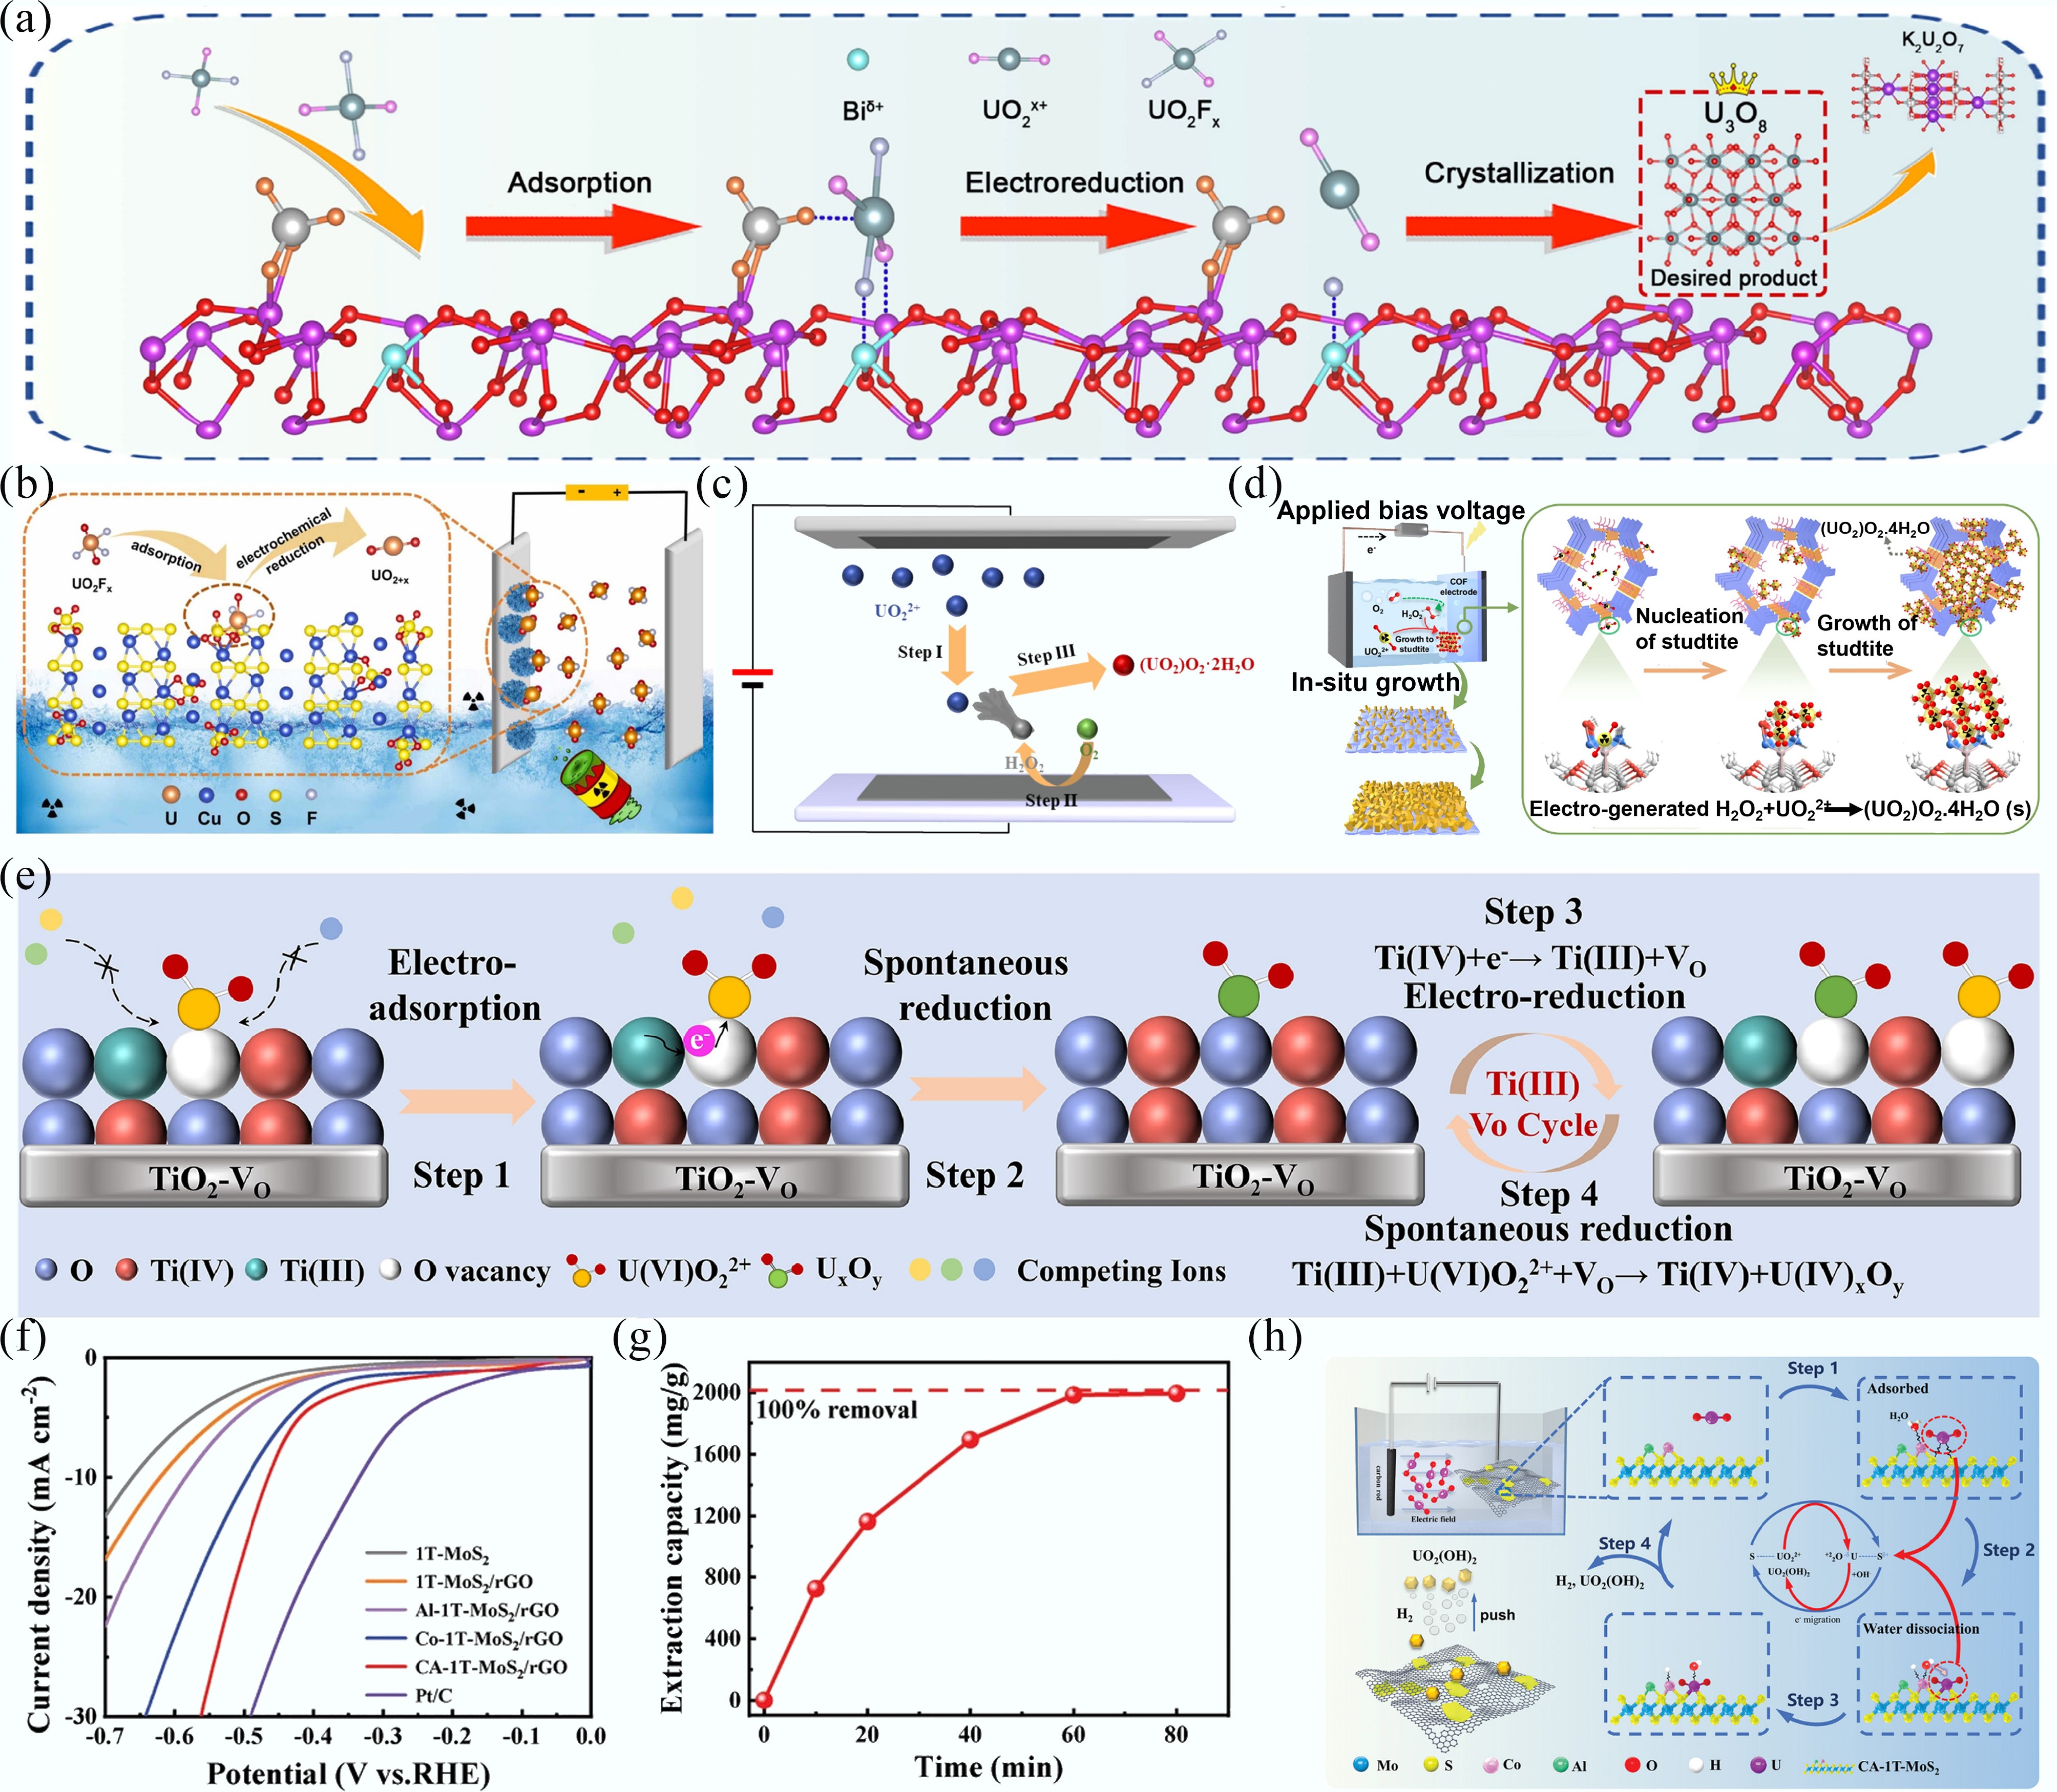
Figure 6.
(a), (b) The mechanism for electrocatalytic reduction of uranyl by Ca5(PO4)3(OH)-Bi2O3-x[73] and Cu-S-O nanosheets[74]. (c), (d) Schematic diagram for uranyl extraction using Co3Se4@C[75] and PAE-COF-AO@CC[71]. (e) The removal mechanism of electrochemical method for TiO2-VO electrode[42]. (f) LSV curves of different materials. (g) Uranyl extraction capacity plot in 100 mg/L uranyl-containing simulated seawater. (h) Schematic diagram for uranyl extraction using the electrochemical method[76].
-
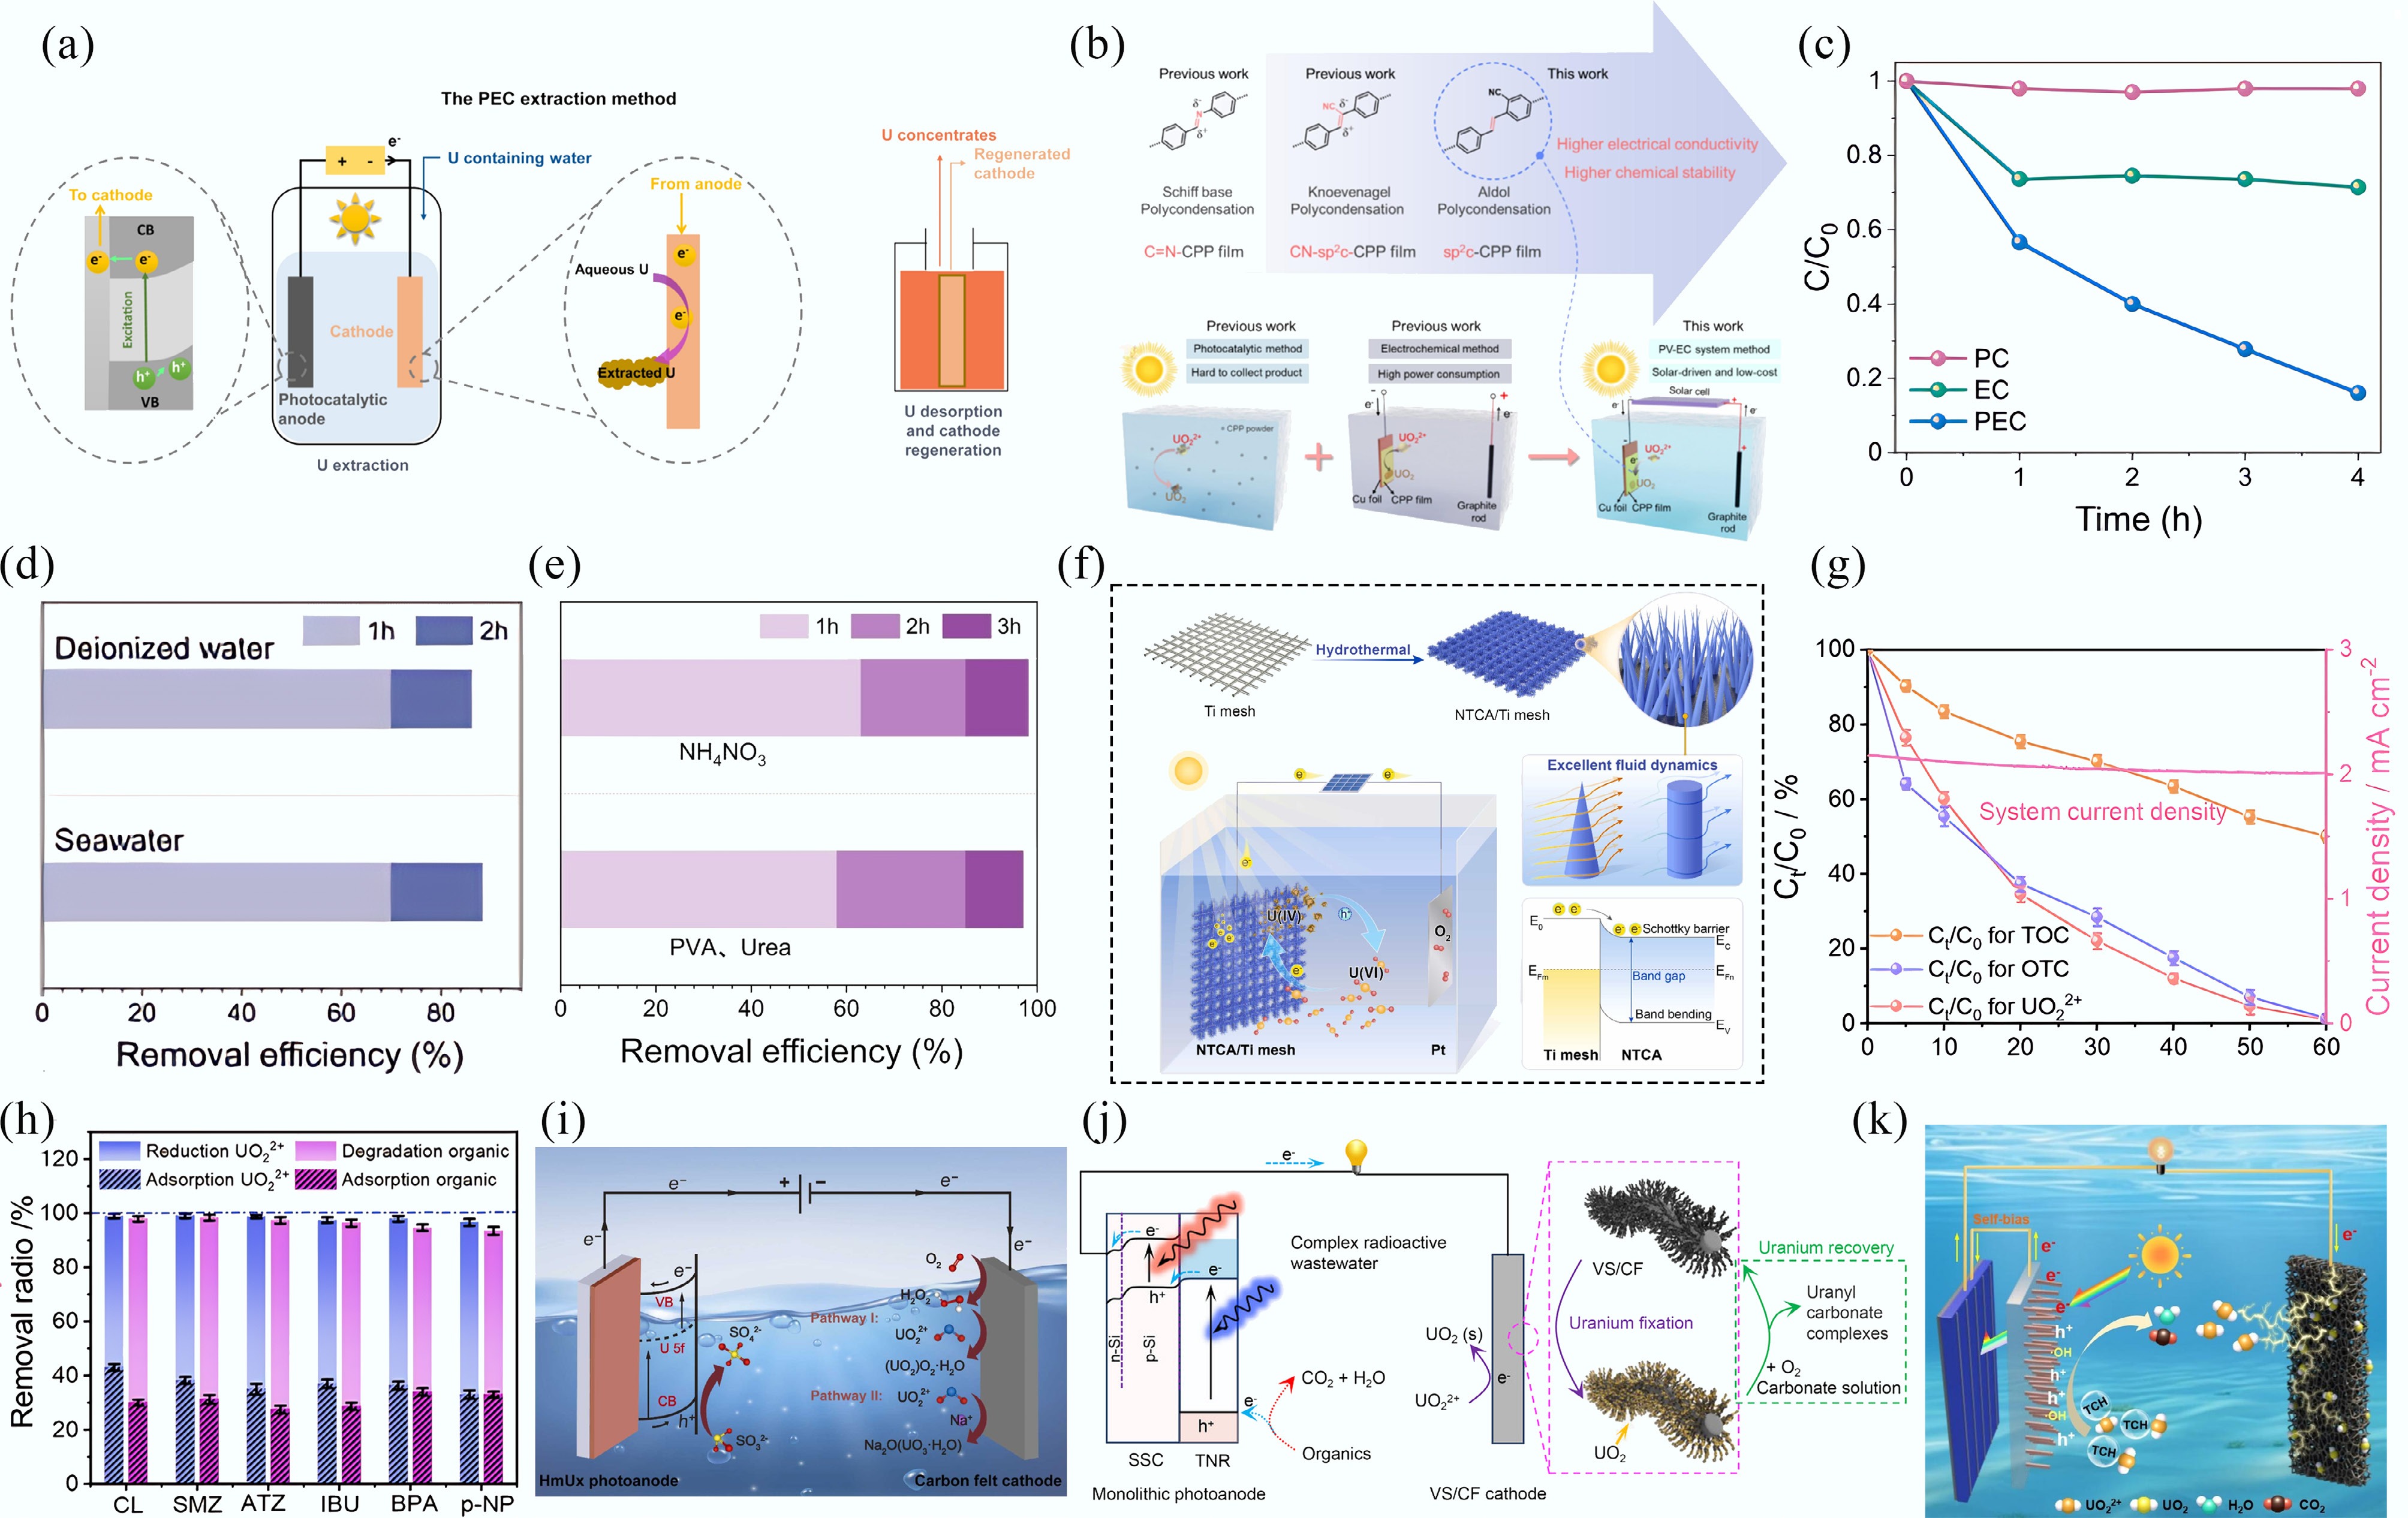
Figure 7.
(a) The PEC uranyl extraction method[78]. (b) Engineering of the sp2c-CPPs electrodes for solar-driven electrochemical uranyl extraction[79]. (c) PEC, EC, and PC performance of the NTCA/Ti mesh. (d) PEC performance evaluation with real seawater. (e) PEC performance evaluation with real uranium-containing wastewater. (f) The PEC investigation of uranyl immobilization on the NTCA/Ti mesh[81]. (g) Performance of PEC for simultaneous uranyl removal and OTC degradation. (h) Removal efficiencies of uranyl and organics in the treatment of different organic pollutants[86]. (i)−(k) Schematic illustration of the HmU-based photoelectrochemical system[87], VS/CF cathode and TNR anode[88], and NF cathode and TNR photoanode[89] for uranyl extraction.
-
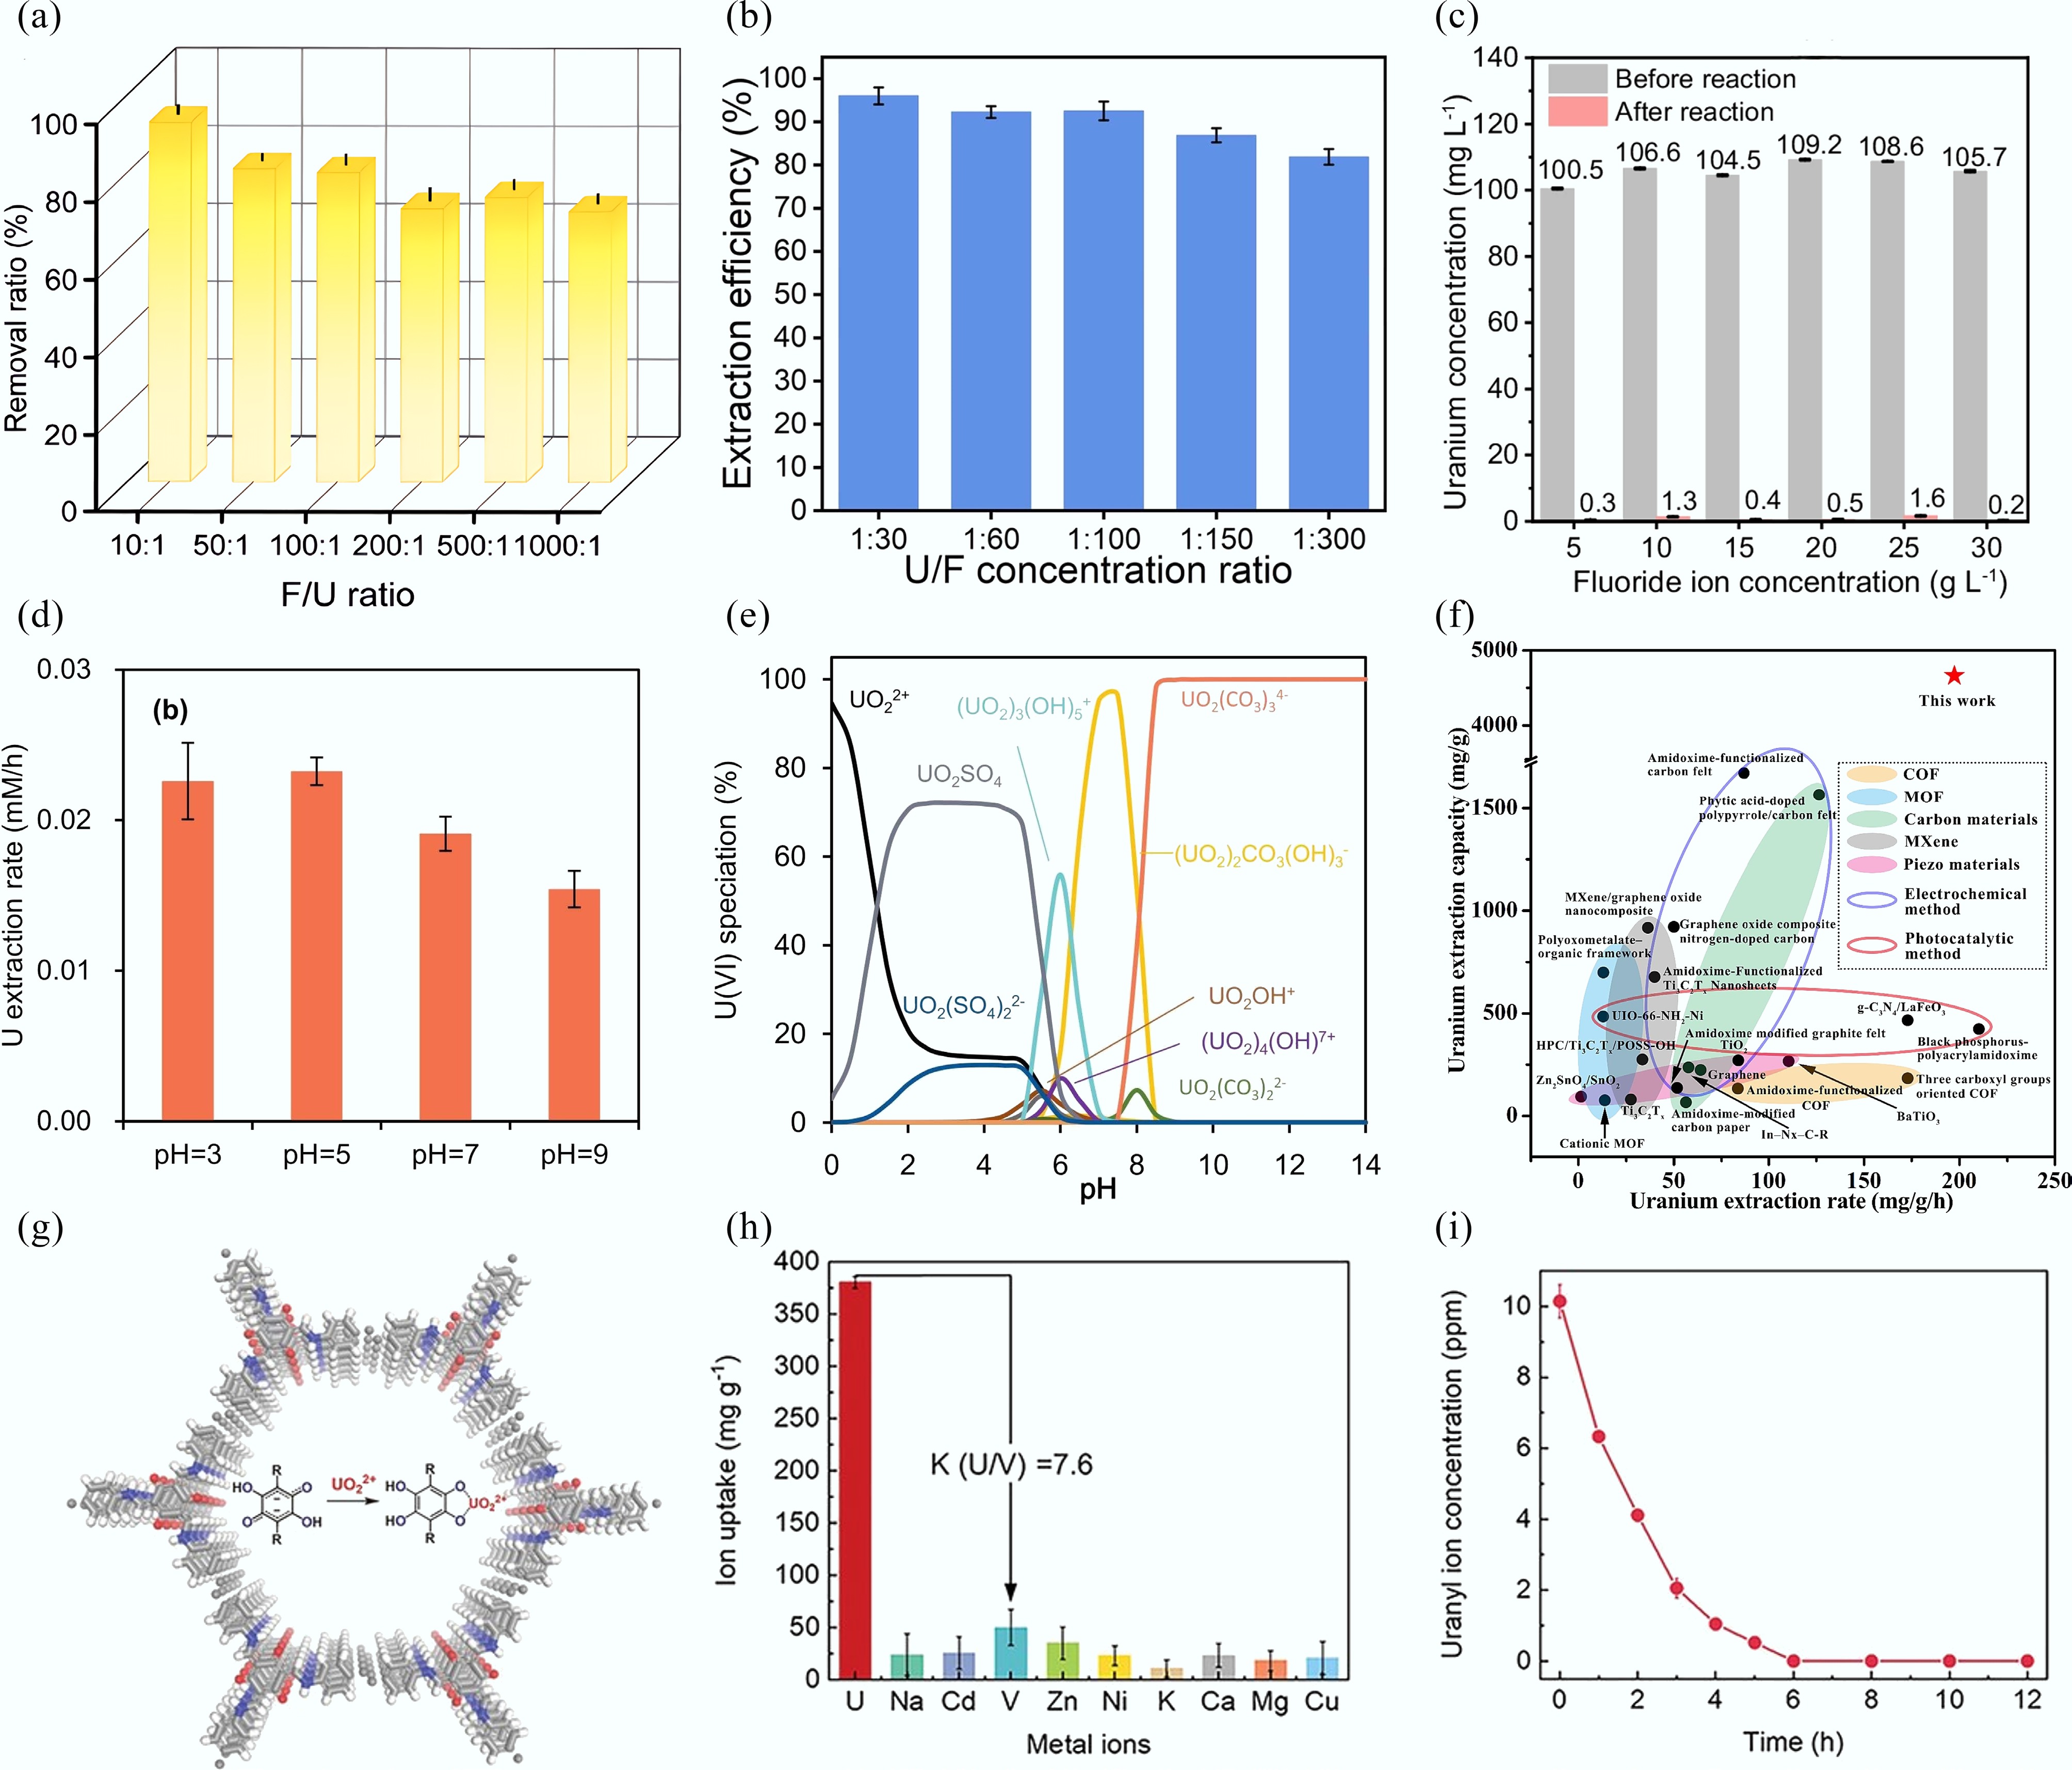
Figure 8.
(a), (b) Uranyl extraction efficiency at various fluorine/uranium ratios by CoOx[93] and Cu-S-O nanosheets[74]. (c), (d) Uranyl extraction efficiency with different F− concentration[94], and varying pH value. (e) The modelled pH-dependent uranyl speciation profile[99]. (f) Comparison of uranyl extraction performance in electrochemical methods, and other reported methods or materials[100]. (g) Structural diagram of MICOF-14. (h) Ion uptake of MICOF-14 for uranyl ions in the presence of various interfering ions. (i) Removal capability of MICOF-14 from 10 mg/L uranyl aqueous solution[105].
-
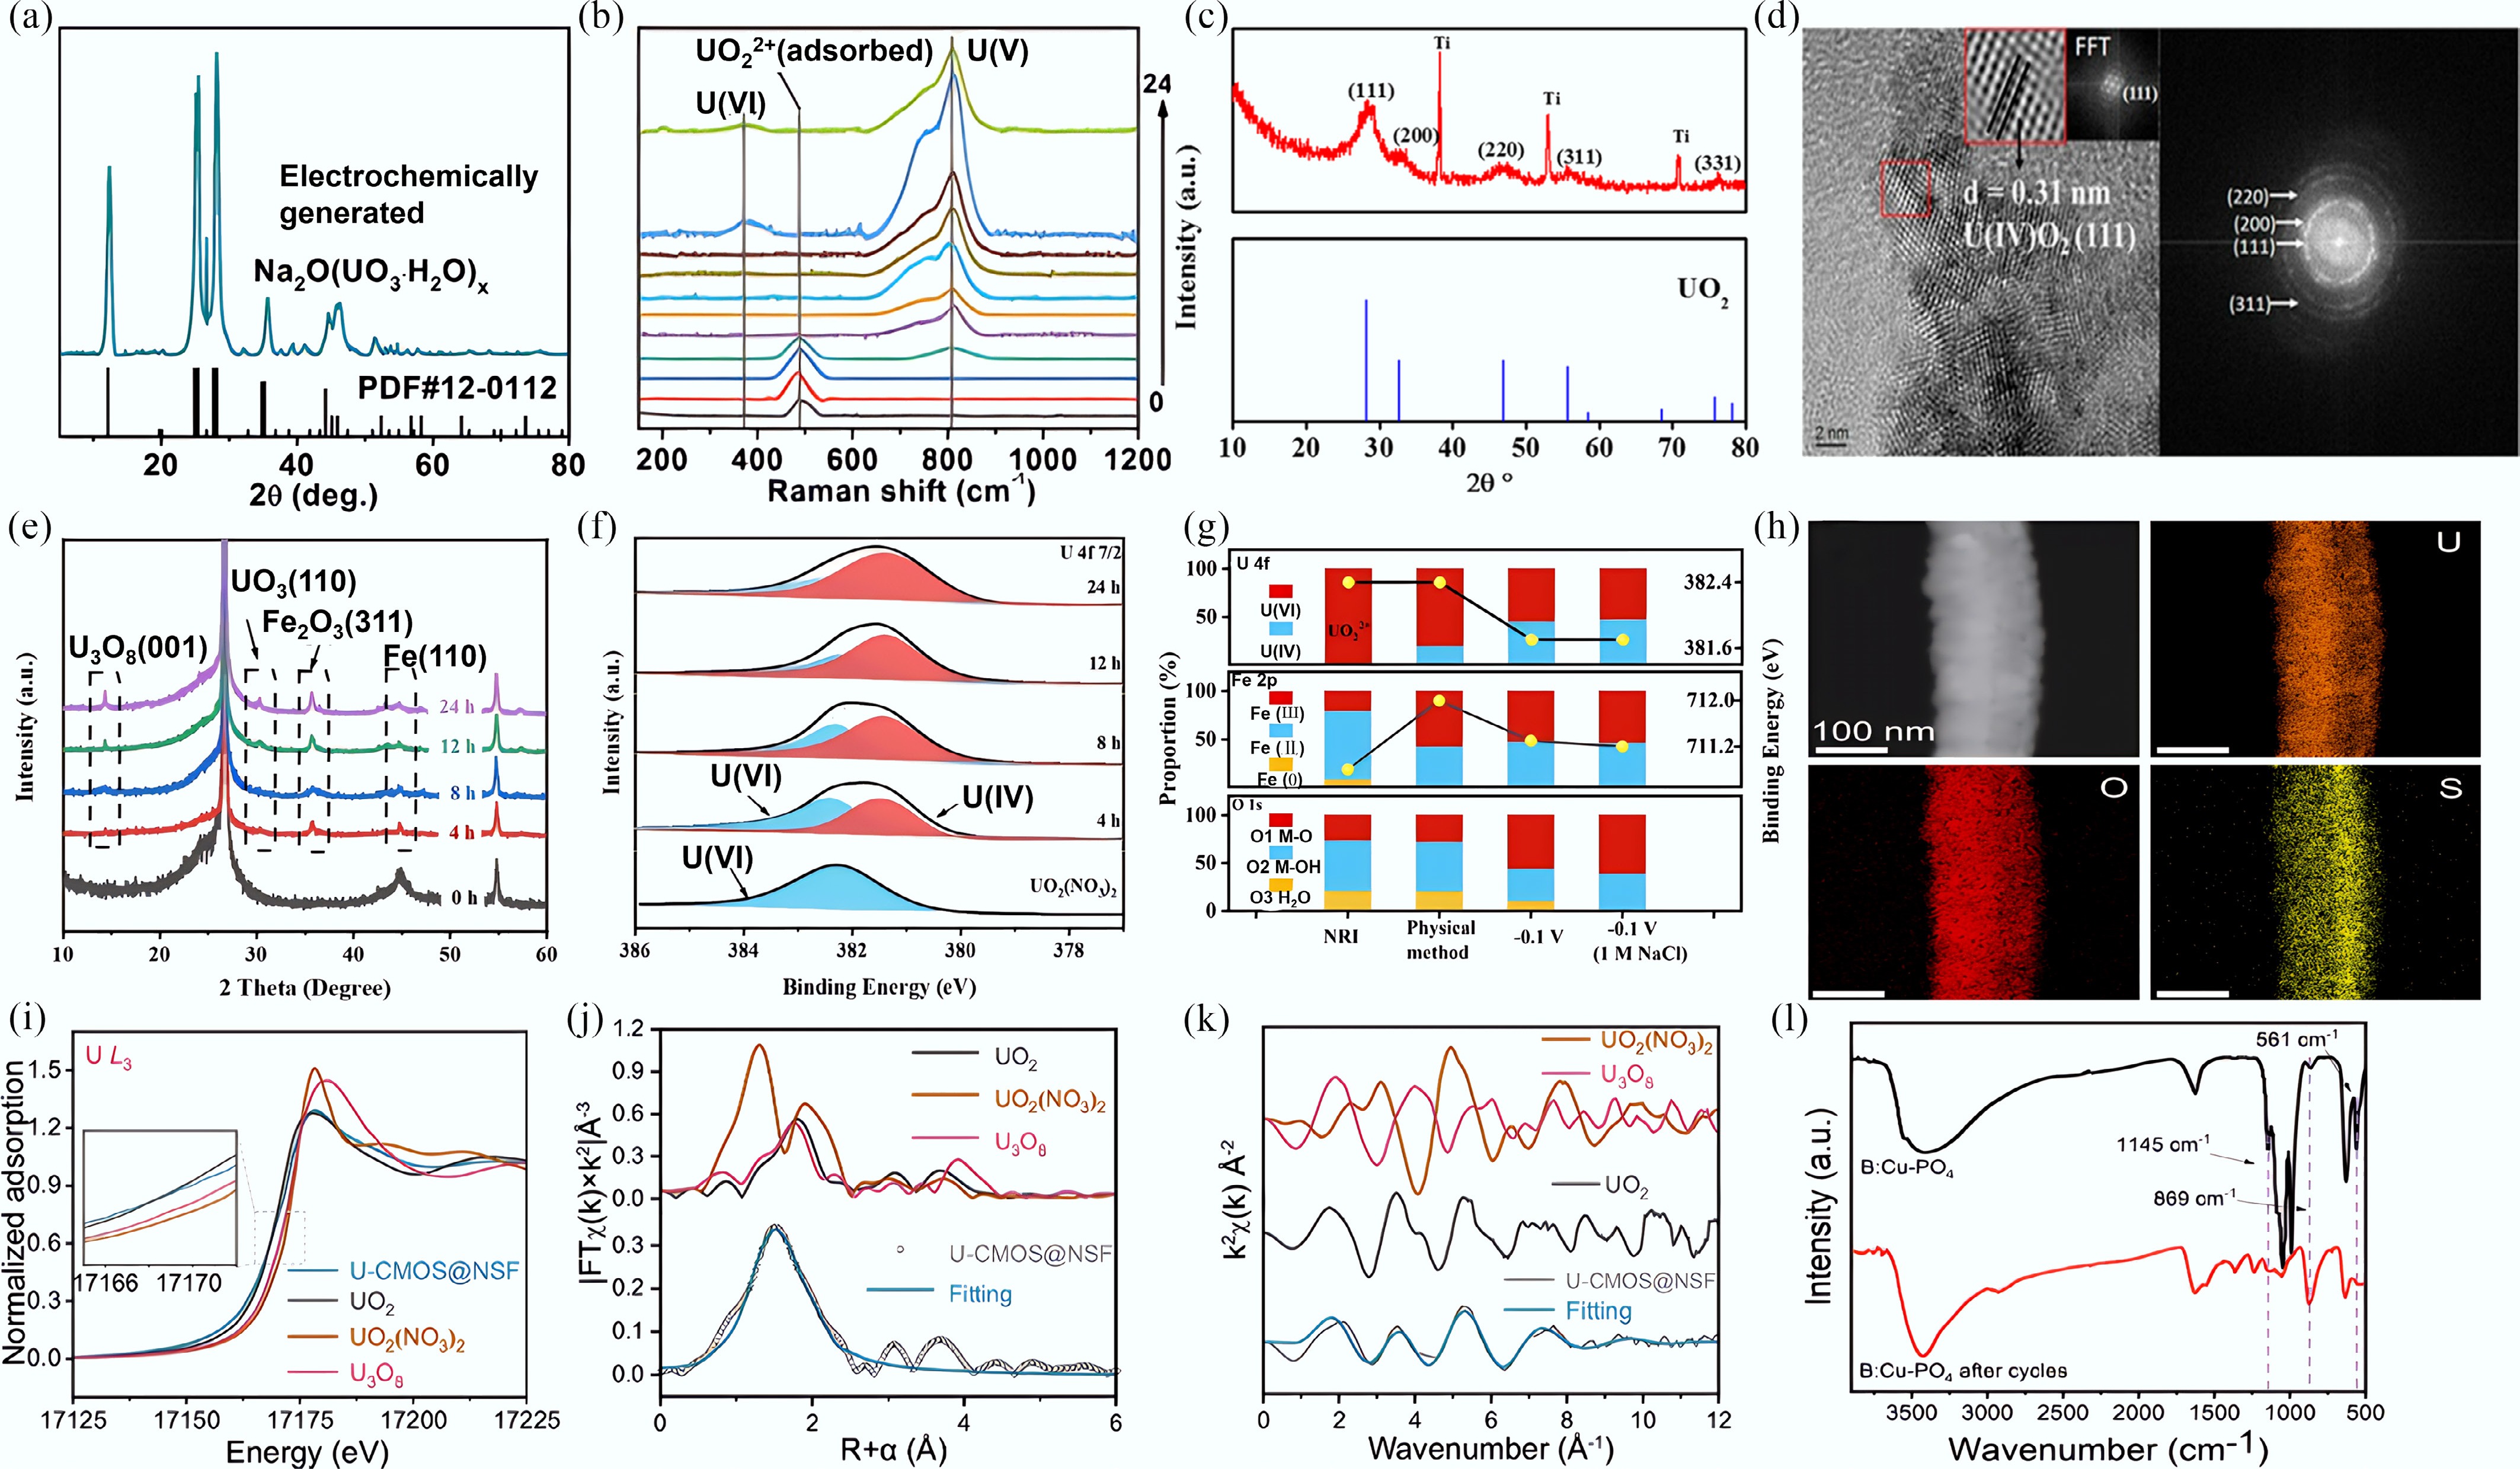
Figure 9.
(a) XRD patterns of the electrochemical products. (b) Situ Raman spectra of the electrochemical products[72]. (c) XRD patterns of UO2 on the surface of the electrode. (d) HR-TEM image and SAED pattern of UO2[67]. (e) XRD patterns of NRI before and after different uranyl extraction time. (f) Quasi-operando XPS spectra of U 4f7/2 for NRI/CP before and after different uranyl extraction time. (g) Contents of the oxygen species and different valence states of the Fe and U(VI) by both physical method (24 h), and electrochemical method (0.1 V, 24 h) in 20 mg/L UO2(NO3)2 solution[68]. (h) EDS mappings of CMOS@NSF after electrochemical uranyl extraction. (i) The U L3-edge XANES spectra of the black product. Inset: magnified pre-edge XANES region. (j) Comparison of R-space data and best-fit lines for the products. (k) Corresponding K-space fitting curves for the products[107]. (l) FTIR spectra of the electrode before and after uranyl extraction[108].
Figures
(9)
Tables
(0)