-
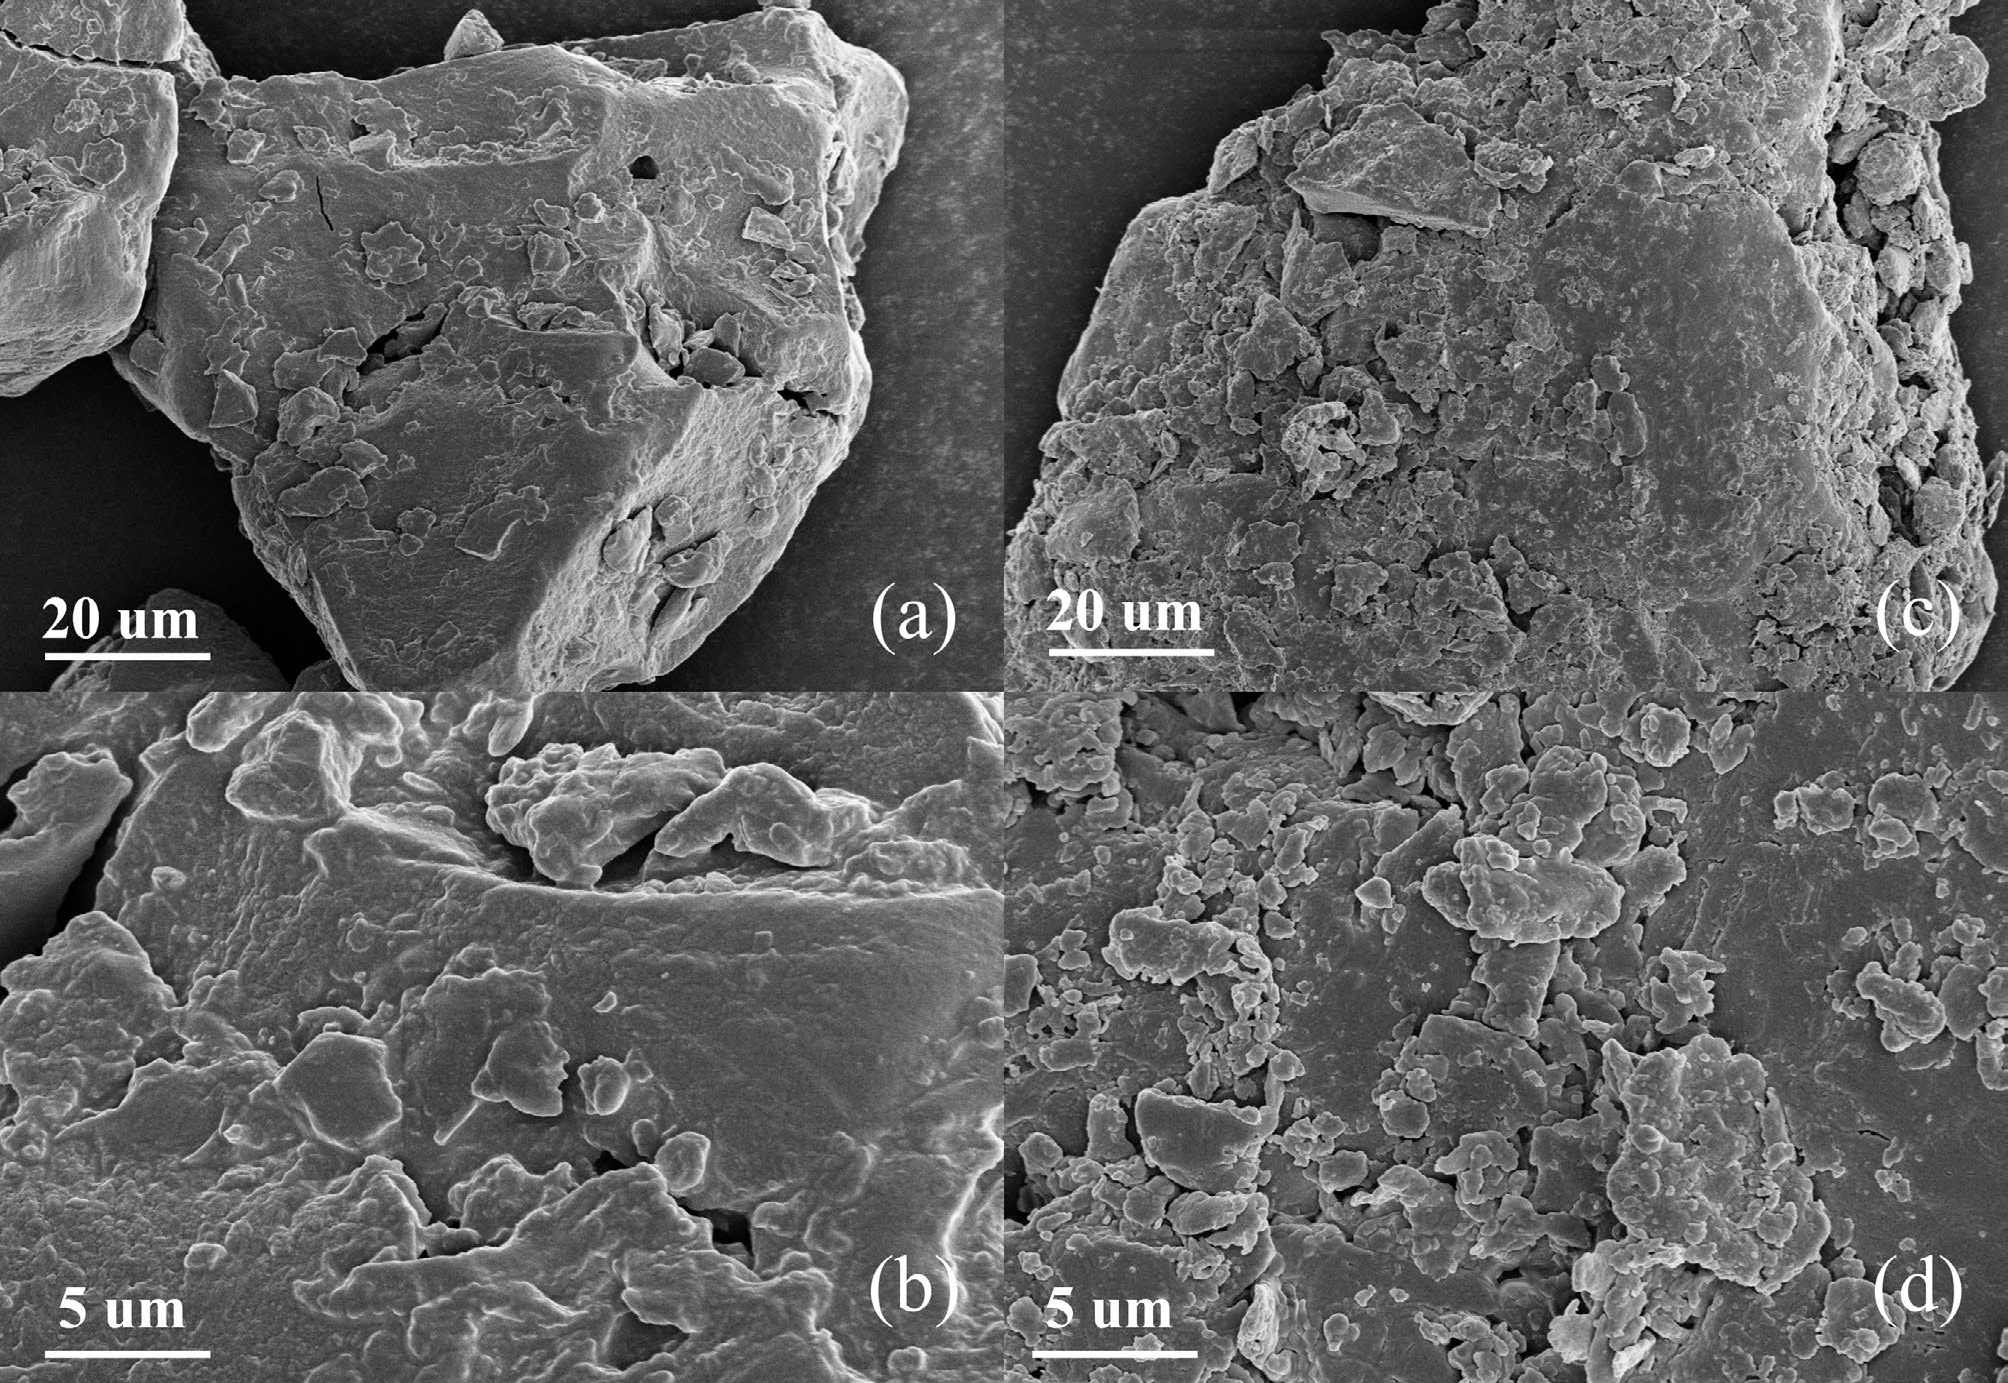
Figure 1.
SEM results of (a), (b) tagua nut and (c), (d) bodhi root.
-
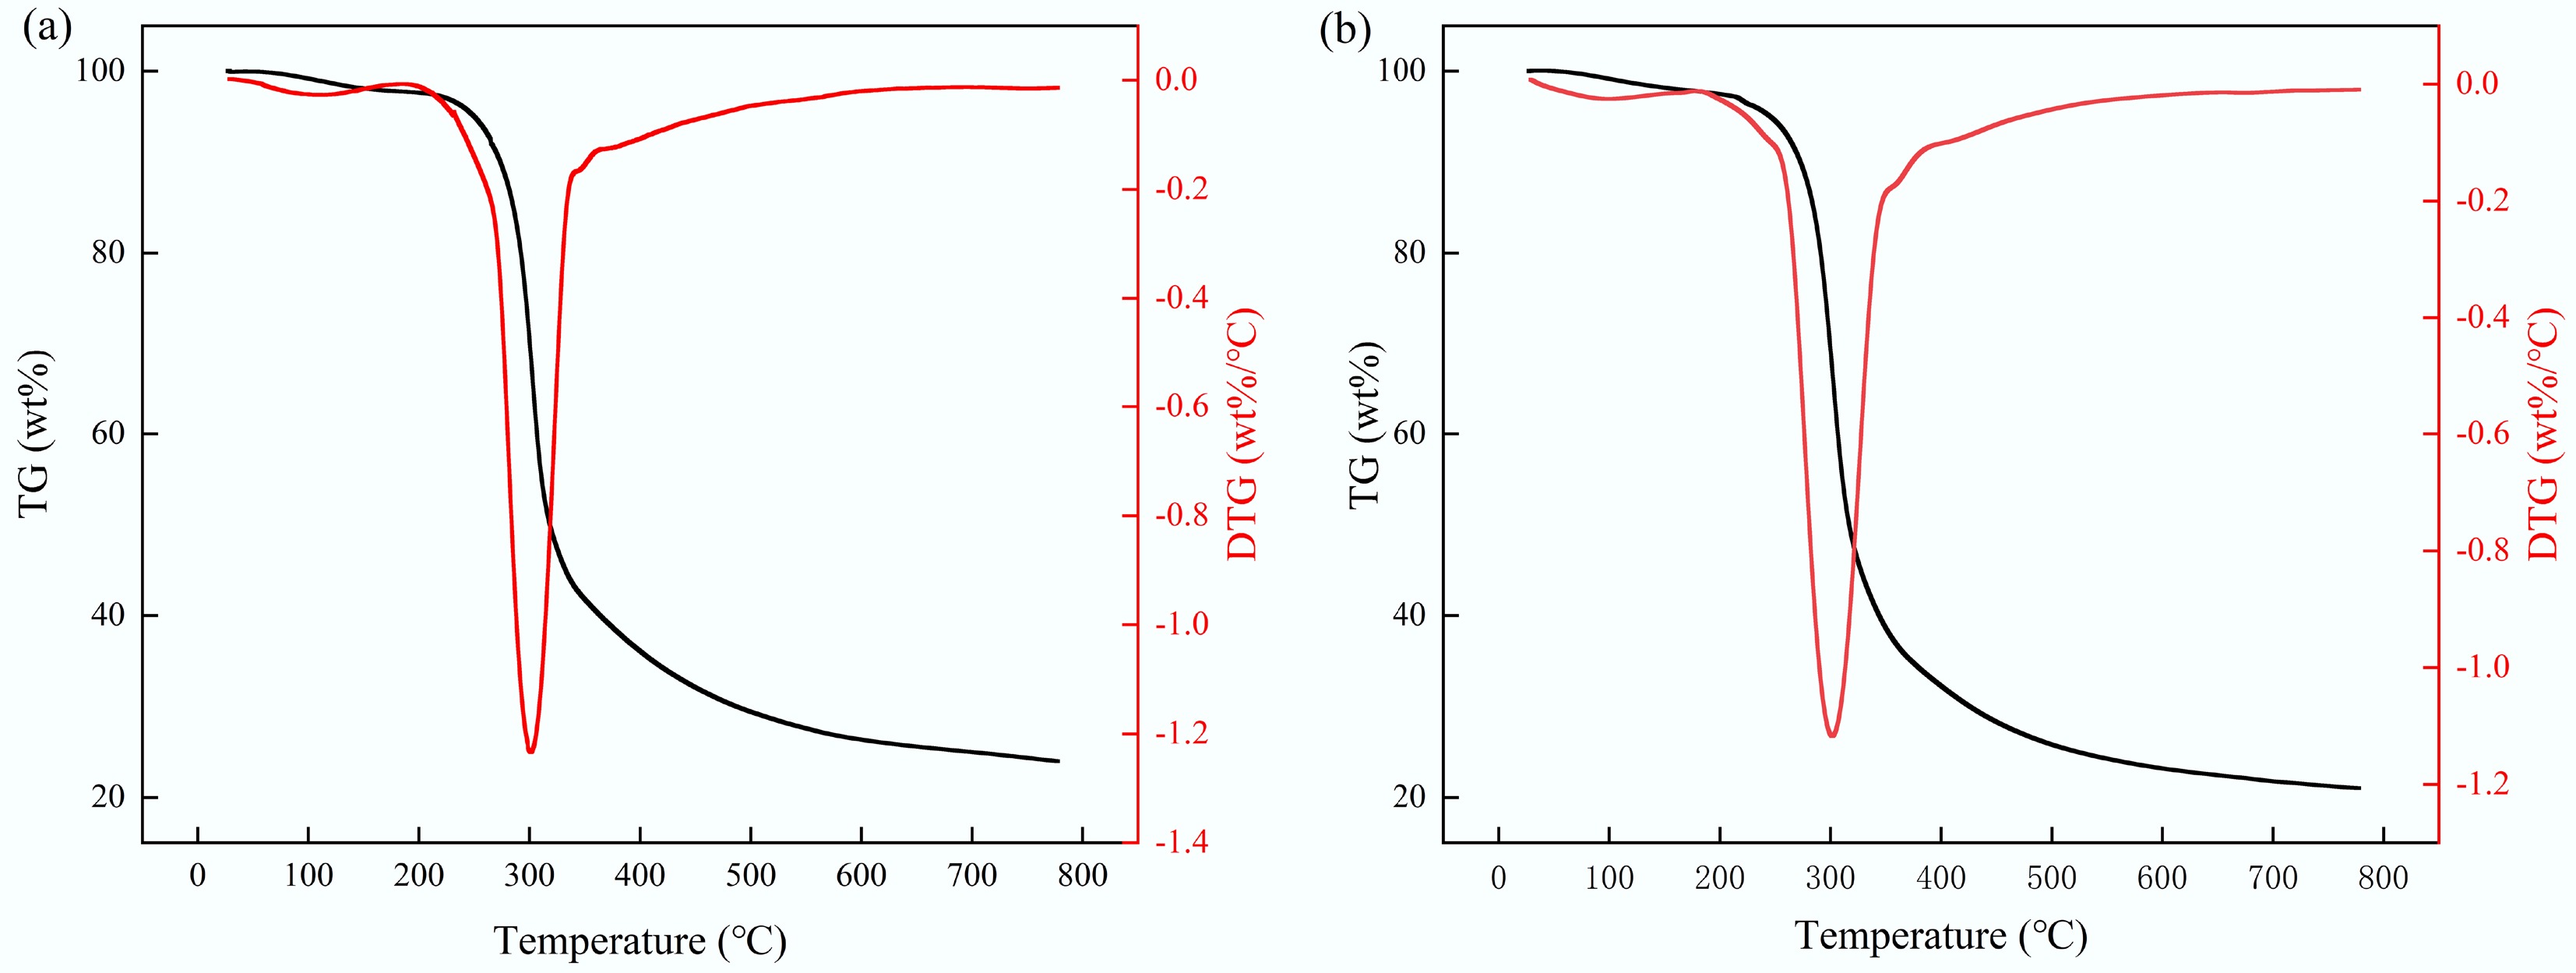
Figure 2.
TG and DTG of (a) tagua nut and (b) bodhi root.
-

Figure 3.
FTIR spectra of volatiles from (a) tagua nut and (b) bodhi root.
-
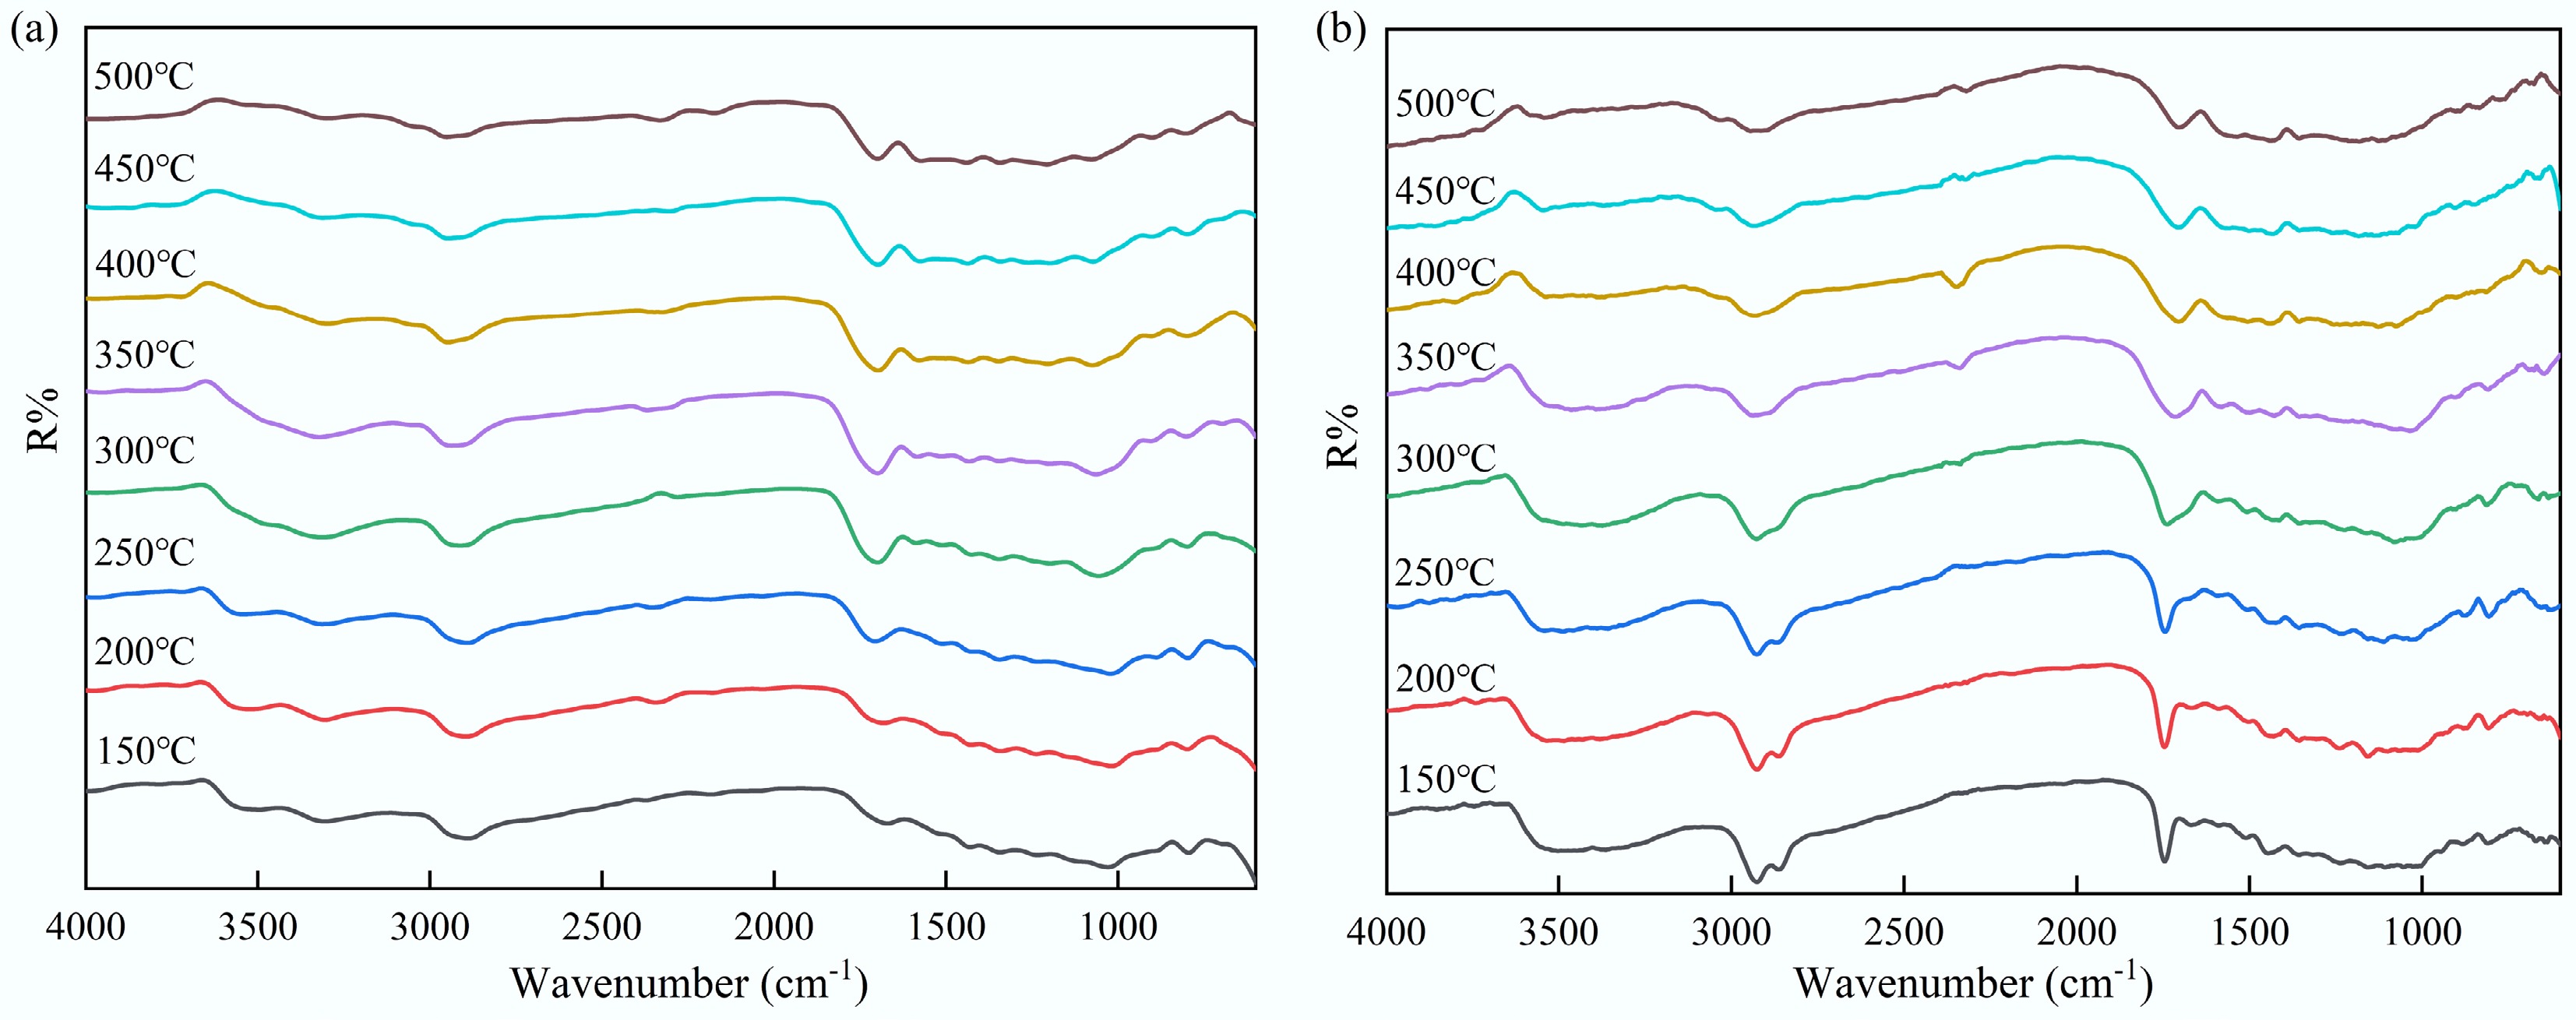
Figure 4.
In-situ DRIFT for the pyrolysis of (a) tagua nut and (b) bodhi root.
-
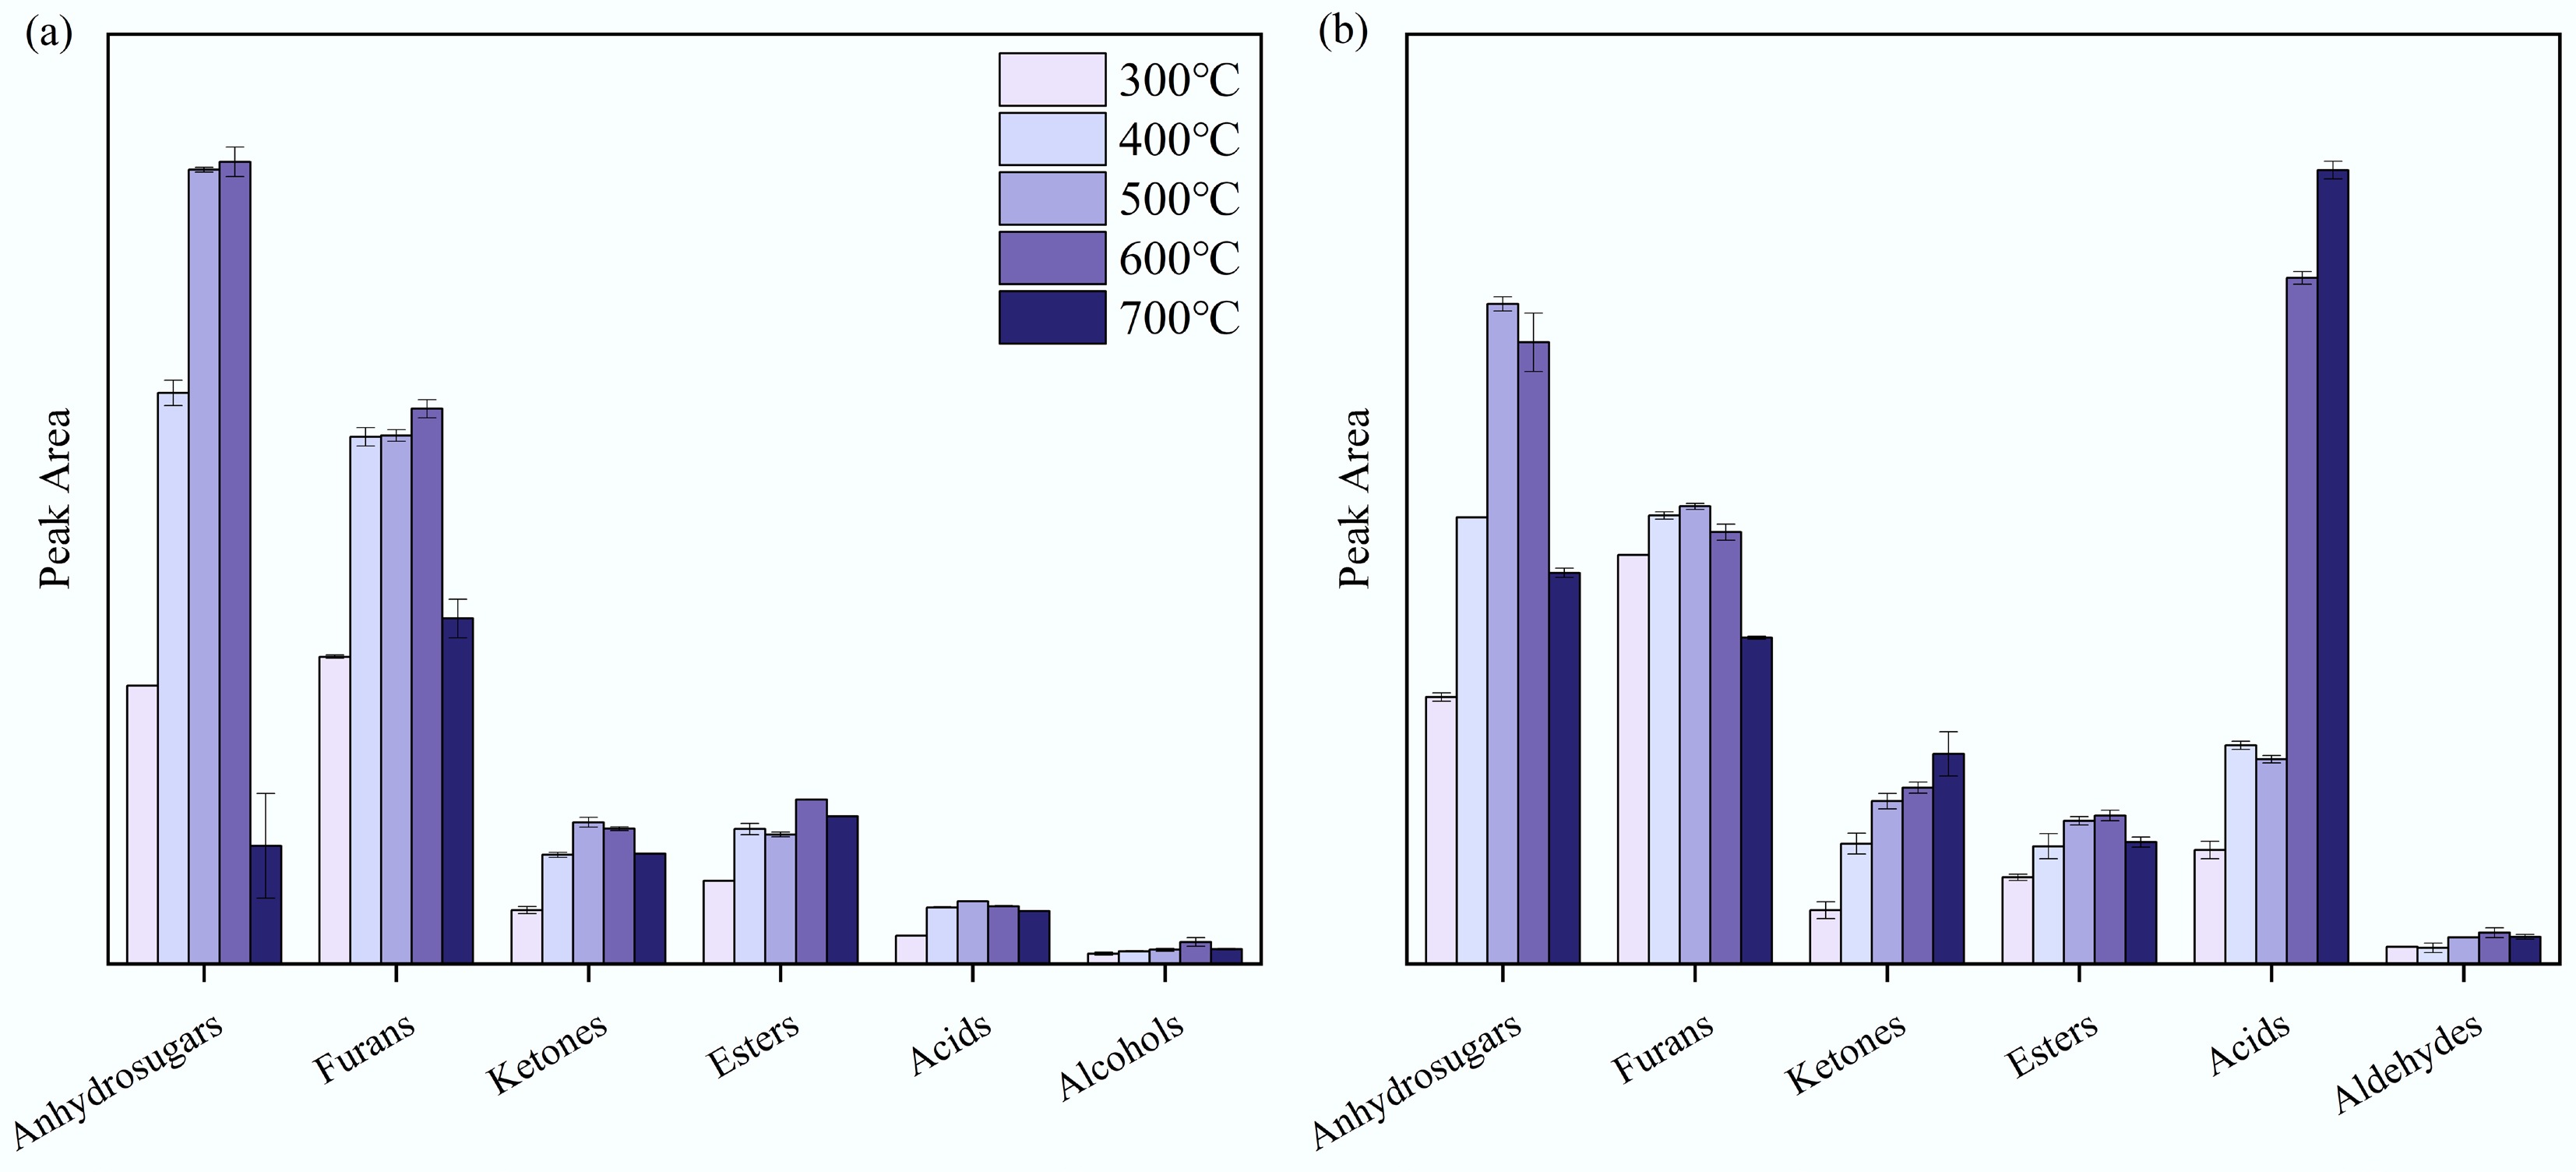
Figure 5.
Main product distribution from the pyrolysis of (a) tagua nut and (b) bodhi root.
-
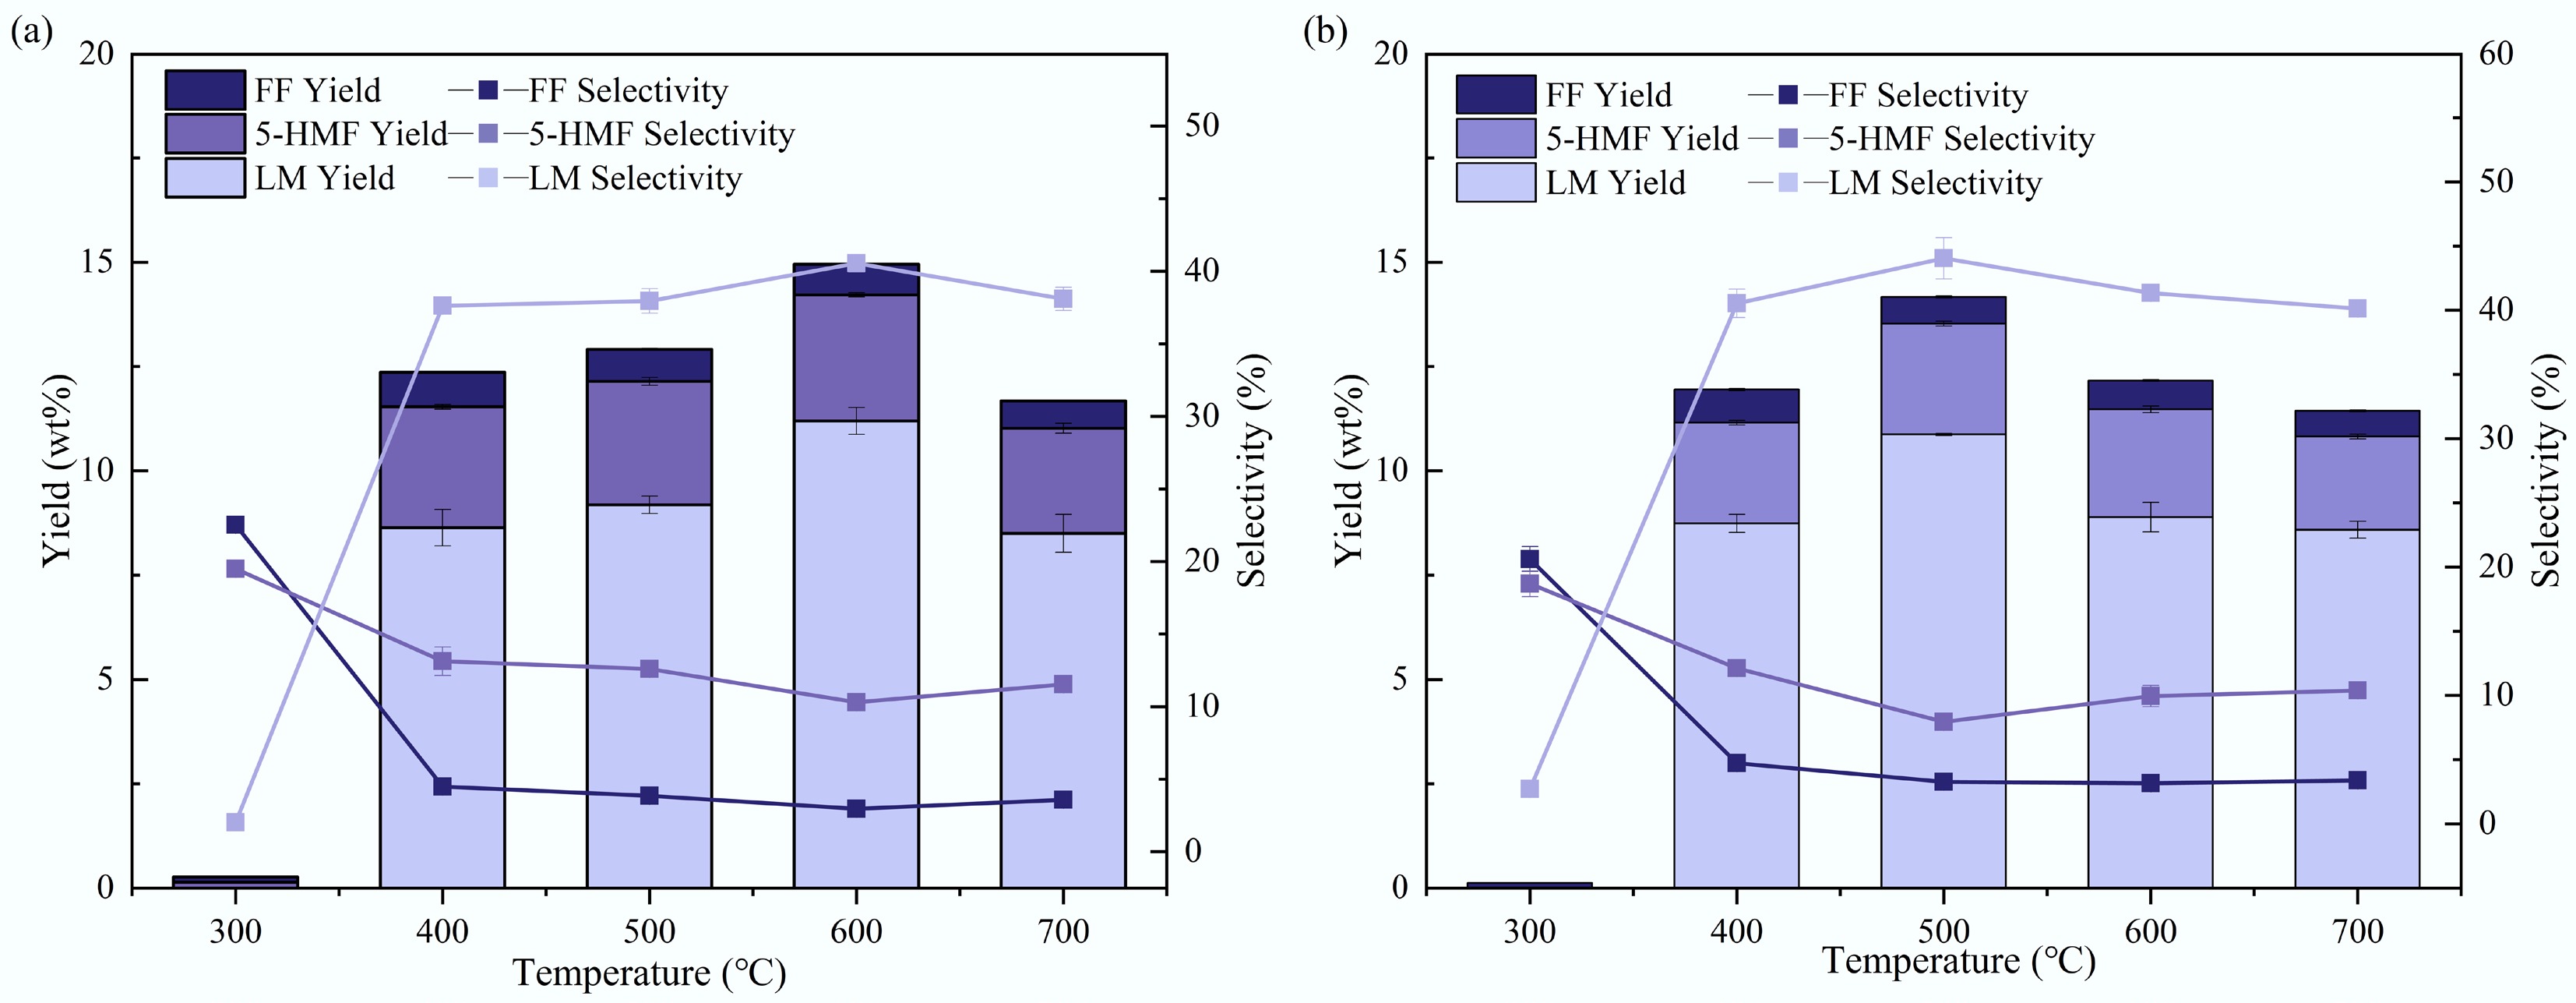
Figure 6.
Yields and selectivities of main pyrolysis products for (a) tagua nut and (b) bodhi roots in Py-GC/MS experiments.
-
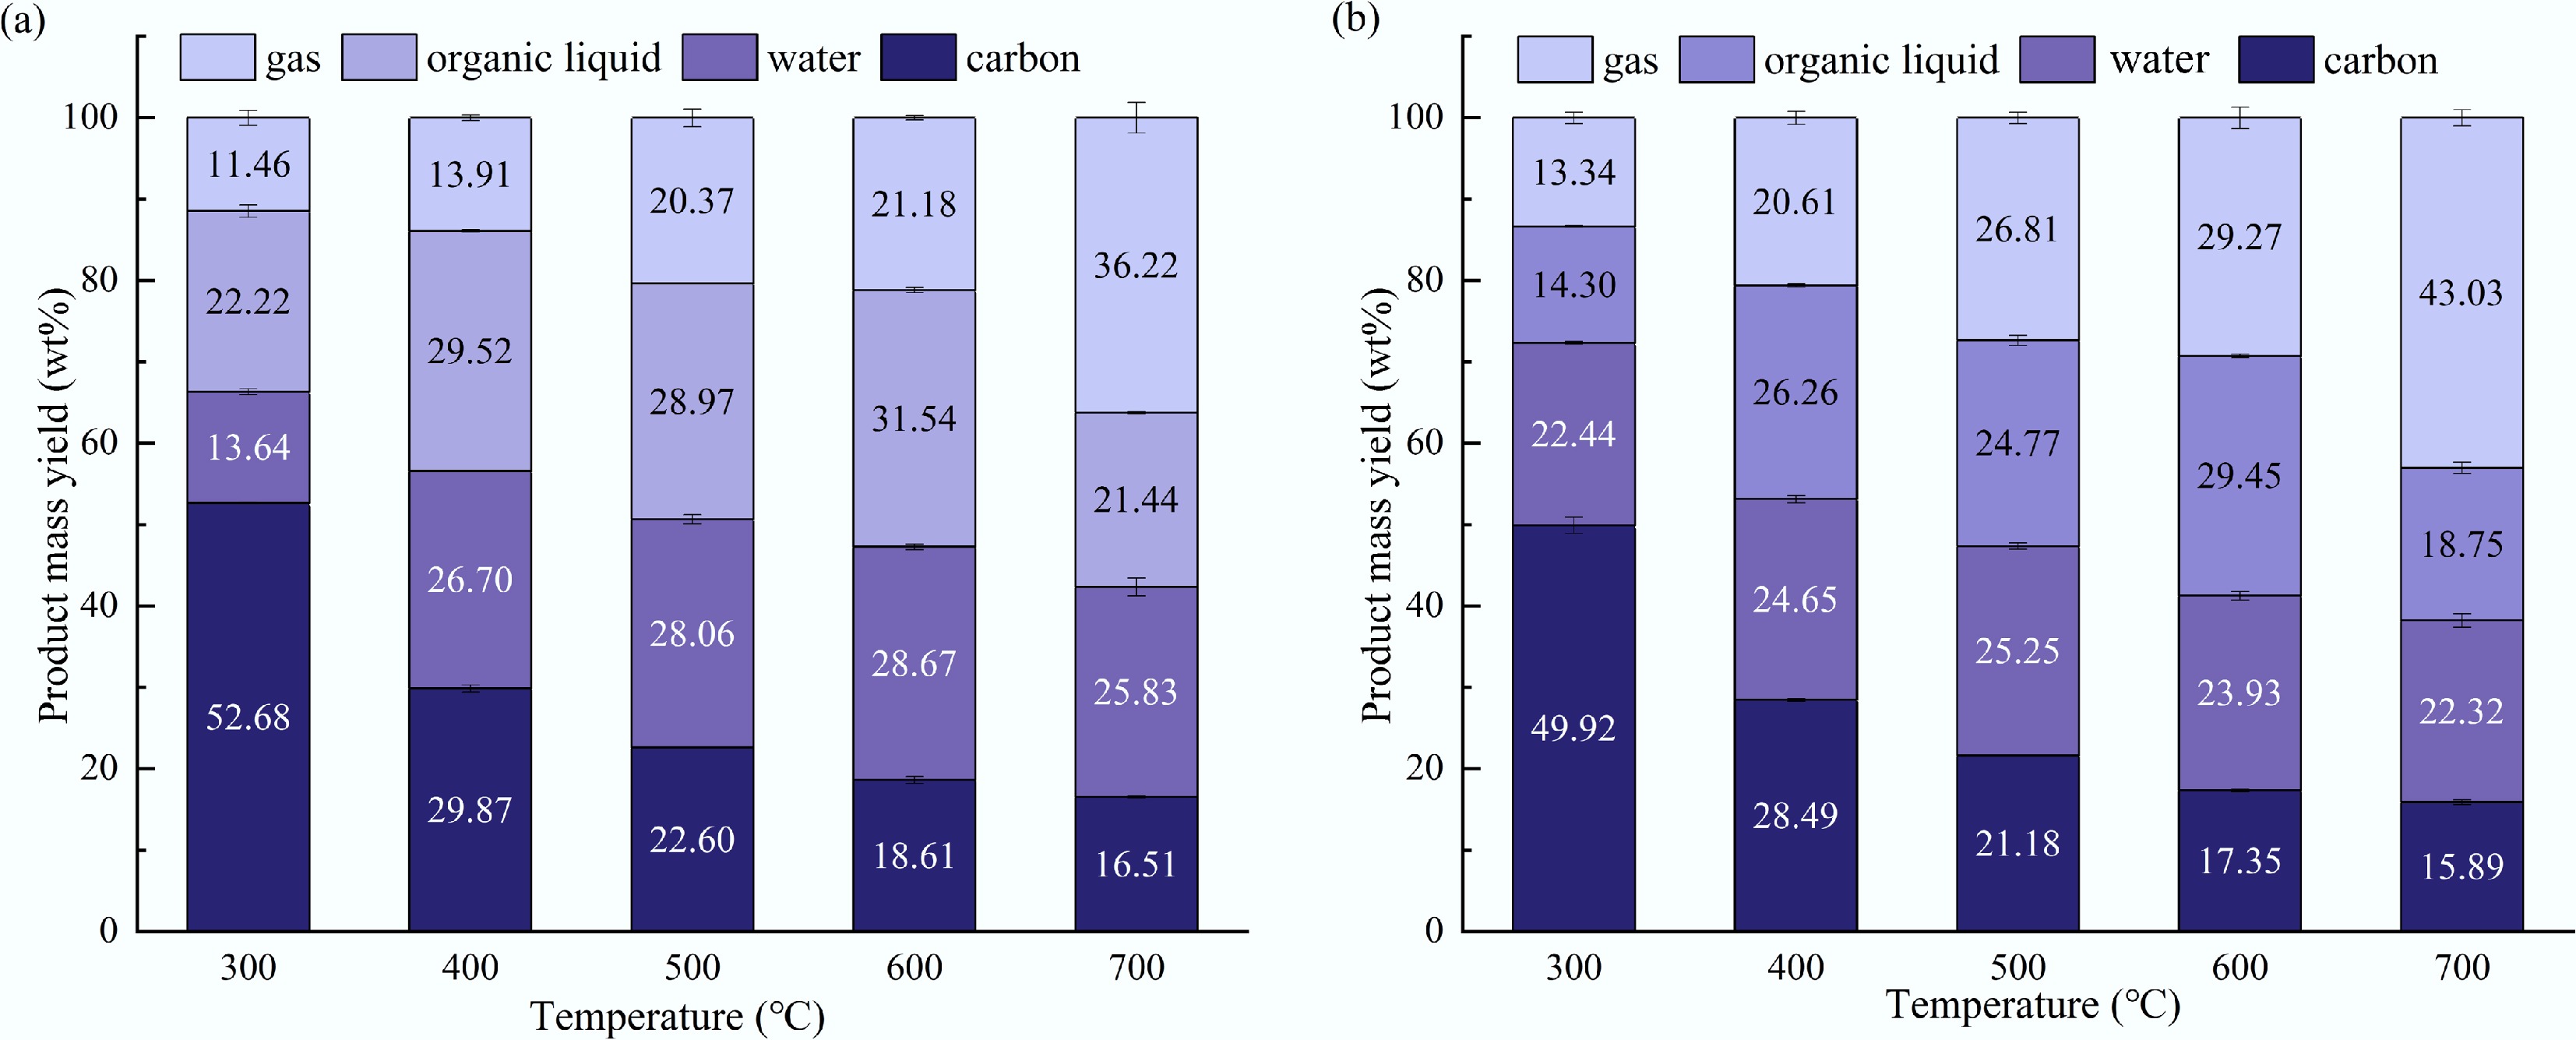
Figure 7.
Yields of the solid, liquid, and gas products from the lab-scale pyrolysis of (a) tagua nut and (b) bodhi root.
-
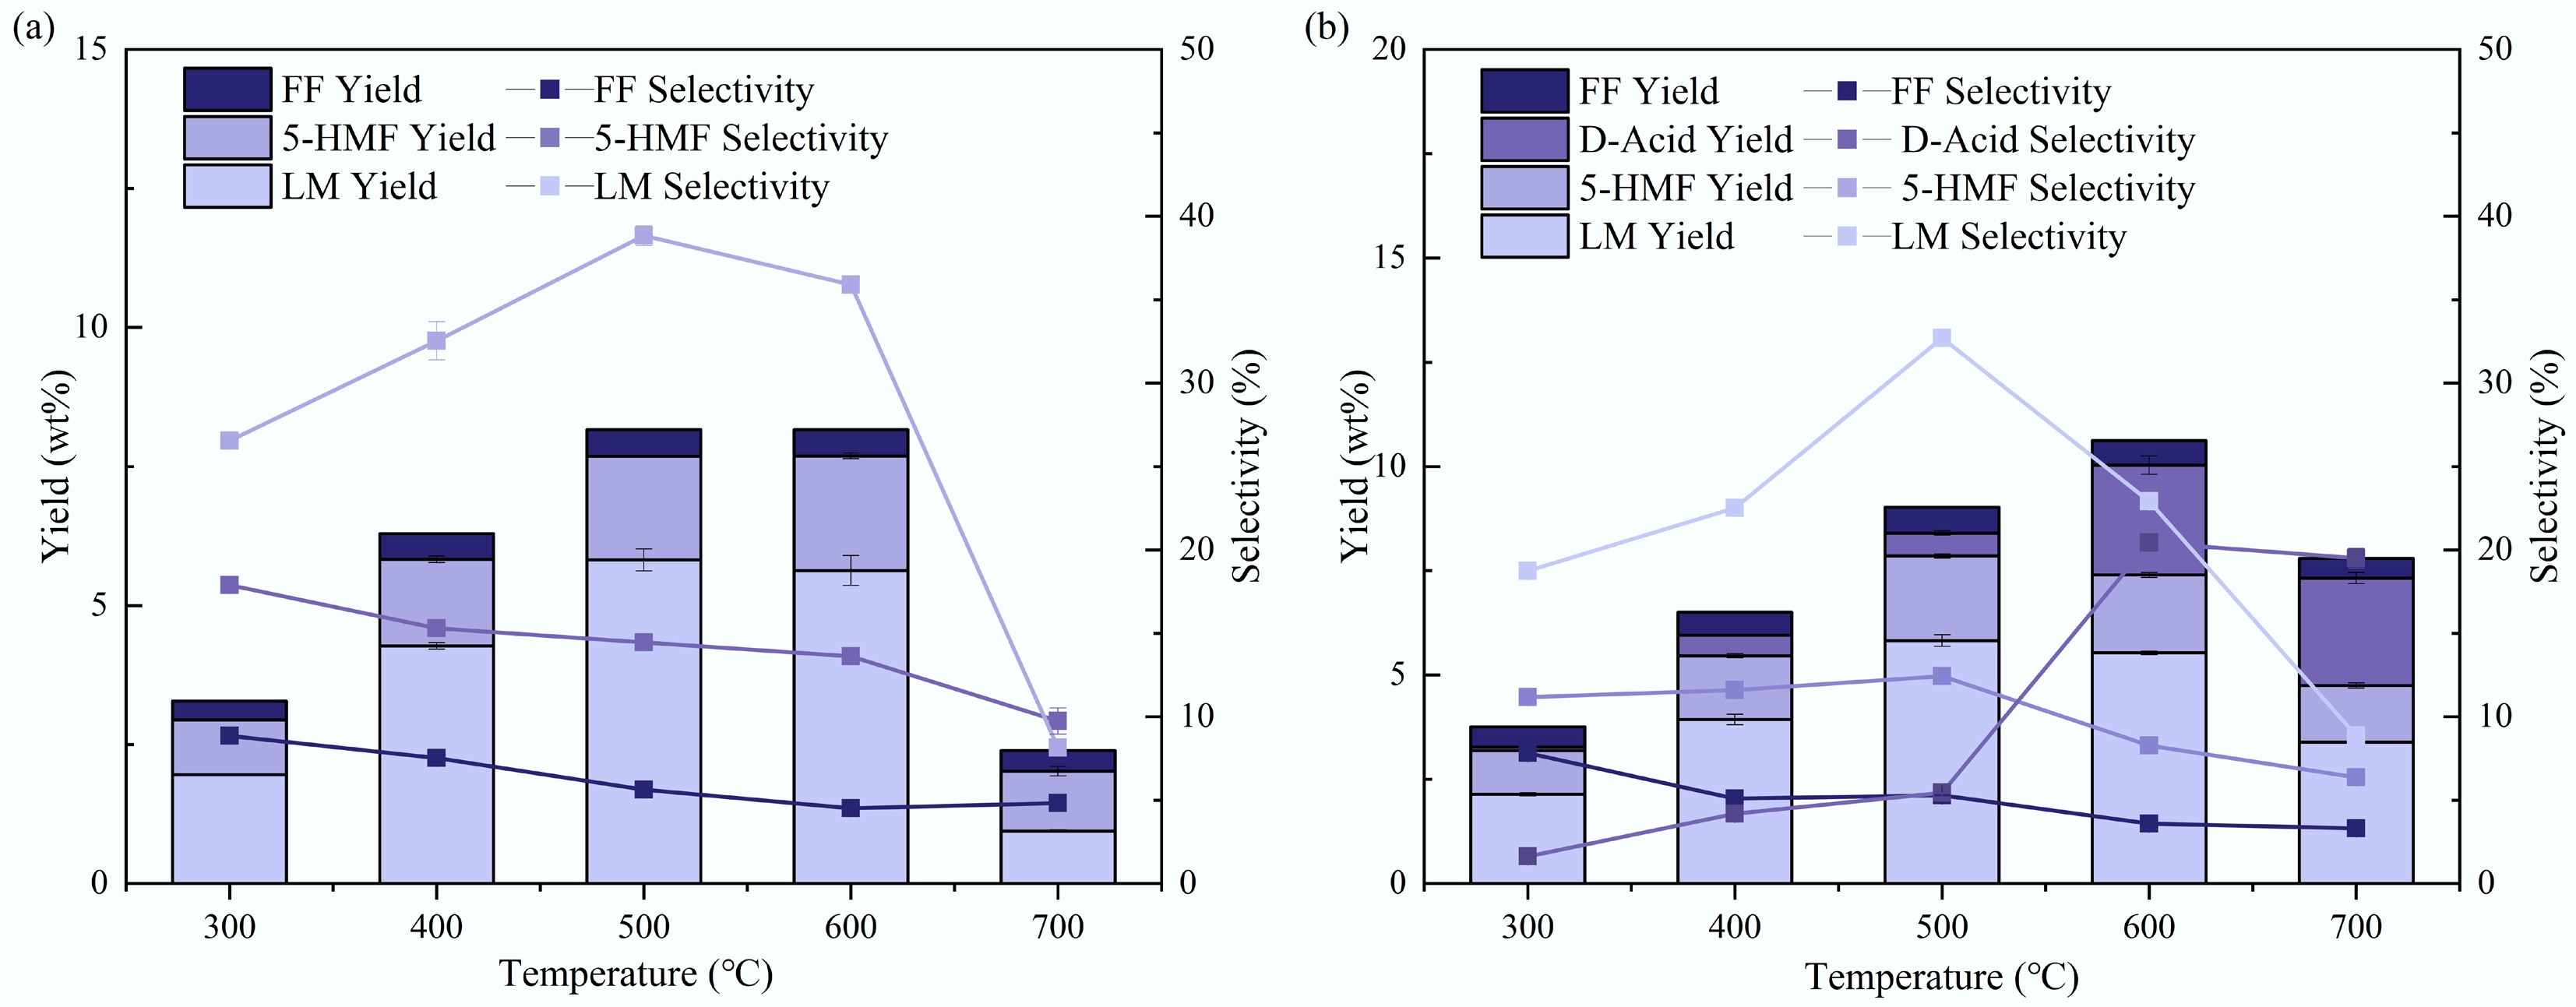
Figure 8.
Yields and selectivities of main pyrolysis products of (a) tagua nut and (b) bodhi roots in the lab-scale pyrolysis.
-
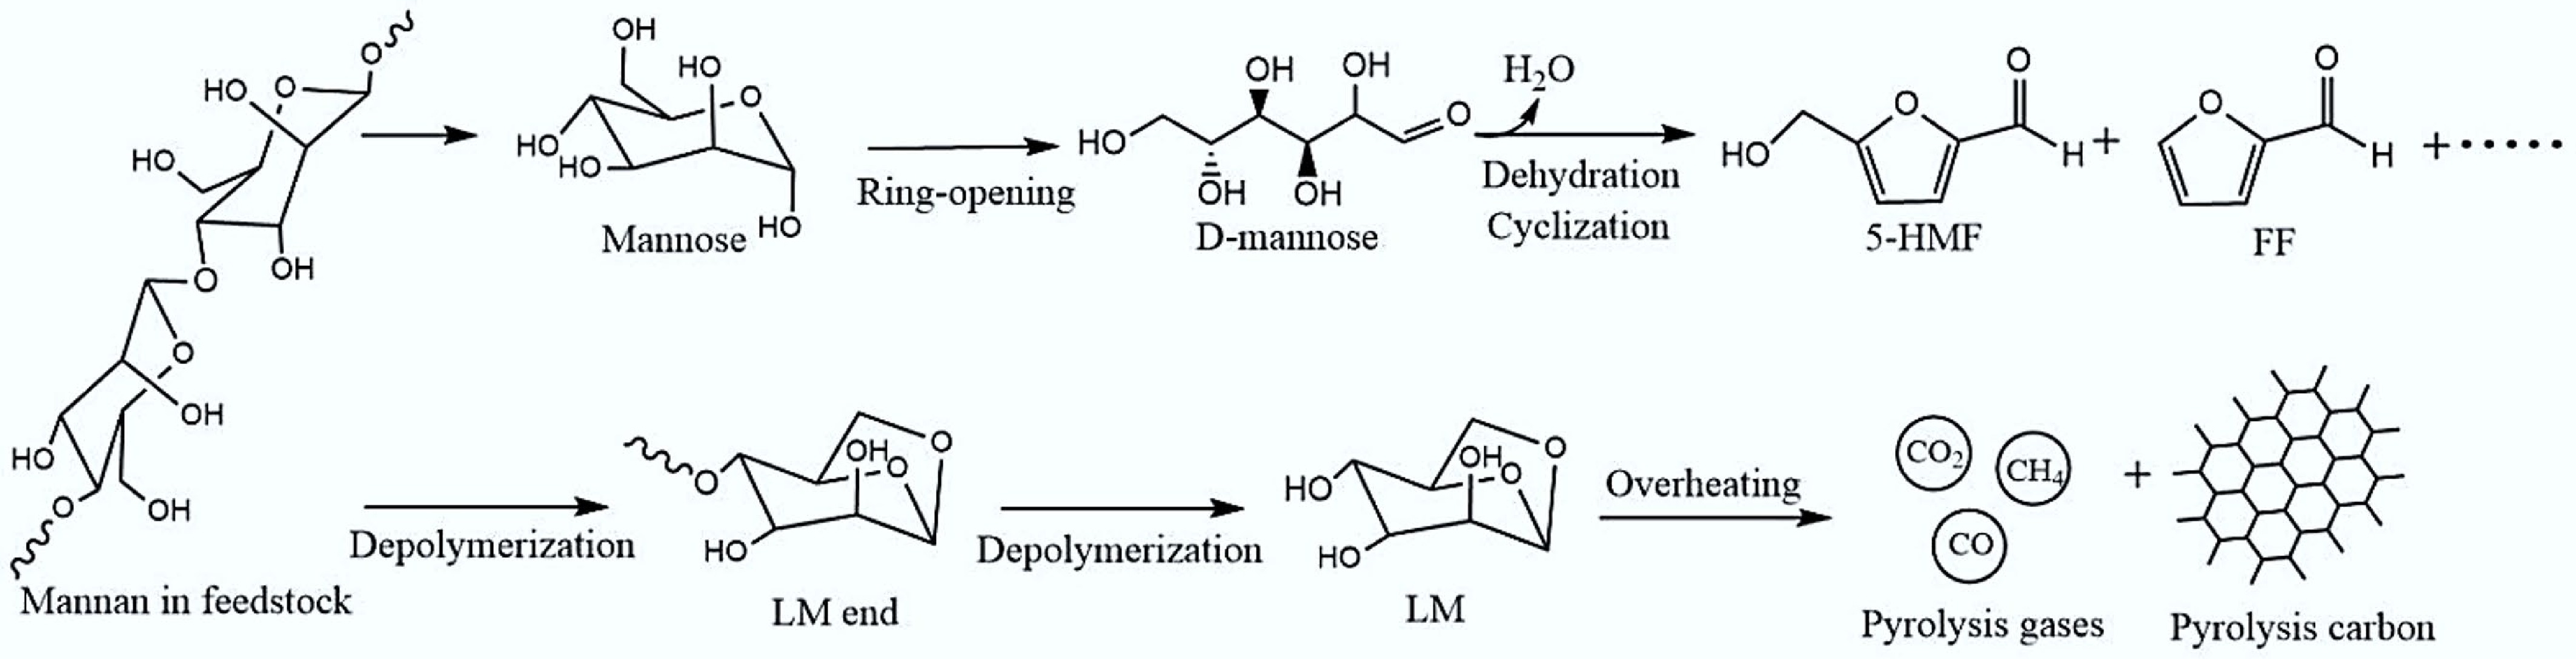
Figure 9.
Possible pyrolysis pathways in pyrolysis of mannan.
-
Sample Tagua Bodhi root Ultimate analysis (wt%) C 41.47 ± 0.08 44.87 ± 0.38 N 1.83 ± 0.00 1.14 ± 0.01 H 6.59 ± 0.02 6.76 ± 0.01 S 0.46 ± 0.06 0.34 ± 0.02 O* 49.65 ± 0.16 46.9 ± 0.40 Proximate analysis (wt%) Moisture 7.44 ± 0.04 3.32 ± 0.28 Ash 1.10 ± 0.01 2.62 ± 0.13 Volatile 76.78 ± 0.50 84.28 ± 0.11 Fix carbon 14.68 ± 0.54 9.79 ± 0.51 * Calculated by the difference. Table 1.
The proximate analysis and ultimate analysis of tagua and bodhi roots
-
Ash Tagua nut (g/kg) Bodhi root (g/kg) Ca 0.0491 0.0653 Fe 0.0025 0.0198 Mg 0.0398 0.1079 Si 0.0068 0.0319 K 0.2929 0.3229 Na 0.0033 0.0122 Table 2.
The ash content of tagua nut and bodhi root
-
Sample Tagua nut (wt%) Bodhi root (wt%) Holocellulose 92.80 86.80 Lignin 2.50 4.00 Protein 3.85 4.64 Fat 4.37 6.34 Pectin 2.90 4.42 Table 3.
Chemical compositions of tagua nut and bodhi root
-
Sample Tagua nut (%) Bodhi root (%) Mannose 87.59 88.01 Ribose 0.40 0.38 Glucuronic acid 2.08 2.34 Galacturonic acid 0.30 0.27 Glucose 3.39 2.39 Galactose 2.73 4.39 Xylose 1.35 0.13 Arabinose 2.14 2.06 Fucose 0.02 0.03 Table 4.
HPLC analysis of the hydrolysate of tagua nut and bodhi root
Figures
(9)
Tables
(4)