-

Figure 1.
(a) The gross mineralization rates, (b) nitrification rates, and (c) immobilization rates in the acid and calcareous soil-wheat systems. Differences between the soil-wheat systems are indicated by *, * p < 0.05, ** p < 0.01, and *** p < 0.001.
-
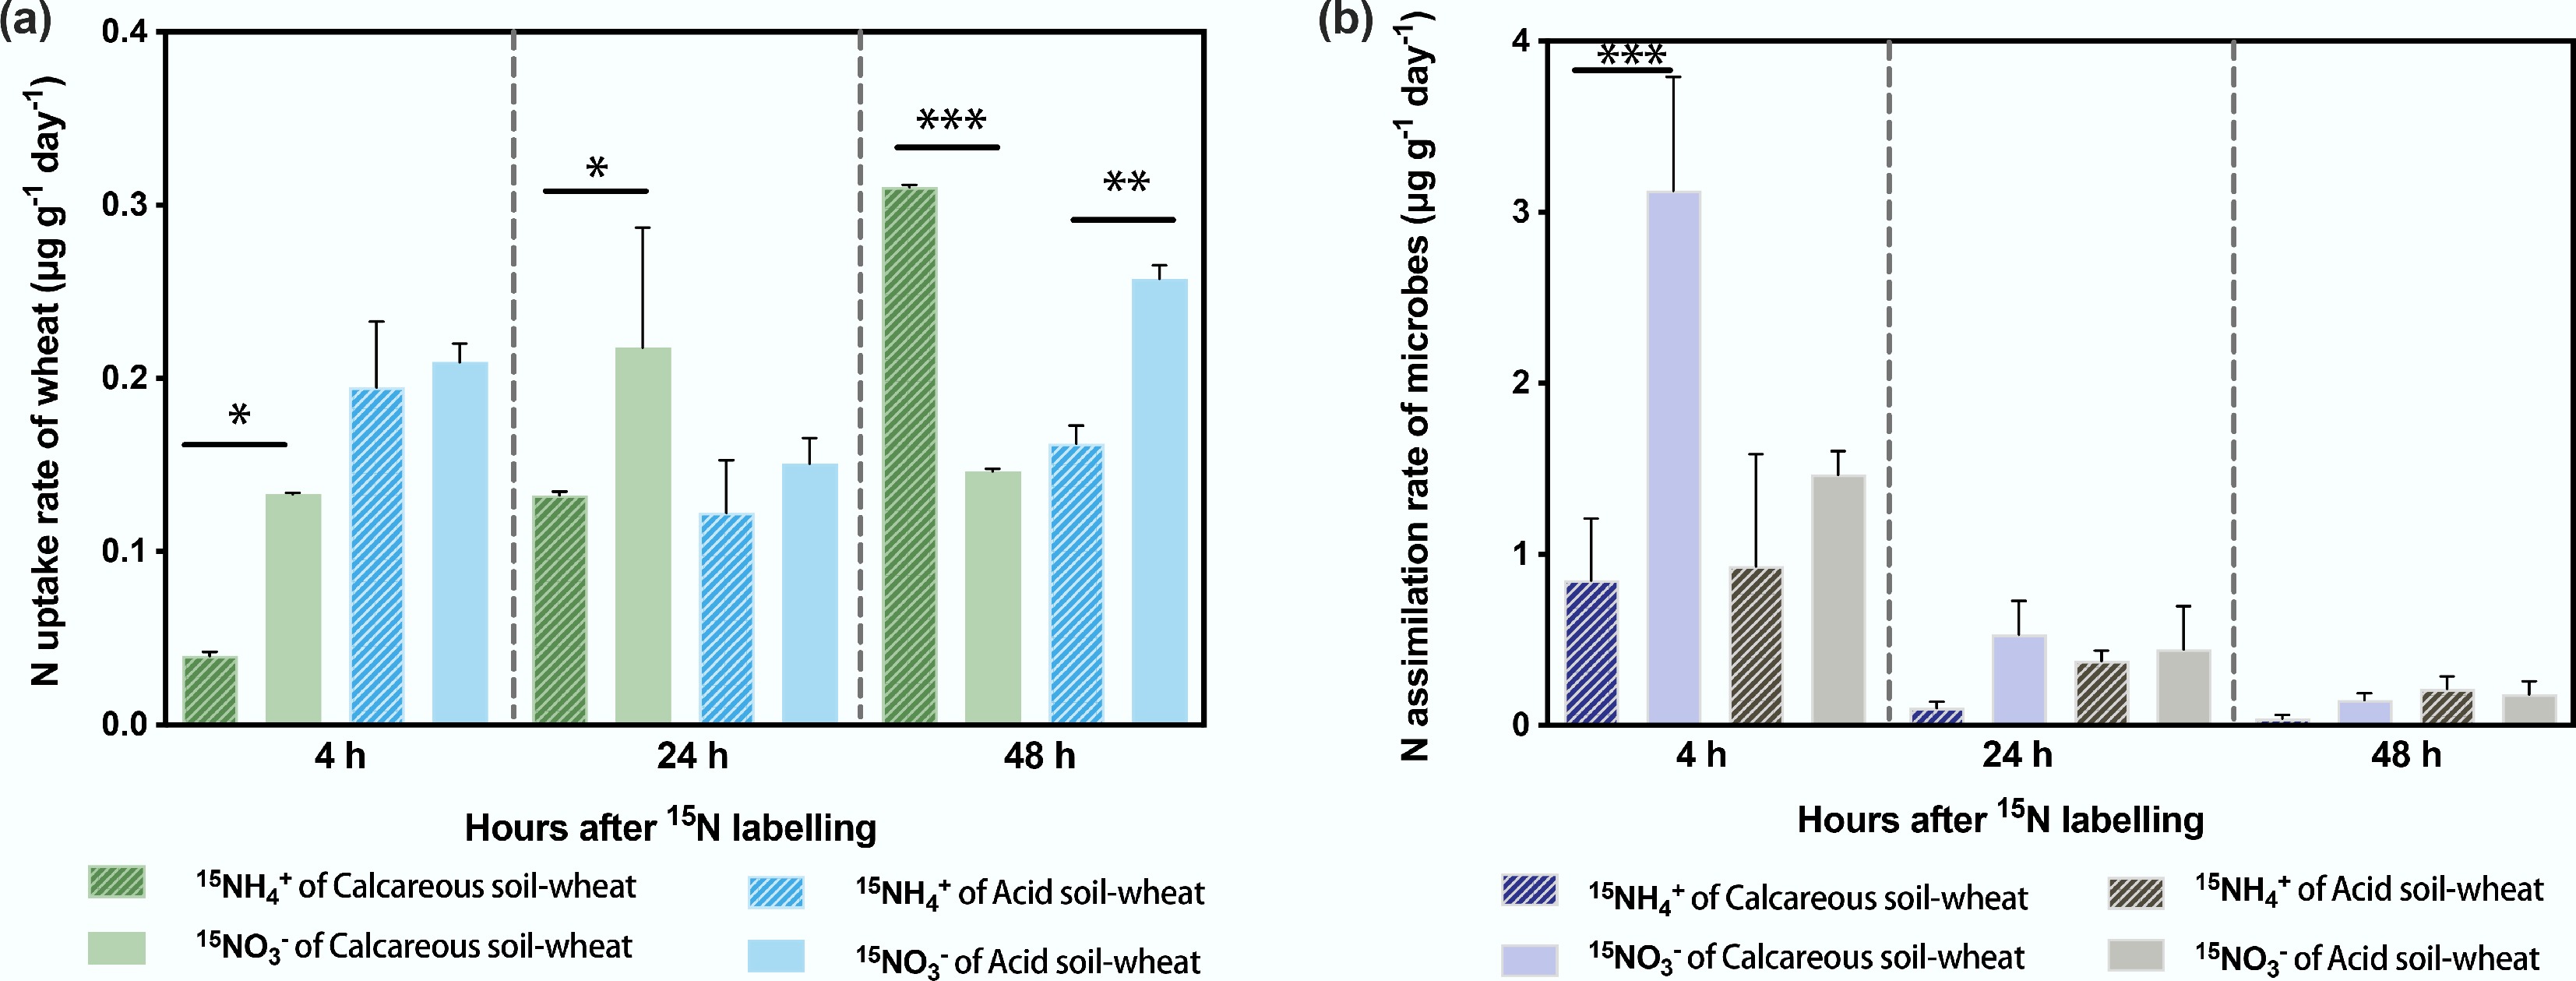
Figure 2.
The 15NH4+ and 15NO3− uptake rates of (a) wheat and (b) soil microorganisms with time-varying conditions in calcareous and acid soil-wheat systems. Differences between 15NH4+ and 15NO3− uptake/assimilation rates are indicated by *, * p < 0.05, ** p < 0.01, and *** p < 0.001.
-
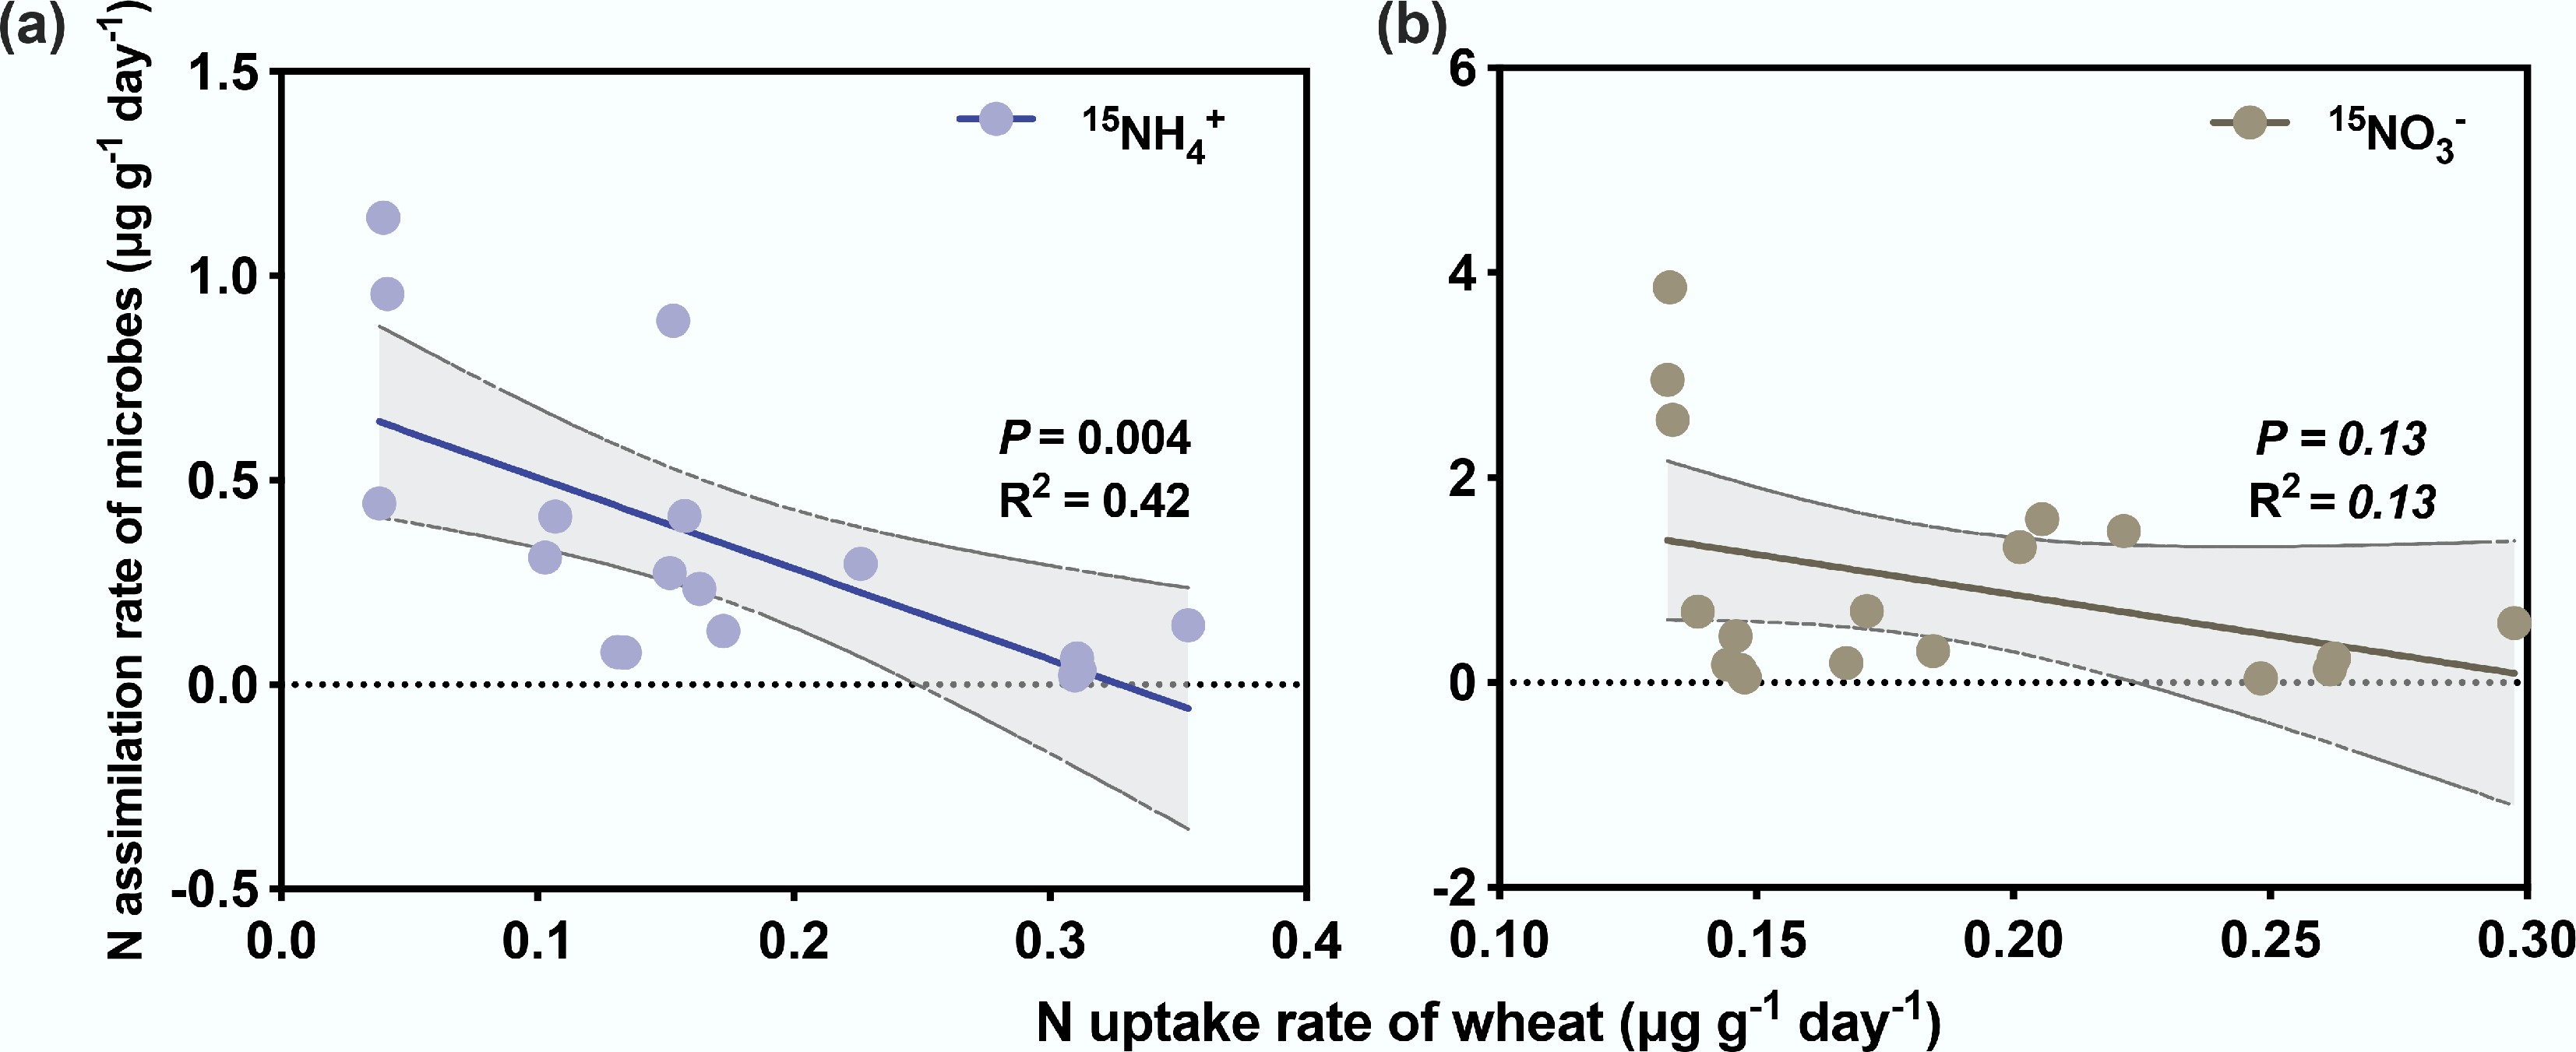
Figure 3.
The % 15N recovery of (a) wheat and (b) soil microorganisms of calcareous and acid soil-wheat systems. The values at the top represent the ratios of total 15N recovery (15NH4+ + 15NO3−) in calcareous soil and that of acid soil at each time point.
-
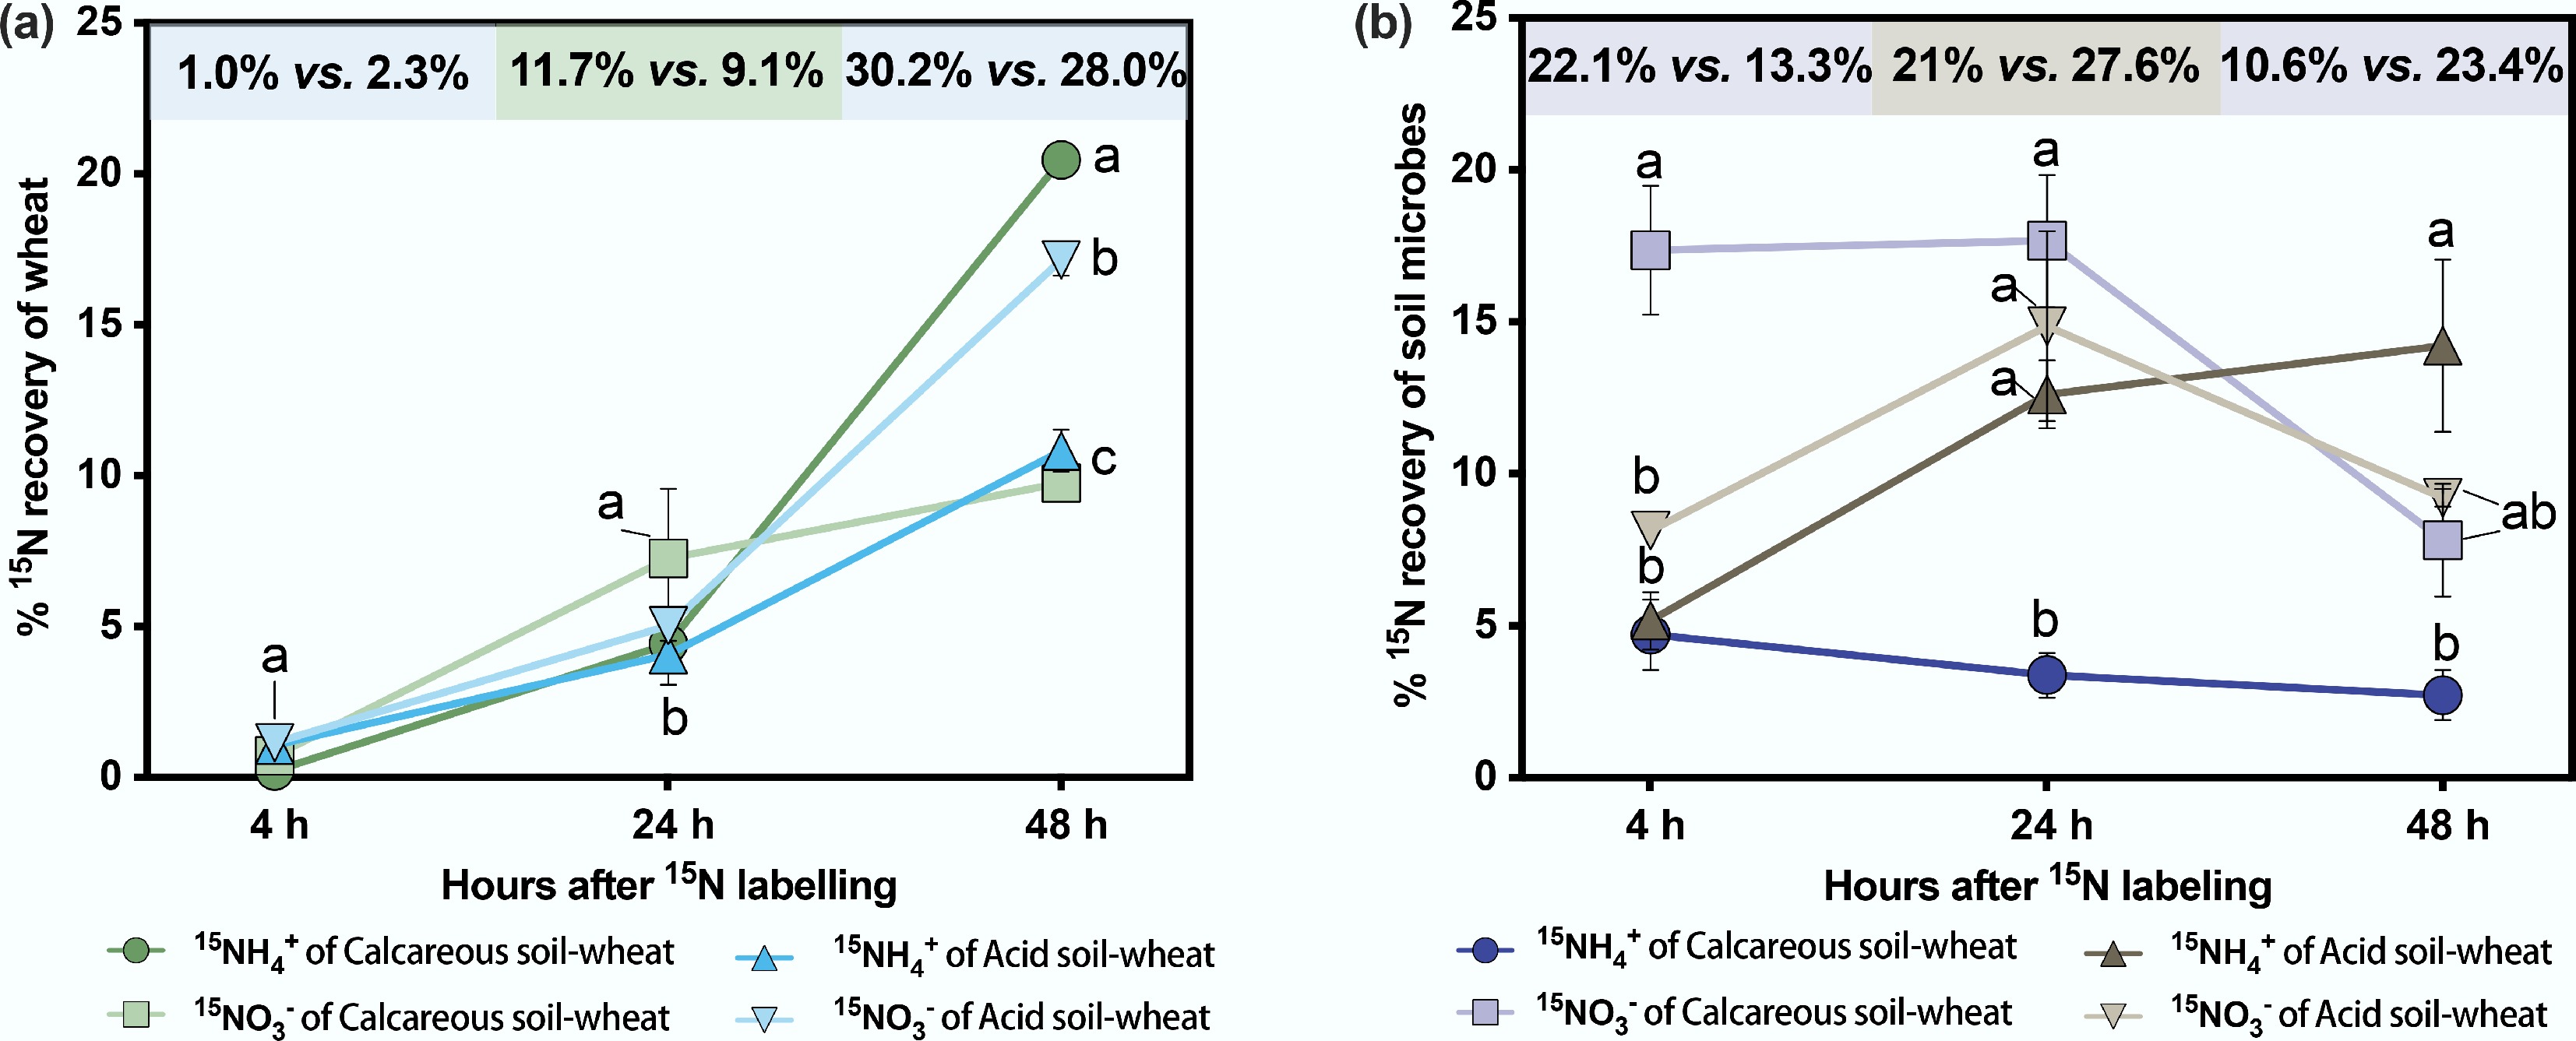
Figure 4.
The regression analyses of N assimilation rates of wheat and soil microorganisms of calcareous and acid soil-wheat systems under (a) 15NH4+ and (b) 15NO3− labelling.
-
Properties Soil types Calcareous soil Acid soil pH 8.17 4.83 SOC (g kg−1) 10.72 15.82 TN (g kg−1) 0.89 1.14 C/N 12.04 13.87 NH4+-N (mg kg−1) 1.01 4.90 NO3−-N (mg kg−1) 28.55 33.58 < 2 μm clay (%) 20.13 12.03 Table 1.
The soil physicochemical properties of calcareous and acid soils
-
Calcareous soil-wheat system Acid soil-wheat system 0 h 4 h 24 h 48 h 0 h 4 h 24 h 48 h NH4+-N 30.93 22.34 ± 1.00a 14.00 ± 0.66b 5.92 ± 0.73c 31.02 33.62 ± 1.32a 32.53 ± 1.04a 19.94 ± 0.58b NO3−-N 61.40 60.06 ± 3.64a 67.72 ± 2.22a 70.15 ± 3.99a 66.50 65.87 ± 0.65a 74.17 ± 0.92a 71.50 ± 2.81a 15NH4+ 9.71 8.42 ± 0.24a 7.88 ± 0.10a 4.21 ± 0.25b 9.68 8.28 ± 0.21a 8.24 ± 0.08a 8.25 ± 0.06a 15NO3− 5.12 4.62 ± 0.14a 4.10 ± 0.08a 3.64 ± 0.13a 4.15 3.83 ± 0.15a 3.58 ± 0.15a 3.48 ± 0.06a Lowercase letters represent differences between the calcareous and acid soil-wheat systems at different labeling times. p < 0.05. Table 2.
The concentration and 15N abundance of NH4+/NO3− in the calcareous and acid soil-wheat systems
-
Gross mineralization
rate (µg g−1 d−1)Gross nitrification rate (µg g−1 d−1) 15N uptake
rate of wheat
(µg g−1 d−1)15N assimilation rate of microbes
(µg g−1 d−1)Ratios of microbial 15N uptake to wheat 15N uptake rates (%) 15N recovery
of wheat (%)15N recovery of microbes (%) Calcareous soil-wheat 3.63 ± 0.6a 9.44 ± 1.6a 0.46 ± 0.00a 0.19 ± 0.04b 41.30% 30.23 ± 0.4 10.55 ± 3.5 Acid soil-wheat 0.40 ± 0.1b 4.63 ± 1.2b 0.42 ± 0.01a 0.40 ± 0.12a 95.23% 27.99 ± 0.7 23.42 ± 6.8 Table 3.
The time-weighted average gross mineralization rates, gross nitrification rates, 15N uptake (15NH4+ + 15NO3−) of wheats, 15N assimilation rate of microbes, ratios of microbial 15N uptake to wheat 15N uptake rates, and total 15N recovery (15NH4+ + 15NO3−) at 48 h in the calcareous and acid soil-wheat systems
Figures
(4)
Tables
(3)