


-
Nitrogen (N) is a crucial nutrient that limits ecosystem productivity, and its availability directly influences plant growth[1]. Plants primarily acquire N from soil in the form of inorganic N, specifically ammonium (NH4+) and nitrate (NO3−)[2]. Microorganisms also require the same N sources for maintenance, growth, and reproduction[3]. Therefore, competition occurs between plant N uptake and microbial N immobilization, both of which are essential pathways of N retention in soil[3−6]. However, these two processes have often been studied independently in the past, despite their essential interactions in influencing N cycling in terrestrial ecosystems[7].
Studies have shown that microbial competitiveness is a crucial factor affecting plant N uptake efficiency, regardless of N form[6]. Microorganisms often possess a competitive advantage in rapidly acquiring most of the available N, which may lead to N limitation becoming a major constraint on plant productivity[8]. Previous experiments using 15N labelling have demonstrated that microorganisms can assimilate more than 60% of added N[9,10], and a field study reported that up to 46% of added 15N was immobilized by microorganisms[11]. Competition between plants and microorganisms is particularly intense in the rhizosphere, where high plant N demand reduces soil N concentration, while root exudates stimulate rhizosphere microbial activity, leading to high microbial N immobilization[3,5]. Therefore, a deeper understanding of plant-microbial competition is essential for elucidating the mechanisms controlling plant N acquisition.
Soil pH is a key environmental factor influencing chemical, physical, and biological soil processes, thereby affecting microbial and plant growth, soil structure, and nutrient availability[12,13]. Soil pH not only regulates nutrient availability and N transformation processes but also alters the rhizosphere environment, thereby shaping N competition dynamics between plants and microorganisms[3]. First, soil pH influences inorganic N availability and transformation, thereby modifying plant N uptake strategies[14−16]. Nitrification is inhibited in acid soils, causing NH4+ accumulation, whereas in alkaline soils, which typically exhibit higher nitrification rates, result in greater NO3_ availability[17−19]. Soil pH also profoundly affects the rhizosphere microbial community composition and activity[3], influencing chemical niche partitioning[5]. Specifically, plants can adjust rhizosphere carbon exudation and root exudate composition to shape specific microbial communities, thereby altering the intensity of N competition[20−23]. While many studies have examined N or carbon availability as drivers of plant-microbial N competition[24−26], the regulatory role of soil pH remains underexplored.
More importantly, plant species differ in their preferences for specific N forms, which represents an important strategy for N acquisition[27]. Previous studies have shown that plant N uptake preferences often align with the dominant N forms present in soils[26,28,29]. For example, some crop plants, such as rice, preferentially absorb NH4+ rather than NO3−; whereas most dryland crops, including wheat, maize, and various vegetables, prefer NO3−[29,30]. Because soil pH affects the prevailing NO3− to NH4+ ratio by regulating nitrification, plant species with specific N preferences may exhibit different N competition dynamics with microorganisms under varying soil pH conditions[26,28,31,32]. However, it remains unclear how pH-mediated changes in N forms influence N competition between crop plants and microorganisms.
To address this knowledge gap, a controlled experiment was conducted using soils of contrasting pH and wheat (Triticum aestivum), a significant global crop known to take up NO3− preferentially[30]. A 15N-paired labelling (15NH4NO3 or NH415NO3) approach was used to trace N uptake in acid and calcareous soil-wheat systems. Samples were collected at 4, 24, and 48 h after labelling. It was assumed that: (1) 15N recovery by both wheat and microbes would be higher in the calcareous soil-wheat system compared to the acid soil-wheat system; (2) soil microbes would compete with wheat and assimilate more inorganic N in the short term; and (3) 15NO3− uptake by wheat would be higher in the calcareous soil than in the acid soil, whereas the opposite would be occur for 15NH4+ uptake rate.
-
The acid soil was collected from Pingxing Township, Leshan City, Sichuan province, China (103°35'60" E, 29°34'13" N, average elevation 500 m), a typical agricultural area characterized by acidic purple soil. The region has a mid-subtropical humid climate, and the traditional cropping pattern includes a rice/corn–wheat/rapeseed double rotation. The calcareous soil was collected from Yufeng Town, Suining City, Sichuan province, China (105°30'39" E, 30°23'38" N, average altitude 362 m), a region dominated by calcareous purple soil derived from purple-red mudstone and exhibiting a strong lime reaction. Traditional cropping in this area includes wheat/maize/peanut intercropping.
In September 2022, soil samples were collected from both locations at five to eight sampling points, with surface soil (0–20 cm depth) collected. The collected soil samples were thoroughly mixed to create composite samples. Upon arrival at the laboratory, the soil samples were processed promptly. Larger soil clumps were broken down into smaller pieces approximately 1 cm in diameter, and any remaining plant or animal residues and small stones were removed. The soil samples were then stored in a cool, well-ventilated environment to reduce moisture content. A portion of the soil was used to analyze the basic physicochemical properties, while the remaining soil was used for cultivation experiments. Key soil properties are presented in Table 1.
Table 1. The soil physicochemical properties of calcareous and acid soils
Properties Soil types Calcareous soil Acid soil pH 8.17 4.83 SOC (g kg−1) 10.72 15.82 TN (g kg−1) 0.89 1.14 C/N 12.04 13.87 NH4+-N (mg kg−1) 1.01 4.90 NO3−-N (mg kg−1) 28.55 33.58 < 2 μm clay (%) 20.13 12.03 The 15N paired labelling experiment in the soil-wheat systems
-
An incubation experiment was conducted in the laboratory using calcareous and acid soils with wheat as the crop plant. The 15N paired-labelling approach enables the simultaneous calculation of multiple soil N transformation processes, including the uptake rates of 15NH4+ and 15NO3− by plants and soil microorganisms. Soil samples were passed through a 2 mm sieve. Cultivation tubes, with a capacity of 100 mL, were filled with 90 g of soil (based on dry weight). Soil moisture was adjusted to 70% of the water holding capacity (WHC). Six treatments, each with four replicates, were established:
(1) 15NH4NO3-labeled calcareous soil-wheat system
(2) NH415NO3-labeled calcareous soil-wheat system
(3) 15NH4NO3-labeled acid soil-wheat system
(4) NH415NO3-labeled acid soil-wheat system
(5) Unlabeled NH4NO3 calcareous soil-wheat system
(6) Unlabeled NH4NO3 acid soil-wheat system
Cultivation tubes were then incubated for 3 d to restore microbial activity. A circular opening approximately 1.3 cm in diameter was created in the center of each centrifuge tube cap. A plastic tube with an inner diameter of 1 cm was inserted through this opening to support plant growth securely. Three holes, each 1 mm in diameter, were drilled on the left side of every centrifuge tube for injecting 15N-labeled N fertilizer. Once injected, these holes were sealed with silicone plugs to prevent soil loss. Wheat seeds were soaked in distilled water for 24 h and subsequently germinated on moistened gauze at 22.5 °C. After 3 d of pre-cultivation, seedlings showing uniform growth were transplanted into individual centrifuge tubes, with one seedling per tube. Growth chamber conditions were set to a 15 h light/9 h dark cycle, with temperatures of 22 °C (day) to 18 °C (night), and a light intensity of 100 μmol m−2 s−1. Daily watering was performed by weight to ensure consistent soil moisture in each centrifuge tube. Fertilization was applied twice (3 d before sowing and 5 d after sowing) at rates of 2 mg N, 1.1 mg P, and 2.8 mg K per 90 g of soil.
Approximately 1 month after planting, the 15N paired-labelling experiment was initiated. Each labeled sample received 30 mg kg−1 of 15NH4+ or 15NO3−. Equivalent amounts of NH4NO3 were added to the unlabeled controls. Destructive sampling was conducted at 4, 24, and 48 h after labelling. Plant and soil samples were collected for 15N abundance analysis. Plant samples were promptly divided into above-ground and below-ground portions. Root samples were immersed in a 0.05 M KCl solution for 10 min to remove surface-adhered 15N, followed by rinsing with sterile water. The cleaned plant samples were subsequently sectioned into small pieces and stored at –80 °C for later measurement of 15N content. Soil samples were collected and divided into three portions. One portion was immediately subjected to immersion extraction for NH4+ and NO3− concentration and abundance. The second portion was stored at 4 °C for microbial biomass nitrogen analysis. And the third portion was used to determine moisture content. Microbial biomass 15N content was extracted using the chloroform fumigation method[33]. Briefly, 10 g of fresh soil samples were fumigated with chloroform for 24 h in the dark, and then all the samples were extracted with 0.05 M K2SO4. One part of the extract solution was immediately freeze-dried for analysis of 15N : 14N ratios by isotope-ratio mass spectrometry (Europa Scientific Integra, Crewe, UK). The other part of the solution was determining dissolved organic N (DON) by using a TOC-TN analyzer (Thermo Scientific, Dionex, USA). Soil 15NH4+ and 15NO3− were enriched using the microdiffusion method[17] and quantified by isotope ratio mass spectrometry.
Calculations
-
Soil gross N transformation rates, including gross mineralization rate as in Eq. (1), mineralization rate, Eq. (2), and immobilization rates, Eqs (3) and (4) were calculated by following equations[34] based on the 'isotope dilution method'. Microbial immobilization of NH4+ was calculated as the difference between 15NH4+ consumption and the gross nitrification rate. This calculation assumed gaseous losses (e.g., from nitrification, denitrification, or volatilization) and heterotrophic nitrification of organic N had negligible impacts on the 15NH4+ pool. In contrast, microbial NO3− immobilization was assumed to equal NO3− consumption[35]. The equations for Eqs (1)–(4) are as follows:
Soil gross mineralization rate (µg g−1 d−1):
$ \rm m_{\_gross} =\dfrac{[NH_4^+]_0 - [NH_4^+]_t}{t}\times \dfrac{log(^{15}[NH_4^+]_0/{}^{15}[NH_4^+]_t)}{log([NH_4^+]_0 / [NH_4^+]_t)}$ (1) Soil gross nitrification rate (µg g−1 d−1):
$ \rm n_{\_gross}= \dfrac{[NO_3^-]_0 - [NO_3^-]_t}{t}\times \dfrac{log({}^{15}[NO_3^-]_0/{}^{15}[NO_3^-]_t)}{log([NO_3^-]_0/[NO_3^-]_t)}$ (2) Soil NH4+ immobilization rate (µg g−1 d−1):
$ {\mathrm{i}}_{{{{{\text{NH}}_{\text{4}}^+}}}}=\text{m}-\dfrac{{[\text{NH}_{\text{4}}^{\text+}]}_{\text{t}}-{[\text{NH}_{\text{4}}^{+}]}_{\text{0}}}{\text{t}}-\text{n} $ (3) Soil NO3− immobilization rate (µg g−1 d−1):
$ {\text{i}}_{{{{{\text{NO}}_{\text{3}}^-}}}}=\text{n}-\dfrac{{[\text{NO}_{\text{3}}^{-}]}_{\text{t}}-{[\text{NO}_{\text{3}}^{-}]}_{\text{0}}}{\text{t}} $ (4) where, [NH4+]0 and [NH4+]t represent the initial and ending NH4+ concentrations (mg kg−1), 15[NH4+]0, and 15[NH4+]t denote the initial and ending 15NH4+ abundances (atom%), [NO3−]0 and [NO3−]t denote the initial and ending NO3− concentrations (mg kg−1), 15[NO3−]0 and 15[NO3−]t denote the initial and ending 15NO3− abundances (atom%), m_gross represents the gross mineralization rate, n_gross represents the gross nitrification rate, iNH4+ represents the NH4+ immobilization rate and
$\rm i_{NO_3^-} $ The uptake of 15N by plants and soil microorganisms was calculated using Eqs (5)–(11)[5,36]. The 15N atom% excess of plant and soil samples was determined as the difference in 15N atom% between the labeled and unlabeled control samples in Eq. (5). The 15N content in root and shoot tissues (μg) was calculated by multiplying N content in roots or shoots (μmol N g−1) by the corresponding 15N atom% excess, biomass (g), and the molecular mass of 15N as in Eq. (6)[5]. Soil 15N biomass was calculated by multiplying the soil N content (μmol N g−1) by 15N atom% excess, soil mass (g), and the corresponding molecular mass of 15N in Eq. (7).
Plant and soil microorganisms 15N atom % excess:
$\rm {}^{{15}}{{N}}_{{atom{\text{%}}\; excess}}={}^{{15}}{{N}}_{{atom{\text{%}} \;of\; labeled}}-{}^{{15}}{{N}}_{{atom{\text{%}}\; of\; unlabeled}} $ (5) 15N content of root/shoot (μg):
$ \begin{aligned}\rm {}^{15}N_{root/shoot}=\;&\rm N_{content}\;({\text {µ}}mol\;N\;g^{-1})\times {}^{15}N_{atom{\text{%}}\;excess}\times \\ &\rm Biomass\;(g) \times 15\;(g\;mol^{-1})\end{aligned}$ (6) Soil 15N biomass:
$ \begin{aligned}\rm {}^{15}N_{soil}=\;&\rm N_{content}\;({\text{µ}}mol\;N\;g^{-1}) \times {}^{15}N_{atom{\text{%}}\;excess} \times \\&\rm soil\;mass\;(g)\times 15\;(g\;mol^{-1})\end{aligned} $ (7) The plant 15N uptake rate (µg N g−1 soil DW d−1) was calculated by summing the 15N content of shoots and roots, and dividing this sum by the soil dry weight and the corresponding incubation time (day). Plant 15N recovery (%) was calculated as the ratio of the 15N content of shoots and roots to the added 15N concentration (µg g−1), the weight of the soil (g), and the atom% of labelled 15NH4NO3 or NH4 15NO3 as in Eqs (8) and (9).
Plant 15N uptake rate (µg N g−1 soil DW d−1):
$\rm P_{^{15}N\;uptake}=\dfrac{{}^{15}N_{root+shoot}\;({\text µ}g)}{soil\;(g)\times time\;(d)} $ (8) Plant 15N uptake recovery (%):
${\begin{array}{l}{\text{P}}_{^{15}\text{N recovery}}= \\ \dfrac{{^{15}\text{N}}_{\text{root+shoot}}\;\left(\text{µg}\right)}{^{{15}}{\text{N}}_{\text{added}}\;\text{concentration}\;({\text {µg}}\;{\text{g}}^{-1})\;\times\;\text{soil}\;\left(\text{g}\right)\;\times\text{ abundance of labeled}\;^{15}{\rm N}\; ({\text{%}})}\times 100{\text{%}}\end{array}}$ (9) Microbial 15N uptake rate (µg N g−1 soil DW d−1) was determined as the differences between the 15N mass of fumigated and unfumigated soils (µg), divided by the soil dry weight (g) and the corresponding incubation time (day) as in Eq. (10). Microbial 15N uptake recovery (%) was determined by calculating the microbial 15N content of microbial biomass divided by the added 15N (µg g−1) and the 15N abundance of labelled 15NH4NO3 or NH415NO3 (i.e., 10.13%) in Eq. (11). The result of recovery was multiplied by 100.
Microbial 15N uptake rate (µg N g−1 soil DW d−1):
$ \rm M_{^{15}N\;uptake}=\dfrac{soil\;^{15}N\;mass\;({\text µ}g)_{\_fumigation}{-}soil\;{}^{15}N\;mass\;({\text µ}g)_{\_unfumigation}}{soil\;(g)\times time\;(d)} $ (10) Microorganism 15N uptake recovery (%):
${ \begin{aligned}&\rm M_{^{15}N\;recovery}=\\&\rm\dfrac{microbial\;{}^{15}N\;content\;of\;microbial\;biomass\;({\text µ}g)}{{}^{15}N_{added}\;concentration\;({\text µ}g\;g^{-1})\times soil\;(g)\times abundance\;of\;labeled\;{}^{15}N\;({\text{%}})}\times 100{\text{%}} \end{aligned}}$ (11) Statistical analysis
-
Repeated measures analysis of variance to compare changes over time in NH4+ and NO3− concentrations, as well as their 15N enrichment during the aerobic incubation period. One-way ANOVA was used to assess differences in plant traits across various growth stages and multiple N transformation rates. Linear regression was used to examine the relationship between wheat N uptake rates and soil microbial N assimilation rates. All statistical analyses were performed using SPSS 20.0 (IBM Corp., Armonk, NY, USA), with a significance level set at p < 0.05. Figures were drawn using GraphPad Prism 9.5 (GraphPad Software, San Diego, CA, USA).
-
The gross mineralization and gross nitrification rates were significantly higher in the calcareous soil-wheat system compared to the acid soil-wheat system, with increases of nine-fold and two-fold, respectively (Fig. 1a, b, p < 0.05). Correspondingly, exchangeable NH4+ concentrations were lower in the calcareous soil-wheat system, while NO3− concentrations did not differ significantly between the two systems (Table 2). In the acid-soil wheat system, inorganic N immobilization rates were higher than those in the calcareous soil-wheat system, measuring 10.41 and 6.92 mg kg−1 d−1, respectively (Fig. 1c, p < 0.05). It is important to note that the NH4+ immobilization rates were calculated assuming that volatilization, heterotrophic nitrification, and denitrification did not affect 15NH4+, and that the NO3− immobilization rates were calculated assuming that denitrification and dissimilatory reduction of NO3− to NH4+ (DNRA) were negligible. Thus, the immobilization rates may have been overestimated.

Figure 1.
(a) The gross mineralization rates, (b) nitrification rates, and (c) immobilization rates in the acid and calcareous soil-wheat systems. Differences between the soil-wheat systems are indicated by *, * p < 0.05, ** p < 0.01, and *** p < 0.001.
Table 2. The concentration and 15N abundance of NH4+/NO3− in the calcareous and acid soil-wheat systems
Calcareous soil-wheat system Acid soil-wheat system 0 h 4 h 24 h 48 h 0 h 4 h 24 h 48 h NH4+-N 30.93 22.34 ± 1.00a 14.00 ± 0.66b 5.92 ± 0.73c 31.02 33.62 ± 1.32a 32.53 ± 1.04a 19.94 ± 0.58b NO3−-N 61.40 60.06 ± 3.64a 67.72 ± 2.22a 70.15 ± 3.99a 66.50 65.87 ± 0.65a 74.17 ± 0.92a 71.50 ± 2.81a 15NH4+ 9.71 8.42 ± 0.24a 7.88 ± 0.10a 4.21 ± 0.25b 9.68 8.28 ± 0.21a 8.24 ± 0.08a 8.25 ± 0.06a 15NO3− 5.12 4.62 ± 0.14a 4.10 ± 0.08a 3.64 ± 0.13a 4.15 3.83 ± 0.15a 3.58 ± 0.15a 3.48 ± 0.06a Lowercase letters represent differences between the calcareous and acid soil-wheat systems at different labeling times. p < 0.05. 15N uptake rates of wheat and soil microbes
-
In the calcareous soil-wheat system, the 15N uptake rate of 15NH4+ labelling increased over time and became significantly higher than the uptake rate of 15NO3− after 48 h (Fig. 2a, p < 0.05). In contrast, in the acid soil-wheat system, there was no significant difference in the 15N uptake rate between 15NH4+ and 15NO3−, which were approximately equal (around 1:1). However, at 48 h, the uptake rate of 15NO3− was significantly higher than that of 15NH4+ (p < 0.05).
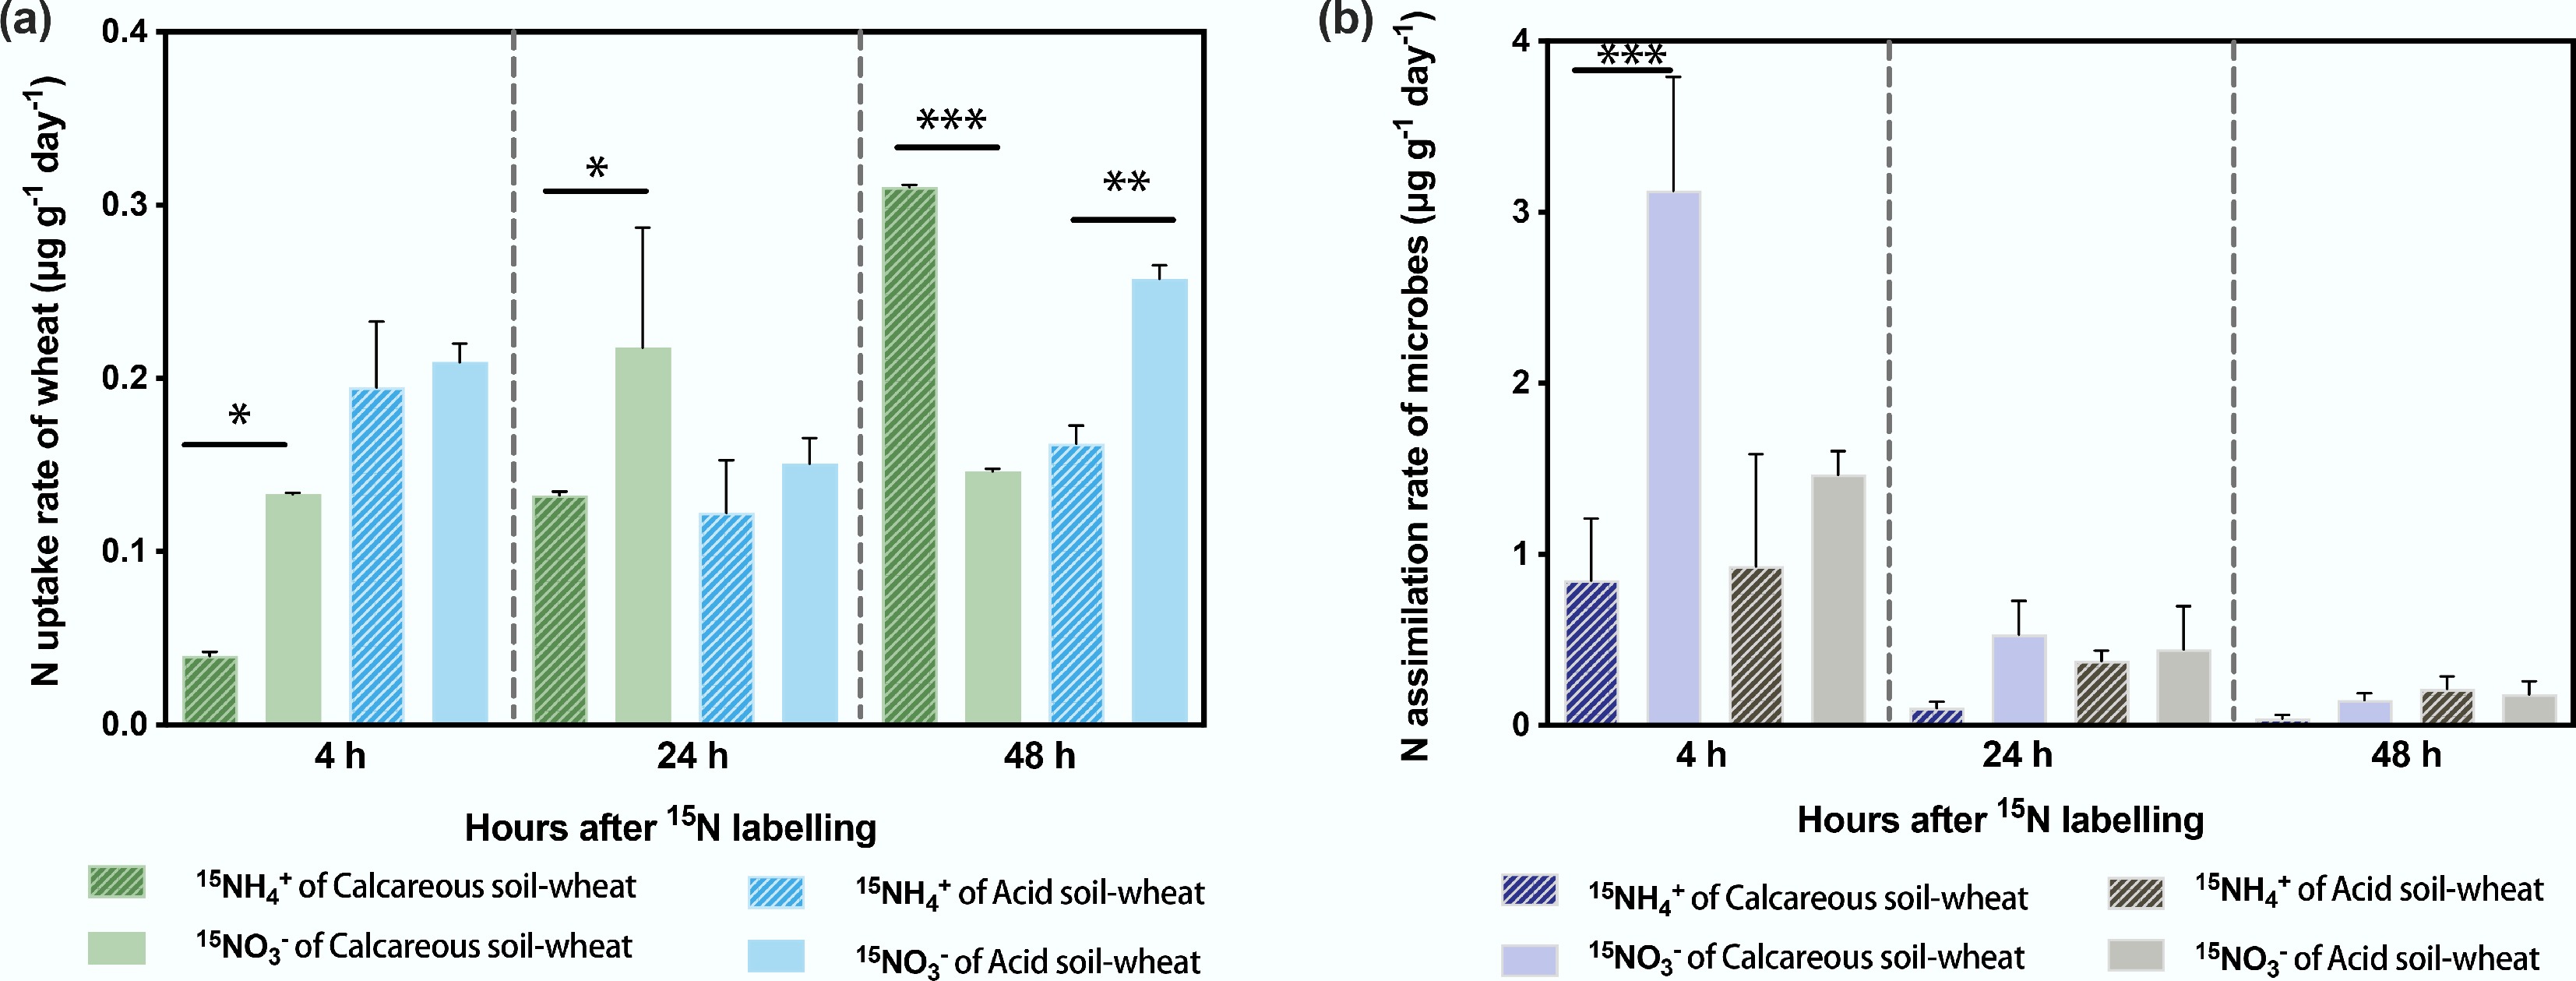
Figure 2.
The 15NH4+ and 15NO3− uptake rates of (a) wheat and (b) soil microorganisms with time-varying conditions in calcareous and acid soil-wheat systems. Differences between 15NH4+ and 15NO3− uptake/assimilation rates are indicated by *, * p < 0.05, ** p < 0.01, and *** p < 0.001.
Microbial assimilation rates of inorganic 15N declined over time in both systems. In the calcareous soil-wheat system, at first 4 h, microorganisms showed a significantly higher assimilation rate of 15NO3− than of 15NH4+ (p < 0.05). Beyond this time point, the microbial assimilation rates of the two 15N forms did not differ significantly. Overall, in the calcareous soil-wheat system, microorganisms did not exhibit a clear preference for either NH4+ or NO3− throughout the experiment (Fig. 2).
When comparing uptake rates between microbes and wheat, after 4 h of labelling, the inorganic N uptake rate of wheat was only half that observed in the acid soil, indicating that microbes exerted intense N competition in the early stage. As time progressed, the wheat uptake rate did not exceed that of microorganisms in either system.
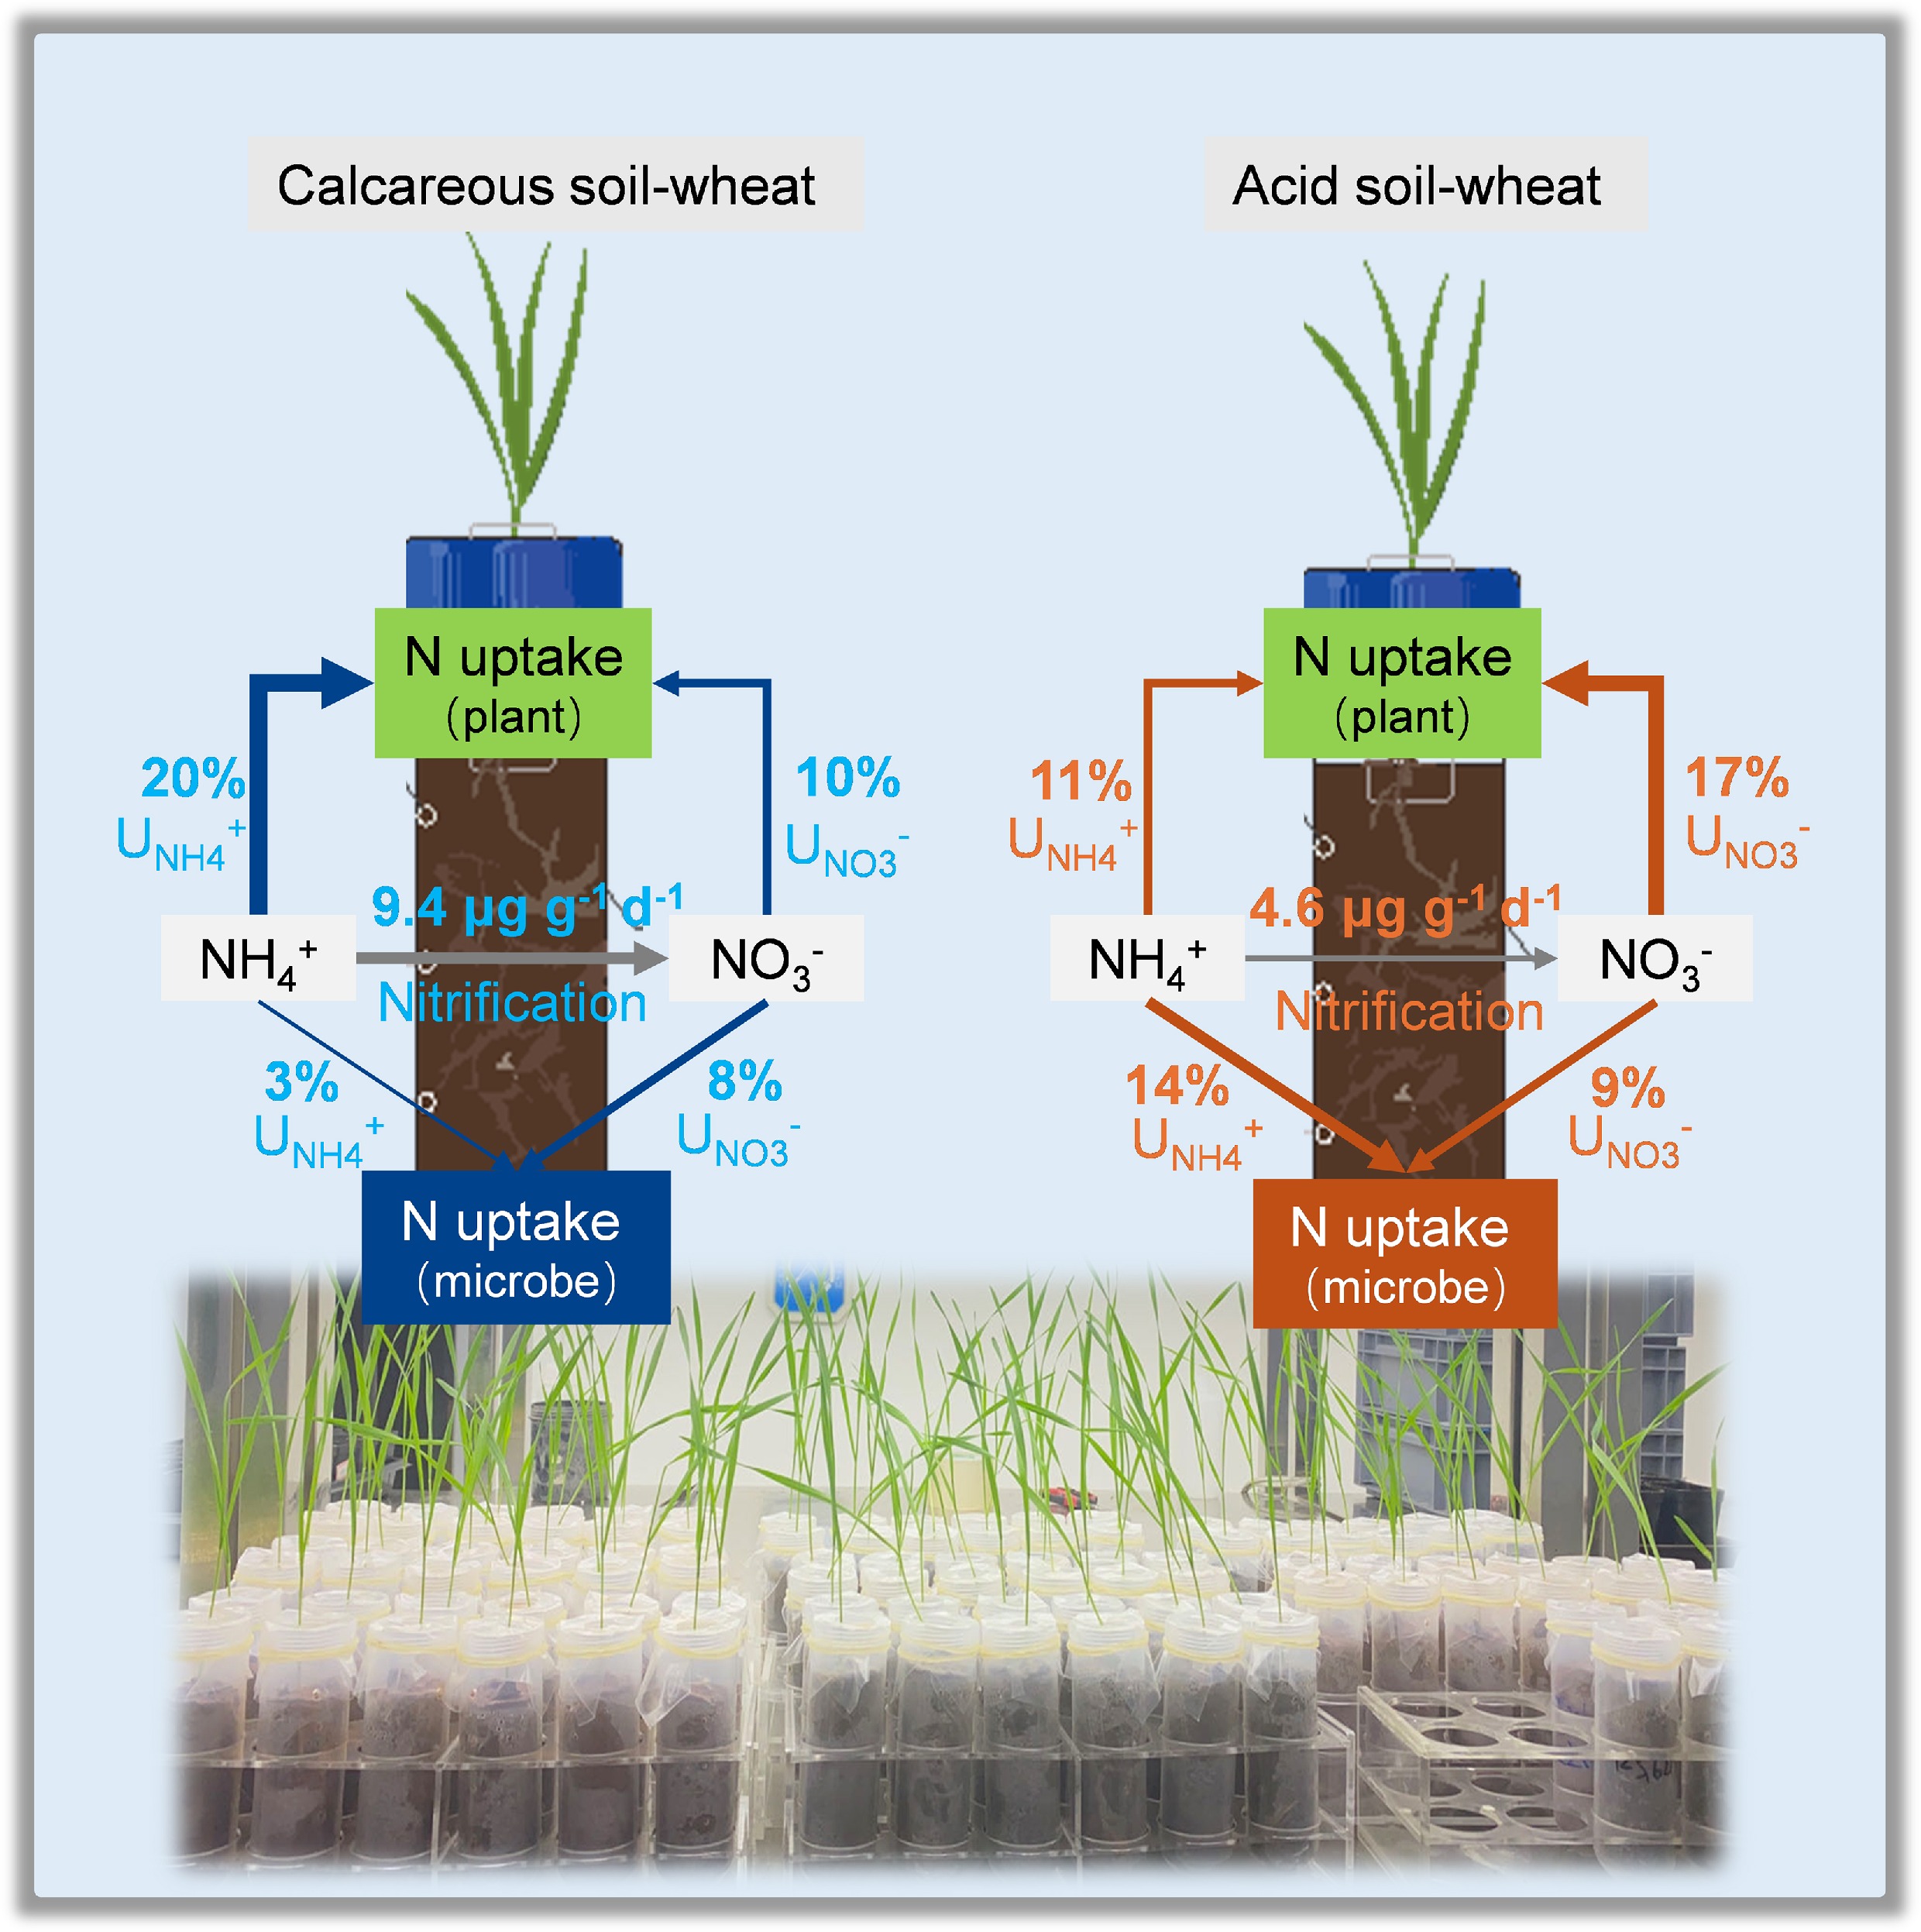
In summary, total wheat 15N uptake rates were slightly lower than microbial 15N assimilation rates in the acid soil-wheat system (0.42 vs 0.40 µg g−1 d−1), but higher in the calcareous soil-wheat system (0.46 vs 0.19 µg g−1 d−1). However, there was no remarkable difference in either the 15N uptake rates between the calcareous soil-wheat system and the acid soil-wheat system (Table 3). Thus, soil pH-dependent differences in gross N transformation rates significantly changed microbial 15N assimilation, but not wheat 15N uptake.
Table 3. The time-weighted average gross mineralization rates, gross nitrification rates, 15N uptake (15NH4+ + 15NO3−) of wheats, 15N assimilation rate of microbes, ratios of microbial 15N uptake to wheat 15N uptake rates, and total 15N recovery (15NH4+ + 15NO3−) at 48 h in the calcareous and acid soil-wheat systems
Gross mineralization
rate (µg g−1 d−1)Gross nitrification rate (µg g−1 d−1) 15N uptake
rate of wheat
(µg g−1 d−1)15N assimilation rate of microbes
(µg g−1 d−1)Ratios of microbial 15N uptake to wheat 15N uptake rates (%) 15N recovery
of wheat (%)15N recovery of microbes (%) Calcareous soil-wheat 3.63 ± 0.6a 9.44 ± 1.6a 0.46 ± 0.00a 0.19 ± 0.04b 41.30% 30.23 ± 0.4 10.55 ± 3.5 Acid soil-wheat 0.40 ± 0.1b 4.63 ± 1.2b 0.42 ± 0.01a 0.40 ± 0.12a 95.23% 27.99 ± 0.7 23.42 ± 6.8 15N recovery of wheat and soil microbes
-
Wheat 15N recovery increased progressively with incubation time, ranging from 1.0% to 30.2% in the calcareous soil-wheat system and from 2.3% to 28.0% in the acid soil-wheat system (Fig. 3). The preference for 15NH4+ or 15NO3−, as indicated by the uptake rates, was consistent at each time point (Fig. 3a). In the calcareous soil-wheat system, microbial 15N recovery gradually declined over time, with a significantly higher recovery of 15NO3− compared to 15NH4+ (p < 0.05). In contrast, no clear decreasing trend was observed for microbial 15N recovery in the acid soil-wheat system (Fig. 3b, Table 3).
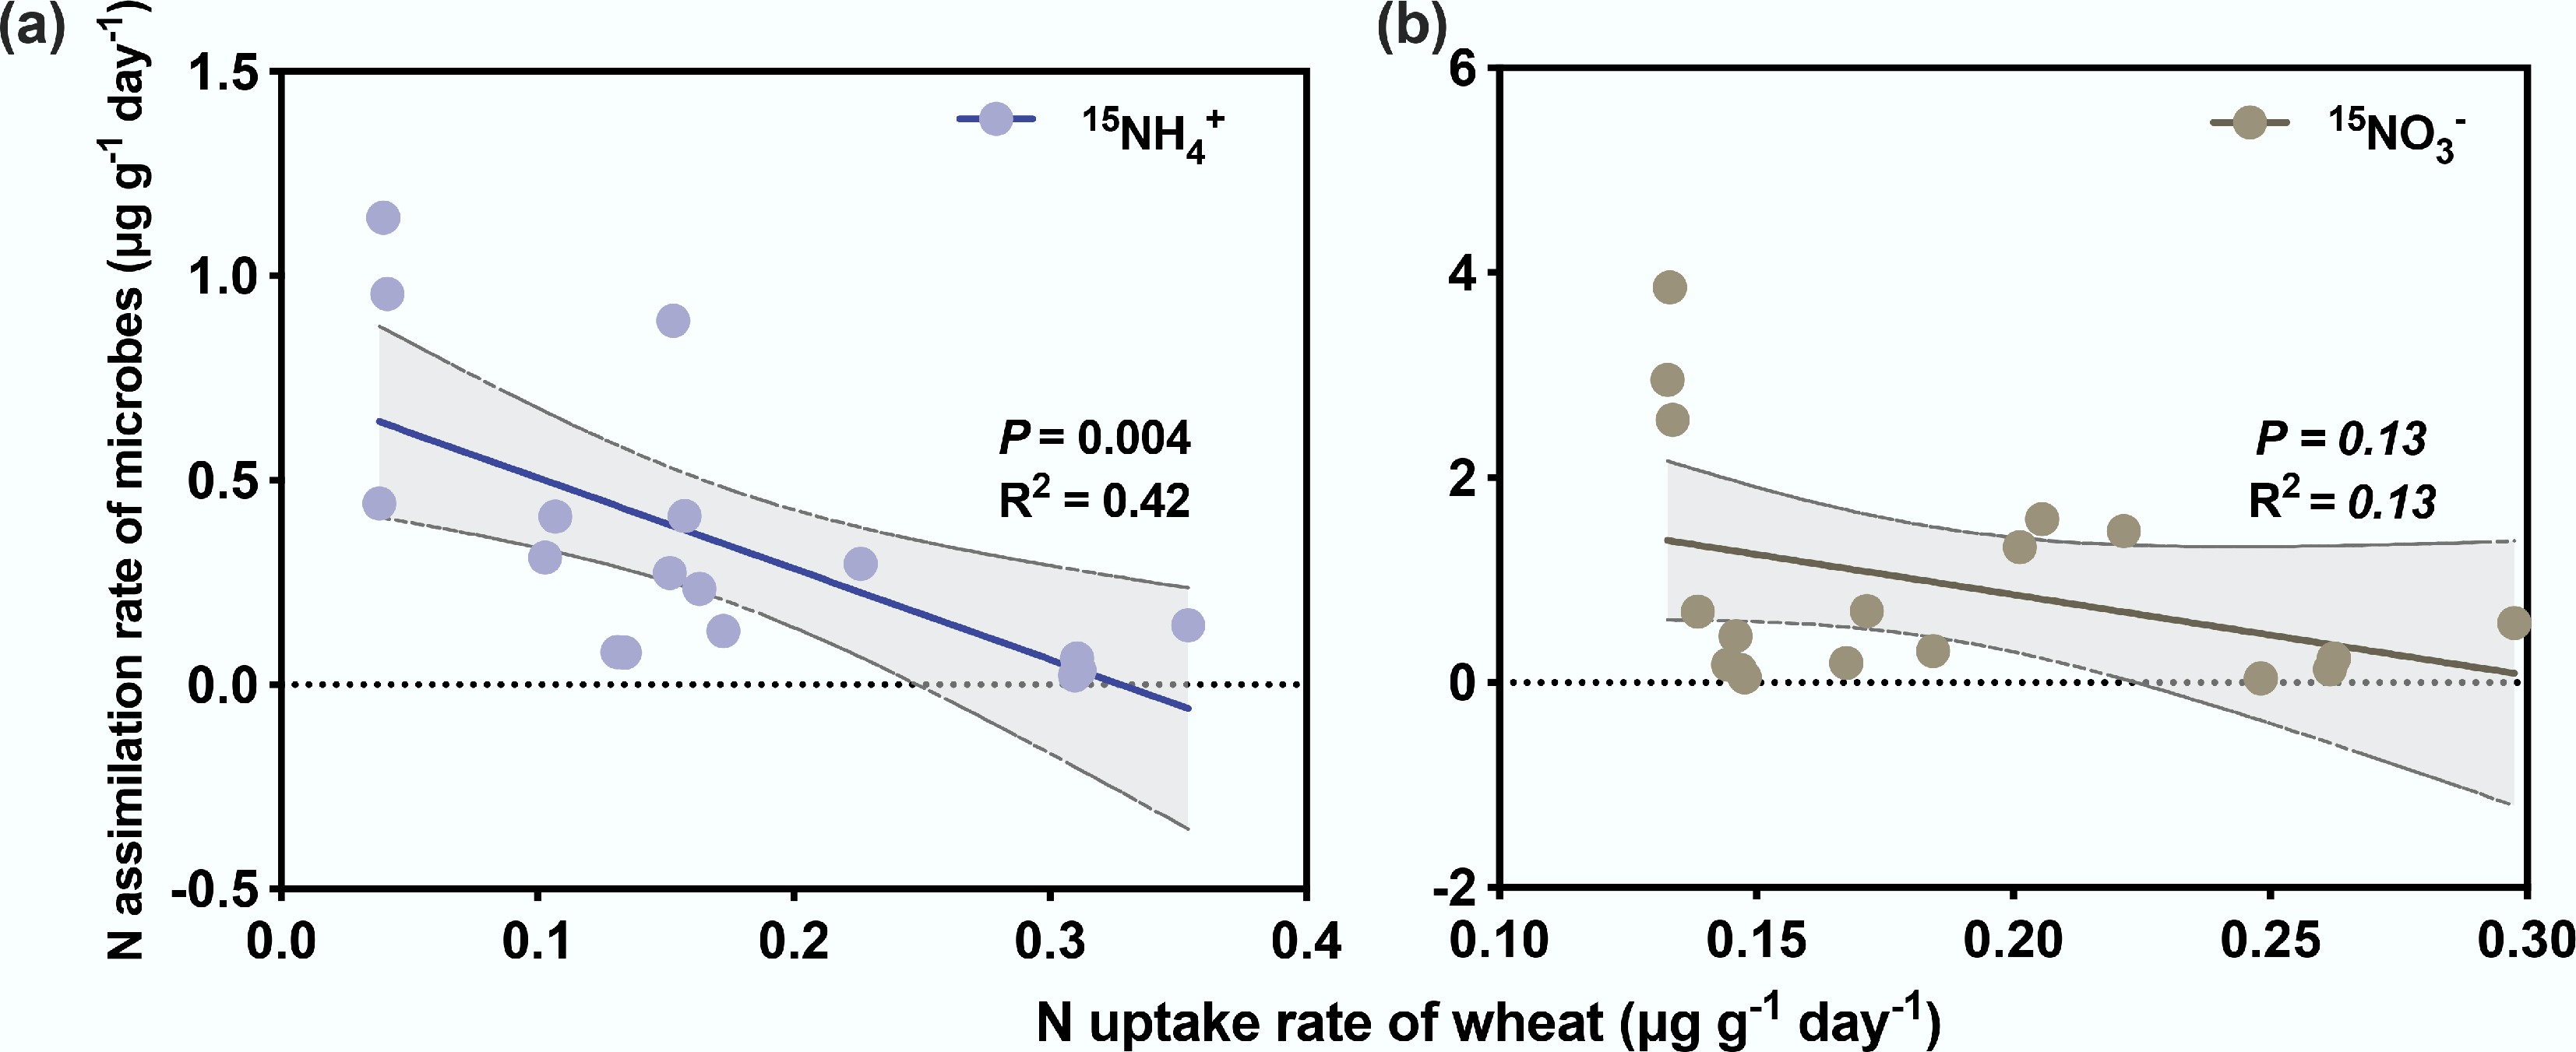
Figure 3.
The % 15N recovery of (a) wheat and (b) soil microorganisms of calcareous and acid soil-wheat systems. The values at the top represent the ratios of total 15N recovery (15NH4+ + 15NO3−) in calcareous soil and that of acid soil at each time point.
Furthermore, regardless of whether 15NH4+ or 15NO3− was labelled, microbial 15N assimilation rates were significantly negatively correlated with plant 15N uptake rates (Fig. 4), highlighting the competitive relationship between plants and microorganisms. Specifically, 4 h after labelling, microorganisms assimilated 22.1% of 15N in the calcareous soil-wheat system and 13.3% acid soil-wheat system, demonstrating a pronounced competitive advantage at the early stage over wheat. However, at 48 h after labelling, 15N recovery by wheat exceeded that of microorganisms (Table 3), independent of soil pH (i.e., calcareous or acid soil).
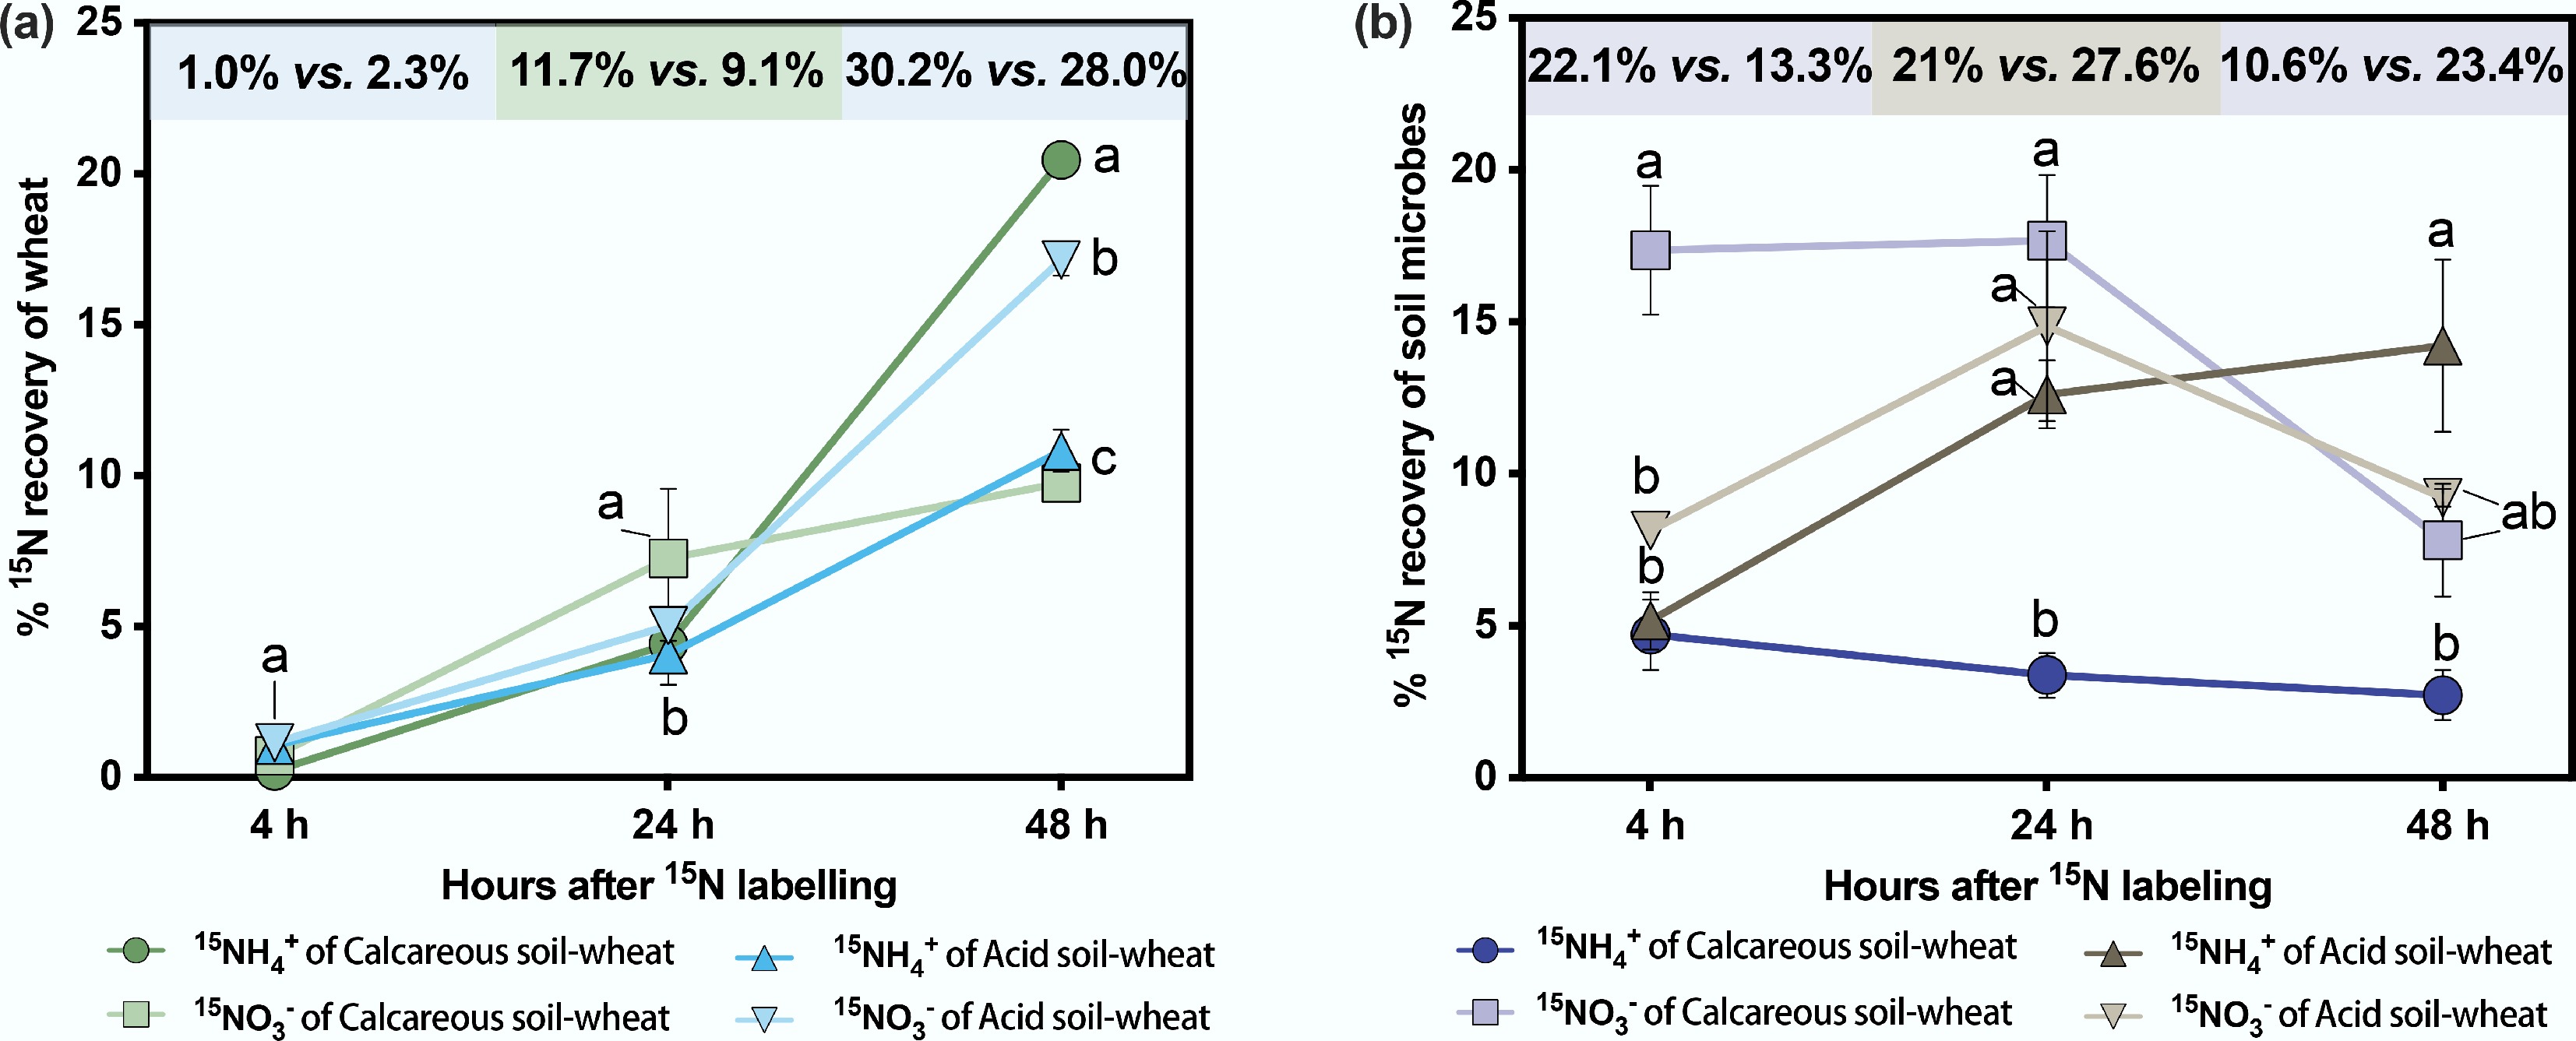
Figure 4.
The regression analyses of N assimilation rates of wheat and soil microorganisms of calcareous and acid soil-wheat systems under (a) 15NH4+ and (b) 15NO3− labelling.
-
First hypothesis mentioned that 15N recovery would be higher in the calcareous soil-wheat system, was partially supported for wheat but refuted for microbes, as microbial 15N recovery was higher in the acid soil after 48 h. For the second hypothesis, microbes would outcompete plants in the short term, was strongly supported only during the first 24 h. The third hypothesis stated that wheat would take up more 15NO3− and less 15NH4+ in the calcareous soil than in the acid soil, was supported only during the first 24 h and reversed after 48 h.
The result showed that wheat 15N uptake rates, which preferentially absorb NO3−, were higher in calcareous soil than in acid soil. In addition, gross nitrification rates were higher in calcareous soil (Table 3). Previous studies have confirmed that crop N preferences (NO3− vs NH4+) are correlated with soil N transformation dynamics[26,28]. The soil NH4+ : NO3− ratio is a crucial determinant of plant N preference[14,37,38]. For example, a pot experiment[39] demonstrated that wheat preferentially absorbs NO3− under normal conditions, the application of a nitrification inhibitor (e.g., nitrapyrin) significantly increased NH4+ uptake while reducing NO3− uptake, bringing their relative uptake rates into balance.
Although distinct gross N transformation rates influenced wheat 15N uptake patterns, wheat preferential NO3− uptake in the calcareous soil occurred only during the first 24 h (Figs 1b and 2a). At 48 h after labelling, the 15NH4+ uptake rate of wheat exceeded NO3−, despite abundant NO3− remaining in the calcareous soil. One explanation is that plant N uptake is highly plastic and flexible[40,41], facilitating adjustments in the uptake of different N chemical forms to optimize resource partitioning. For instance, alpine plants increase NH4+ absorption under competitive conditions[42]. Because NH4+ uptake requires less energy than the assimilation of organic N compounds[11], wheat may simultaneously utilize both N sources under these conditions.
Moreover, the result showed that the decline in NH4+ concentration in calcareous soil (Table 2) supports the increased NH4+ uptake along with active nitrification (Table 3), indicating a dynamic adjustment in N uptake strategy of wheat. In fact, plant uptake of NO3− and NH4+ is regulated by the dynamics of rhizosphere pH. NO3− uptake releases OH− and increases pH, whereas NH4+ uptake releases H+ and acidifies the rhizosphere[43]. To maintain pH balance in the rhizosphere, wheat may increase NH4+ uptake after an initial phase of elevated NO3− uptake, thereby optimizing nutrient use efficiency. This mechanism may partly explain the N uptake pattern observed in this study and could represent a competitive advantage under high nitrification conditions that limit NH4+ availability.
In contrast, wheat in acid soil showed a preference for 15NO3− at 48 h (Fig. 2a). Because NH4+ is less mobile and may form depletion zones in the rhizosphere, NO3− becomes a more accessible N source for plants in later stages[39,44]. Moreover, NH4+ can exert toxic effects on plants[45], and NO3− application has been shown to alleviate NH4+ toxicity[45,46], leading plants to increase NO3− uptake under such conditions[28]. Overall, the uptake and metabolism of inorganic N by plants are influenced by multiple interacting factors, including N supply dynamics, soil chemical conditions, rhizosphere microbial communities, growth stage, and intrinsic physiological regulatory mechanisms. Plants may adjust the relative uptake of NO3− and NH4+ to adapt to the spatiotemporal heterogeneity of soil N availability, while simultaneously regulating rhizosphere pH and internal N metabolism to optimize nutrient use efficiency and growth adaptability.
There is indeed uncertainty regarding the estimation of certain 15N forms uptake by plants in this study[47]. In the 15NH4+ labeled treatment, without the constraint of nitrification, it is impossible to fully distinguish whether plant 15N uptake originated directly from 15NH4+ or indirectly from 15NO3− produced by nitrification. This may lead to overestimation of 15NH4+ uptake even under short isotope exposure times. To address the limitation, the methodology should be improved, such as using nitrification inhibitors to decrease the nitrification rate or modelling approaches[48,49].
Microbial-plant N competition under different soil pH
-
It was found that plant N uptake rates and 15N recovery increased continuously, and exceeded microbial uptake after 48 h (Fig. 3, Table 3), regardless of soil pH. Several reasons may explain this pattern. First, incubation conditions in small pots could constrain root growth, increasing root density and enhancing plant competitive ability[5,50]. Microbes, however, can rapidly assimilate large amounts of inorganic N in the short term due to faster growth and higher surface-area-to-volume ratios[10,51]. Second, plants generally outcompete microorganisms for NO3− more effectively than for NH4+[50,52], especially wheat, which prefers NO3−. Because NO3− availability remained high in both soils (Table 1), microbes may reduce competition for N uptake, leading to temporary microbial N retention followed by rapid turnover[9], and decreasing constraints on plant inorganic N uptake[3,53].
In contrast, soil pH appeared to influence microbial 15N recovery during the early stages. Microbial 15N recovery was higher in the acid soil than in the calcareous soil after 48 h (Table 3), indicating a greater sensitivity to pH fluctuations[54,55]. The ratio of microbial N immobilization to plant N uptake was substantially higher in the acid soil than in the calcareous soil (95.23% vs 41.3%), indicating that microorganisms can compete with wheat for inorganic N under acid conditions. This result was inconsistent with the previous study, which found that low pH has a stronger inhibitory effect on microbes than on plants, thereby weakening microbial competition for inorganic N and enhancing the competitive advantage of plants in the rhizosphere environment[3]. A likely explanation is that higher nitrification rates in the calcareous soil-wheat system produced lower NH4+ concentration (Table 2), limiting microbial NH4+ assimilation relative to the acid soil. Besides, as soil organic carbon in calcareous soil was lower than that in acid soil (Table 1), carbon availability might differ between calcareous and acid soils, which can affect microbial growth strategies and their ability to assimilate N[9].
Currently, studies have shown that plants and rhizosphere microbes reduce direct competition through niche differentiation, thereby optimizing N resource utilization[5,49]. However, no significant plant-microbe niche differentiation was observed under NH4NO3 treatment in this study. This may be attributed to the high inorganic N availability in agricultural soils (Table 1) and the low ratio of microbial N assimilation to plant N uptake (Table 3), which reduces competition pressure compared to N-limited natural ecosystems[52]. Moreover, plants can also absorb organic N, including low molecular weight amino acids and peptides from the soil solution[56], which can influence N competition and has not been investigated in this study. Previous studies have suggested that microbes act as N reservoirs in soil systems, with a greater N retention potential than plants[7]. Due to rapid turnover rates[9], microbes exhibit strong N retention potential within specific timeframes. Notably, despite similar NO3− concentrations in calcareous and acid soils (Table 2), quicker mineralization and nitrification processes in calcareous soils led to faster N turnover. Thus, combined with continuous N uptake by both plants and microbes, the calcareous soil-wheat system could result in a higher actual N supply compared to acid soils.
-
Total wheat 15N recovery (15NH4+ + 15NO3−) was higher in calcareous soil than in acid soil, whereas microbial 15N recovery was higher in acid soil at 24 and 48 h after labelling. Specifically, 15N uptake by wheat continuously increased in both soil-wheat systems, varying from 1.0% to 30.2% in calcareous soil and 2.3% to 28.0% in acid soil. 15N recovery of microbes in acid soil was stable, while microbial 15N recovery in calcareous soil decreased after 48 h. In addition, microbial 15NH4+ recovery increased first and then reduced, except in the calcareous soil-wheat system, which decreased continuously after labelling. Both wheat 15NH4+ and 15NO3− recovery were higher in acid soil than in calcareous soil after 48 h. Overall, the results indicated that wheat (preferring NO3−uptake) dominated N uptake over microorganisms in the calcareous soil, rather than in the acid soil, after labelling for 48 h. These findings provide new insights for understanding the regulatory role of soil pH in short-term plant-microbe N competition in agricultural soils.
-
Not applicable.
-
The authors confirm their contributions to the paper as follows: Xiaoqian He: study conception and design, investigation, formal analysis, writing original draft; Mengxiao Li: writing original draft; Jiaju He: investigation, formal analysis; Xuesong Gao: writing review and editing; Minghua Zhou: writing review and editing; Ting Lan: study conception and design, writing review and editing. All authors reviewed the results and approved the final version of the manuscript.
-
The data that support the findings of this study are available from the corresponding author upon reasonable request.
-
This work was supported by the National Natural Science Foundation of China (Grant No. U22A20562).
-
The authors declare that they have no conflict of interest.
-
Full list of author information is available at the end of the article.
- Copyright: © 2026 by the author(s). Published by Maximum Academic Press, Fayetteville, GA. This article is an open access article distributed under Creative Commons Attribution License (CC BY 4.0), visit https://creativecommons.org/licenses/by/4.0/.
-
About this article
Cite this article
He X, Li M, He J, Gao X, Zhou M, et al. 2026. Quantifying NH4+ and NO3− uptake by wheat under microbial competition in acid and calcareous soils. Nitrogen Cycling 2: e004 doi: 10.48130/nc-0025-0016 

Quantifying NH4+ and NO3− uptake by wheat under microbial competition in acid and calcareous soils
- Received: 04 November 2025
- Revised: 04 December 2025
- Accepted: 17 December 2025
- Published online: 15 January 2026
Abstract: Plant-microbial interactions for nitrogen (N) in the rhizosphere strongly influence plant productivity and N cycling. Soil pH plays a pivotal role in regulating N availability and shaping competition for N between plants and microorganisms. However, the effect of pH on N competition between microbes and plants with specific N preferences remains insufficiently understood. In this study, a short-term experiment combined with 15N isotope tracing was conducted to quantify ammonium (NH4+) and nitrate (NO3−) uptake by wheat (which preferentially takes up NO3−) and microorganisms in acid and calcareous agricultural soils. The study showed that wheat exhibited pH-dependent uptake patterns for different inorganic N forms and 15N uptake rates. In the calcareous soil, wheat preferentially absorbed NO3− over NH4+ during the first 24 h (NH4+ : NO3− = 0.61), whereas in the acid soil, wheat showed no significant preference for either NO3− or NH4+ during the first 24 h (NH4+ : NO3− = 0.81). Total 15N uptake rates of wheat were higher in the calcareous soil than in the acid soil, while 15N assimilation rates of microbes were lower in the calcareous soil. Wheat dominated N uptake over microorganisms in the calcareous soil rather than in the acid soil at 48 h after labelling. Consequently, the ratios of microbial inorganic N assimilation to plant N uptake were higher in the acid soil than in the calcareous soil (95.23% vs 41.3%). Overall, the findings demonstrate that wheat exhibits distinct acquisition strategies for NO3− and NH4+ in soils with contrasting pH, and dominates N uptake over microorganisms in a calcareous soil (with a higher nitrification rate).