-
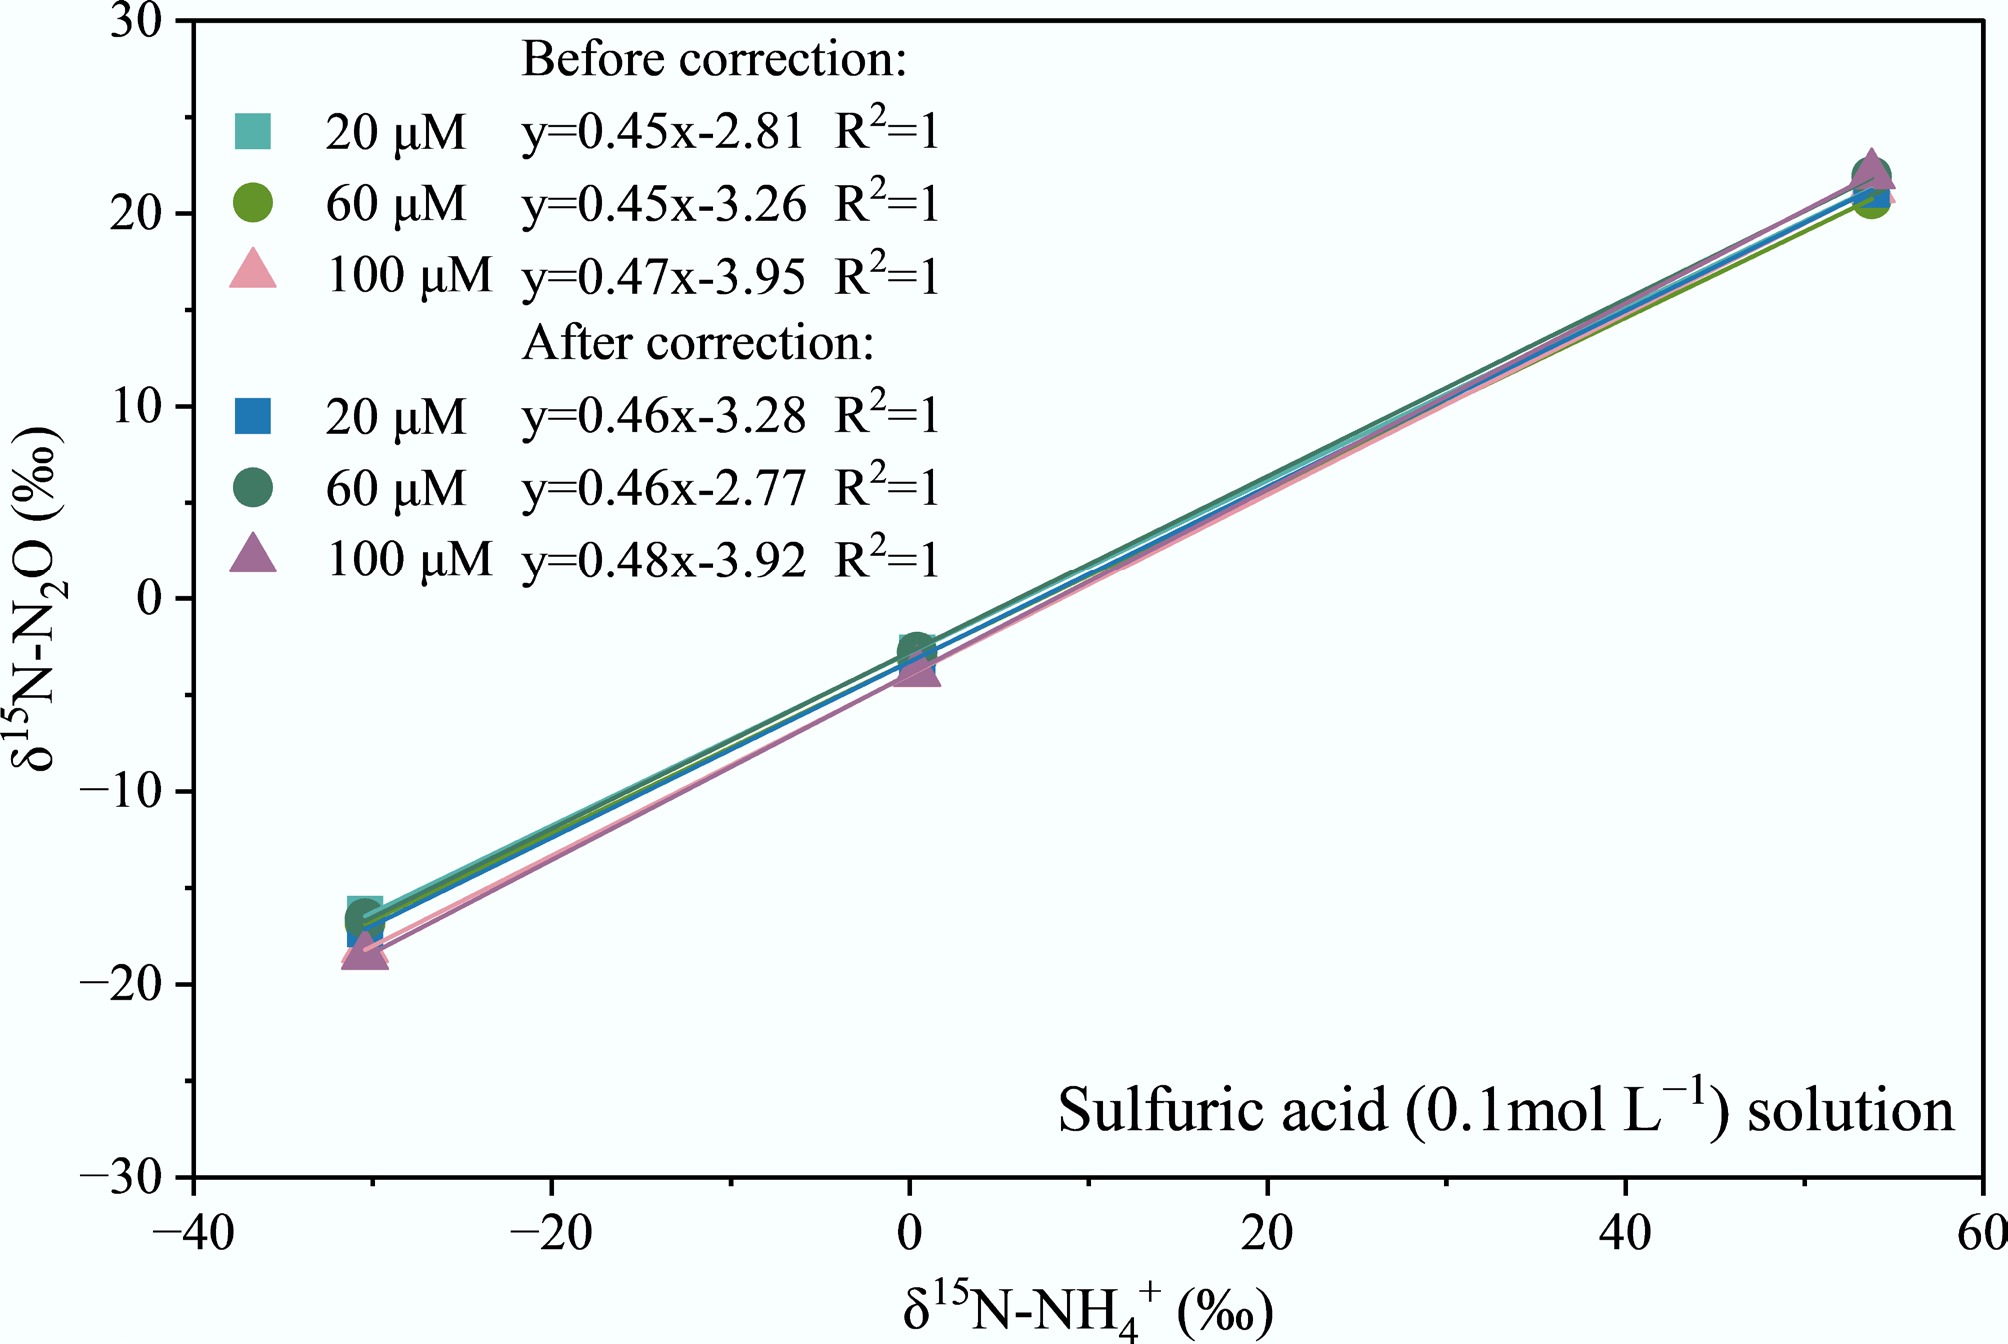
Figure 1.
Conversion curves of δ15N-N2O and δ15N-NH4+ at different NH4+ concentrations in sulfuric acid (0.1 mol L−1) solution.
-
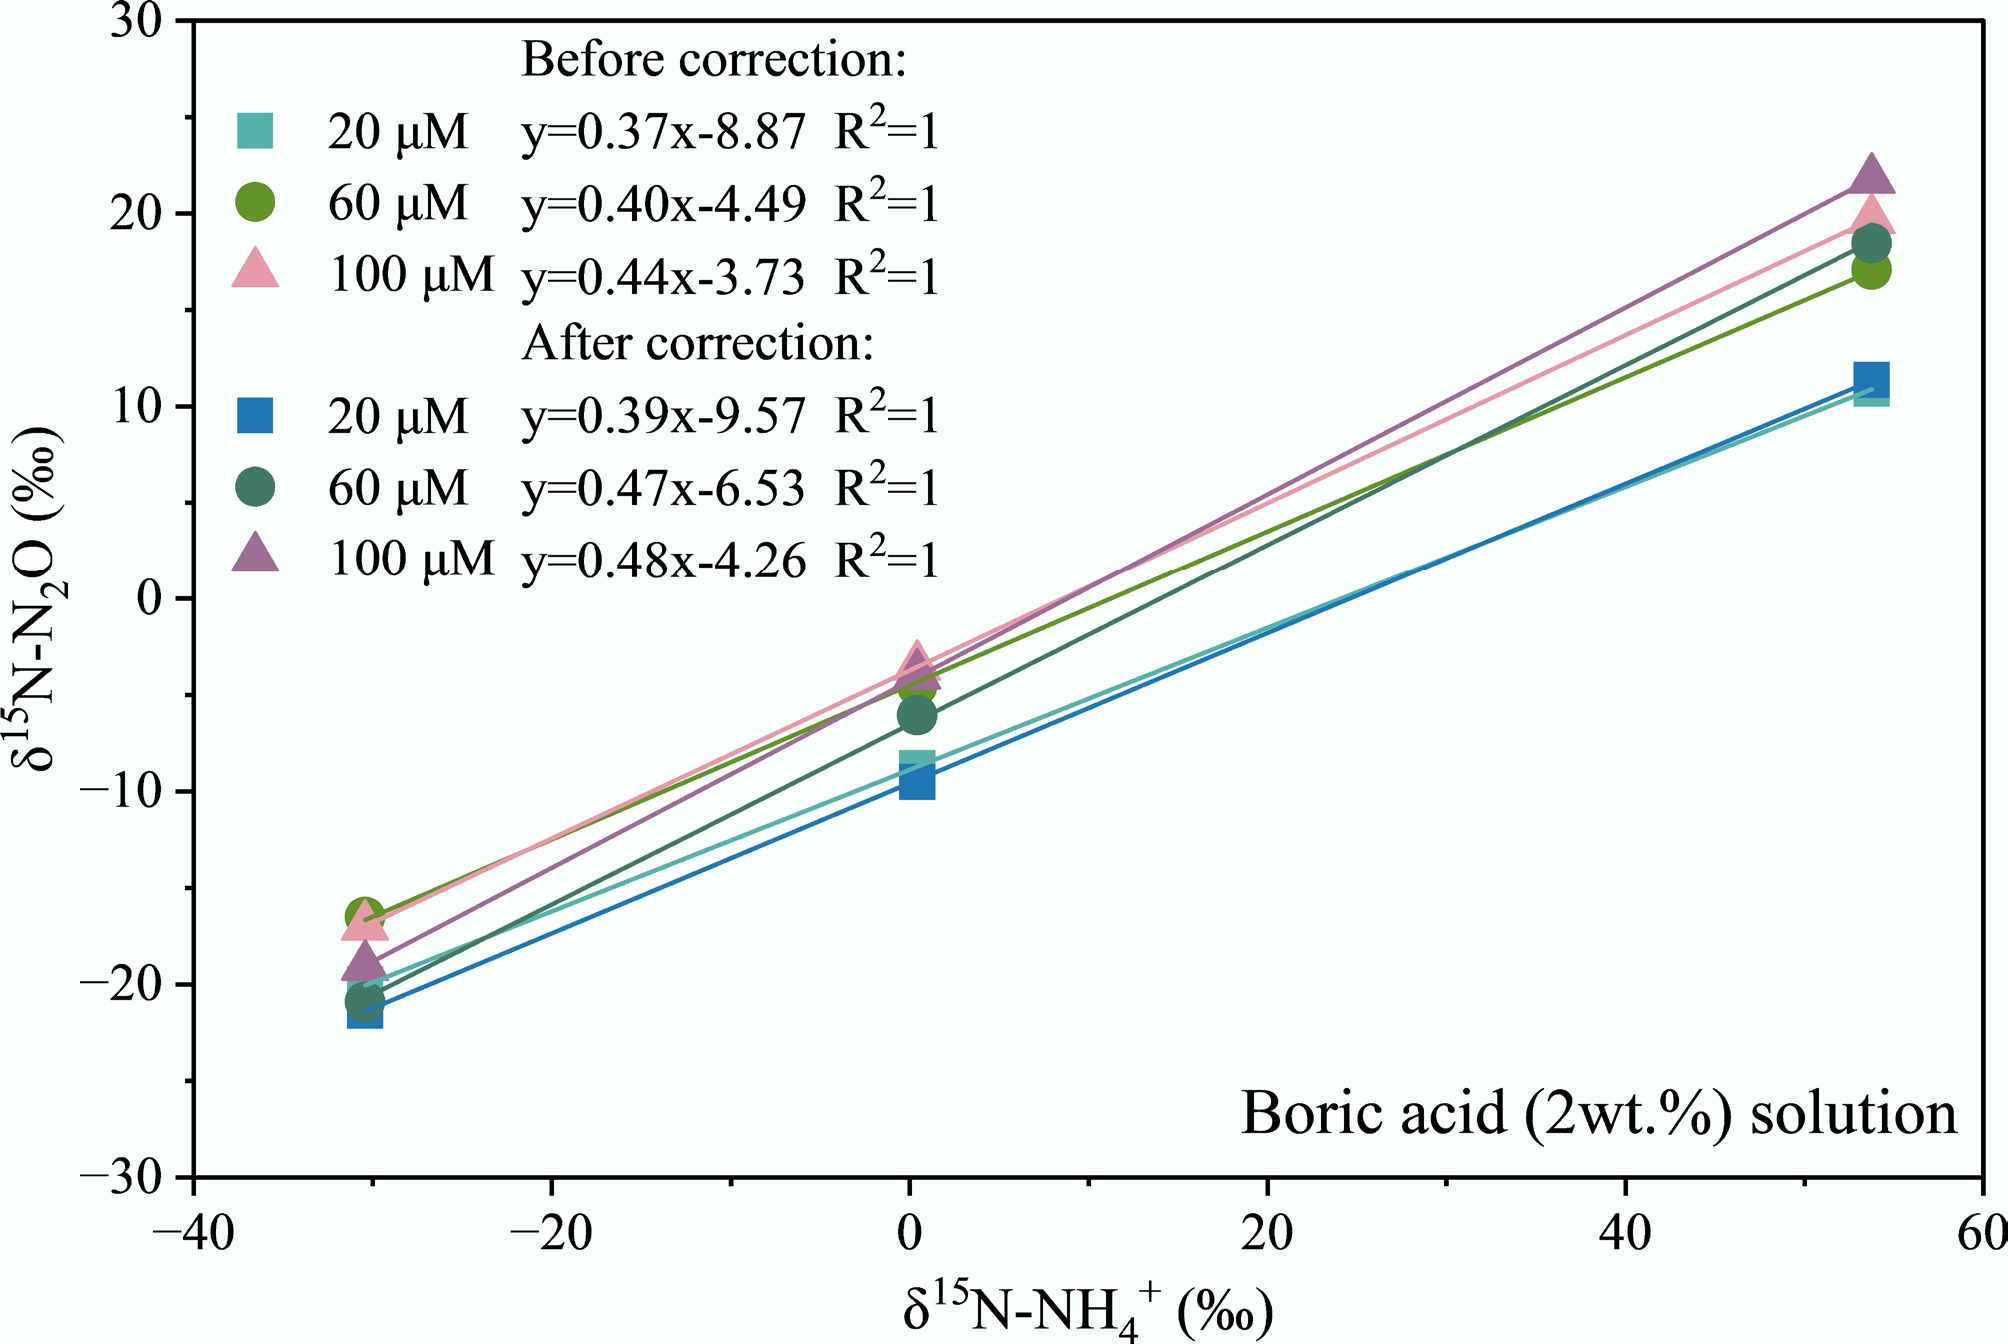
Figure 2.
Conversion curves of δ15N-N2O and δ15N-NH4+ at different NH4+ concentrations in boric acid (2 wt.%) solution.
-
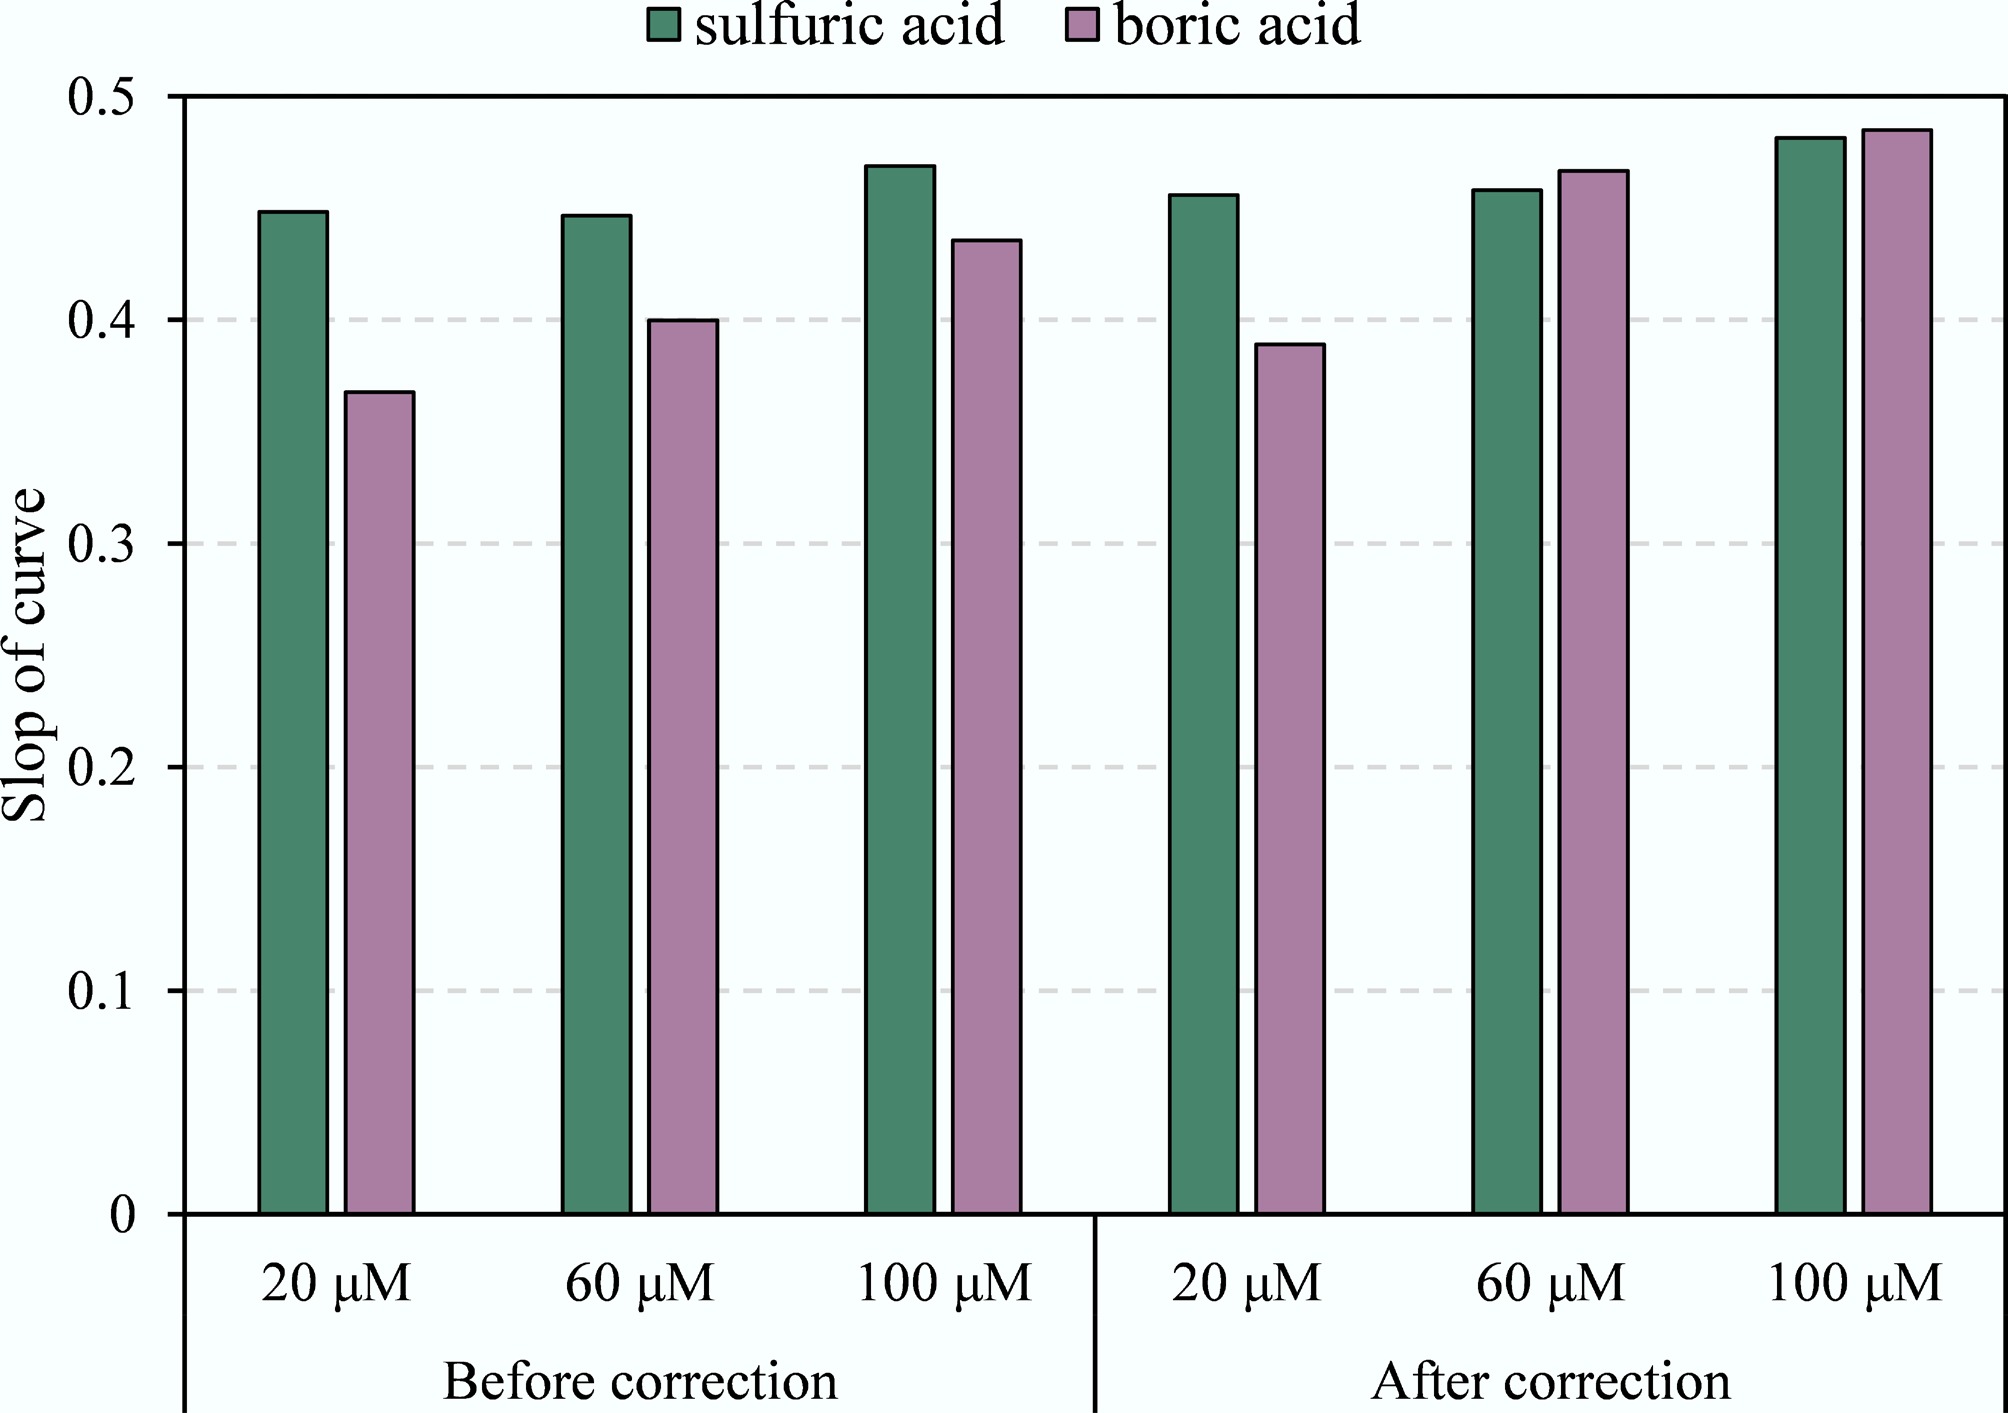
Figure 3.
Slope of conversion curves of δ15N-N2O and δ15N-NH4+ at different NH4+ concentrations in sulfuric acid and boric acid solutions.
-
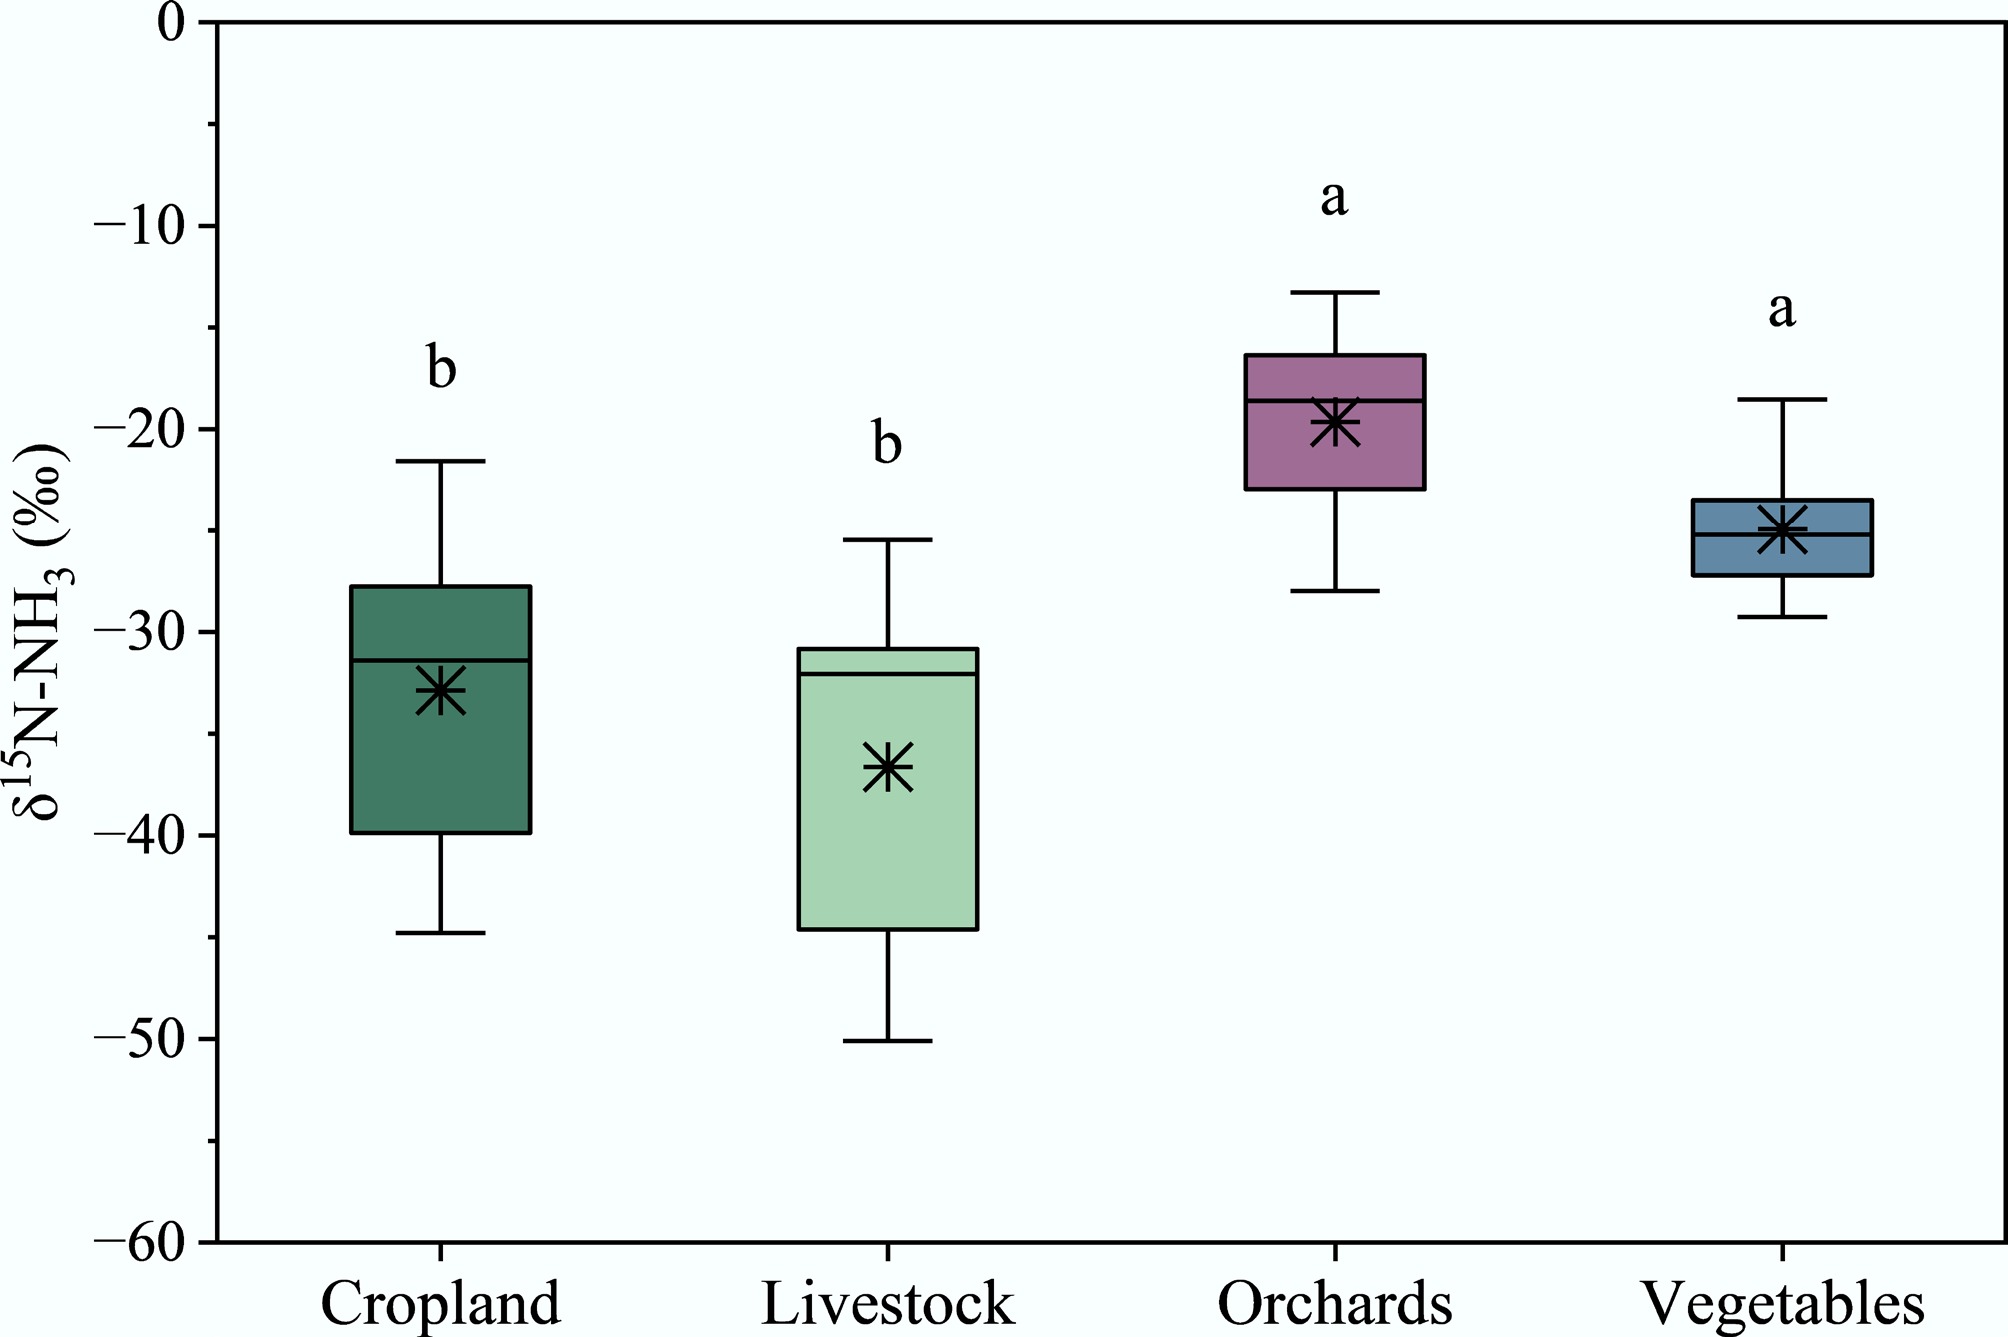
Figure 4.
δ15N values for major NH3 emission sources in sulfuric acid solution. The δ15N values for cropland and livestock were measured in this study, and for orchards and vegetables were measured in the study of Bai et al.[34].
-
Replicate NH4+-N mass before reaction (mg) NH4+-N mass after reaction (mg) NH4+-N mass absorbed by sponge (mg) Recovery rate (%) Sulfuric acid 2.00 0.94 0.99 96.45 2.00 0.95 0.98 96.88 2.00 0.83 1.09 95.98 Mean 2.00 0.91 1.02 96.43 CV% 0.00 7.58 5.96 0.47 Boric acid 2.00 0.94 0.79 86.48 2.00 0.91 0.78 84.74 2.00 0.86 0.75 80.47 Mean 2.00 0.90 0.78 83.90 CV% 0.00 4.51 2.72 3.68 Table 1.
Recovery rate of NH3 emission from (NH4)2SO4 solution
-
Standard solutions NH4+-N mass before reaction (mg) NH4+-N mass after reaction (mg) NH4+-N mass absorbed by sponge (mg) Recovery
rate (%)Sulfuric acid USGS-25 2.00 0.89 1.09 99.09 CV% 0.00 8.64 6.77 0.16 USGS-26 2.00 0.89 0.99 97.72 CV% 0.00 2.83 5.00 1.24 IAEA-N1 2.00 0.83 1.09 96.03 CV% 0.00 4.89 4.05 0.17 Boric acid USGS-25 2.00 0.90 0.97 93.41 CV% 0.00 4.61 0.55 1.93 USGS-26 2.00 0.82 0.94 90.27 CV% 0.00 2.15 2.35 2.20 IAEA-N1 2.00 0.83 0.93 88.45 CV% 0.00 2.02 0.45 0.71 Table 2.
Recovery rate of NH3 emission from different N isotope standard solutions
-
Standard No. Reference value
(‰)δ15N values (‰) Sulfuric acid
(0.1 mol L−1)Boric acid
(2 wt.%)USGS-25 −30.43 ± 0.40 −30.28 ± 0.78 −30.91 ± 0.91 USGS-26 53.75 ± 0.40 53.88 ± 0.13 53.71 ± 0.20 IAEA-N1 0.41 ± 0.20 0.21 ± 0.09 0.27 ± 0.20 Table 3.
The δ15N values of 100 μmol L−1 (NH4)2SO4 reference material in acidic solutions
Figures
(4)
Tables
(3)