


-
Ammonia (NH3) is the most important alkaline gas in the atmospheric environment, and plays a key role in the atmospheric nitrogen (N) cycle[1,2]. However, excess NH3 in the atmosphere can react with acidic substances such as sulfur dioxide (SO2), and nitrogen oxides (NOx) to form ammonium sulfate ((NH4)2SO4), and ammonium nitrate (NH4NO3)[3,4]. These N-containing compounds are important precursors for the formation of fine particulate matter (PM2.5), which significantly affects air quality, solar radiation, and human health[5,6]. It can even be transported long distances through the atmosphere, thereby threatening the environmental security of downwind regions[7]. Therefore, accurate source identification of atmospheric NH3 is essential for emission mitigation and air-quality management.
Natural abundance of nitrogen isotopes (δ15N) provides a promising tool for tracing NH3 sources because different emissions exhibit distinct isotopic signatures, particularly among primary agricultural sources such as fertilizers and livestock waste[8−10]. Therefore, the δ15N-based source apportionment method has been successfully applied to quantify the relative contributions of various sources to atmospheric NH3 and NHx deposition in different regions[9,11,12].
Accurate δ15N determination requires precise methods, particularly during sample collection and measurement. To date, passive collection of atmospheric NH3 typically relies on acidic adsorbents, such as sulfuric acid, boric acid, phosphoric acid, and citric acid[13−16]. These solutions convert gaseous NH3 to dissolved ammonium (NH4+) for subsequent δ15N analysis. However, previous applications generally focused on quantifying NH3 concentrations and did not investigate whether absorption solutions or collection efficiencies may introduce isotopic fractionation or be suitable for different kinds of NH3 source collections, especially those with low concentrations. In fact, the δ15N values of samples are highly sensitive to the properties and absorption efficiency of the collecting solution[9,17]. Strong and weak acidic absorbents differ substantially in their protonation capacity and NH3-NH4+ conversion efficiency, which can directly influence δ15N measurements[18]. For example, strong acids such as sulfuric acid provide abundant H+ and rapidly convert gaseous NH3 into stable (NH4)2SO4, ensuring high trapping efficiency and reducing the possibility of isotope fractionation during collection[19]. In contrast, weak acids such as boric acid supply limited H+, which may lead to incomplete NH3 absorption, lower recovery rates, and a greater likelihood of kinetic isotope effects when the conversion from NH3 to NH4+. Moreover, due to the influence of emission sources and meteorological conditions, NH3 concentrations in the atmosphere vary significantly, which may also affect δ15N determination[20,21]. At present, no systematic comparison has been conducted to evaluate the suitability of commonly used acidic solutions for δ15N determination across different NH3 concentration ranges.
To address this gap, two widely used acidic absorption solutions, sulfuric acid and boric acid, were selected to evaluate their performance in δ15N determination using isotope reference materials (USGS25, USGS26, IAEA-N1) at different concentrations. Additionally, field sampling was conducted to demonstrate the applicability of the optimized method for characterizing δ15N-NH3 signatures from primary agricultural emission sources. The objectives of this study were: (1) to determine the effect of acidic solutions on δ15N measurements of NH3; (2) to compare the accuracy and precision of different acidic solutions for determining δ15N values; and (3) to observe δ15N values of major NH3 emission sources using the optimal acidic solutions.
-
The sponge-trapping method described by Ti et al.[22] was used to determine NH3 emission using sulfuric acid and boric acid solutions. Specifically, the NH3 released from the substrate solution was sequentially absorbed by an acid-treated sponge. A 100 mL solution of (NH4)2SO4 as the NH4+-N substrate was added to a 500 mL incubation bottle. To collect the emitted NH3, a circular sponge (8.5 cm in diameter, 1 cm thick) impregnated with an acid-absorption solution was attached to the neck of the incubation bottle. The appearance of the culture bottle was described by Ti et al.[22]. A hole 1.4 cm in diameter was drilled in the bottle cap, and a rubber tube of the same diameter was inserted into it. The small sponge containing the acid-absorption solution was carefully inserted into the tube to prevent ambient air from affecting the experiment. Then, 5 mL of 0.1 mol L−1 sodium hydroxide (NaOH) solution was injected into the bottle through the circular sponge using a 5 mL syringe. The bottle was immediately sealed with the prepared cap. The emitted NH3 was absorbed by the acid solution within the circular sponge. Using the syringe injection method, rather than removing the sponge to add NaOH directly, ensured that the internal atmosphere of the bottle remained isolated from external air and was not affected by ambient contamination.
After incubation at 25 °C and 95% relative humidity for 24 h, NH3 emission was terminated by adding 0.8 mL of acid solution to neutralize excess NaOH. The circular sponge used for NH3 absorption was extracted with 1 mol L−1 KCl solution at 25 °C and 200 r min−1 for 2.5 h, followed by filtration through Whatman 42 filter paper (2.5 μm). The pH of the filtrate was adjusted to approximately 6, and NH4+-N concentrations in both the extract and the residual solution were determined using a continuous-flow analyzer (Smartchem 200S/N1104238, WESTCO, France). The minimum detection limit for the NH4+-N concentrations was 0.03 mg N L−1.
Moreover, the NH3 recovery rate of this collection system was calculated by measuring the NH4+-N mass in the sponge and in the substrate before and after the reaction. The NH3 recovery rate was determined using Eq. (1):
$ R\;({\text{%}})=\dfrac{{M}_{1}+{M}_{2}}{{M}_{0}}\times 100 $ (1) where, M0 indicates the NH4+-N mass (mg N) in the standard solution before reaction. M1 represents the NH4+-N mass (mg N) measured in the filtrate after sponge extraction, and M2 means the NH4+-N mass (mg N) in the standard solution after reaction.
Preparation of NH3 absorbent solution
-
Standard solutions of 20, 60, and 100 mmol L−1 NH4+N were prepared using (NH4)2SO4 isotope reference materials (USG-S25, USG-S26, IAEA-N1) to simulate the process that NH3 is converted into NH4+. A volume of 20 μL of standard solutions was sequentially added to 20 mL of sulfuric acid absorption solution (0.1 mol L−1), and boric acid absorption solution (2 wt.%), respectively. The mixed solutions were reacted for 24 h. Then the solutions absorbed by sulfuric acid (0.1 mol L−1) and boric acid (2 wt.%) were adjusted to pH 6.0 using boiled NaOH solution. After dissolution in an equal volume of ultrapure water, the pH was adjusted to 6.0 with a boiled NaOH solution. The (NH4)2SO4 standard solutions were obtained at concentrations of 20, 60, and 100 μmol L−1 (calculated as N).
Before the formal experiments, standard solutions were prepared using (NH4)2SO4 and N isotope reference materials USGS-25, USGS-26, and IAEA-N-1 at a concentration of 20 mg L−1. These solutions were used to verify the systematic recovery rate of NH3 emission measured in this study, ensuring the accuracy of the experimental data. Each treatment included three parallel replicates.
Natural abundance of isotopes analysis
-
The δ15N values in the samples were analyzed using the chemical analysis method described by Liu et al.[23]. The N-isotopic composition of all samples was analyzed using an isotope mass spectrometer (Isoprime 100, Isoprime, UK). Briefly, NH4+-N in the samples was oxidized to NO2−, which was then converted to N2O by NH2OH under strongly acidic conditions. The natural variation in stable N isotopes is generally expressed using the δ15N value of the heavy isotope. Internationally, N2 is used as the standard, with its δ15N defined as 0‰. Isotope ratio values are reported in parts per thousand relative to atmospheric N2, as shown in Eq. (2):
$ {{\delta}}^{{15}}{\mathrm{N}}_{\text{sample}}\;({\text{‰}})=\dfrac{{\left({}_{}^{15}\mathrm{N}{/}^{14}\mathrm{N}\right)}_{\text{sample}}-{\left({}_{}^{15}\mathrm{N}{/}^{14}\mathrm{N}\right)}_{\text{standard}}}{{\left({}_{}^{15}\mathrm{N}{/}^{14}\mathrm{N}\right)}_{\text{standard}}}\times{1,000} $ (2) where, δ15Nsample represents the δ15N value of N2O produced from the sample. (15N/14N)sample and (15N/14N)standard represent the abundance ratios of15N to14N in the sample and in the standard, respectively, and (15N/14N)standard was (3,676 ± 8.1) × 10−6.
Blank correction of mass spectrometry results is performed using the mass balance equation, as shown in Eq. (3):
$ {{\delta}}^{\text{15}}{\mathrm{N}}_{\mathrm{blank}\;\text{corr}}=\dfrac{{{\delta}}^{\text{15}}{\mathrm{N}}_{\text{sample}}\times {A}_{\text{sample}}-{\delta}^{\text{15}}{\mathrm{N}}_{\text{blank}}\times {A}_{\text{blank}}}{{A}_{\text{sample}}-{A}_{\text{blank}}} $ (3) where, δ15Nblank corr denotes the δ15N ratio of N2O in the sample after blank correction, δ15Nsample represents the δ15N ratio of the sample measured by mass spectrometry, and δ15Nblank indicates the δ15N ratio of the blank. Asample means the peak area of the sample, and Ablank means the peak area of the blank.
The two N atoms in N2O molecules produced through chemical conversion originate from NO2− and NH2OH, respectively. When NH2OH reagents are from the same batch, δ15N-NH2OH remains constant. Standard curves were established using isotope reference materials of different isotopic abundances to calibrate the system. The δ15N-N2O of the generated N2O can then be used to back-calculate the δ15N-NH4+ of the substrate[23,24].
Statistical analysis
-
Differences in δ15N values were examined using the one-way analysis of variance, and Duncan's multiple range test. All statistical analyses were performed with SPSS version. 22.0 (IBM Corp., Chicago, IL, USA). The results were drawn using OriginPro 2025b (OriginLab Corporation, Northampton, MA, USA). A p-value of < 0.05 was considered statistically significant throughout the study.
-
Experiments were conducted using (NH4)2SO4 and N isotope reference materials (USGS-25, USGS-26, IAEA-N1) as reaction substrates to determine the systematic recovery rate of NH3 in the experimental apparatus. The initial NH4+-N mass of the emission substrate was 2.00 mg. For the (NH4)2SO4 substrate, the NH4+-N mass values from the three replicates were 0.94, 0.95, and 0.83 mg after the reaction, with an average of 0.91 mg, and a coefficient of variation (CV) of 7.58% (Table 1). The NH4+-N mass measured in the filtrates extracted from the sponges containing sulfuric acid absorption solution was 0.99, 0.98, and 1.09 mg, with an average of 1.02 mg and a CV of 5.96%. The slightly higher CV compared with the ideal threshold of 5% was mainly due to minor analytical variation in the third replicate, which showed a lower NH4+-N mass in the reacted (NH4)2SO4 solution, and a higher content in the sponge extract. This deviation was attributed to minor systematic errors in continuous-flow analysis but had little influence on overall recovery efficiency. When the sponge containing the boric acid absorption solution was used, the NH4+-N mass from the three replicates was 0.94, 0.91, and 0.86 mg after the reaction, with an average of 0.90 mg and a coefficient of variation (CV) of 4.51%. The NH4+-N mass measured in the filtrates extracted from the circular sponges was 0.79, 0.78, and 0.75 mg, with an average of 0.78 mg and a CV of 2.72%. The NH4+-N masses in the sponge extract were lower for the boric acid absorption solution than for the sulfuric acid solution.
Table 1. Recovery rate of NH3 emission from (NH4)2SO4 solution
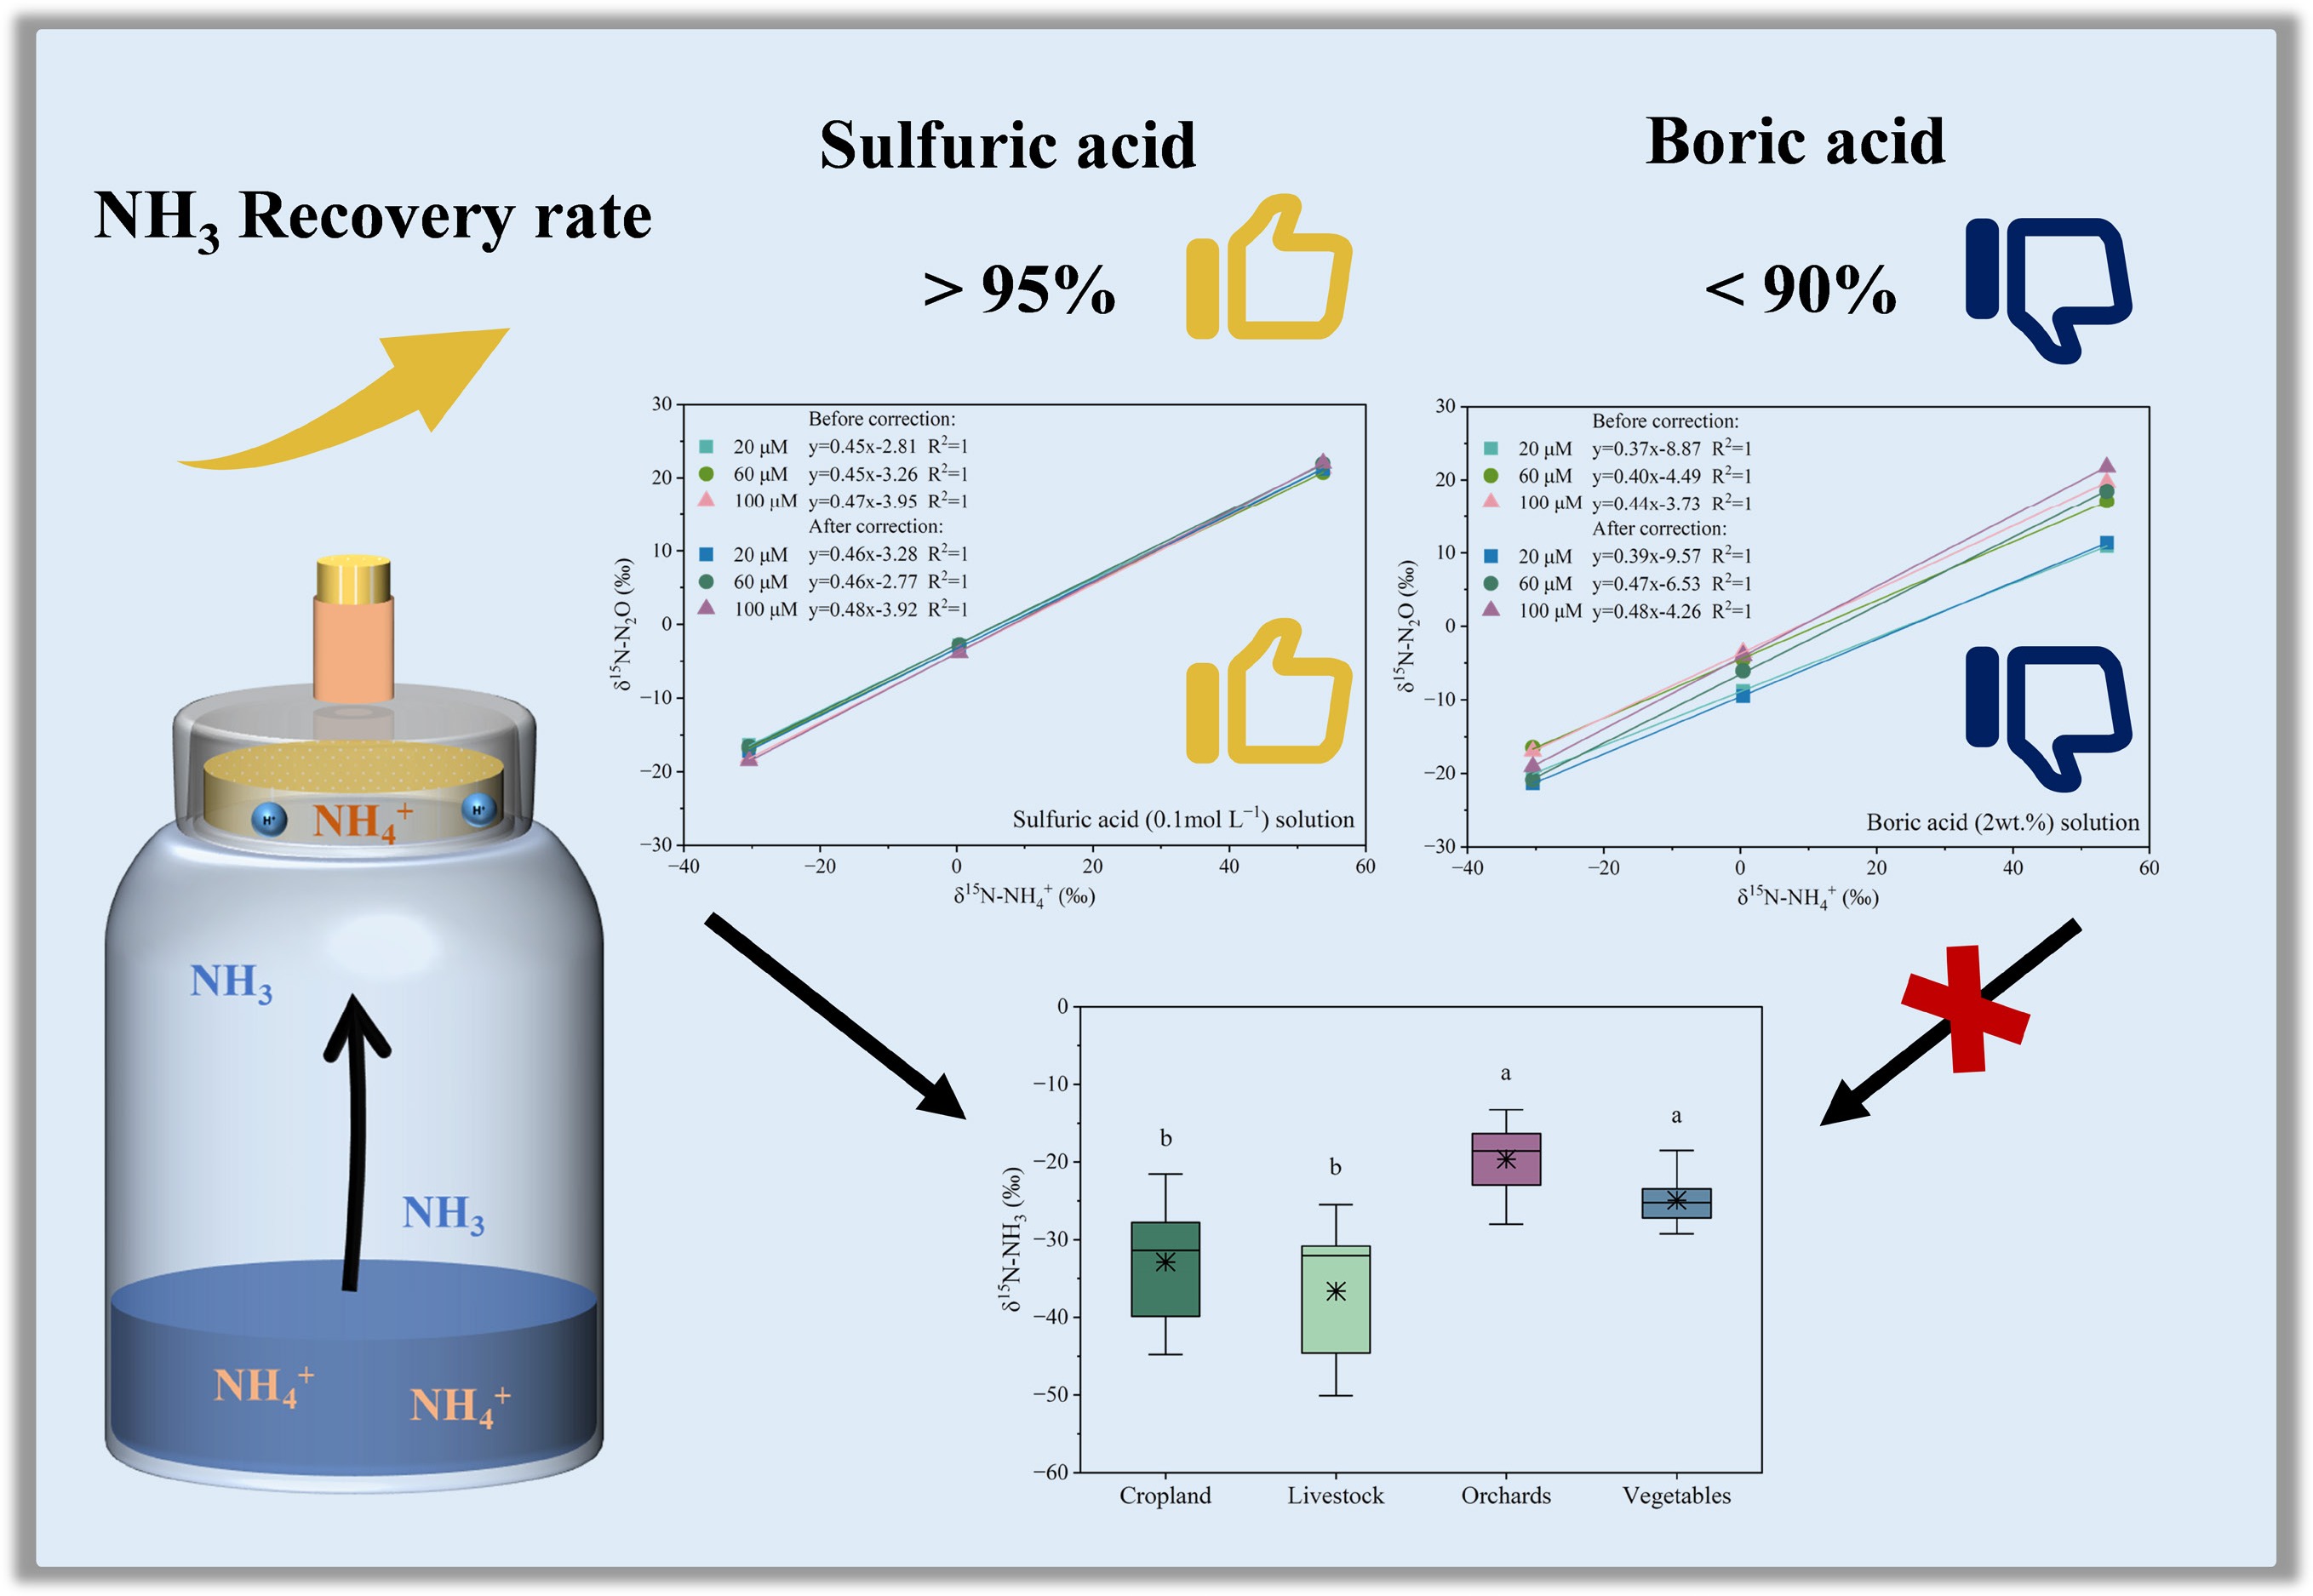
Replicate NH4+-N mass before reaction (mg) NH4+-N mass after reaction (mg) NH4+-N mass absorbed by sponge (mg) Recovery rate (%) Sulfuric acid 2.00 0.94 0.99 96.45 2.00 0.95 0.98 96.88 2.00 0.83 1.09 95.98 Mean 2.00 0.91 1.02 96.43 CV% 0.00 7.58 5.96 0.47 Boric acid 2.00 0.94 0.79 86.48 2.00 0.91 0.78 84.74 2.00 0.86 0.75 80.47 Mean 2.00 0.90 0.78 83.90 CV% 0.00 4.51 2.72 3.68 When NH3 was collected using the sulfuric acid absorption method, the recovery rate of NH4+-N ranged from 95.98% to 96.88% (mean = 96.43%, CV = 0.47%), while the recovery rate of NH4+-N ranged from 80.47% to 86.48% (mean = 83.90%, CV = 3.68%) for the boric acid absorption method. Results indicated that the sulfuric acid absorption method had high accuracy and reproducibility of the experimental system for NH3 emission measurements.
For isotopic measurements, the influence of recovery rate on δ15N accuracy mainly depends on isotope fractionation (ε) during the isolation process. When the system recovery rate is greater than 95%, the resulting deviation in δ15N (approximately 3‰ under extreme conditions, ε = 20‰) is relatively small and exerts minimal influence on isotope precision[17]. Therefore, using sulfuric acid absorption to capture NH3 can effectively preserve δ15N values, whereas boric acid is less effective at maintaining isotopic integrity. The NH3 collection apparatus and determination method developed in this study achieved higher recovery rates than those reported by Camargo Valero & Mara[25] and Zhou et al.[26]. For example, Zhou et al.[26] conducted laboratory experiments using sulfuric acid and boric acid as absorption solutions to evaluate NH3 emission recovery rates under three pH gradients. They indicated that the NH3 recovery rate for sulfuric acid (89.7%) was higher than that for boric acid (69.8%).
As shown in Table 2, when standard solutions of the N isotope reference materials USGS-25, USGS-26, and IAEA-N1 were used as volatilization substrates, the collection system exhibited consistently high NH3 recovery rates. For all three standards, the initial NH4+-N mass was set at 2.00 mg. After reaction, the average residual NH4+-N masses for USGS-25, USGS-26, and IAEA-N1 were 0.89 mg (CV = 8.64%), 0.89 mg (CV = 2.83%), and 0.83 mg (CV = 4.89%), respectively. The average NH4+-N masses absorbed by the circular sponge using the sulfuric acid solution were 1.09, 0.99, and 1.09 mg for USGS-25, USGS-26, and IAEA-N1, with CV values of 6.77%, 5.00%, and 4.05%, respectively. The average recovery rates for NH3 volatilization from USGS-25, USGS-26, and IAEA-N1 were 99.09%, 97.72%, and 96.03%, respectively, with CV values of 0.16%, 1.24%, and 0.17%, respectively. When the boric acid was used as an NH3 absorption solution, the average residual NH4+-N masses after reaction for USGS-25, USGS-26, and IAEA-N1 were 0.90 mg (CV = 4.61%), 0.82 mg (CV = 2.15%), and 0.83 mg (CV = 2.02%), respectively. The average NH4+-N masses absorbed by the circular sponge were 0.97, 0.94, and 0.93 mg for USGS-25, USGS-26, and IAEA-N1, with CV values of 0.55%, 2.35%, and 0.45%, respectively. The average recovery rates for NH3 volatilization from USGS-25, USGS-26, and IAEA-N1 were 93.41%, 90.27%, and 88.45%, respectively, with CV values of 1.93%, 2.20%, and 0.71%, respectively.
Table 2. Recovery rate of NH3 emission from different N isotope standard solutions
Standard solutions NH4+-N mass before reaction (mg) NH4+-N mass after reaction (mg) NH4+-N mass absorbed by sponge (mg) Recovery
rate (%)Sulfuric acid USGS-25 2.00 0.89 1.09 99.09 CV% 0.00 8.64 6.77 0.16 USGS-26 2.00 0.89 0.99 97.72 CV% 0.00 2.83 5.00 1.24 IAEA-N1 2.00 0.83 1.09 96.03 CV% 0.00 4.89 4.05 0.17 Boric acid USGS-25 2.00 0.90 0.97 93.41 CV% 0.00 4.61 0.55 1.93 USGS-26 2.00 0.82 0.94 90.27 CV% 0.00 2.15 2.35 2.20 IAEA-N1 2.00 0.83 0.93 88.45 CV% 0.00 2.02 0.45 0.71 These results demonstrate that the system maintained stable, high recovery rates across all N-isotope reference solutions, comparable to those obtained with (NH4)2SO4. The sulfuric acid absorption method also showed higher accuracy and reproducibility in the experimental system for NH3 emission measurements than the boric acid solution method. The low CVs further confirm the high precision and reliability of the collection system for measuring NH3 volatilization and its natural isotopic abundance.
Effect of different acid solutions on δ15N measurement
-
The δ15N-NH4+ vs δ15N-N2O conversion curves were established for different NH4+ concentrations absorbed by various acidic solutions. As shown in Fig. 1, δ15N-NH4+ and δ15N-N2O exhibit excellent linear relationships (R2 = 1) for sulfuric acid absorption solution across different NH4+ concentrations (20, 60, and 100 μmol L−1). Mass balance equations were applied to correct δ15N-N2O measurements derived from the conversion of different acidic absorption solutions and different concentrations of (NH4)2SO4 solutions. Before correction, the slope of the δ15N-NH4+ vs δ15N-N2O conversion curves for sulfuric acid solution was 0.45 at 20 μmol L−1, 0.45 at 60 μmol L−1, and 0.47 at 100 μmol L−1, respectively. After correction, the slope of the δ15N-NH4+ versus δ15N-N2O conversion curves was 0.46 at 20 μmol L−1, 0.46 at 60 μmol L−1, and 0.48 at 100 μmol L−1, respectively. The slight increase in the corrected slope indicates that after correction, the slopes of the δ15N-NH4+ vs δ15N-N2O conversion curves approached the theoretical value of 0.5, improving the accuracy of isotope conversion. Besides, the minor variation in slope before and after correction suggests that NH4+ concentration has a weak influence on the isotope conversion relationship, so that sulfuric acid absorption solution exhibits good stability and consistency.
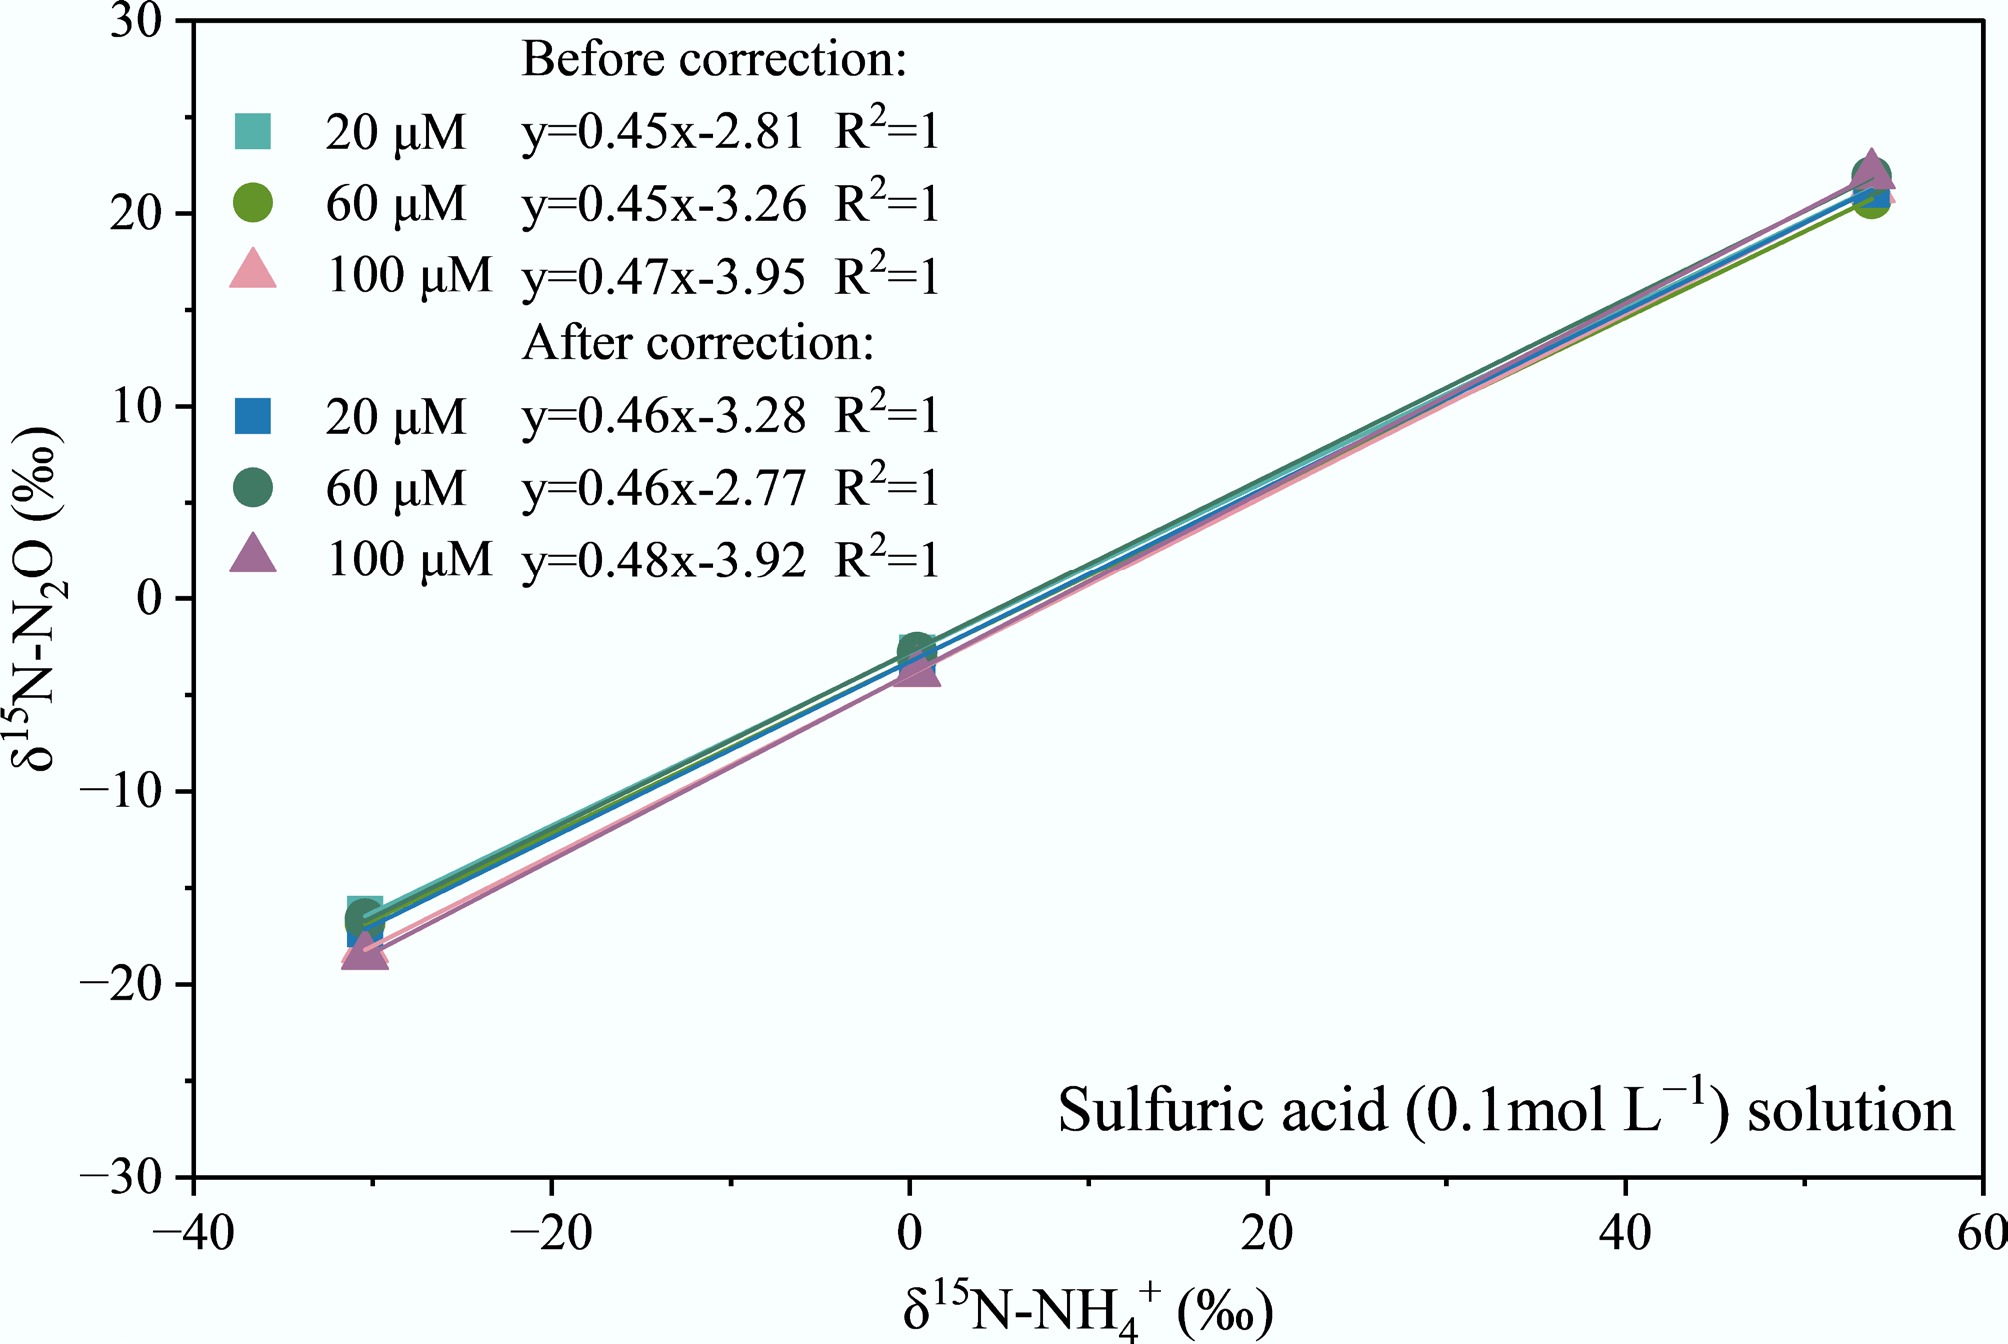
Figure 1.
Conversion curves of δ15N-N2O and δ15N-NH4+ at different NH4+ concentrations in sulfuric acid (0.1 mol L−1) solution.
As shown in Fig. 2, δ15N-NH4+ and δ15N-N2O exhibit distinct linear relationships (R2 = 1) for boric acid absorption solution across different NH4+ concentrations (20, 60, and 100 μmol L−1). Before correction, the slope of the δ15N-NH4+ vs δ15N-N2O conversion curves for boric acid solution was 0.37 at 20 μmol L−1, 0.40 at 60 μmol L−1, and 0.44 at 100 μmol L−1, respectively. After correction, the slope of the δ15N-NH4+ vs δ15N-N2O conversion curves was 0.39 at 20 μmol L−1, 0.47 at 60 μmol L−1, and 0.48 at 100 μmol L−1, respectively. The significant increase in the corrected slope indicates that the slopes of the δ15N-NH4+ vs δ15N-N2O conversion curves approached the theoretical value of 0.5 after correction, especially at high concentrations of 60 and 100 μmol L−1. However, the slope for the low-concentration solution (20 μmol L−1) remains low, indicating that the isotope conversion efficiency of the boric acid absorption system is relatively weak at low NH4+ concentrations.
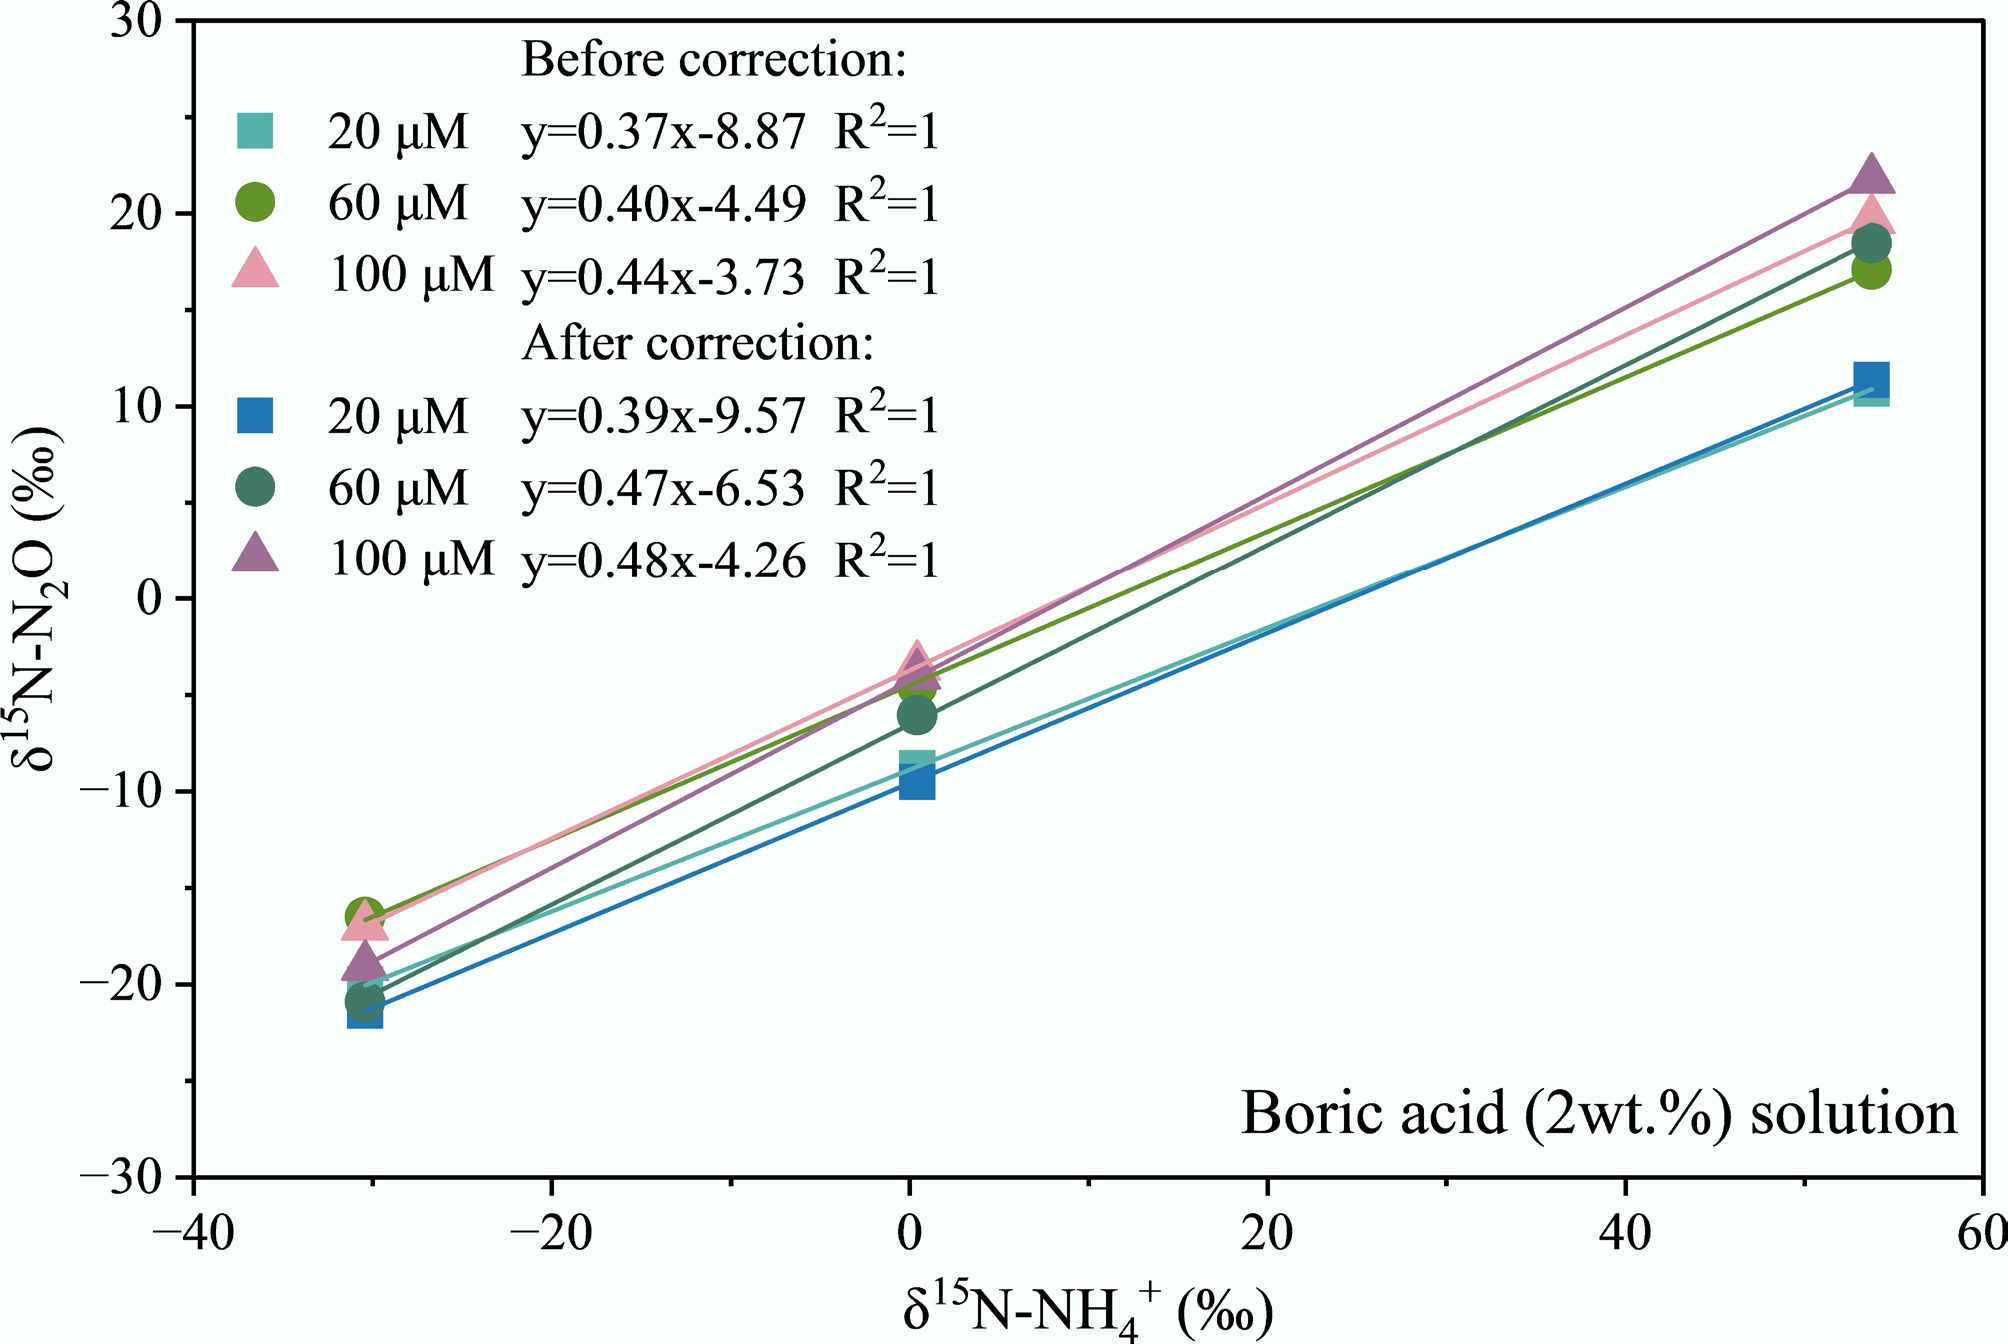
Figure 2.
Conversion curves of δ15N-N2O and δ15N-NH4+ at different NH4+ concentrations in boric acid (2 wt.%) solution.
In this study, the NH4+-N concentration influenced the relationship between δ15N-NH4+ and δ15N-N2O. When the concentrations of (NH4)2SO4 standard solutions in acidic absorbents ranged from 20 to 100 μmol L−1, the slopes of the δ15N-NH4+ vs δ15N-N2O conversion curves increased with concentration, both before and after correction, gradually approaching the theoretical value of 0.5 (Fig. 3). Thus, the NH4+ concentration significantly affects the δ15N value of volatilized NH3. Similarly, previous studies observed that δ15N-NH4+ generally decreases slightly with increasing NH4+-N concentration, attributed to rapid NH4+-N accumulation and15N depletion[27−29].
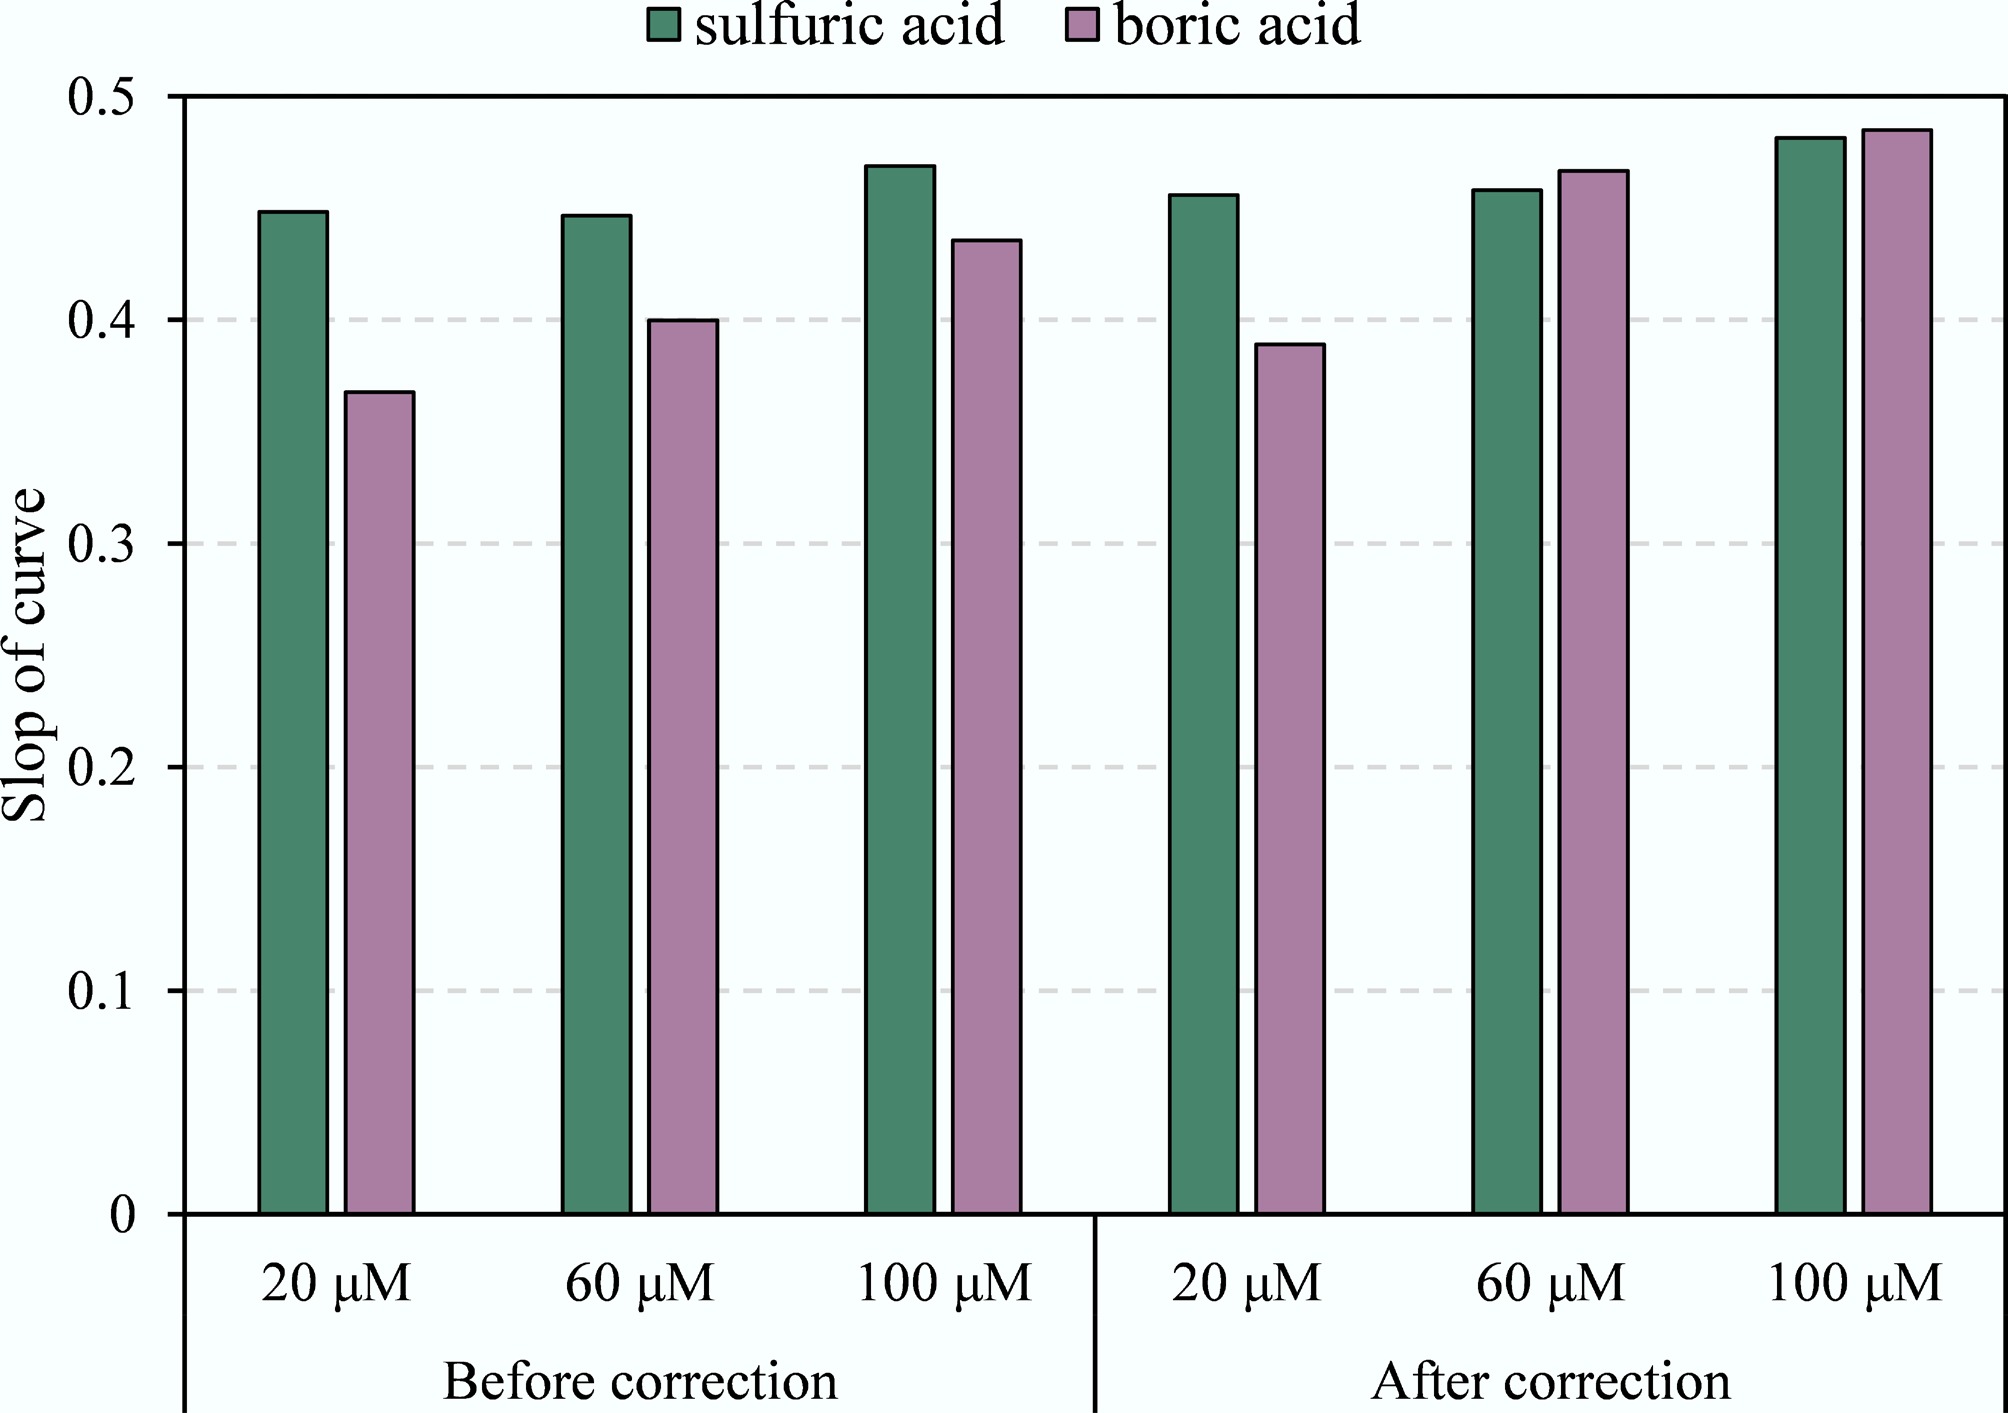
Figure 3.
Slope of conversion curves of δ15N-N2O and δ15N-NH4+ at different NH4+ concentrations in sulfuric acid and boric acid solutions.
Numerous studies have investigated the use of acidic solutions for atmospheric NH3 absorption, and δ15N values from different emission sources have also been widely examined[15,22]. However, few studies have addressed the applicability of acidic solutions for δ15N measurement across different NH4+-N concentrations. In this study, the suitability of δ15N measurements of NH3 absorbed by various acidic solutions was analyzed. When the NH4+-N concentration in acidic solutions is identical, the slope of the relationship curve between δ15N-NH4+ and δ15N-N2O before calibration is closest to the theoretical value of 0.5 for sulfuric acid absorption solution (Fig. 3). Compared to boric acid, sulfuric acid remains suitable for detecting δ15N-NH4+ even at low NH4+-N concentrations in samples. The conversion curve of δ15N-NH4+ in the sulfuric acid solution exhibited minimal influence from sample NH4+-N concentration before and after blank correction. Previous studies indicated that low concentrations of NH4+-N increased the proportion of blank contributions, leading to either underestimated or overestimated δ15N values and resulting in poor reproducibility[30]. This explains the fact that when higher concentration standards are used in the conversion test, the resulting slope approaches the theoretical value of 0.5 more closely. The results indicated that sulfuric acid was more suitable for δ15N-NH4+ determination when the NH4+-N concentration range in the sample is wide.
During isotope determination, systematic deviations arise from factors such as the absorber, conversion chemistry steps, sample quantity, reagent purity, and blank contributions[9]. Therefore, the slope of the relationship curve between δ15N-NH4+ and δ15N-N2O was closer to 0.5 after black correction. Due to the simplicity of preparing sulfuric acid absorption solutions and the lower impurity content in sulfuric acid solutions compared with boric acid and citric acid solids, the impact on δ15N-NH4+ mass spectrometry results was minimized[23]. Studies have also shown that acidic substances can influence NH3 volatilization by regulating pH, with increased pH elevating NH3 volatilization potential[31]. In acidic conditions, NH4+ remains predominantly in its ionic form, whereas in alkaline conditions, most NH4+ forms volatile NH3[32]. A previous study also observed that higher pH, along with a higher N fractionation factor, occurred during the NH3 volatilization process[33]. Sulfuric acid, being a strong inorganic acid, may exhibit greater NH4+ fixation capacity than weaker inorganic acids like boric acid or organic acids like citric acid during absorption and pH adjustment to 6.0[18]. This reduces the conversion of NH4+ to NH3 and minimizes isotopic fractionation of both NH4+ and NH3. Consequently, 0.1 mol L−1 sulfuric acid yields the most reliable results in δ15N-NH4+ measurements.
Using the 100 μmol L−1 (NH4)2SO4 standard solutions as an example, the accuracy and precision of δ15N measurements obtained with different acidic solutions were evaluated, and the results are presented in Table 3. For the USGS-25 and USGS-26 standards, the measured δ15N-NH4+ values using sulfuric acid and boric acid were all in close agreement with their certified reference values of −30.43‰ and 53.75‰, respectively. The deviations between measured and reference values were within ±0.5‰, indicating stable analytical performance. For the IAEA-N1, which has a relatively low δ15N-NH4+ (reference value 0.41‰). The δ15N-NH4+ values obtained with sulfuric acid and boric acid were 0.21‰ and 0.27‰, respectively. Although these results showed slightly greater relative variation, they remained within the reference uncertainty range and met analytical requirements.
Table 3. The δ15N values of 100 μmol L−1 (NH4)2SO4 reference material in acidic solutions
Standard No. Reference value
(‰)δ15N values (‰) Sulfuric acid
(0.1 mol L−1)Boric acid
(2 wt.%)USGS-25 −30.43 ± 0.40 −30.28 ± 0.78 −30.91 ± 0.91 USGS-26 53.75 ± 0.40 53.88 ± 0.13 53.71 ± 0.20 IAEA-N1 0.41 ± 0.20 0.21 ± 0.09 0.27 ± 0.20 Overall, the recovery rate of the boric acid solution was relatively low, which could lead to deviations in δ15N values, particularly at low NH4+ concentrations. In contrast, 0.1 mol L−1 sulfuric acid provided consistent results across all standards. Considering its simple preparation and stability, sulfuric acid is recommended as the optimal absorbent for δ15N determination, especially for samples with low or fluctuating NH4+ concentrations.
Case study of measurements for δ15N values of major NH3 emission sources
-
Since the sulfuric acid absorption solution provided excellent results for δ15N determination of the two acid absorption solutions, it was used to conduct NH3 absorption and δ15N measurement of primary NH3 emission sources, including cropland, livestock, orchards, and vegetables. The δ15N-NH3 values for orchard and vegetable sources were obtained from Bai et al.[34], whose sampling setup and acidic absorption solution were identical to those in this study, thereby enabling a direct and valid comparison. As shown in Fig. 4, the mean δ15N values of NH3 emissions were −32.87‰ ± 7.41‰ (range: −44.79‰ to −21.56‰) for cropland, −36.64‰ ± 9.19‰ (range: −50.09‰ to −25.47‰) for livestock, −19.63‰ ± 5.09‰ (range: −27.98‰ to −13.29‰) for orchards, and −24.95‰ ± 3.29‰ (range: −29.26‰ to −18.52‰) for vegetables. The δ15N-NH3 values for cropland and livestock were significantly lower than those for orchards and vegetables. Our obtained δ15N values were within the range reported for agricultural sources in previous studies[24,35,36], which were obtained using passive adsorption samplers, supporting the effectiveness of the sampling results. However, the δ15N values obtained with the passive sampler in this study were significantly lower than those measured with active samplers, due to isotope fractionation effects between different samplers[9]. For example, the δ15N values for livestock measured using active sampling methods[15] were significantly higher than those obtained using passive samplers[24,35,36]. Previous studies have shown that δ15N measurements from active and passive NH3 samplers can differ by roughly 15‰, reflecting sampler-induced fractionation associated with diffusion limitations and incomplete absorption[9].
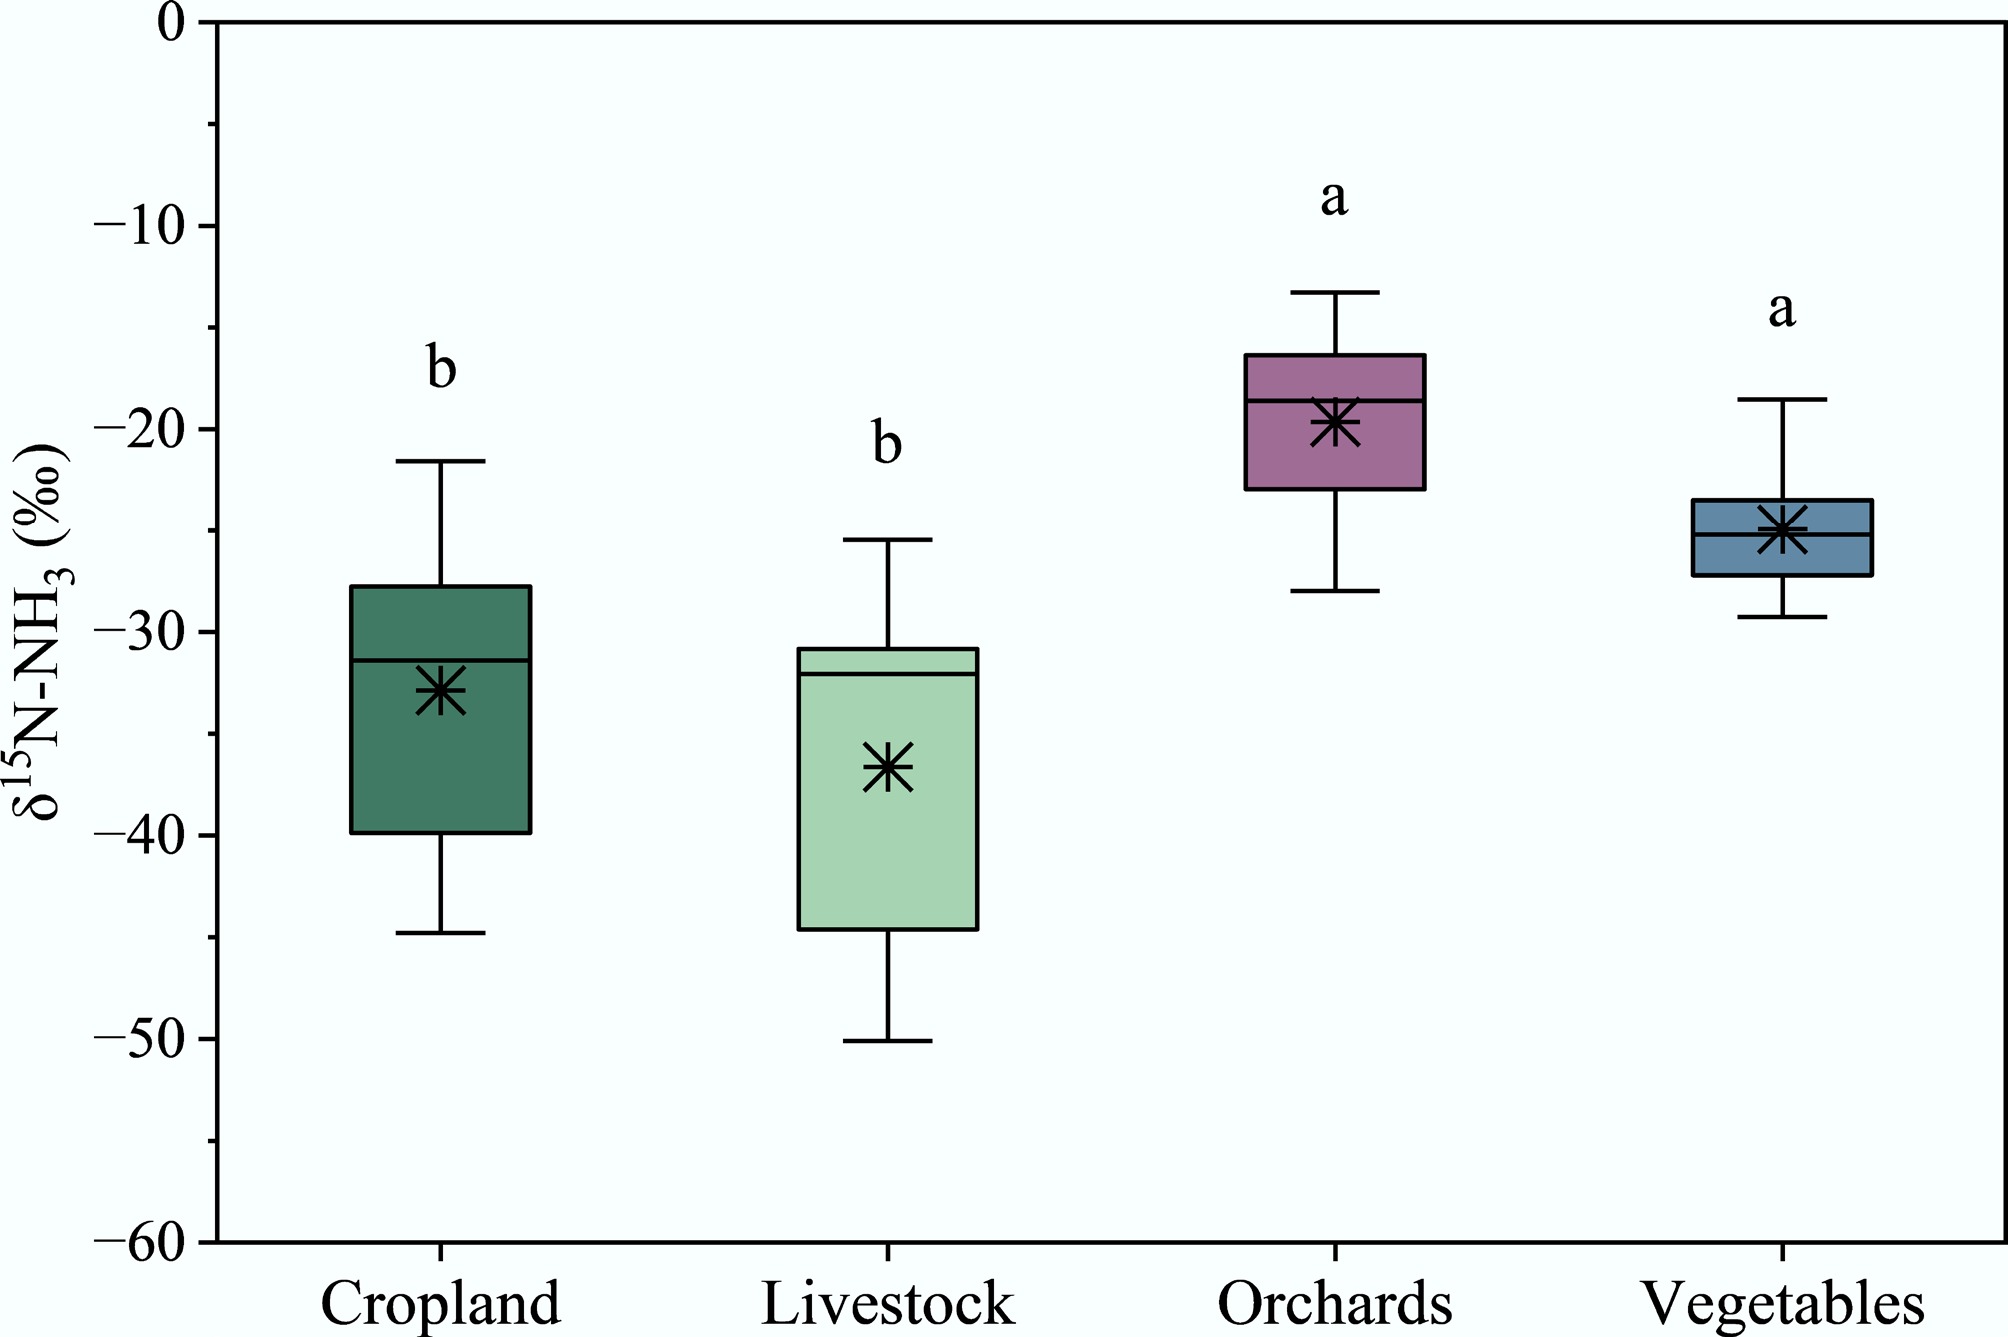
Figure 4.
δ15N values for major NH3 emission sources in sulfuric acid solution. The δ15N values for cropland and livestock were measured in this study, and for orchards and vegetables were measured in the study of Bai et al.[34].
NH3 emission is affected by several factors, including fertilizer application rates, NH4+ substrate concentrations, and temperature[37,38]. These factors directly or indirectly cause significant variations in the δ15N values of emitted NH3[22,39]. Soil NH4+ and NH3 volatilization rates exhibited a negative correlation with δ15N values[40]. In general, molecules containing14N react faster than those containing 15N because the energy required to break or form chemical bonds involving 15N is greater than that for bonds involving 14N[41]. However, partial overlap in δ15N values among different emission sources may be influenced by variations in geography, season, and temperature[42]. Future research requires additional high-temporal-resolution field observation experiments to supplement δ15N values.
Therefore, the absorption and processing method for sulfuric acid solutions is highly suitable for determining the natural isotopic abundance of atmospheric NH3 and its major emission sources in the field, which contributes to the source apportionment of atmospheric NH3. In addition, NH3 emitted from different emission sources exhibit unique δ15N values, which have been successfully applied to explore N sources, transformation processes, and ultimate destinations under various scenarios[43−45]. δ15N-NH3 values serve as a crucial tool for clarifying atmospheric NH3 origins and provide precise data support for scientific and efficient fertilization in agricultural fields, as well as atmospheric haze management[46−48].
-
This study conducted a systematic investigation of recovery performance, isotope measurement stability, and field observations of NH3 using sulfuric acid and boric acid absorption solutions by the sponge absorption method. Results indicated that sulfuric acid absorption solution achieved a significantly higher overall NH3 recovery rate than the boric acid absorption solution, and exhibited excellent systematic stability for δ15N-NH4+ measurement when the NH4+-N concentration range in the sample is from 20 to 100 μmol L−1. Therefore, sulfuric acid is identified as the optimal absorption for accurate δ15N analysis across a wide range of NH3 concentrations. This study also successfully applied the method to determine δ15N-NH3 values for cropland, livestock, orchards, and vegetable emission sources. Therefore, the absorption method for sulfuric acid solutions is highly suitable for determining NH3 emissions and δ15N-NH3 values of major emission sources in the field, thereby contributing to the source apportionment of atmospheric NH3.
-
Not applicable.
-
The authors confirm their contributions to the paper as follows: Lingyun Peng: data curation, formal analysis, writing − original draft preparation, writing − review and editing; Chaopu Ti: conceptualization, methodology, writing − review and editing; Xiao Bai: data curation; Miao Li: data curation; Xi Wang: data curation; Bin Yin: conceptualization. All authors reviewed the results and approved the final version of the manuscript.
-
The datasets used or analyzed during the current study are available from the corresponding author on reasonable requests.
-
This work was supported by the National Natural Science Foundation of China (Grant No. 42177313), and the National Key Research and Development Program of China (Grant No. 2023YFC3707402).
-
The authors declare that they have no known competing financial interests or personal relationships that could have appeared to influence the work reported in this paper.
-
Full list of author information is available at the end of the article.
- Copyright: © 2026 by the author(s). Published by Maximum Academic Press, Fayetteville, GA. This article is an open access article distributed under Creative Commons Attribution License (CC BY 4.0), visit https://creativecommons.org/licenses/by/4.0/.
-
About this article
Cite this article
Peng L, Ti C, Bai X, Li M, Wang X, et al. 2026. The effect of acidic solutions on the determination of the natural abundance of nitrogen isotopes in ammonia. Nitrogen Cycling 2: e005 doi: 10.48130/nc-0025-0017 

The effect of acidic solutions on the determination of the natural abundance of nitrogen isotopes in ammonia
- Received: 05 November 2025
- Revised: 04 December 2025
- Accepted: 18 December 2025
- Published online: 16 January 2026
Abstract: Atmospheric ammonia (NH3) contributes significantly to environmental pollution and human health once it reacts with atmospheric acidic species and deposits on soil and water surfaces. The natural abundance of nitrogen isotope (δ15N) can be used to trace the source of NH3 for emission control. NH3 is generally passively absorbed by acidic solutions, which can convert NH3 to ammonium (NH4+). However, it remains unclear whether the passive collection process and the acidic solutions may influence recovery at different NH4+ levels and introduce isotope fractionation. Here, the recovery rate of NH3 was evaluated using two acidic solutions, sulfuric, and boric acid. Then, these two solutions were used to passively absorb isotope reference materials to assess their effects on δ15N measurements. Results showed that NH3 absorbed by sulfuric acid solution achieved an average recovery of 95%, indicating that its influence on δ15N values could be ignored. In contrast, the recovery rate of the boric acid solution was below 90%, which may induce isotope fractionation during absorption. Although both solutions provided acceptable accuracy for δ15N determination, sulfuric acid was more suitable than boric acid, even at NH4+ concentrations as low as 20 μmol L−1. Finally, this method was adopted to observe the δ15N values of NH3 emitted from croplands, livestock, orchards, and vegetables, and significant differences were found among these four sources.
-
Key words:
- Acidic solution /
- NH3 absorption /
- Natural isotope abundance in ammonia /
- Precision /
- Applicability