-
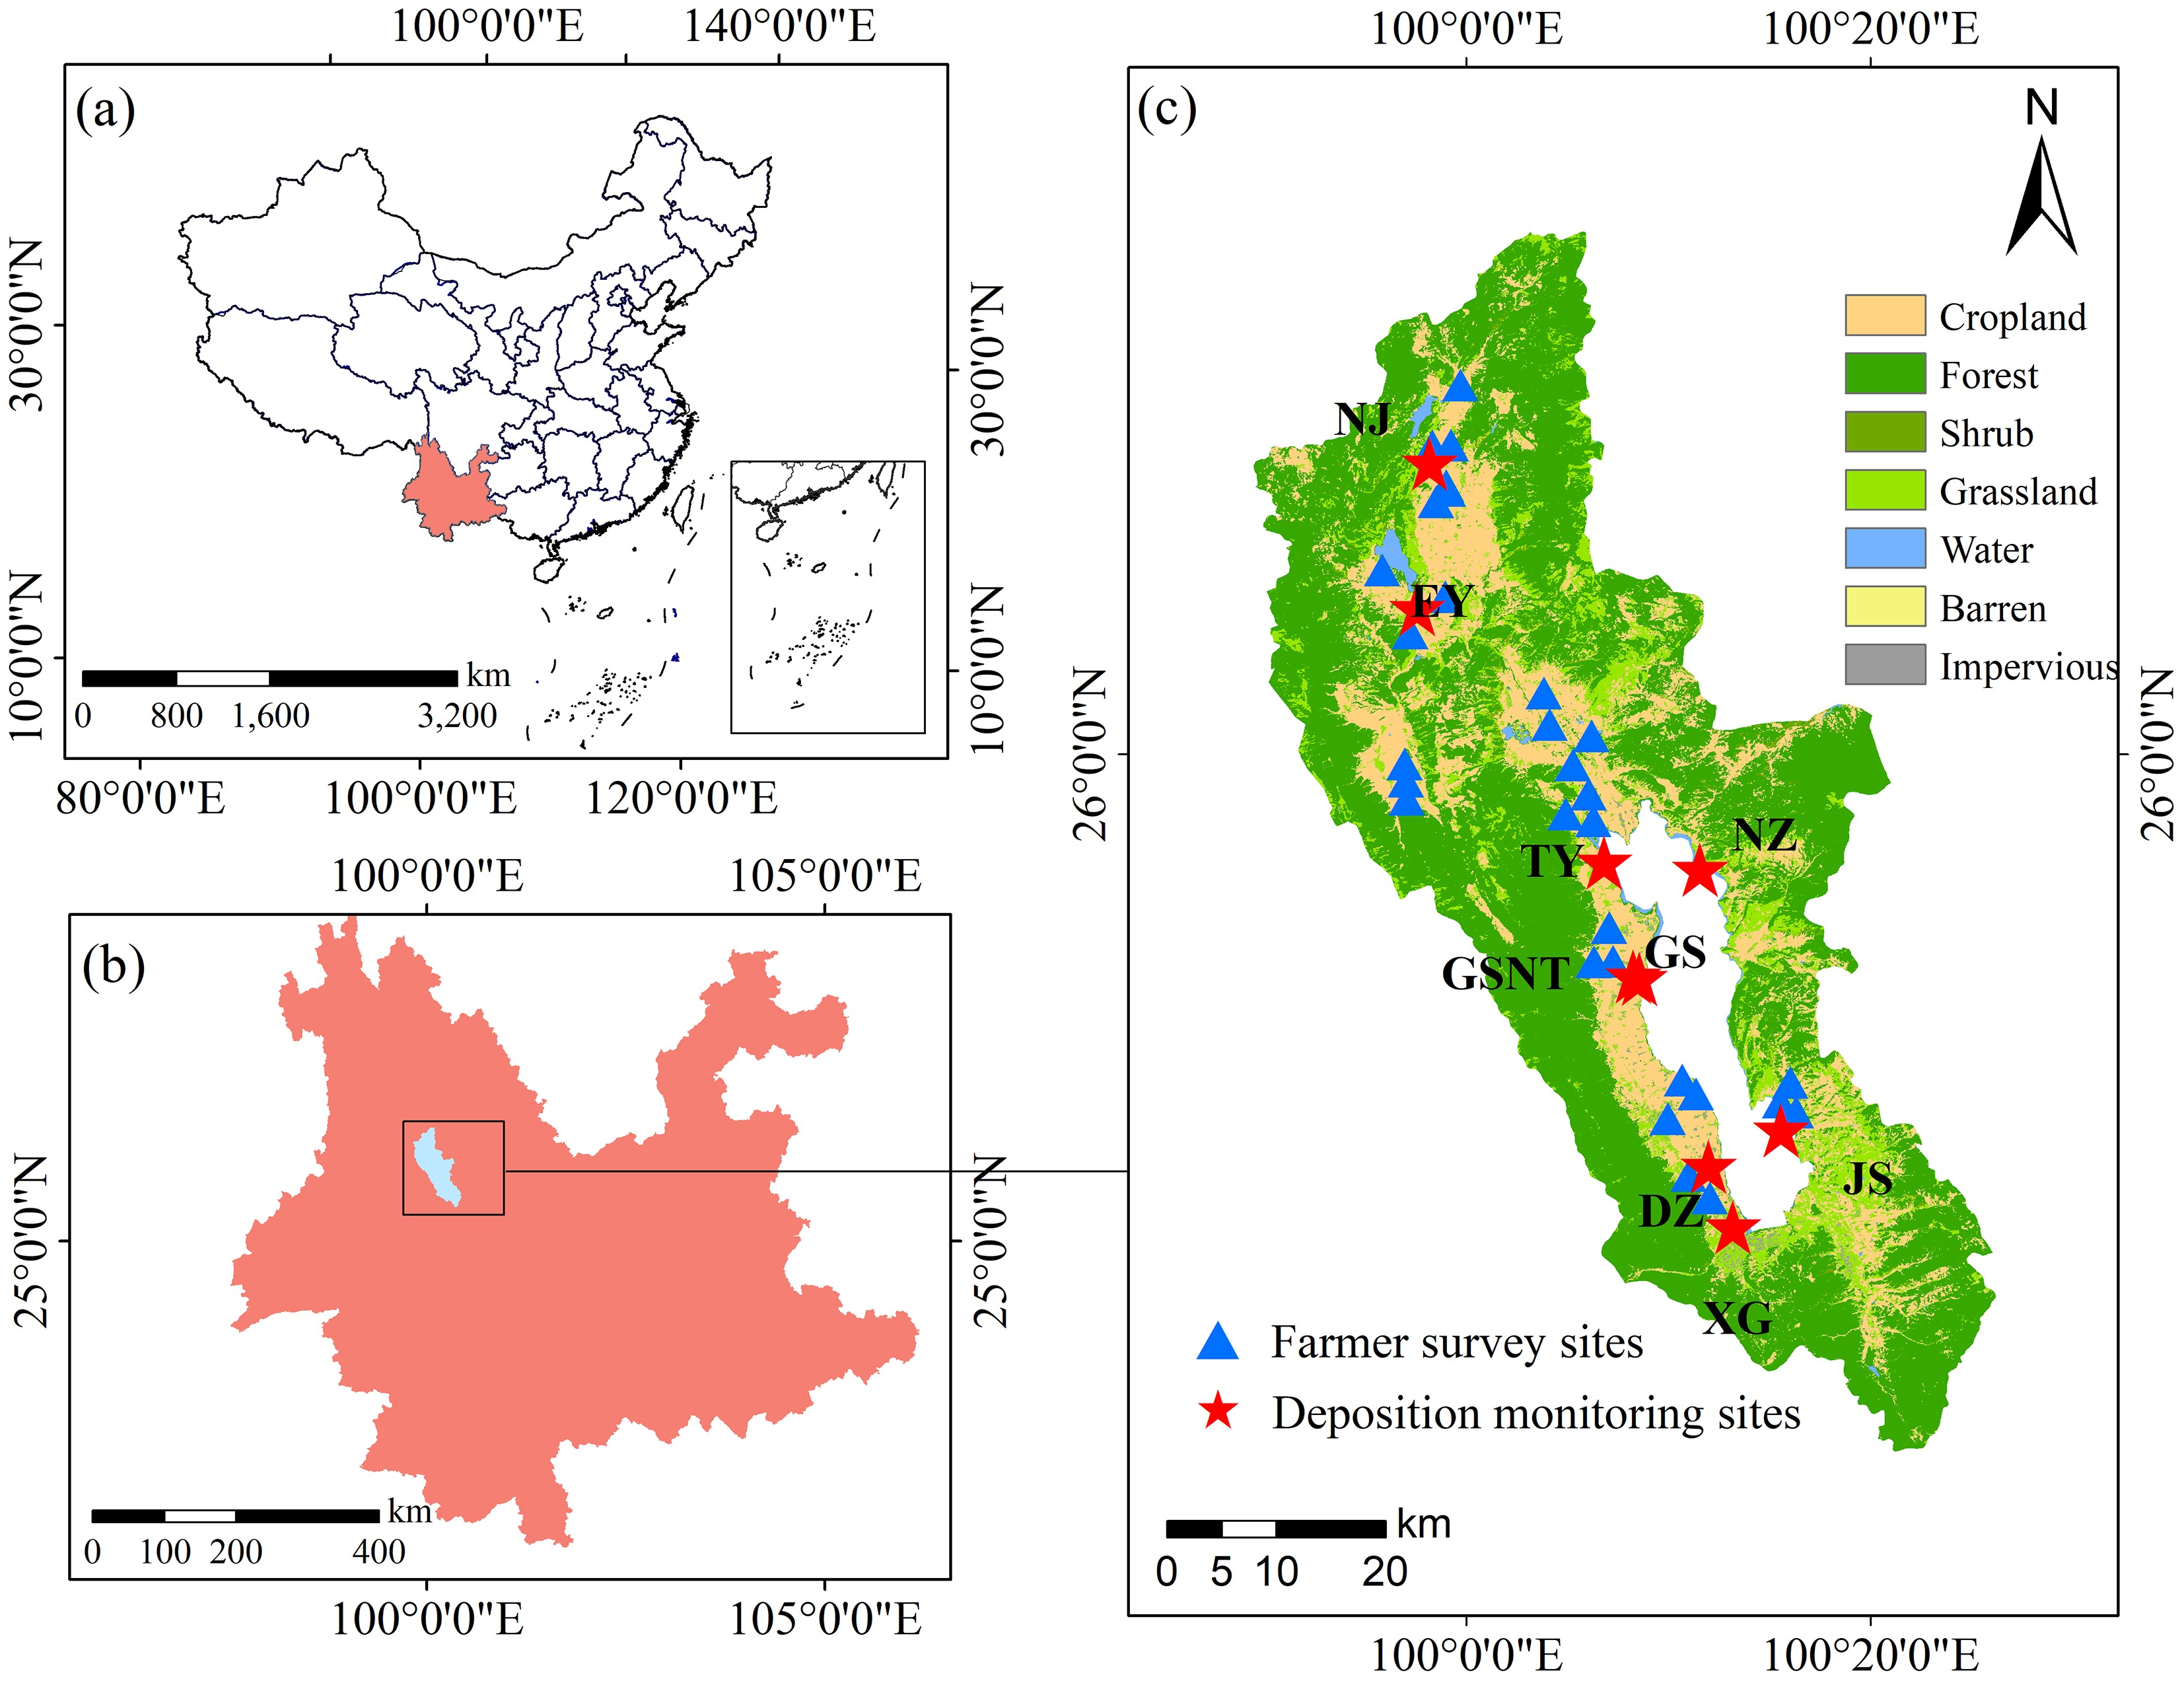
Figure 1.
Location of the study area. (a) Yunnan Province within China, (b) the Erhai Lake Basin (ELB) within Yunnan, and (c) spatial distribution of farmland survey sites and atmospheric nitrogen deposition monitoring sites overlaid on the major land-use types within the ELB[29]. The nine atmospheric deposition monitoring sites (GS, TY, NZ, JS, XG, EY, NJ, GSNT, and DZ) correspond to Gusheng Village, Taoyuan Village, Nanzhao Island, Jinsuo Island, Xiaguan Town, Eryuan County, Niujie Town, Gusheng Cropland, and Dazhuang Village, respectively.
-
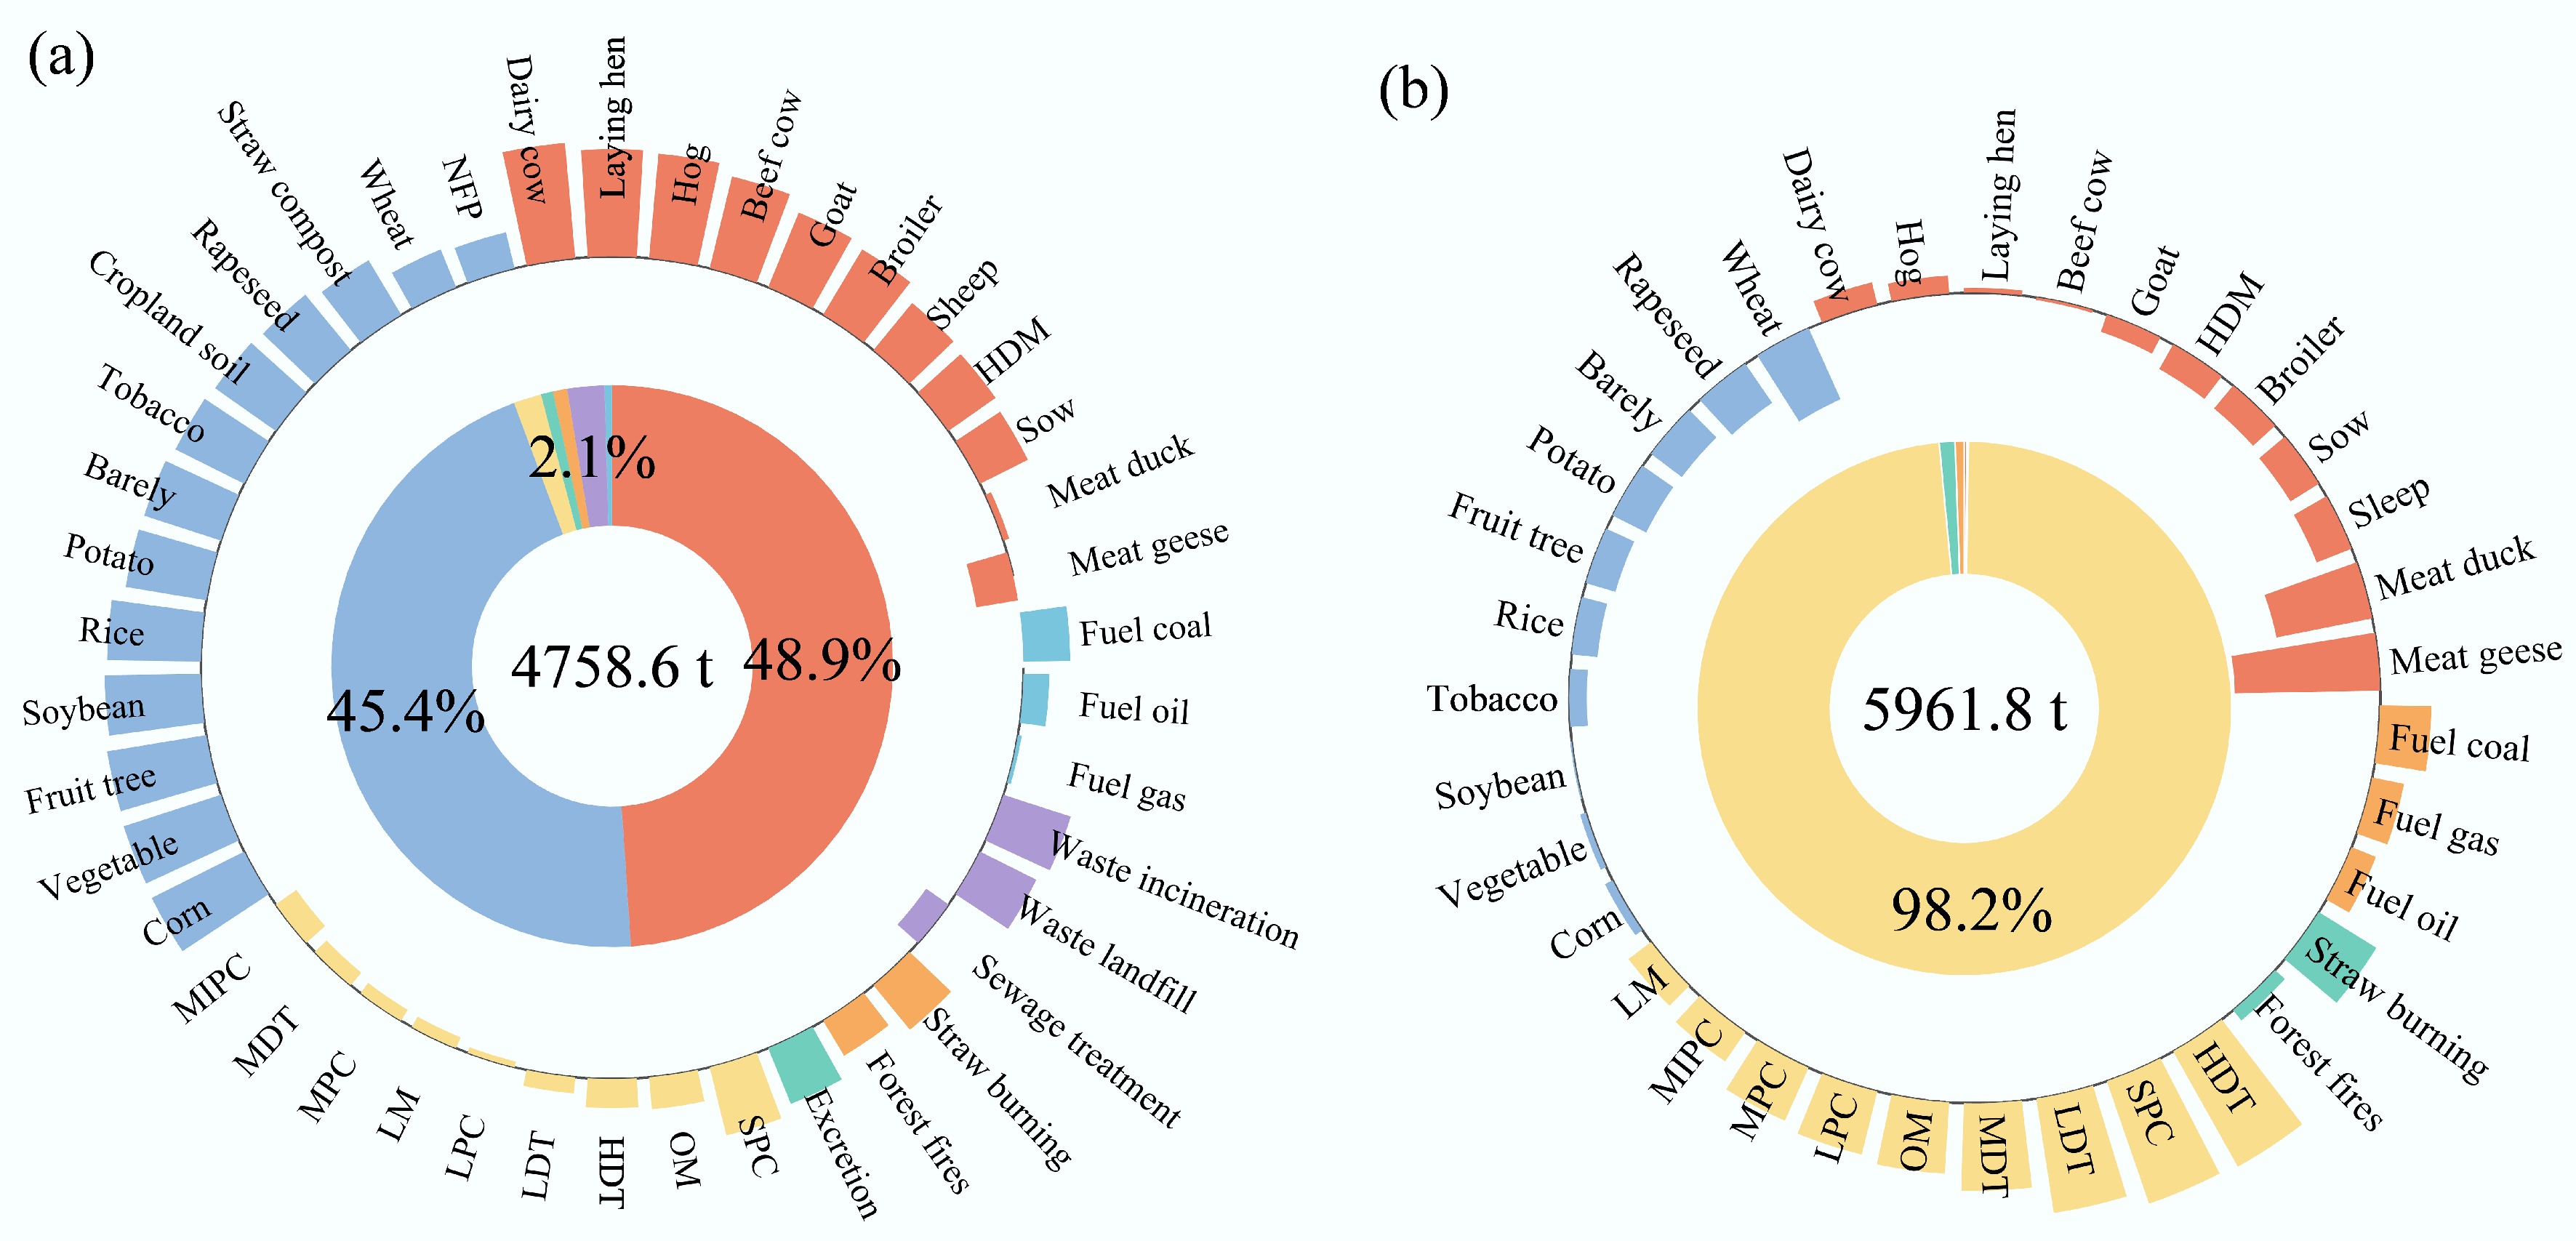
Figure 2.
Source apportionment of (a) NH3-N and (b) NOx-N emissions in the Erhai Lake Basin for 2022. The outer ring displays the emission rates for all sub-categories (bar heights correspond to log-transformed emissions). The inner ring illustrates the proportional contribution of primary sources to the total. LPC, large passenger cars; MPC, medium passenger cars; SPC, small passenger cars; MIPC, mini passenger cars; HTD, heavy-duty trucks; MTD, medium-duty trucks; LTD, light-duty trucks; OM, ordinary motorcycles; LM, light motorcycles; NFP, nitrogen-fixing plants; HDM, horses, donkeys, and mules.
-
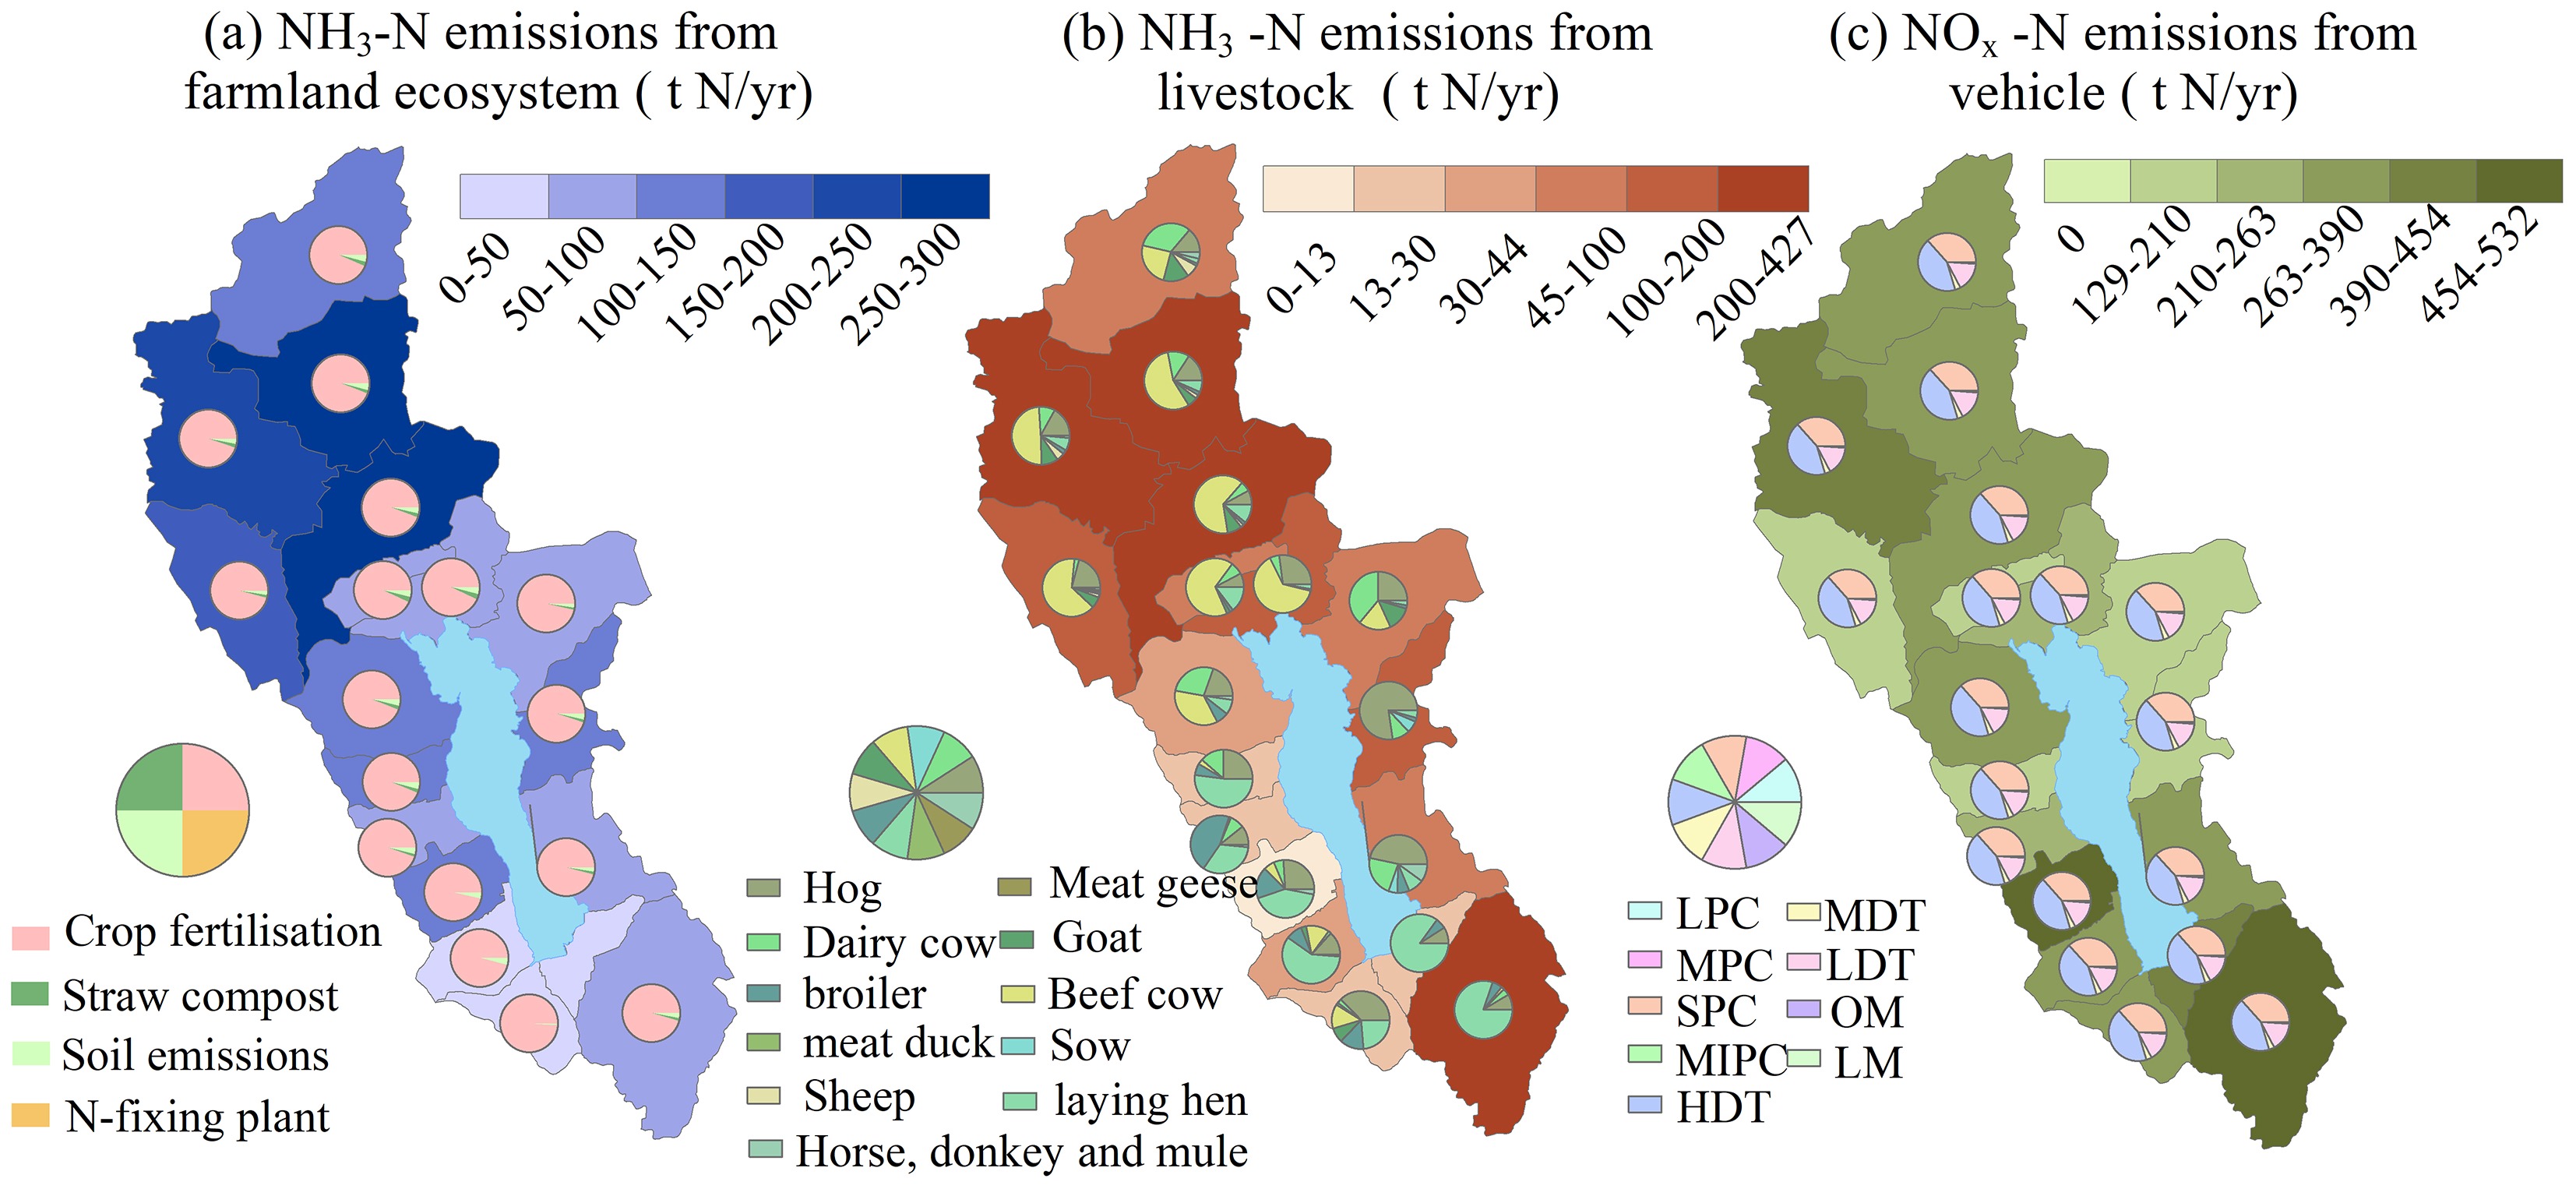
Figure 3.
Spatial distribution of (a) NH3-N emissions from the farmland ecosystem, (b) NH3-N emissions from livestock, and (c) NOx-N emissions from motor vehicles across townships in the Erhai Lake Basin. Emissions are presented as percentages of the total basin-wide emission for each respective source category.
-
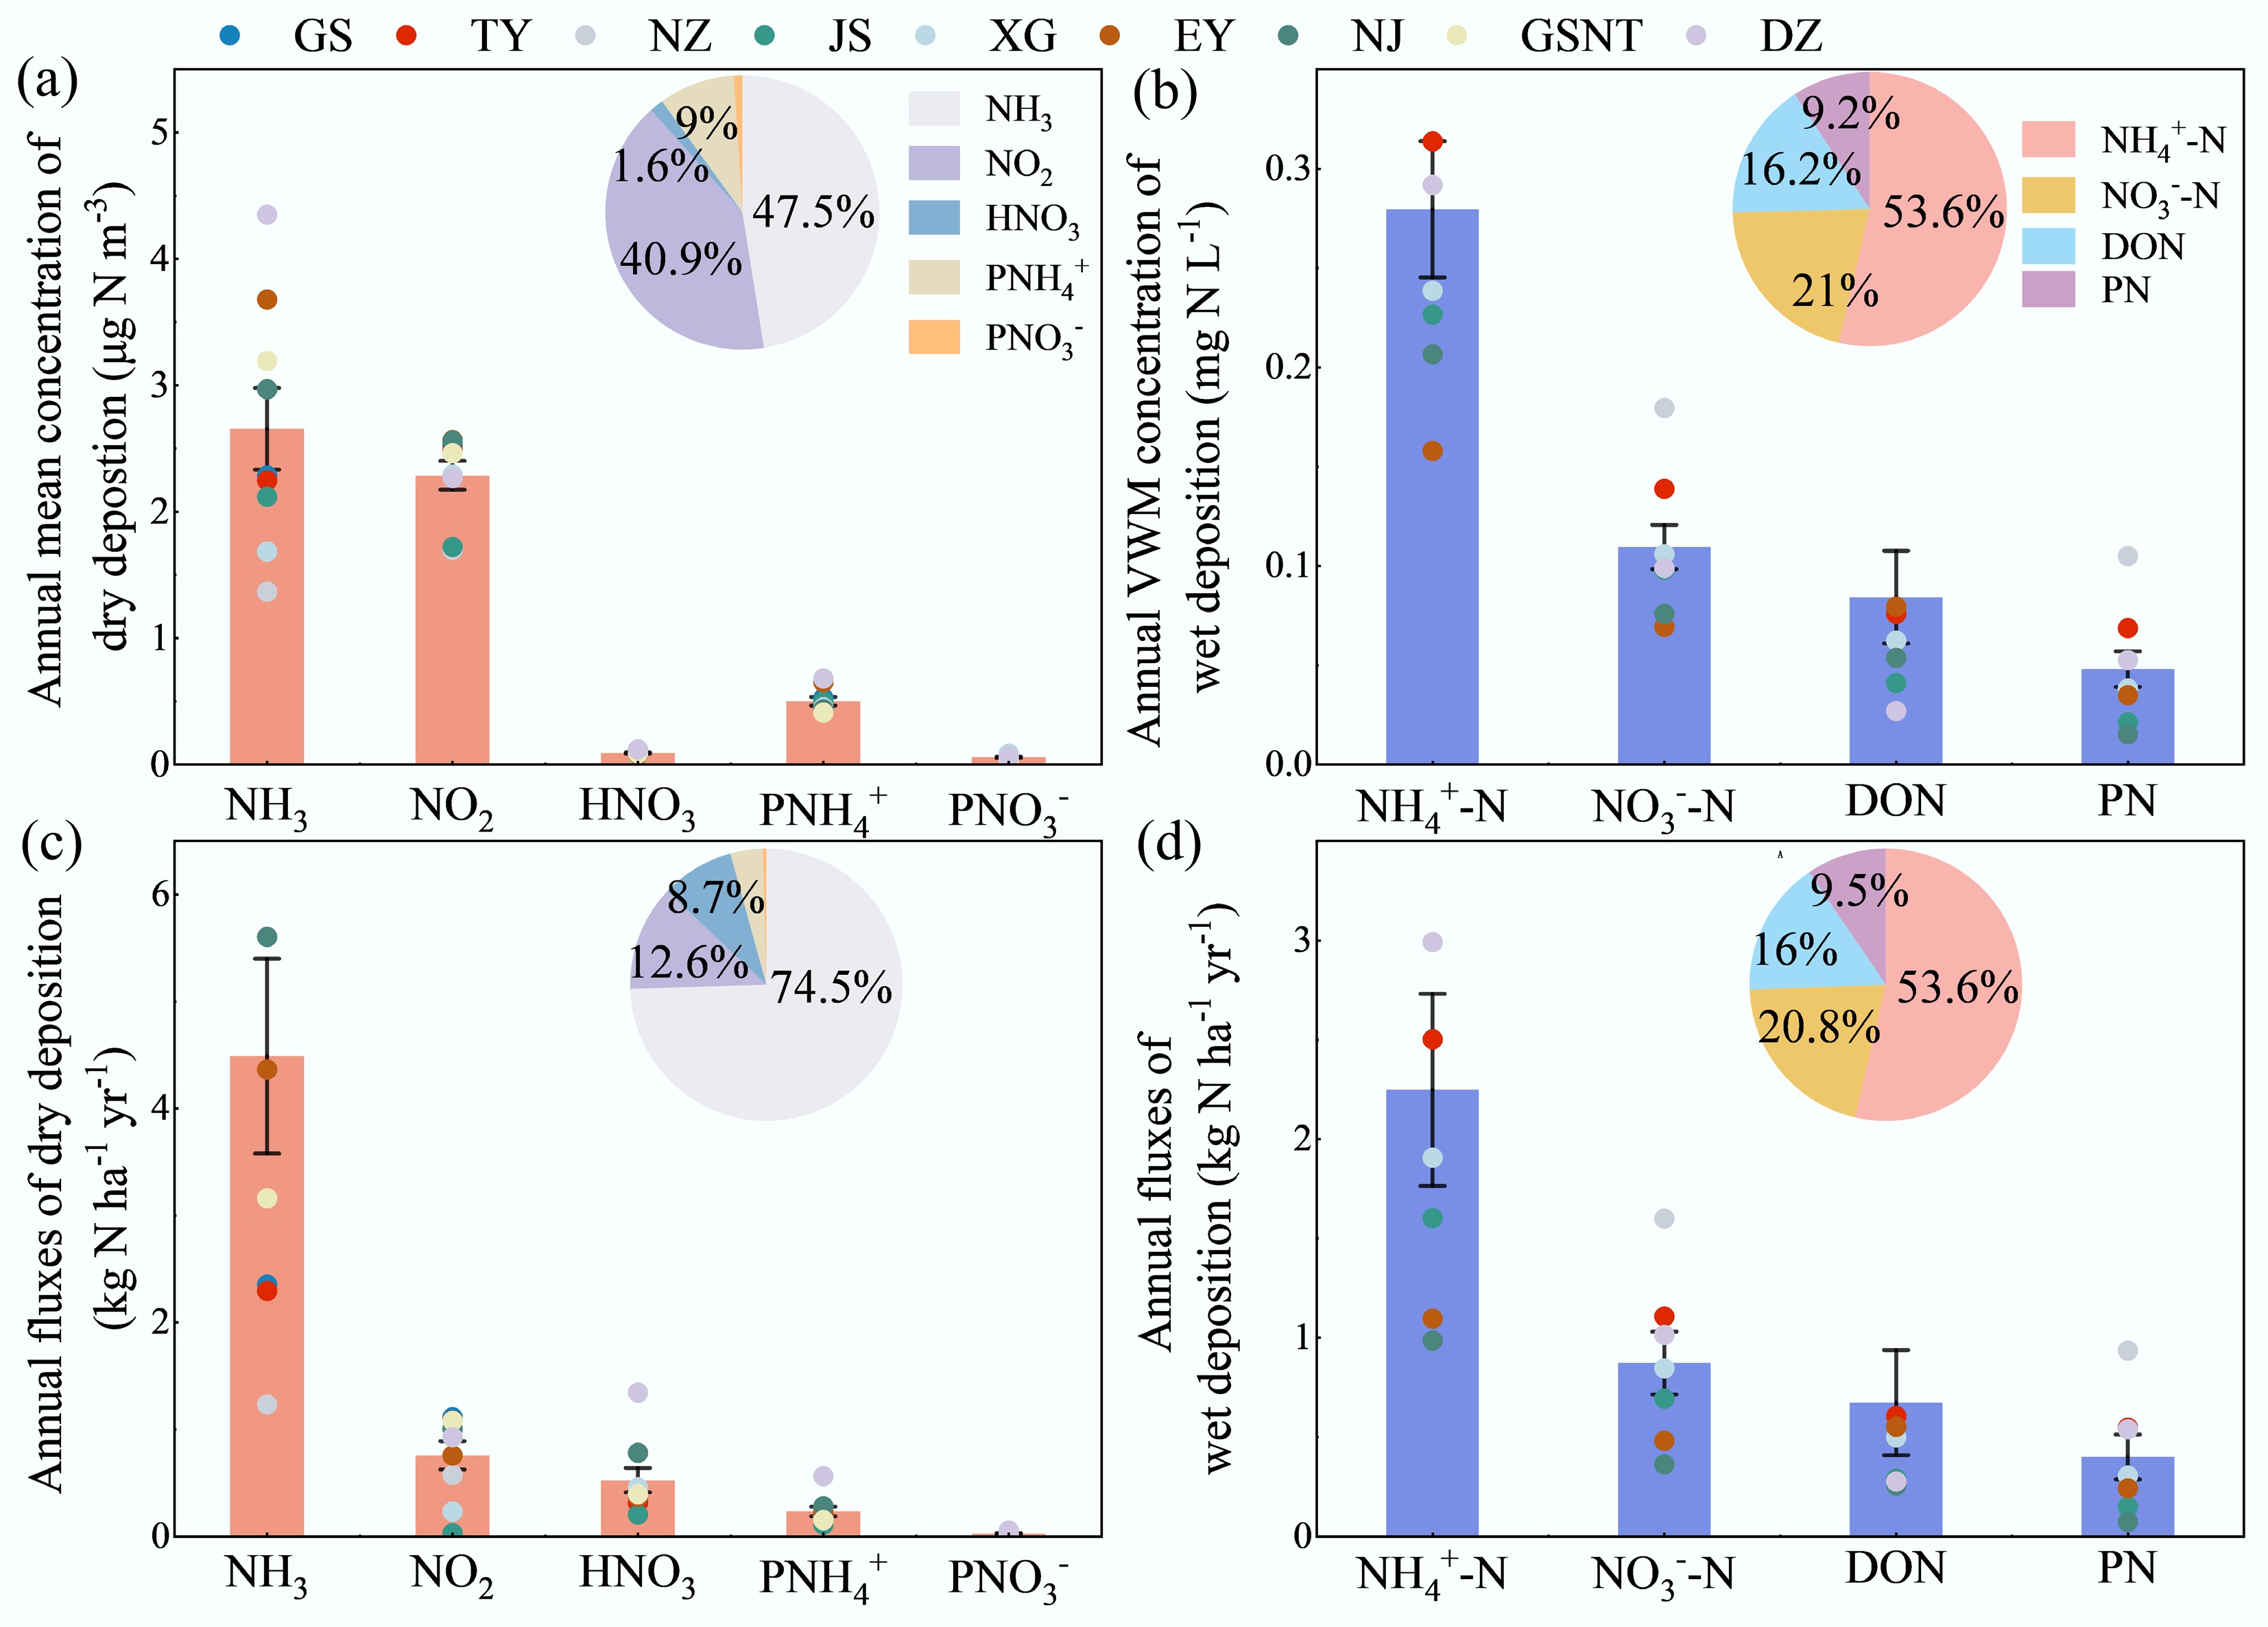
Figure 4.
Annual mean concentration and deposition fluxes of different Nr species in the Erhai Lake Basin (2023). (a), (c) Dry deposition: concentration and flux. (b), (d) Wet deposition: volume-weighted mean (VWM) concentration and flux. Data are presented as mean ± standard deviation across nine monitoring sites for dry deposition and seven sites for wet deposition.
-
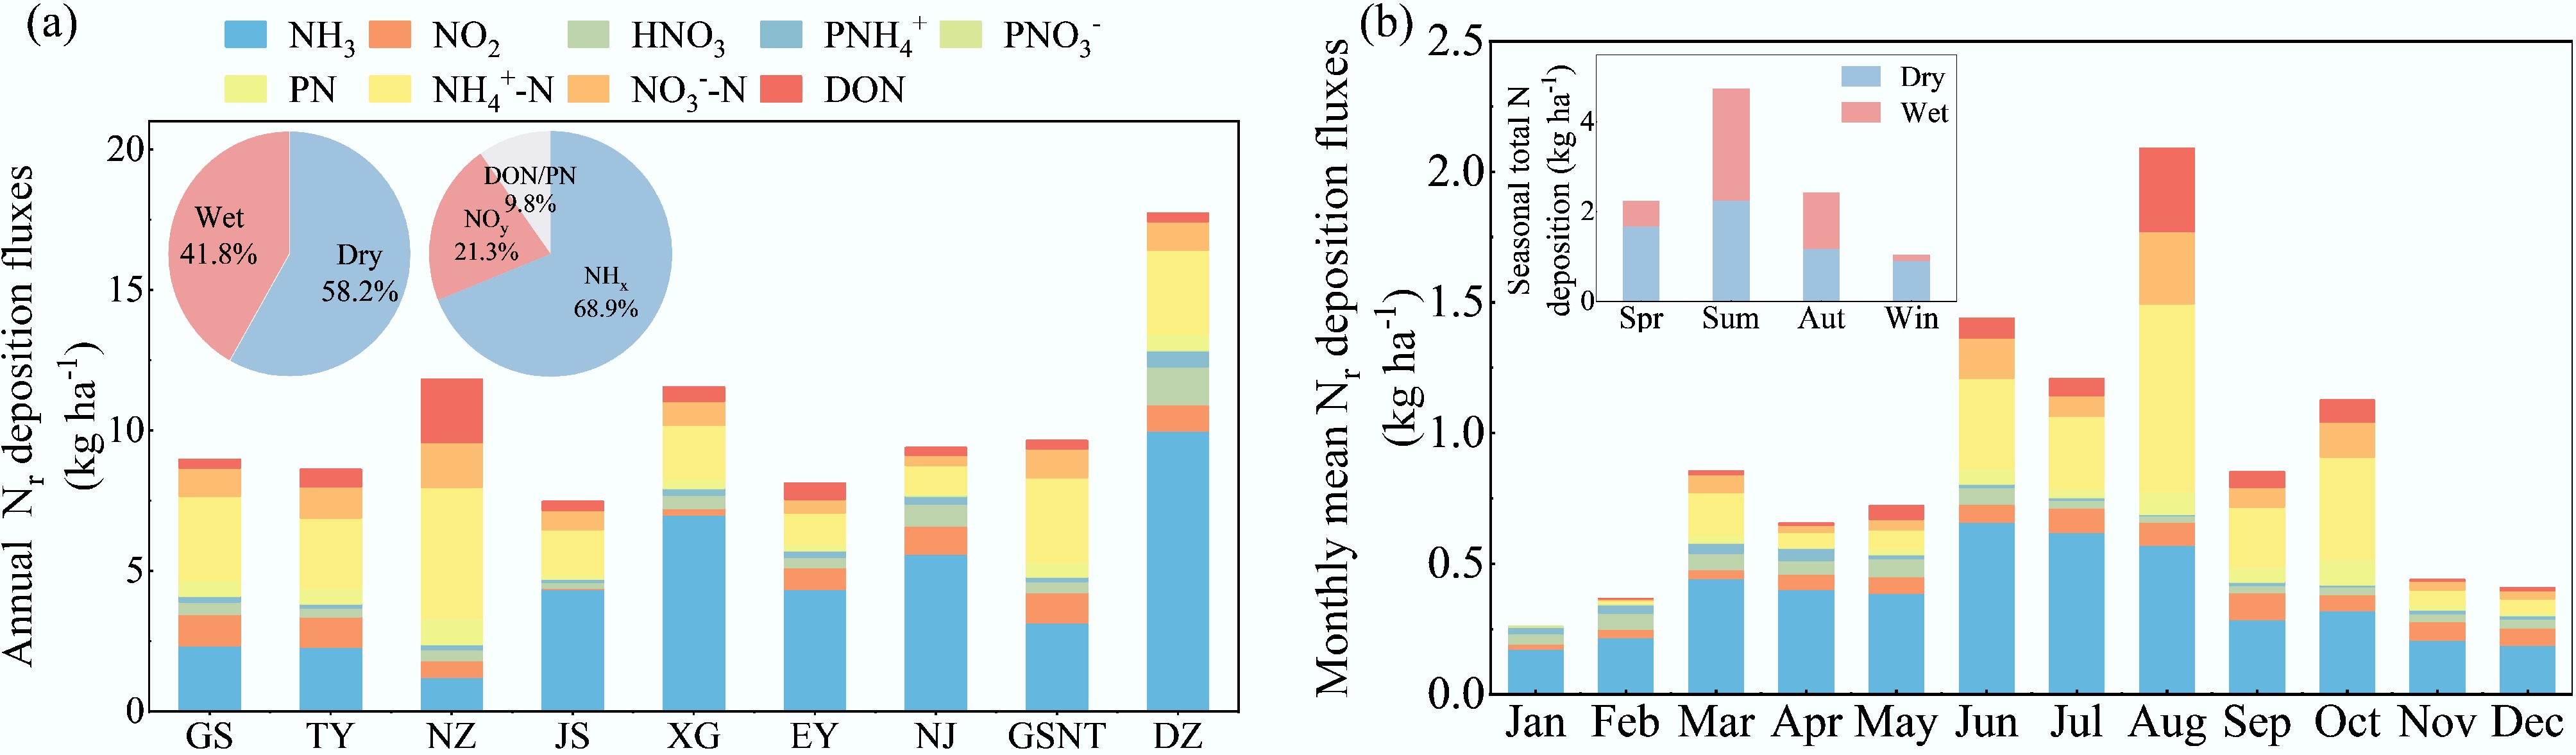
Figure 5.
Composition of atmospheric nitrogen deposition in the Erhai Lake Basin. (a) Proportions of different Nᵣ species in the annual total deposition (dry + wet) across all sites. (b) Monthly and seasonal variations in the contributions of different Nr species to total deposition, based on the average of all nine monitoring sites. Species groupings: NHx (sum of NH4+, NH3, and PNH4+); NOy (sum of NO3−, NO2, HNO3, and PNO3−); DON, dissolved organic nitrogen; PN, particulate nitrogen from wet deposition.
-
Administrative scope Emission (E t yr−1) Deposition (D t yr−1) Budget (B t yr−1) Budget of Total Nr
(t yr−1)NH3 NOx NHx NOy NHx NOy Dali (DL) 2,209.8 4,130.0 987.9 308.3 1,221.9 3,821.7 4,890.8 Eryuan (EY) 2,548.8 1,831.8 769 232.7 1,779.8 1,599.1 3,310.4 Erhai Lake Basin (ELB) 4,758.6 5,961.8 1,756.9 541 3,001.7 5,420.8 8,201.2 (1) Budget (B) for NHx and NOy is calculated as B = E − D. (2) Budget of Total Nᵣ (BTN) is calculated as BTN = (NHx Budget + NOy Budget) − (Wet deposition of particulate N + Wet deposition of dissolved organic N). This represents the net atmospheric surplus after accounting for the major deposition pathways of emitted N. (3) DL, EY, and ELB denote Dali County, Eryuan County, and the entire Erhai Lake Basin, respectively. Table 1.
Atmospheric budgets of NHx, NOy, and total Nᵣ for Dali County, Eryuan County, and the entire Erhai Lake Basin (ELB)
Figures
(5)
Tables
(1)