


-
Atmospheric reactive nitrogen (Nr) comprises a suite of biologically, photochemically, and radiatively active nitrogen compounds, including inorganic species like ammonia (NH3), nitrogen oxides (NOx), nitric acid (HNO3), particulate ammonium (NH4+), and nitrate (NO3−), and organic nitrogen. These compounds exert profound impacts on atmospheric chemistry and ecosystem functioning[1]. As the principal atmospheric alkaline gas, NH3 readily neutralizes acidic species such as HNO3 and H2SO4 to form secondary inorganic aerosols (SIAs), including ammonium sulfate ((NH4)2SO4) and ammonium nitrate (NH4NO3)[2,3]. These SIAs are dominant components of fine particulate matter (PM2.5), contributing up to 40% or more of its mass n polluted regions[4,5]. Concurrently, NOx (NO + NO2) is a key precursor to tropospheric ozone and secondary organic aerosols, posing significant risks to human health and contributing to climate change[6]. Moreover, excessive deposition of Nr onto terrestrial and aquatic ecosystems through wet and dry pathways can lead to soil acidification, water eutrophication, and biodiversity loss[7,8].
The atmospheric Nr budget, governed by the balance between emission and deposition fluxes, has been profoundly perturbed over the past century by intensified agricultural and industrial activities[9]. In China, the rapid escalation in synthetic fertilizer use and fossil fuel combustion from the 1980s to the 2010s resulted in a dramatic surge in NH3 and NOx emissions, establishing the nation as a global hotspot for atmospheric Nr[10]. In response, stringent national air quality policies, including the Clean Air Action (2013–2017) and the Three-Year Action Plan for Winning the Blue-Sky Defense Battle (2018–2020), were implemented. These policies successfully curtailed NOx emissions, particularly from the industrial and transportation sectors, leading to a 59% reduction in national emissions by 2017 relative to 2010 levels[11]. In contrast, NH3 emissions, derived mainly from agricultural activities, remained stable or even increased slightly over the same period, owing to a comparative lack of regulatory focus[11]. This divergent emission trajectory has consequently reshaped atmospheric deposition patterns, as evidenced by data from the Nationwide Nitrogen Deposition Monitoring Network (NNDMN), which indicate a rising ratio of reduced to oxidized nitrogen deposition between 2010 and 2020[12,13]. Parallel successes in reducing NOx emissions and deposition in Europe and North America further affirm the tight coupling between emissions and deposition[14], highlighting the need for a synergistic approach to investigating the complete atmospheric nitrogen budget.
Accurate quantification of the atmospheric nitrogen budget is fundamental for identifying regional Nr sources and sinks and for designing targeted mitigation strategies[15,16]. Bottom-up emission inventories, which integrate sector-specific activity data with regionally approximate emission factors, serve as a primary tool for estimating anthropogenic Nr emissions and have been progressively refined[17−19]. Concurrently, diverse methodologies, including field monitoring, satellite remote observations, and chemical transport modeling, have been employed to quantify atmospheric Nr deposition via wet and dry pathways[20]. While wet deposition (the flux of Nr in precipitation) is relatively straightforward to measure, quantifying dry deposition remains methodologically challenging due to the multitude of contributing gaseous and particulate Nr species and their species-dependent deposition velocities[20]. A significant research gap persists, however, as many studies address emissions and deposition in isolation or focus on specific Nr species or source sectors. For example, previous works have separately quantified NH3 emissions in the Yangtze River Delta[21], NOx from vehicles in the Beijing-Tianjin-Hebei region[22], and bulk Nr deposition patterns across China[23]. While insightful, these fragmented approaches preclude a holistic understanding of the complete Nr budget at regional or watershed scales, thereby limiting insights into the net environmental impact and the potential for long-range transport of surplus Nr.
The Erhai Lake Basin (ELB) in southwestern China, a typical plateau lake basin, provides a critical and timely setting for such an integrated budget analysis. Designated as a key demonstration zone for sustainable agriculture and ecological conservation, the ELB has experienced substantial regulatory transformations since 2018. These include a ban on nitrogen- and phosphorus-based chemical fertilizers, the phase-out of high-input cropping systems, and the relocation of intensive livestock operations[24]. These policy interventions have presumably reshaped regional Nr fluxes, but a comprehensive assessment of their impact on the atmospheric Nr budget is currently absent. While prior research has yielded valuable preliminary data, such as quantifying the contribution of atmospheric deposition (approximately 17%) to the lake's annual nitrogen load[25] and documenting specific agricultural Nr losses[26]. A holistic budget that integrates emissions from all key anthropogenic sources with spatially explicit deposition data is still missing. To bridge this knowledge gap, the current study was designed with three primary objectives: (1) to systematically estimate NH3 and NOx emissions from all major sources for the year 2022; (2) to quantify dry and wet Nr deposition across nine representative monitoring sites in 2023; and (3) to establish a comprehensive Nr budget for the entire ELB and its sub-regions. The present work aims to deepen the understanding of nitrogen cycling in fragile plateau lake ecosystems, and to provide a scientific foundation for devising effective regional pollution control strategies.
-
The Erhai Lake Basin (ELB) (25°37'–25°58' N, 99°52'–100°16' E) is located on the Yunnan Plateau in southwestern China, with an average elevation of approximately 1,900 m above sea level (Fig. 1a, b). This basin represents a typical low-altitude plateau lake catchment, characterized by a mean annual temperature of 15.1 °C and a mean annual precipitation of 1,000 mm[27]. The ELB encompasses 18 townships, and supports a total population of approximately 0.9 million. The basin features a diverse landscape, including intensive agricultural and livestock production zones, urban centers, and tourist areas. Key townships include Sanying, Zibihu, and Yousuo for agriculture and livestock, and Dali and Shuanglang for tourism[28].
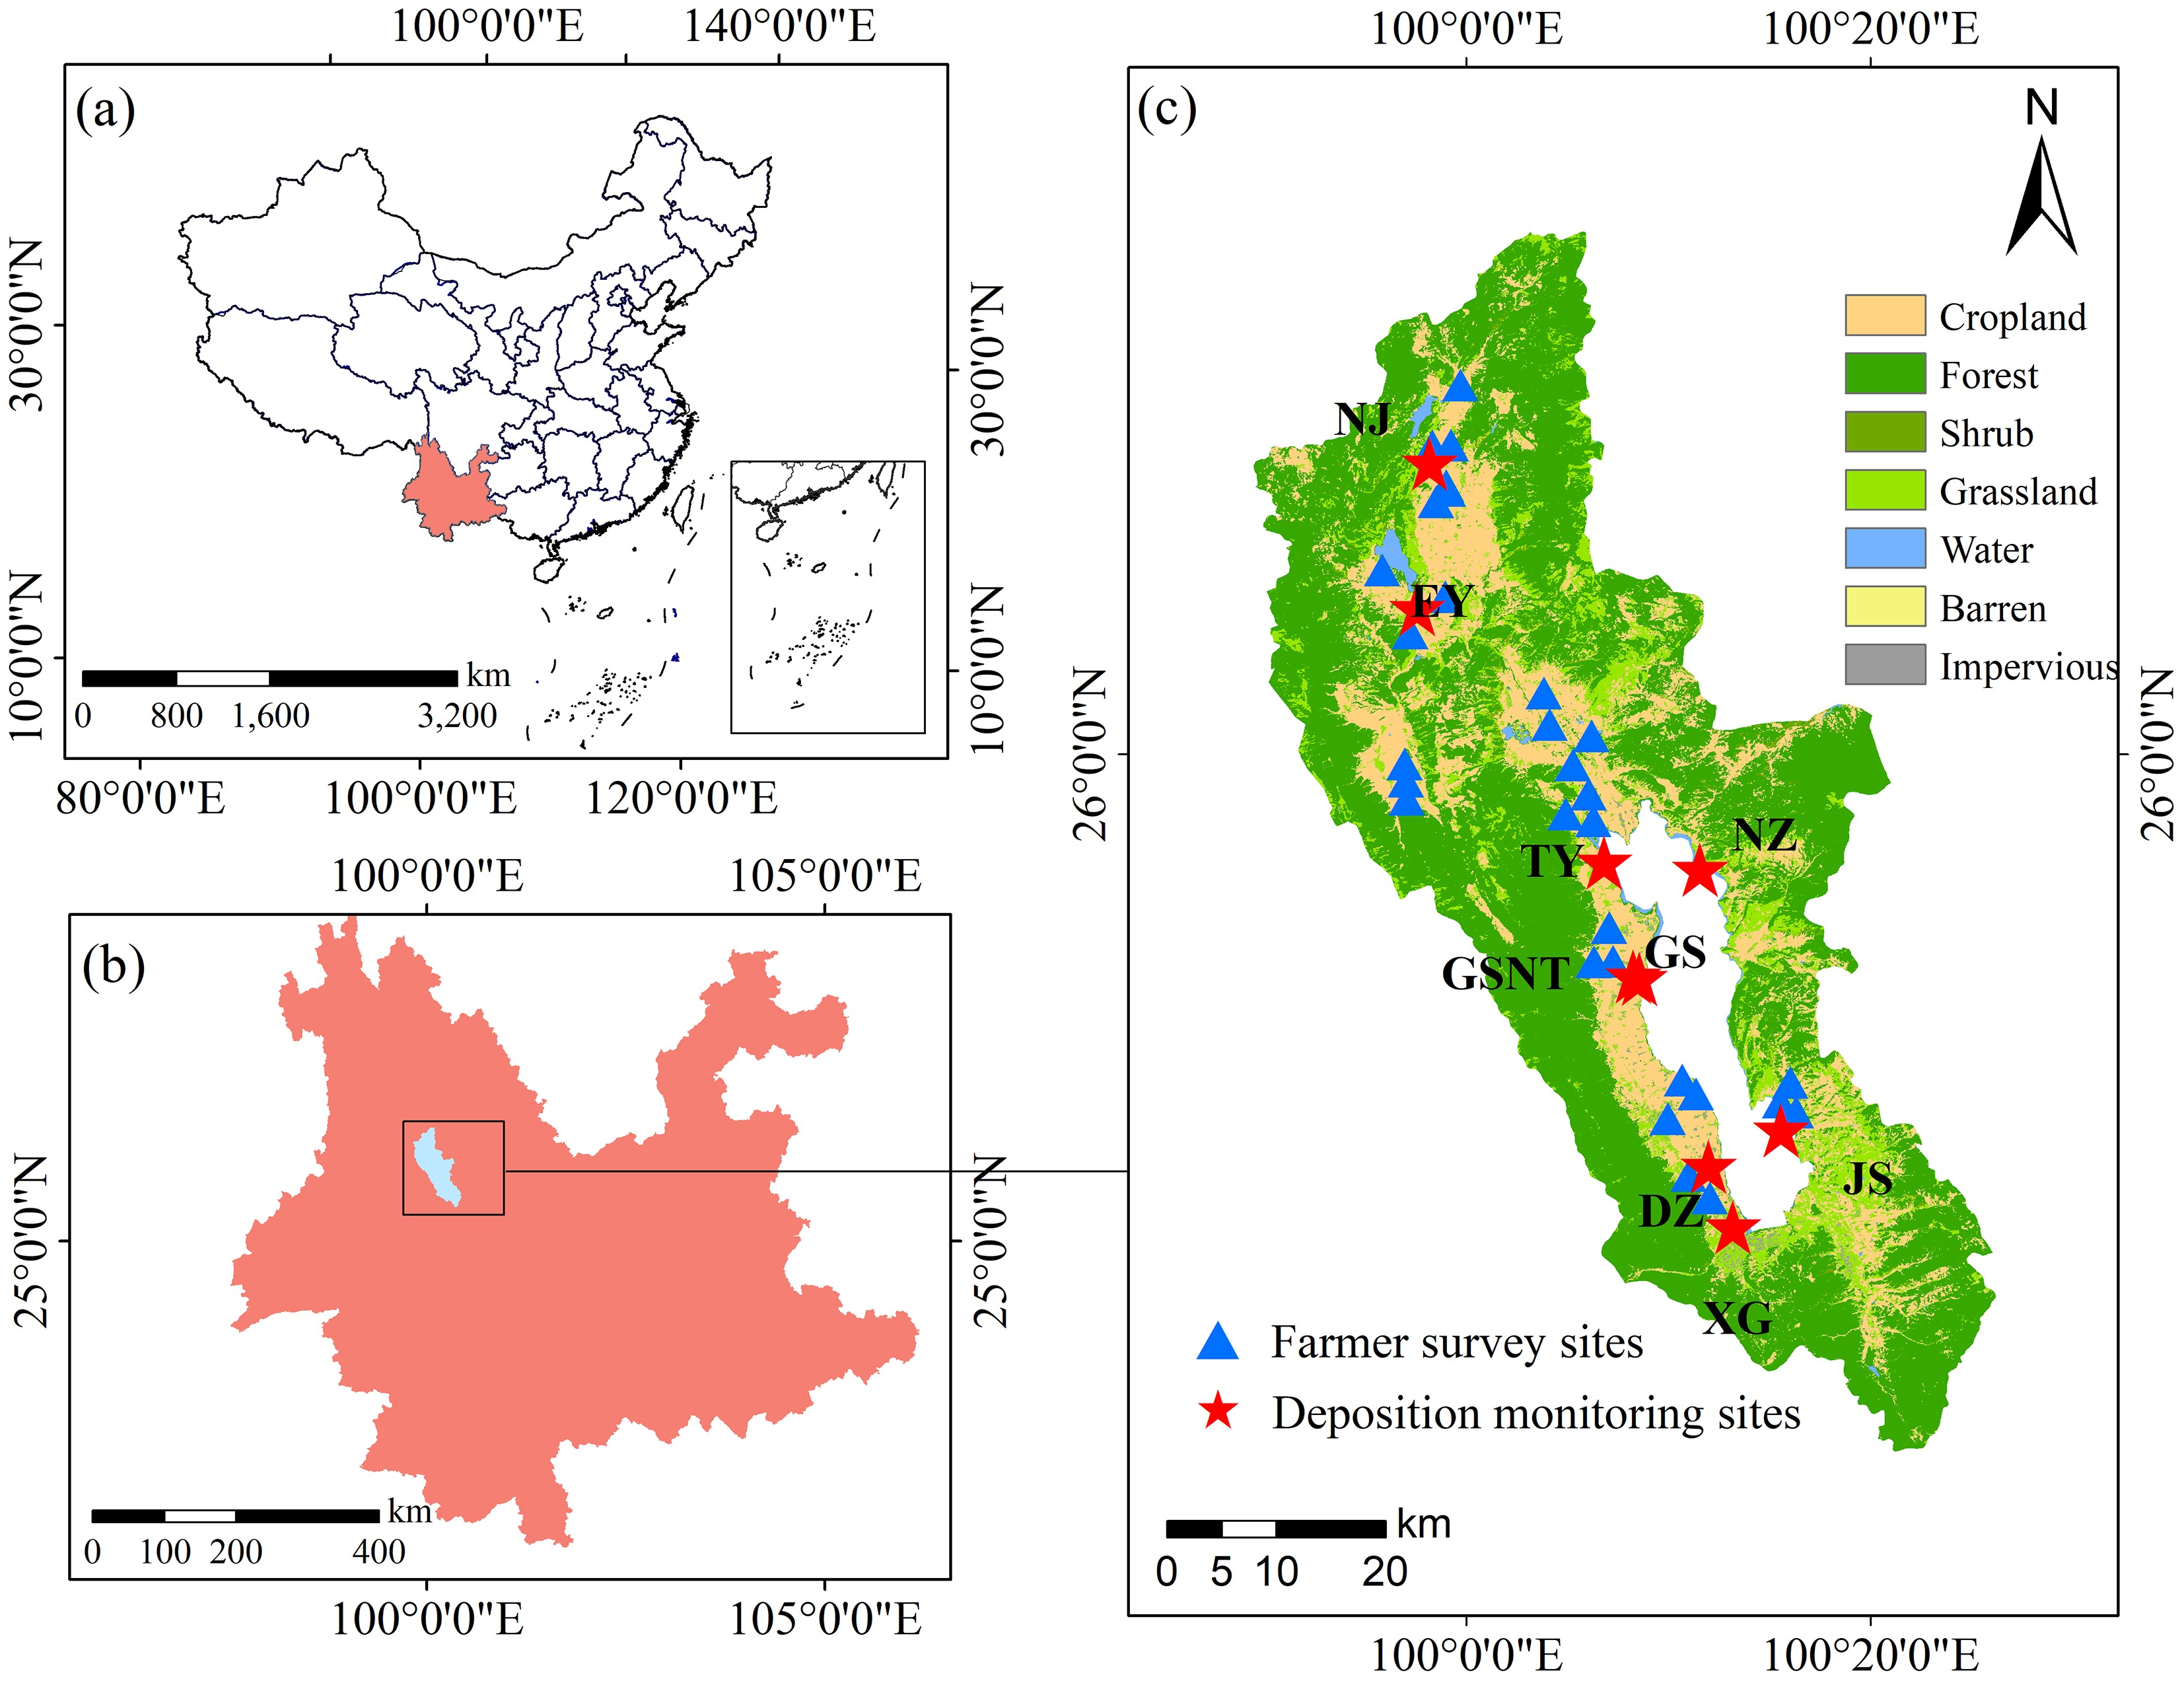
Figure 1.
Location of the study area. (a) Yunnan Province within China, (b) the Erhai Lake Basin (ELB) within Yunnan, and (c) spatial distribution of farmland survey sites and atmospheric nitrogen deposition monitoring sites overlaid on the major land-use types within the ELB[29]. The nine atmospheric deposition monitoring sites (GS, TY, NZ, JS, XG, EY, NJ, GSNT, and DZ) correspond to Gusheng Village, Taoyuan Village, Nanzhao Island, Jinsuo Island, Xiaguan Town, Eryuan County, Niujie Town, Gusheng Cropland, and Dazhuang Village, respectively.
NH3-N and NOx-N emissions
-
A comprehensive emission inventory was compiled for NH3-N and NOx-N in the ELB. The primary sources of NH3-N included livestock, farmland ecosystem, vehicles, waste treatment, biomass burning, fuel combustion, and human excreta. NOx-N emissions were estimated from vehicles, livestock, farmland ecosystem, biomass burning, and fuel combustion (for a complete list of sub-categories, see Supplementary Table S1). The emissions for each sub-category were calculated by multiplying the corresponding emission factors (EFs) by the relevant activity data[21]:
$ E=\sum \nolimits_{i}\sum \nolimits_{j}\left({A}_{ij}\times {EF}_{ij}\right) $ (1) where, E is the total emission of NH3-N or NOx-N; i and j denote the major source category and its sub-categories, respectively; Aij is the activity data; EFij is the corresponding emission factor. EFs were carefully selected from Chinese technical guidelines[30]. For sources not covered by these guidelines, EFs derived from field measurements in geographically and climatically similar regions are applied (see Supplementary Table S2)[16].
This emission inventory was prepared for 2022. The atmospheric deposition monitoring was conducted in 2023. This one-year temporal offset was necessitated by the delay in publishing the official statistical yearbooks for 2023, which are the primary source of reliable activity data. It was asserted that the fundamental structure of emission sources and the intensity of key activities were stable between these two years, as no major policy shifts or structural economic changes were reported. Consequently, the 2022 emission inventory serves as a robust baseline for characterizing the Nᵣ emission profile of the basin and for constructing an annual budget in conjunction with the 2023 deposition measurements.
Livestock emissions
-
Livestock NH3-N emissions primarily originated from manure management. A pivotal local policy enacted in 2018, which prohibited synthetic fertilizers and promoted organic alternatives, has led to the near-comprehensive recycling of livestock manure onto farmland within the ELB. To prevent double-counting of emissions between the livestock and farmland sectors, a mass-flow approach was adopted. This method tracks nitrogen through sequential manure management stages, attributing emissions from manure application to the farmland ecosystem[31].
Emissions were categorized by rearing system: outdoor (direct emissions from grazing) and indoor. Indoor systems were further divided into three management stages: housing (volatilization within barns), storage (volatilization during manure storage), and field application (volatilization after spreading). The emissions for 11 livestock categories were estimated. For animals with a rearing cycle longer than one year (e.g., beef cattle, sows), the year-end stock population was used. For animals with an annual cycle (e.g., broilers), the annual slaughter count was applied. Livestock NH3 emissions were calculated using Eq. (2):
$ {E}_{l}=\sum \nolimits_{i}\left({A}_{i}\times {EF}_{i}\times \gamma \right) $ (2) where, El is the total NH3-N emission from livestock; Ai is the total ammonia nitrogen (TAN) production; EFi is the NH3 emission factor for each manure type and management stage; and γ is the conversion factor from nitrogen to NH3 (1.214[30]).
Daily TAN production was calculated from the daily excrement volume, nitrogen content, and the TAN fraction (see Supplementary Text S1 for details). The present analysis distinguished between free-range and intensive rearing systems. Emission factors for the housing stage were referenced for the local temperature range of 10–20 °C. It is important to note that the estimate of NOx-N emissions from livestock only included processes concomitant with NH3-N emissions (i.e., from manure), and may therefore represent a lower-bound estimate. All livestock parameters and stage-specific EFs are provided in Supplementary Table S3.
Farmland ecosystem emissions
-
Emissions from farmland ecosystems were estimated for ten major crops (wheat, soybean, potato, barley, rice, corn, rapeseed, tobacco, vegetables, and fruit trees). High-resolution data on nitrogen management practices were obtained through a comprehensive survey of 232 farmers across the ELB in 2022 (Fig. 1c).
A critical adjustment was implemented to avoid double-counting NH3-N emissions between the livestock and farmland sectors. The amount of externally applied organic fertilizer for each crop was calculated by subtracting the nutrient contribution from locally recycled livestock manure from the total organic fertilizer application reported in the surveys, following Eq. (3):
$ {A}_{i}={C}_{i}\times {(\varphi }_{i}-{\omega }_{i}) $ (3) where, Ai represents the adjusted total fertilizer application rate for crop i; Ci is the planting area of crop i[28];
$\varphi_i $ This approach ensures that NH3 emissions from manure application are attributed to the farmland ecosystem, while emissions from housing and storage stages are retained in the livestock sector.
Furthermore, NH3-N emissions from straw composting were estimated for eight major crops (excluding vegetables and fruit trees). This calculation incorporated crop yield data, survey-derived straw-to-grain ratios, the fraction of straw used for composting, and regional emission factors[32] (see Supplementary Tables S5 and S6 for parameters).
Finally, direct NH3-N emissions from cropland soils and biological nitrogen fixation (from soybean cultivation) were included. These were estimated by multiplying the respective cultivation areas by their corresponding emission factors: 0.008 kg N ha−1 yr−1 for soil emissions, and 0.005 kg N ha−1 yr−1 for nitrogen-fixing crops[30]. A complete list of EFs used for the farmland ecosystem is provided in Supplementary Table S7.
Vehicular emissions
-
Vehicular emissions were estimated for nine vehicle types. Although emissions occur from both tailpipes and evaporative processes, tailpipe emissions represent the dominant source of Nr. Vehicle population data (VPi) for the ELB were compiled from provincial and local traffic management statistics[33]. The average annual mileage (VKTj) for each vehicle type was obtained from the national technical guideline[34]. Emission factors (EFj) for NH3 and NOx for different vehicle categories were obtained from a combination of these guidelines and recent literature[16] (see Supplementary Table S8 for details). Total vehicular Nr emissions were calculated using Eq. (4):
$ {E}_{v}=\sum \nolimits_{j}{VP}_{j}\;\times\; {VKT}_{j}\;\times\; {EF}_{j} $ (4) where, Ev is the total vehicular Nr emissions.
Biomass burning emissions
-
Emissions from biomass burning, encompassing straw burning and forest fires, were estimated for NH3 and NOx. For straw burning, eight major crops were considered, and emissions were calculated using Eq. (5):
$ {E}_{s}=\sum \nolimits_{i}{Y}_{i}\times {N}_{i}\times {R}_{i}\times {F}_{i}\times {EF}_{i} $ (5) where, Es is the total Nr emissions from straw burning; Yi is the annual yield of crop i; Ni is the straw-to-grain ratio; Ri is the proportion of straw subjected to open burning; Fi is the burning efficiency; and EFi represents the crop-specific emission factor. All parameters and data sources are provided in Supplementary Table S6.
Emissions from forest fires were calculated using Eq. (6):
$ {E}_{f}=AR\times D\times F\times EF $ (6) where, Ef is NH3 or NOx emission from forest fires; AR is the annual burned area (km2), obtained from local yearbooks; D is the dry biomass density (98 t km−2) for the predominant mixed coniferous-broadleaf forests; F is the combustion factor (0.5)[32]; and EF is the respective emission factor.
Other emission sources
-
NH3 emissions from waste treatment were categorized into three sub-sectors: sewage treatment, solid waste landfill, and solid waste incineration. Corresponding activity data were collected from local statistical yearbooks, and emission factors were obtained from the technical guidelines[30]. Emissions from fuel combustion were estimated by multiplying fuel consumption by their respective fuel-specific emission factors. Emissions from human excreta were calculated based on the population lacking access to sanitary latrines and the corresponding per capita emission factor. All parameters, emission factors, and references for these sources are listed in Supplementary Tables S2 and S9.
Spatial allocation of emissions
-
To create a high-resolution spatial distribution map, Nᵣ emissions from the key sources (agriculture and vehicles) were allocated at the township level. Livestock numbers, crop areas, and fertilizer application rates were spatially disaggregated using local statistical yearbooks and the farm survey data. Vehicular emissions were distributed using a GIS-based approach, with the road length of seven different road types (motorways, trunk, primary, secondary, tertiary, unclassified, and residential roads) serving as a spatial proxy[35]. Road network data were extracted from OpenStreetMap (Supplementary Fig. S1).
Atmospheric Nr deposition
-
Atmospheric Nr deposition was quantified using a monitoring network of nine sites within the ELB, selected to represent diverse underlying surfaces (e.g., cropland, village, lake island) in 2023 (Fig. 1c; for site details see Supplementary Table S10 and Supplementary Text S2). The dataset for this period incorporates previously published data from January to August[25], complemented by data from the remaining months collected and analyzed in this study to form a complete annual record.
Dry deposition flux estimation
-
Dry deposition fluxes of gaseous NH3, NO2, HNO3, and particulate NH4+ (PNH4+), and NO3− (PNO3−) were estimated using an inferential approach. This approach combines measured atmospheric concentrations of Nr species with modeled monthly dry deposition velocities (Vd), as defined in Eq. (7)[36,12]:
$ {F}_{d}=C_{d}^{i}\times V_{d}^{i} $ (7) where, Fd is the dry deposition flux (kg N ha−1) of Nr species i over the sampling period;
$ C_{d}^{i} $ $ V_{d}^{i} $ Monthly mean concentrations of NH3, HNO3, PNH4+, and PNO3− were measured using the Denuder for Long-Term Atmospheric (DELTA) sampling system. Monthly mean NO2 concentrations were determined using Gradko passive sampling tubes[12]. Detailed protocols for sampler operation, sample extraction, and chemical analysis are provided in Supplementary Text S4. This study quantified dry deposition for inorganic Nr species only; organic nitrogen was not included.
Wet deposition flux estimation
-
Wet deposition samples were collected on a per-event basis using APS-3B automatic rainfall collectors (Changsha Xianglan Equipment Inc., China). Standard protocols for instrument operation, sample collection, and pretreatment were adhered to, as described by Shen et al.[37]. Total wet Nr deposition was calculated as the sum of ammonium nitrogen (NH4+-N), nitrate nitrogen (NO3−-N), dissolved organic nitrogen (DON), and particulate nitrogen (PN) in the precipitation. Although PN may include a fraction from crustal dust, it also incorporates nitrogen derived from atmospheric Nr species; thus, its inclusion offers a more comprehensive assessment of total nitrogen input via precipitation. Analytical methods for each Nr species are detailed in Supplementary Text S5. Wet deposition was monitored at seven of the nine sites; the GSNT and DZ sites were excluded due to their proximity (< 5 km) to the GS station to avoid spatial overlap.
The volume-weighted mean (VWM) concentration for each Nᵣ species was calculated for monthly and annual periods using Eq. (8):
$ {C}_{VWM}=\sum \nolimits_{i=1}^{k}({C}_{i}\times {P}_{i})/\sum \nolimits_{i=1}^{k}{P}_{i} $ (8) where, Cvwm is the VWM concentration (mg N L−1); Ci represents the concentration in the i-th precipitation sample; Pi denotes the rainfall depth (mm) for the i-th event; and k is the total number of samples in the period.
The wet deposition flux was subsequently calculated using Eq. (9)
$ {F}_{w}={C}_{VWM}{P}_{t}/100 $ (9) where, Fw is the wet deposition flux (kg N ha−1); Pt is the total precipitation (mm) for the period; and 100 is the unit conversion factor.
Quality assurance and quality control
-
The accuracy of the analytical methods was verified using standard reference materials. Recovery rates for total nitrogen (TN), NH4+-N, and NO3−-N were 92%–126%, 88%–106%, and 91%–112%, respectively (Supplementary Fig. S3). To ensure precision, all dry deposition filters and precipitation samples were analyzed in triplicate. Final concentrations and fluxes are reported as the mean ± standard deviation, with the relative standard deviation for all replicates being less than 10%.
Statistical analysis
-
One-way analysis of variance (ANOVA) followed by Duncan's post-hoc test was employed to identify statistically significant differences in Nr species concentrations, and fluxes across temporal (e.g., monthly, seasonal) and spatial scales. All descriptive statistical analyses and graphical work were performed using Origin 9.1 (OriginLab Corporation, USA), and SPSS 11.5 (SPSS Inc., USA).
-
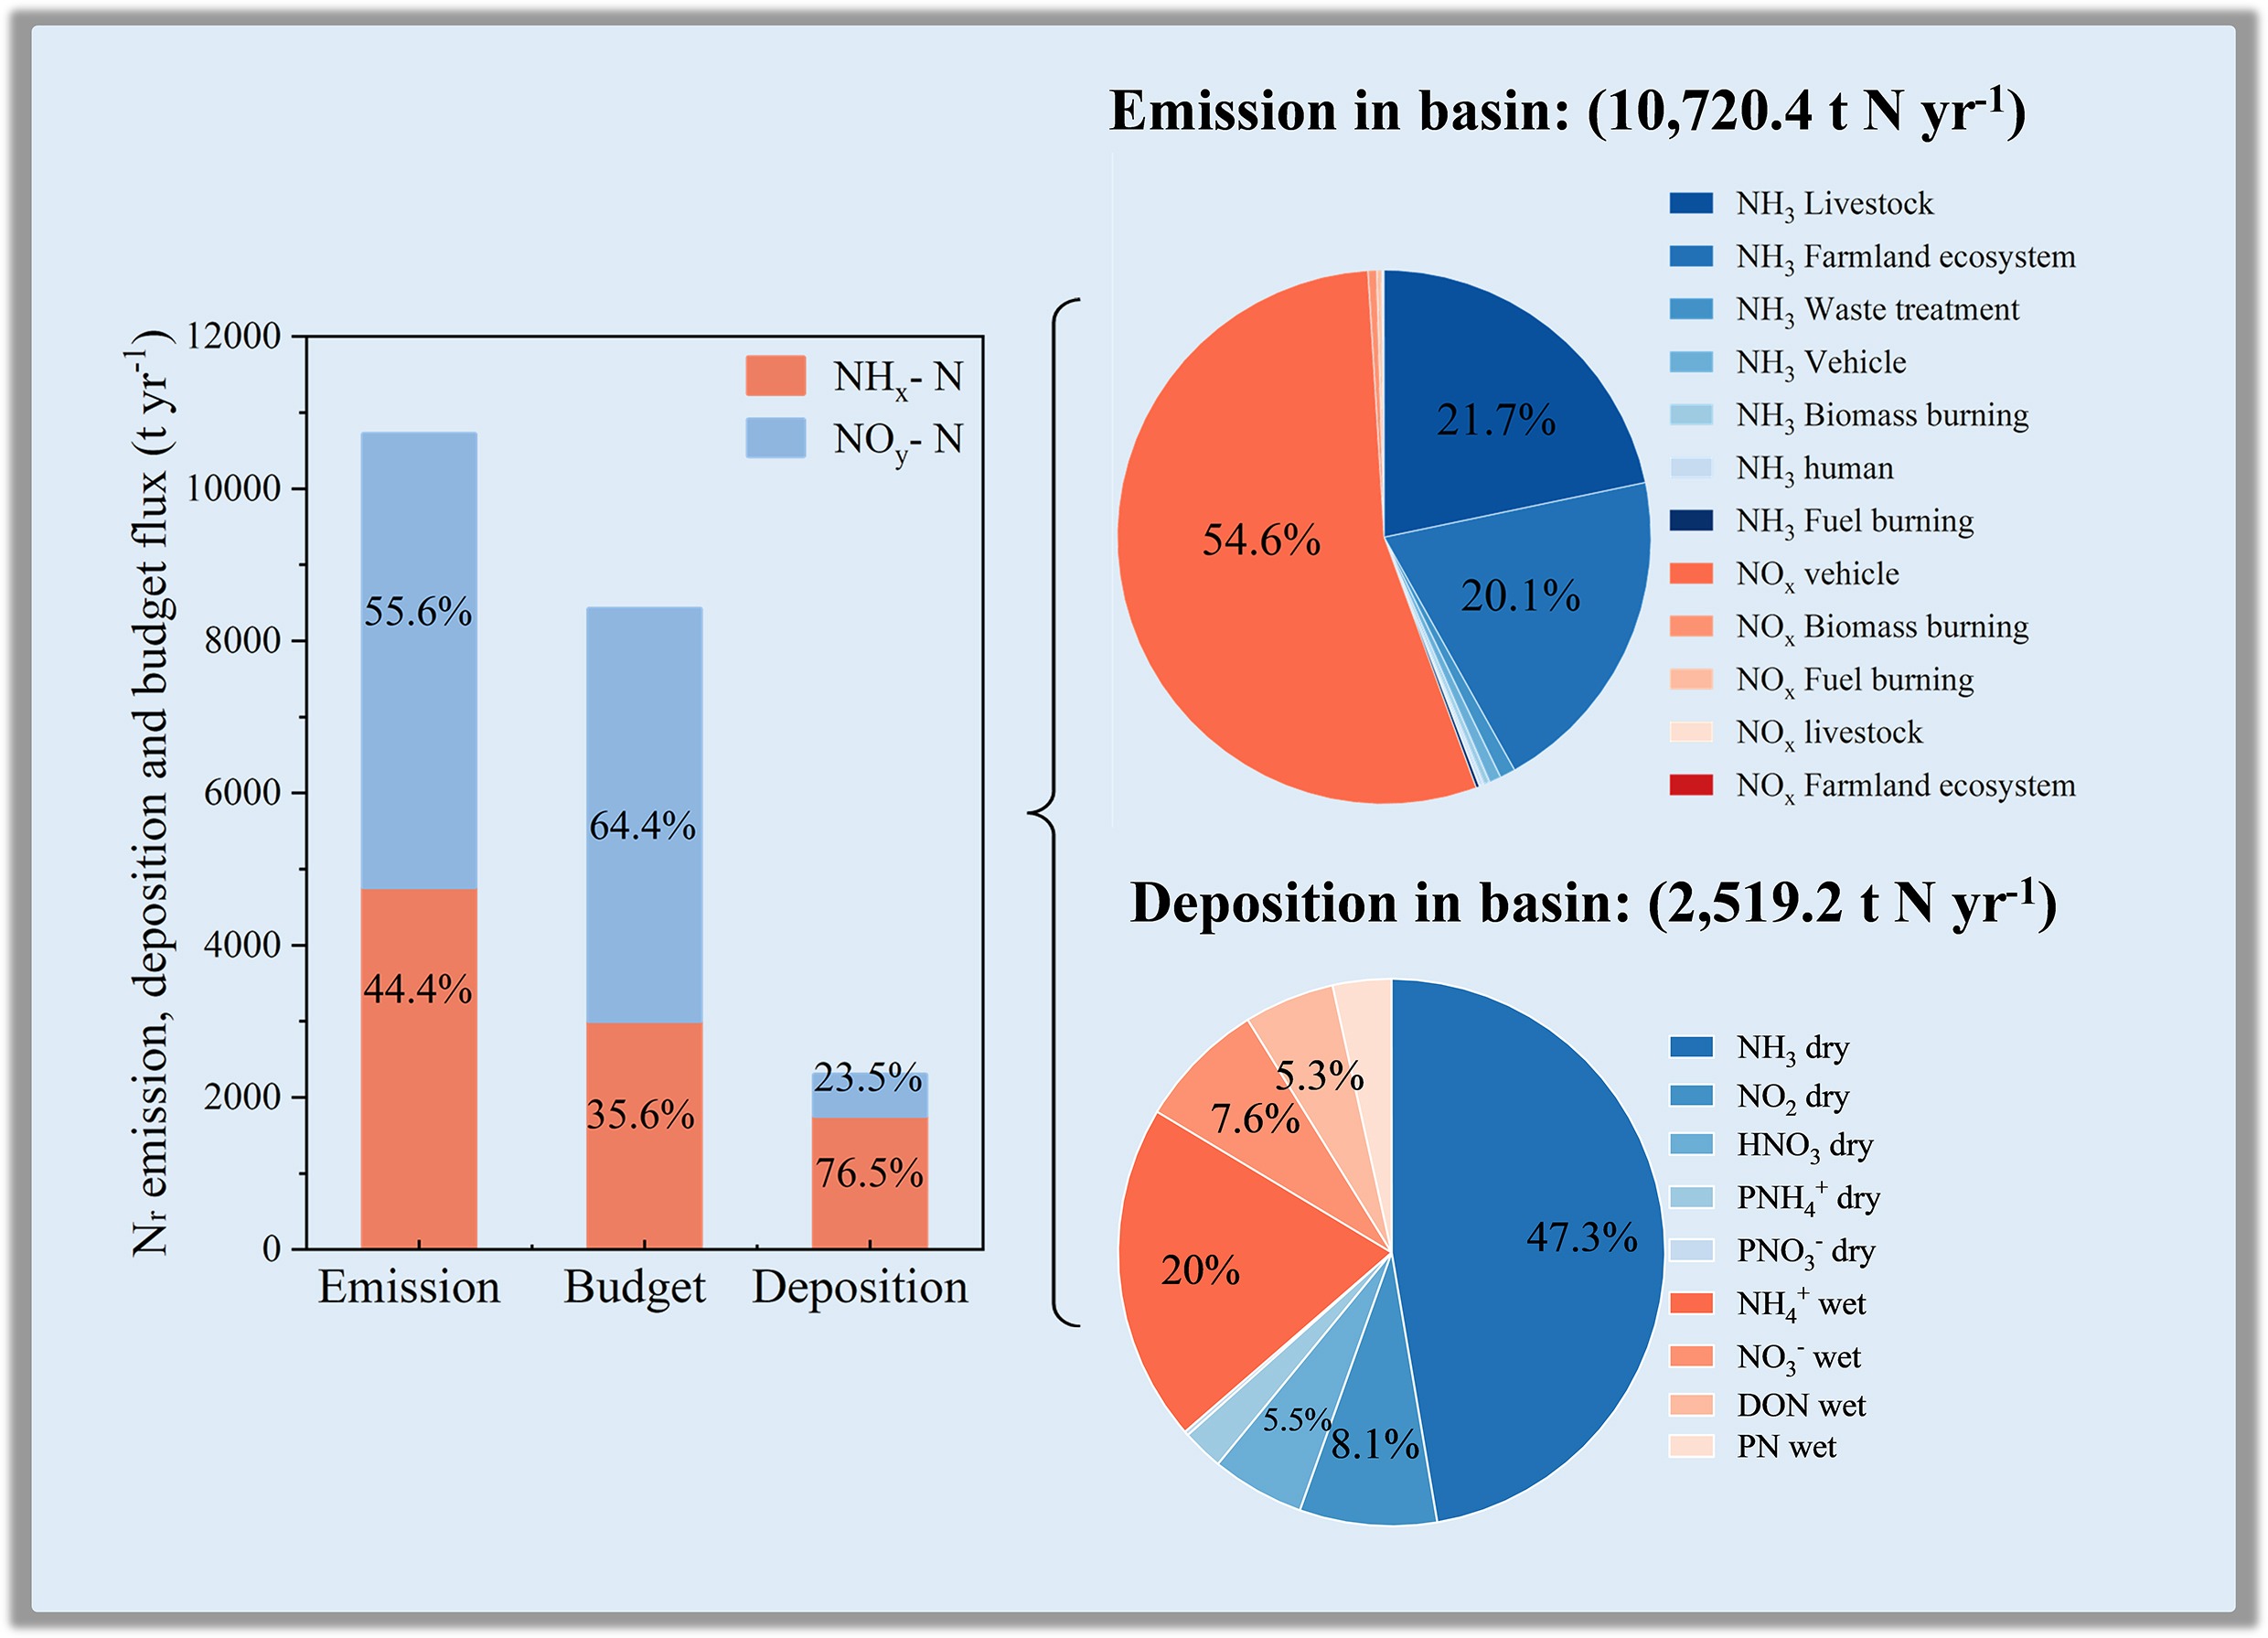
In 2022, the total atmospheric Nr emissions from the ELB were estimated at 10,720.4 tonnes (t), comprising 4,758.6 t of NH3-N (44.4%), and 5,961.8 t of NOx-N (55.6%) (Fig. 2).
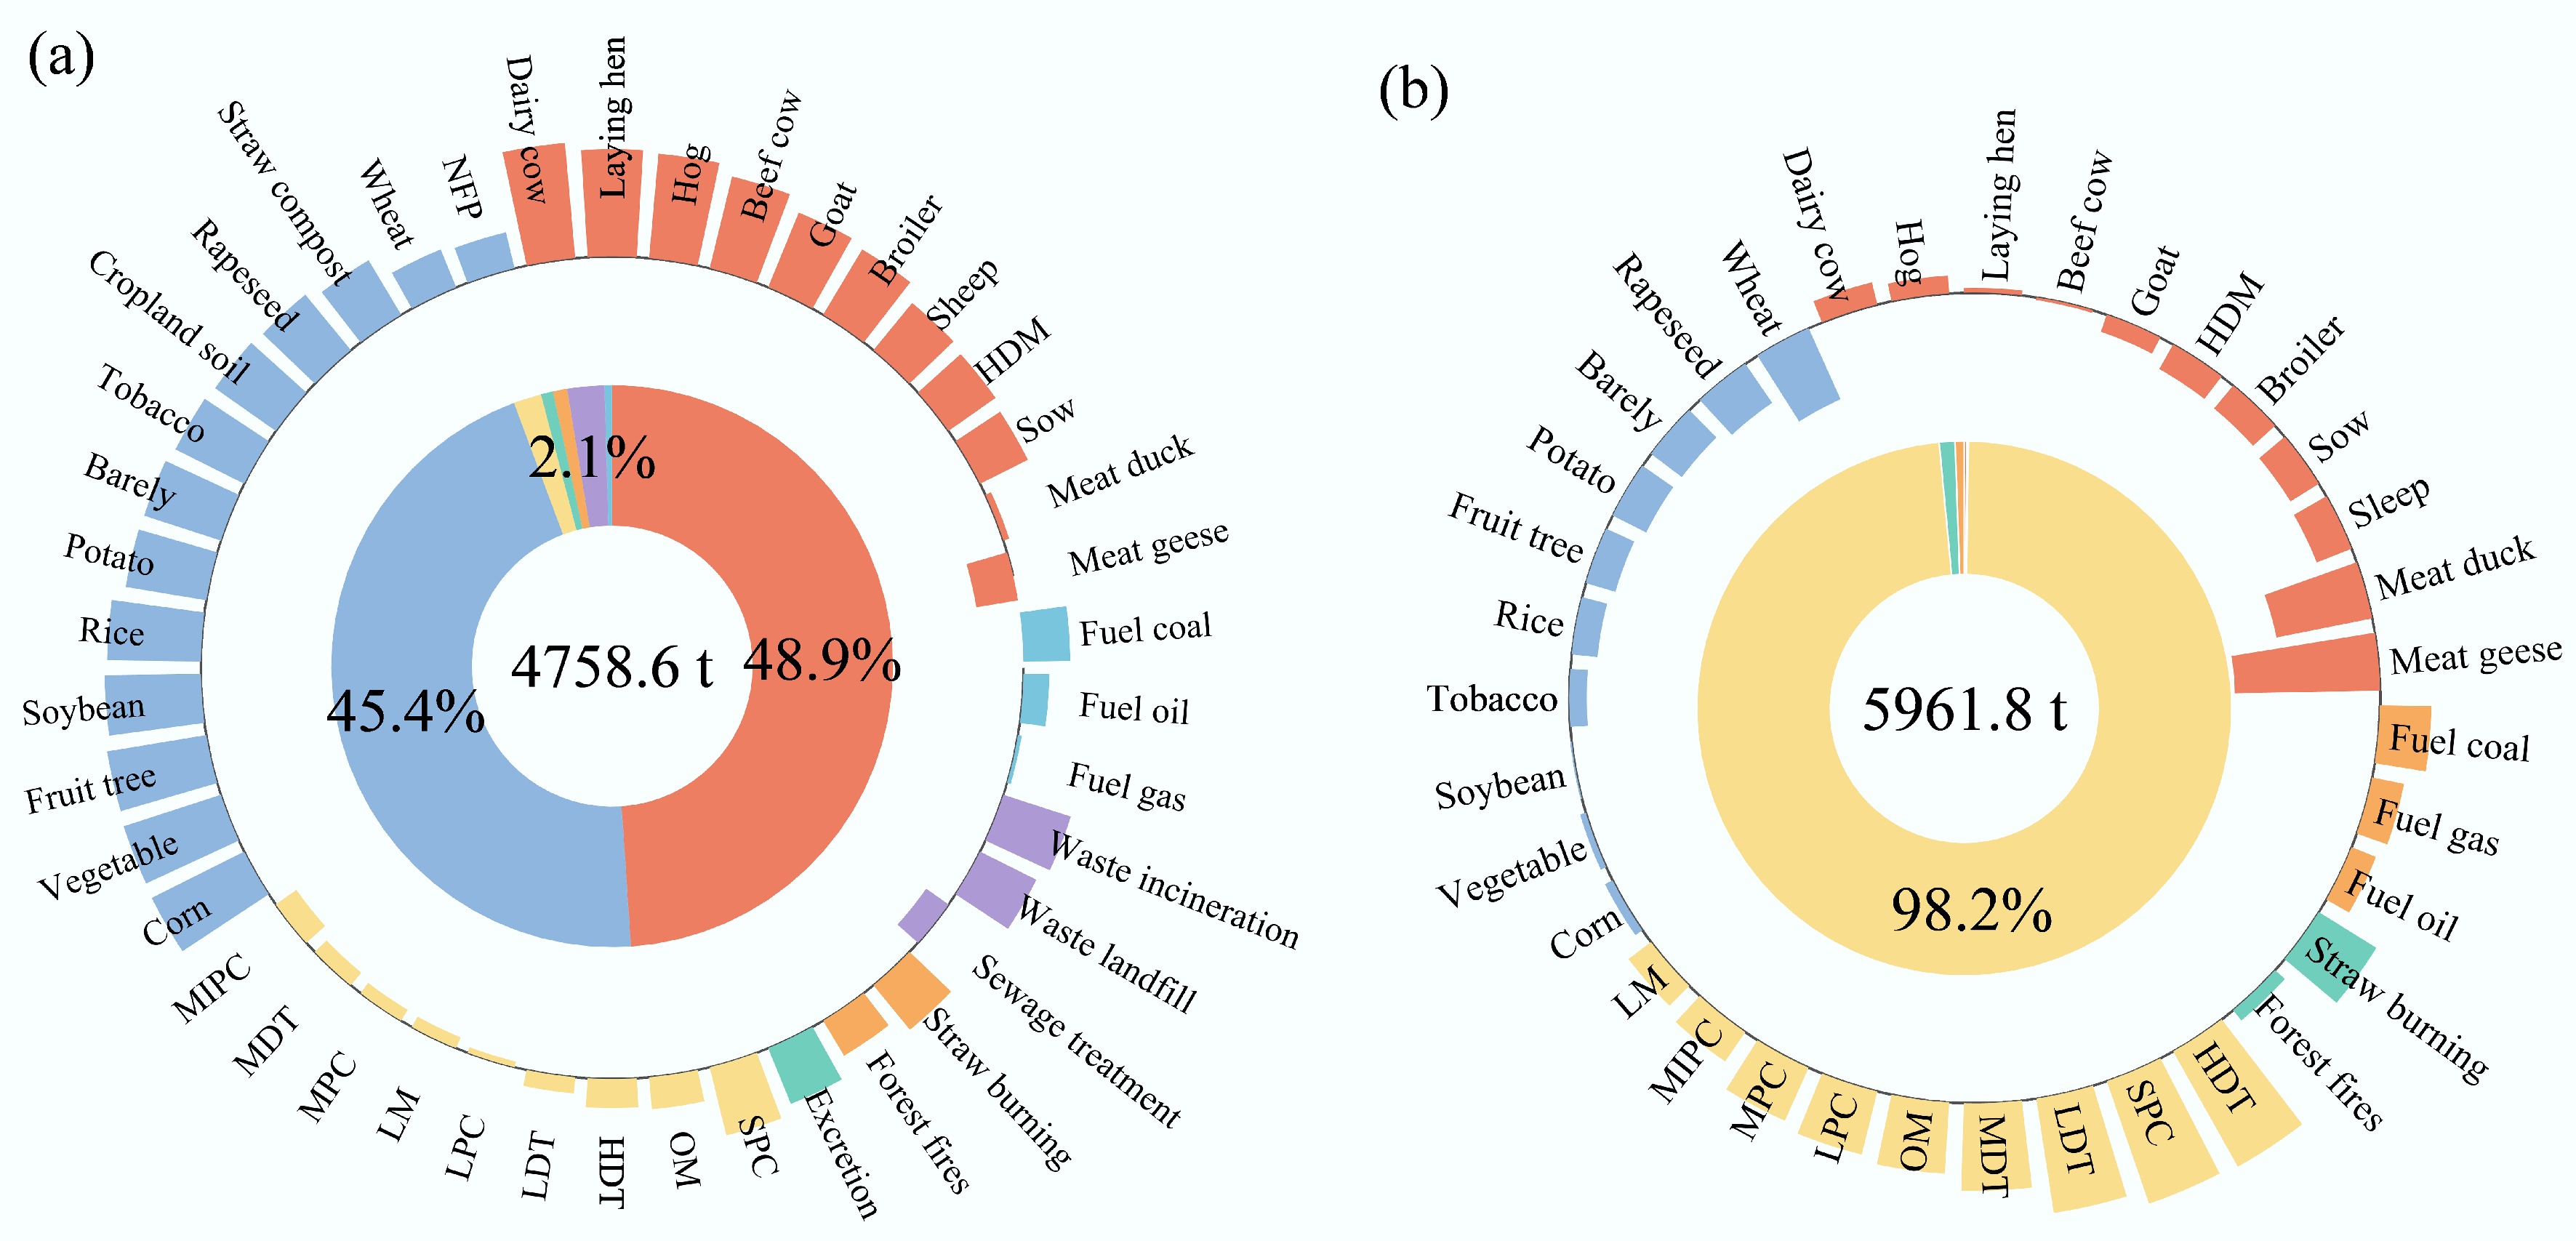
Figure 2.
Source apportionment of (a) NH3-N and (b) NOx-N emissions in the Erhai Lake Basin for 2022. The outer ring displays the emission rates for all sub-categories (bar heights correspond to log-transformed emissions). The inner ring illustrates the proportional contribution of primary sources to the total. LPC, large passenger cars; MPC, medium passenger cars; SPC, small passenger cars; MIPC, mini passenger cars; HTD, heavy-duty trucks; MTD, medium-duty trucks; LTD, light-duty trucks; OM, ordinary motorcycles; LM, light motorcycles; NFP, nitrogen-fixing plants; HDM, horses, donkeys, and mules.
Agriculture was the dominant source of NH3-N, collectively contributing 91.7% of the total. The livestock sector was the single largest contributor, emitting 2,328.5 t (48.9% of total NH3-N), with dairy cattle (843.2 t, 36.2% of livestock emissions), laying hens (22.0%), and hogs (19.2%) being the primary sources. The farmland ecosystem accounted for 2,159.4 t (45.4% of total NH3-N), overwhelmingly from fertilizer application (94.2% of farmland emissions). Corn, vegetables, fruit trees, soybeans, and rice were the principal crop sources, collectively responsible for 80.9% of fertilization emissions. Emissions from other sources, including vehicles, waste treatment, biomass burning, human waste, and fuel combustion, were minor (collectively < 5.7%) (Fig. 2a; Supplementary Table S11).
In stark contrast, the transportation sector accounted for 98.2% of NOx-N emissions (5,856.5 t). Contributions from all other sectors (farmland, livestock, biomass burning, and fuel combustion) were negligible (≤ 1% each). Within the vehicle fleet, heavy-duty trucks (HTD, 42.3%), small passenger cars (SPC, 36.1%), and light-duty trucks (LDT, 15.9%) were the primary emitters (Fig. 2b; Supplementary Table S11).
Spatial patterns
-
The spatial distributions of the dominant emission sources, i.e., NH3-N from farmland and livestock, and NOx-N from vehicles, are shown in Fig. 3. Together, these sources represented 96.5% of total Nr emissions.
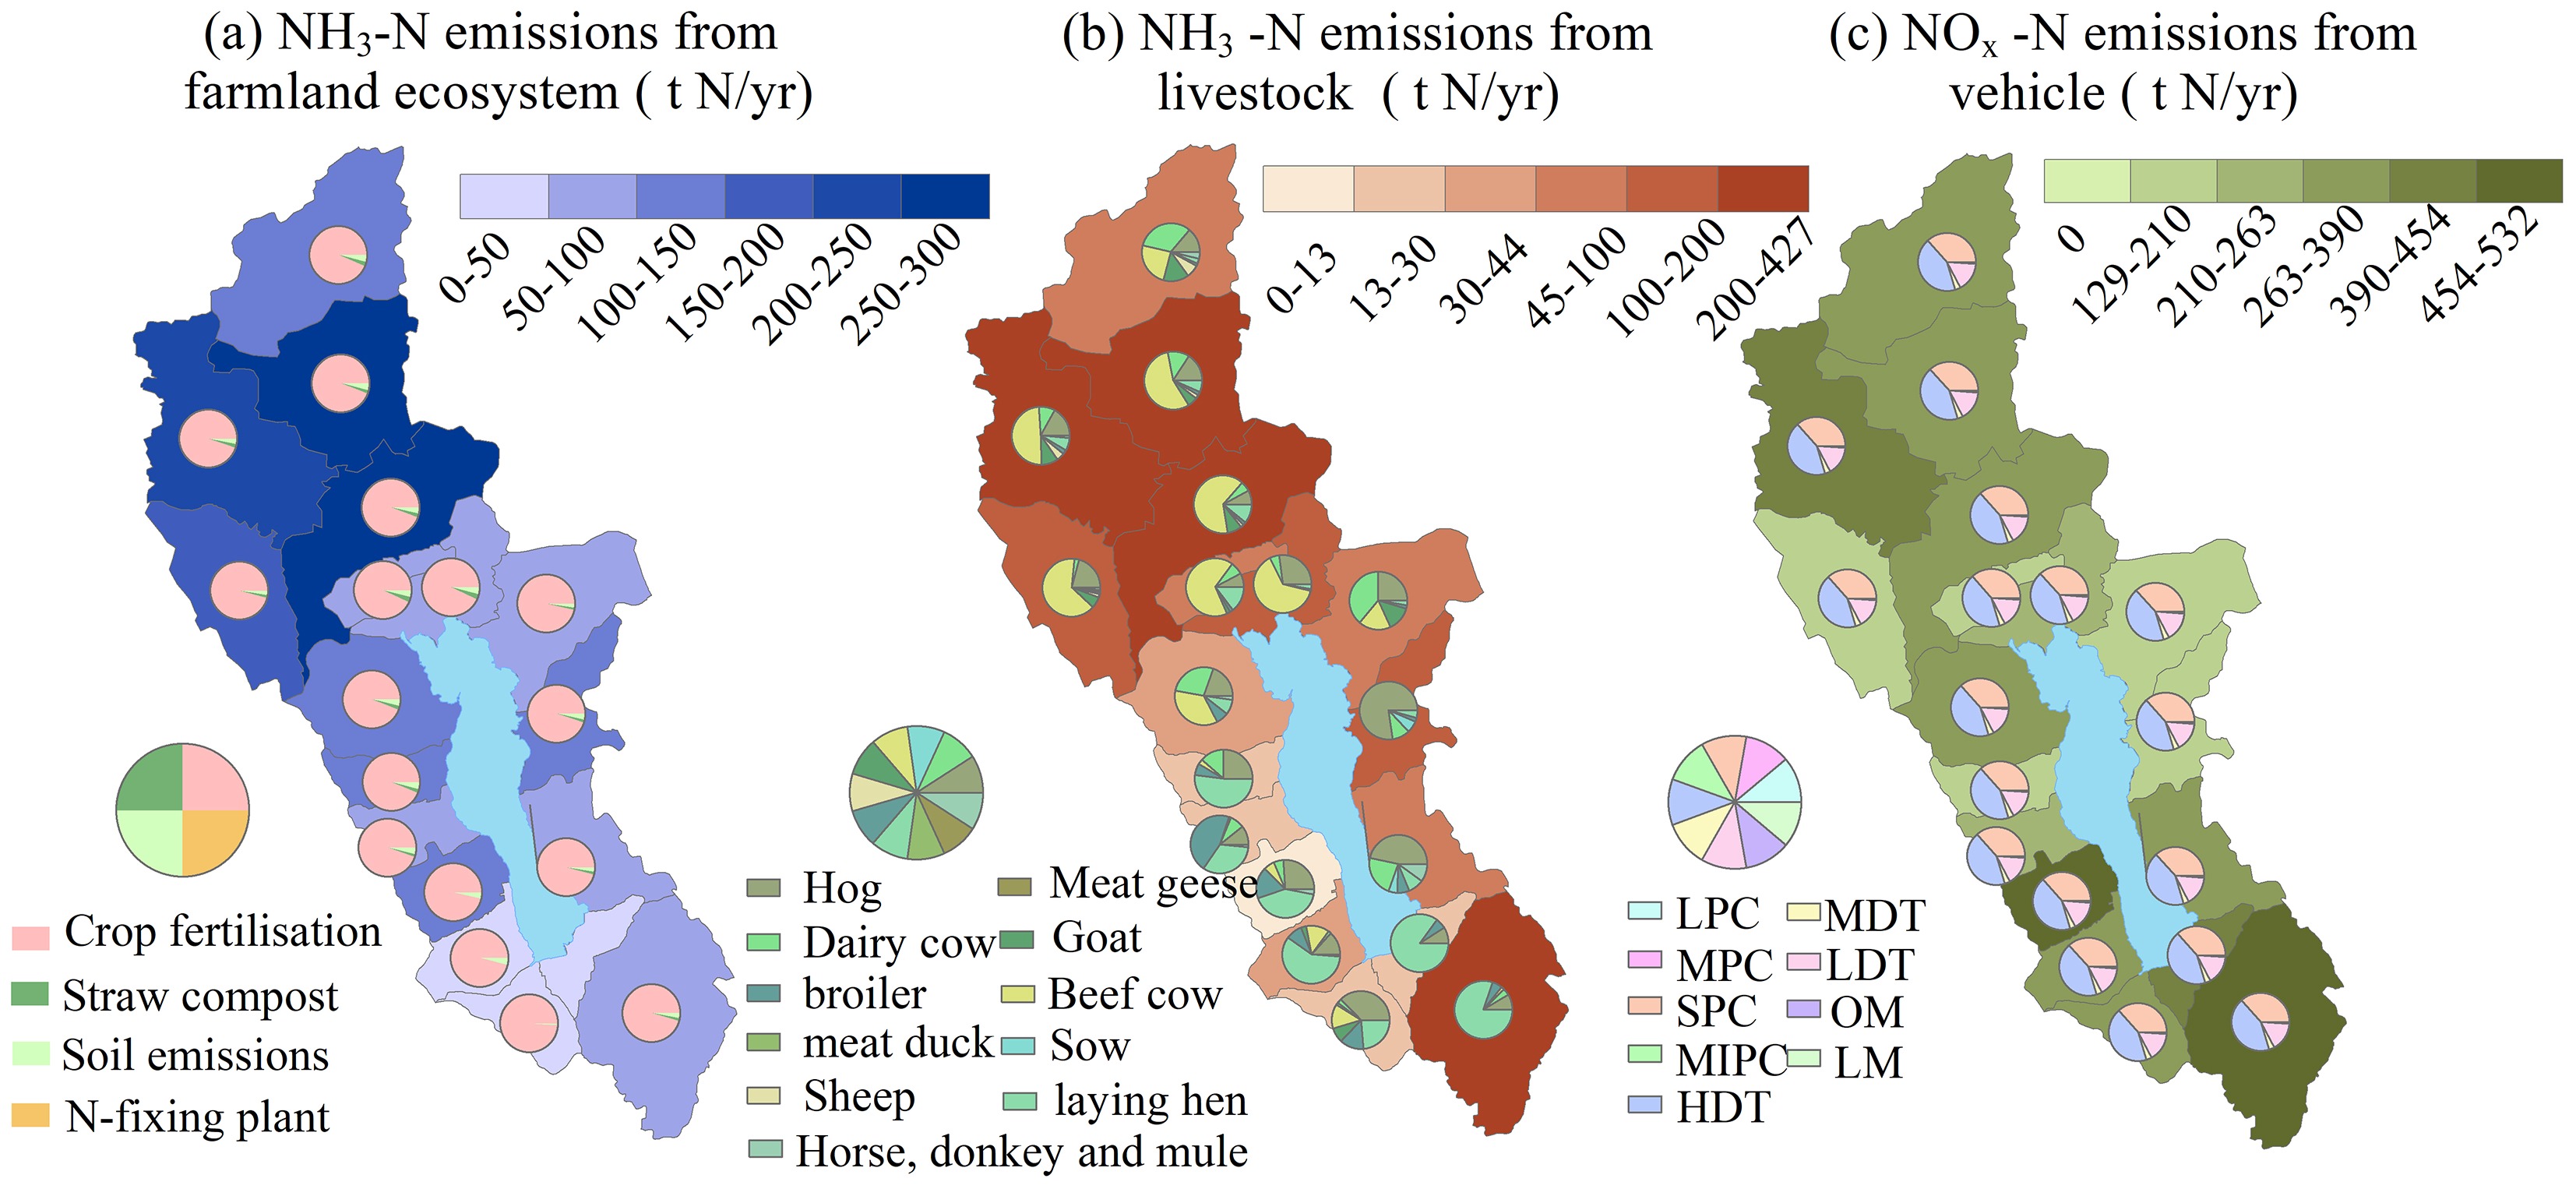
Figure 3.
Spatial distribution of (a) NH3-N emissions from the farmland ecosystem, (b) NH3-N emissions from livestock, and (c) NOx-N emissions from motor vehicles across townships in the Erhai Lake Basin. Emissions are presented as percentages of the total basin-wide emission for each respective source category.
Emissions of NH3-N from farmland were concentrated in the townships of Sanying (14.2%), Zibihu (12.6%), and Yousuo (11.0%) (Fig. 3a). Similarly, livestock NH3-N emissions were highest in Sanying (18.4%), Fengyi (17.2%), Yousuo (12.8%), and Zibihu (11.0%) (Fig. 3b). Consequently, the northern sub-region (Eryuan County) exhibited the most intense NH3-N emissions, consistent with its predominance of agricultural and livestock activities, in contrast to the more urbanized southern sub-region (Dali).
In contrast, NOx-N emissions from vehicles were more evenly distributed across the basin, with township contributions ranging from 2.2% to 9.1% (Fig. 3c). The highest contributions were observed in townships with major urban and transportation hubs, including Dali (9.1%), Fengyi (8.6%), Manjiang (7.8%), Zibihu (7.0%), Xiaguan (6.7%), and Taihe (6.3%).
Atmospheric Nr deposition
-
The annual mean concentrations and deposition fluxes of Nr species across the nine monitoring sites are summarized in Fig. 4. In ambient air, NH3 and NO2 were the dominant gaseous species, accounting for 47.5% and 40.9% of the total gaseous Nr concentration, respectively (Fig. 4a). In precipitation, NH4+-N was the major component of the volume-weighted mean (VWM) Nr concentration (53.6%), followed by NO3−-N (21.0%), DON (16.2%), and PN (9.2%) (Fig. 4b).
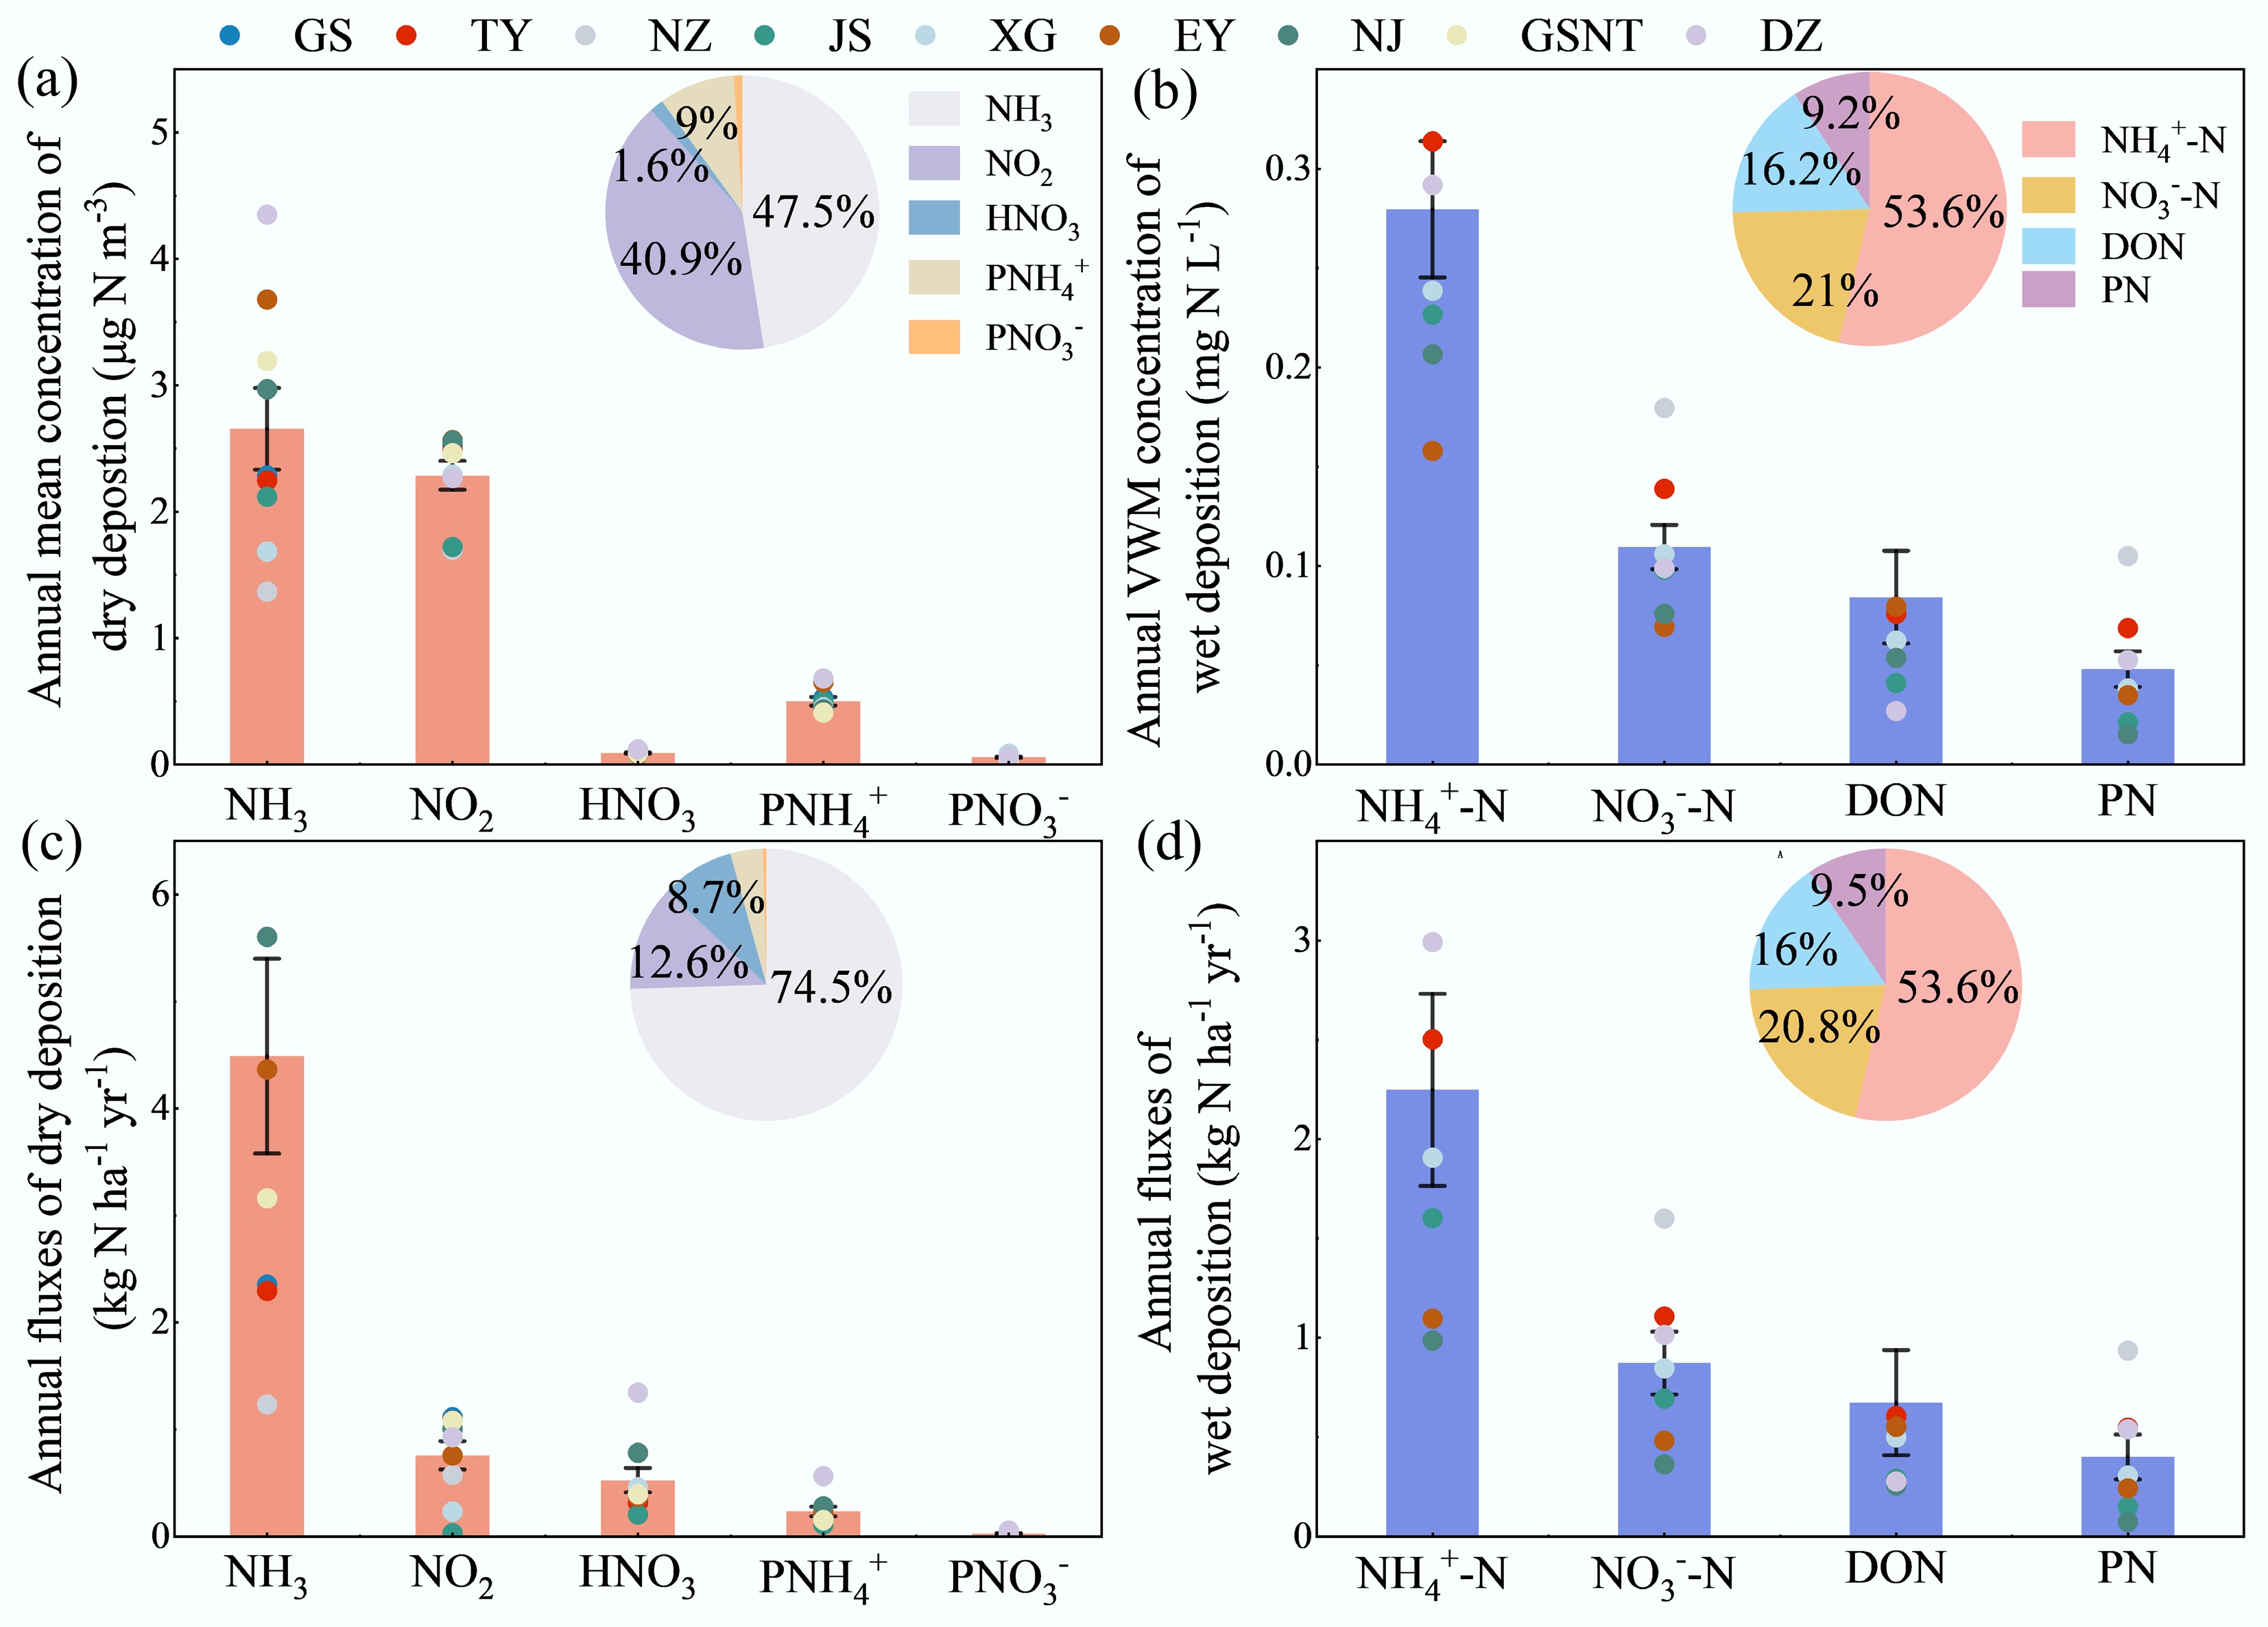
Figure 4.
Annual mean concentration and deposition fluxes of different Nr species in the Erhai Lake Basin (2023). (a), (c) Dry deposition: concentration and flux. (b), (d) Wet deposition: volume-weighted mean (VWM) concentration and flux. Data are presented as mean ± standard deviation across nine monitoring sites for dry deposition and seven sites for wet deposition.
Dry deposition was overwhelmingly dominated by NH3, which contributed 74.5% to the total dry flux (Fig. 4c). The composition of wet deposition fluxes generally reflected the VWM concentration pattern (Fig. 4b, d).
Spatially, the annual total Nr deposition averaged 10.4 ± 1.0 kg N ha−1 yr−1 across the basin, but exhibited considerable variability, ranging from 7.5 kg N ha−1 yr−1 at the JS site (a lake island with minimal direct influence) to 17.7 kg N ha−1 yr−1 at the NJ site (subject to combined urban and agricultural emissions) (Supplementary Table S12). Reduced nitrogen (NHx-N, the sum of NH3 and NH4+) was the dominant form in total deposition, constituting 68.9%. Dry deposition was the primary pathway, accounting for 58.2% of the total flux, compared to 41.8% for wet deposition (Fig. 5a).
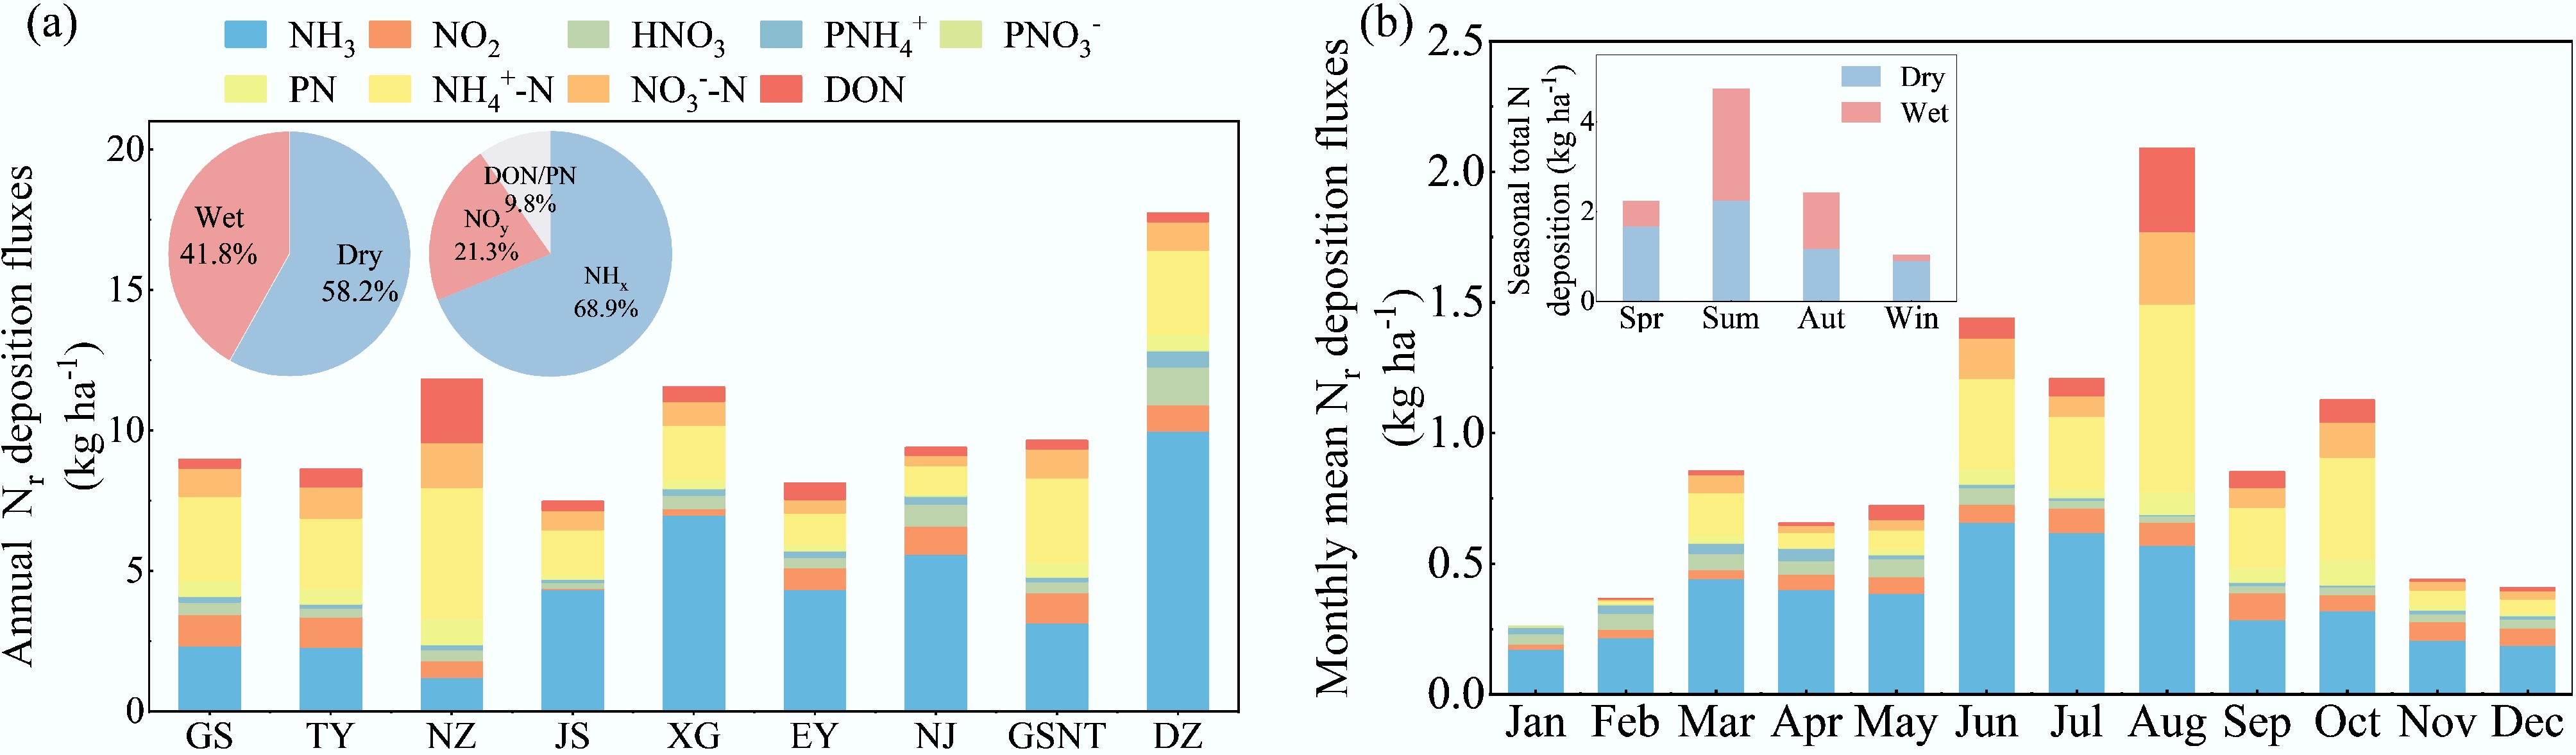
Figure 5.
Composition of atmospheric nitrogen deposition in the Erhai Lake Basin. (a) Proportions of different Nᵣ species in the annual total deposition (dry + wet) across all sites. (b) Monthly and seasonal variations in the contributions of different Nr species to total deposition, based on the average of all nine monitoring sites. Species groupings: NHx (sum of NH4+, NH3, and PNH4+); NOy (sum of NO3−, NO2, HNO3, and PNO3−); DON, dissolved organic nitrogen; PN, particulate nitrogen from wet deposition.
Monthly total Nᵣ deposition fluxes ranged from 0.3 to 2.1 kg N ha−1. NH3-N was consistently the largest contributor (48.0%), followed by NH4+-N (17.4%) and various oxidized nitrogen species (summing to ~23.3%). Seasonally, summer received the highest deposition, accounting for 45.4% of the annual total. Dry deposition was the predominant pathway in spring (75.3%) and winter (88.3%), while wet deposition predominated in summer (52.4%) and autumn (51.2%) (Fig. 5b).
Atmospheric Nr budget
-
The annual atmospheric Nr budget for the ELB, defined as emissions minus deposition, is presented in Table 1. A substantial surplus was evident for both NHx-N and NOy-N at the sub-regional level. The NHx-N budget was positive in both Dali (1,221.9 t yr−1), and Eryuan (1,779.8 t yr−1), indicating that NH3 emissions far exceeded reduced nitrogen deposition. Similarly, the NOy-N budget showed a large surplus of 3,821.7 t yr−1 in Dali and 1,599.1 t yr−1 in Eryuan.
Table 1. Atmospheric budgets of NHx, NOy, and total Nᵣ for Dali County, Eryuan County, and the entire Erhai Lake Basin (ELB)
Administrative scope Emission (E t yr−1) Deposition (D t yr−1) Budget (B t yr−1) Budget of Total Nr
(t yr−1)NH3 NOx NHx NOy NHx NOy Dali (DL) 2,209.8 4,130.0 987.9 308.3 1,221.9 3,821.7 4,890.8 Eryuan (EY) 2,548.8 1,831.8 769 232.7 1,779.8 1,599.1 3,310.4 Erhai Lake Basin (ELB) 4,758.6 5,961.8 1,756.9 541 3,001.7 5,420.8 8,201.2 (1) Budget (B) for NHx and NOy is calculated as B = E − D. (2) Budget of Total Nᵣ (BTN) is calculated as BTN = (NHx Budget + NOy Budget) − (Wet deposition of particulate N + Wet deposition of dissolved organic N). This represents the net atmospheric surplus after accounting for the major deposition pathways of emitted N. (3) DL, EY, and ELB denote Dali County, Eryuan County, and the entire Erhai Lake Basin, respectively. After accounting for the wet deposition of particulate and organic nitrogen (PN + DON), the total Nᵣ budget (BTN) remained strongly positive: 4,890.8 t yr−1 for Dali and 3,310.4 t yr−1 for Eryuan. Integrated across the entire basin, the ELB was a clear net source of atmospheric Nr, with a total surplus of 8,201.2 t yr−1. This net emission was composed of surpluses of 3,001.7 t yr−1 for NHx-N and 5,420.8 t yr−1 for NOy-N. The consistent surpluses across all major nitrogen pools and sub-regions unequivocally demonstrate that the ELB acts as a significant net source of atmospheric reactive nitrogen.
-
The present analysis reveals that the ELB is a hotspot of atmospheric Nᵣ emissions. The estimated emission intensities for NH3-N (18.6 kg ha−1 yr−1) and NOₓ-N (23.2 kg ha−1 yr−1) substantially exceed the national averages and are approximately 2.2 and 2.4 times higher than the corresponding averages for Yunnan Province[38,39]. This finding is robust and corroborated by a local-scale study that reported a similarly high NH3-N emission intensity (20.3 kg ha−1 yr−1) in a sub-catchment of the ELB[40].
Agriculture was the unequivocal dominant source of NH3-N, responsible for 91.7% of the total. Livestock production (48.9%) and fertilizer application (42.8%) contributed almost equally to the agricultural NH3 budget (Fig. 2), a pattern consistent with national-scale emission profiles[41]. Within these categories, dairy cattle (36.2% of livestock emissions) and layer hens (22.0%) were the principal livestock sources, while maize (20.2%) and vegetables (18.9%) were the dominant crop sources, aligning with findings from a recent local study[40]. In stark contrast, the transportation sector overwhelmingly dominated NOx-N emissions (98.2%), primarily from heavy-duty trucks (42.3%) and light-duty passenger vehicles (36.1%). This emission profile is consistent with national vehicle inventories[39], highlighting the growing influence of traffic in the region.
Characteristics and ecological impact of atmospheric deposition in the Erhai Lake Basin
-
Despite substantial Nr emissions, the corresponding atmospheric deposition flux in the ELB was relatively low. Our measured total Nᵣ deposition (10.4 kg N ha−1 yr−1) is consistent with a previous estimate for this basin (10.67 kg N ha−1 yr−1)[25] but is considerably lower than the national average and values reported for other heavily impacted Chinese lake basins, such as Taihu (64.8 kg N ha−1 yr−1) and Dongting (48.0 kg N ha−1 yr−1)[13,42,43]. It is also lower than deposition fluxes reported for Lake Dianchi, Chaohu, and Qinghai Lake[44−47].
Nevertheless, atmospheric deposition constitutes a critical nitrogen source to Erhai Lake. Historical data indicate that wet deposition contributed 183.3 t N in 2019, accounting for 20.0% of the annual riverine input[48]. Kang et al. estimated total atmospheric deposition to the lake at 218 t N, representing 17% of the total external nitrogen load[25]. The present study yields a comparable total deposition estimate of 277 t N to the lake surface. When viewed against the riverine input, this constitutes a significant contribution of 33.5%[48], a share remarkably similar to that reported for the highly polluted Lake Taihu (33.3%)[42]. This finding underscores that even in regions with moderate per-area deposition, the atmosphere can be a significant pathway for nitrogen loading in aquatic ecosystems, a point critical for managing lake eutrophication.
Environmental implications of atmospheric Nr budgets in the Erhai Lake Basin
-
The atmospheric Nᵣ budget unequivocally identifies the ELB as a substantial net source to the atmosphere. Local deposition offset only 23.5% of total emissions, revealing a stark contrast between the fate of reduced and oxidized nitrogen: 36.9% of emitted NHx was deposited locally, compared to a mere 9.1% of emitted NOy. This indicates that a large fraction of the emitted Nr, particularly NOy, is exported from the basin[49]. The dominance of reduced nitrogen in deposition, despite higher NOy emissions, is explained by two key factors: firstly, the higher local deposition-to-emission ratio for NHx; and secondly, a national-scale shift towards reduced N deposition, driven by more effective NOₓ control policies compared to less regulated agricultural NH3 emissions.
The exceptionally low deposition-to-emission ratio is likely a consequence of the unique 'alpine-lake-valley' topography. This complex terrain drives a robust diurnal mountain-valley breeze circulation. We hypothesize that this circulation entraps air masses, including Nr species, in periodic vertical loops[36,49], thereby prolonging their atmospheric residence time. This mechanism enhances the potential for long-range transport of pollutants, particularly the more stable NOy compounds, over immediate local deposition. Furthermore, the extended residence time provides a crucial window for the formation of secondary particulate matter (e.g., ammonium nitrate and sulfate) in the atmosphere, potentially exacerbating regional fine particulate pollution downwind[50,51].
The spatial decoupling between emissions and deposition is a common phenomenon in atmospheric chemistry. Globally, a significant portion of terrestrially emitted Nᵣ is transported and deposited in marine ecosystems[15]. Our finding of a low local retention (23.5%) is more pronounced than the 44.7% reported for another subtropical agricultural watershed[15], highlighting the unique efficiency of the ELB in exporting Nr. This is further supported by a spatial correlation analysis between township-level emission intensities and deposition fluxes at nearby sites, which showed no significant positive relationship (Supplementary Fig. S4). This lack of correlation corroborates that local emission hotspots do not necessarily dictate local deposition patterns, reinforcing the hypothesis that the complex circulation facilitates the export of a large fraction of emitted Nᵣ from the basin.
Uncertainty analysis
-
Several sources of uncertainty in the budget calculation warrant discussion. The most apparent is the temporal discrepancy between the emission (2022) and deposition (2023) inventories, necessitated by data availability. However, it was found that this does not invalidate the core conclusion of a significant net source, as no major structural changes in emission sources occurred between these years, and the calculated surplus (8,201.2 t N yr−1) is too substantial to be bridged by inter-annual variability alone. Furthermore, the inclusion of PN in wet deposition might lead to a slight overestimation, as PN can contain non-reactive nitrogen from crustal dust.
The emission inventories are subject to uncertainties in both activity data and EFs. Activity data, sourced from official statistics and detailed surveys, are associated with relatively low uncertainty (CV ~5%–10%). In contrast, EFs, primarily derived from the literature rather than localized measurements, contribute more significantly to the overall uncertainty[16]. Error propagation analysis estimated the total uncertainties at ± 10.6% for NH3 and ± 11.4% for NOx, the latter dominated by the vehicle sector (see Supplementary Text S6 and Supplementary Tables S13−S19)[52].
The deposition estimates also have potential biases. The monitoring network, while representative of major land-use types, may not fully capture deposition in underrepresented areas such as forests, potentially leading to spatial averaging bias. Our dry deposition estimate does not include organic nitrogen, which has been reported to constitute about 1.1% of total dry N deposition in this region[25]. Additionally, the inferential method for dry deposition, particularly for NH3, is subject to uncertainty due to the complex, bi-directional nature of ammonia exchange[20].
While this study represents a significant advancement in quantifying the Nr budget for a plateau lake basin, future work should prioritize developing localized EFs, incorporating organic N into dry deposition measurements, and applying chemical transport models to better constrain the fate of exported Nr.
-
This study establishes the comprehensive atmospheric Nr budget for the ELB, a representative subtropical plateau lake ecosystem in China. The present analysis unequivocally demonstrates that the ELB is a significant net source of atmospheric Nr, with annual emissions of 10,720.4 t far surpassing local deposition, yielding a substantial budget surplus of 8,201.2 t N yr−1. Source apportionment revealed a clear divergence: NH3-N emissions were overwhelmingly agricultural in origin (91.7%), with nearly equal contributions from livestock farming (48.9%) and synthetic fertilizer application (42.8%). In contrast, NOx-N emissions were almost entirely (98.2%) attributable to the transportation sector. Atmospheric deposition, averaging 10.4 kg N ha−1 yr−1, was predominantly in the form of reduced nitrogen (NHx-N, 68.9%). The pronounced net emission status, likely enhanced by the unique 'alpine-lake-valley' topography that promotes pollutant export, highlights the imperative for integrated mitigation strategies. Effective policy must concurrently address both primary sources: through improved manure management and precision fertilization in agriculture, and via the promotion of clean vehicles and stricter emission standards in transportation.
To refine future assessments and quantify the downstream impacts, three research priorities are recommended: (1) development of locally validated emission factors; (2) inclusion of organic nitrogen in comprehensive deposition monitoring; and (3) application of chemical transport models to track the regional fate and environmental consequences of the exported Nr.
-
It accompanies this paper at: https://doi.org/10.48130/nc-0025-0018.
-
Not applicable.
-
The authors confirm their contributions to the paper as follows: Qikun Shen: analysis and interpretation of results; Bowen Tang: methodology; Xinyu Wu, Jiahui Kang: data collection; Qikun Shen, Bowen Tang, Xinyu Wu: draft manuscript preparation and figure visualization; Jiawei Li, Yuepeng Pan, Xuejun Liu: writing − review and guidance; Wen Xu: study conception and design and draft revision. All authors were involved in the discussion of the data, and the revision of the manuscript.
-
The datasets used or analyzed during the current study are available from the corresponding author upon reasonable requests.
-
This work was supported by the Major Science and Technology Project of Yunnan Province (Grant No. 202202AE090034), the National Natural Science Foundation of China (Grant No. 42175137), and the National Key Research and Development Program of China (Grant No. 2021YFD1700902).
-
The authors declare that they have no conflict of interest.
-
# Authors contributed equally: Qikun Shen, Bowen Tang, Xinyu Wu
Full list of author information is available at the end of the article. - The supplementary files can be downloaded from here.
- Copyright: © 2026 by the author(s). Published by Maximum Academic Press, Fayetteville, GA. This article is an open access article distributed under Creative Commons Attribution License (CC BY 4.0), visit https://creativecommons.org/licenses/by/4.0/.
-
About this article
Cite this article
Shen Q, Tang B, Wu X, Kang J, Li J, et al. 2026. A large net source revealed by the atmospheric reactive nitrogen budget in a subtropical plateau lake basin, southwest China. Nitrogen Cycling 2: e006 doi: 10.48130/nc-0025-0018 

A large net source revealed by the atmospheric reactive nitrogen budget in a subtropical plateau lake basin, southwest China
- Received: 25 October 2025
- Revised: 30 November 2025
- Accepted: 19 December 2025
- Published online: 19 January 2026
Abstract: Quantifying the source–sink budget of atmospheric reactive nitrogen (Nr) is crucial for mitigating Nᵣ pollution in vulnerable lake ecosystems. Here, a comprehensive analysis of the atmospheric Nr budget in the Erhai Lake Basin (ELB) (a subtropical plateau lake in southwestern China) is presented. Emission of ammonia (NH3) and nitrogen oxides (NOx) for 2022 emissions were estimated using detailed activity data and localized emission factors, while dry and wet Nr deposition in 2023 was quantified through a nine-site monitoring network. The one-year difference, necessitated by data availability, does not affect the core conclusions, given the stability of the fundamental emission source structure. Total atmospheric Nr emissions were estimated at 10,720.4 t N yr−1, dominated by NOx-N (55.6%), followed by NH3-N (44.4%). Agriculture was the primary source of NH3-N (91.7%), with nearly equal contributions from livestock (48.9%) and fertilization (42.8%). In contrast, the transportation sector dominated NOx-N emissions (98.2%). Annual Nr deposition averaged 10.4 kg N ha−1 yr−1, predominantly in the reduced form (NHx-N, 68.9%). The net atmospheric Nr budget revealed a substantial surplus of 8,201.2 t N yr−1, unequivocally identifying the ELB as a significant net source. The present results underscore the imperative for integrated mitigation strategies that concurrently address emissions from agricultural and vehicles to alleviate regional Nᵣ pollution.
-
Key words:
- Nitrogen cycling /
- Ammonia emissions /
- Nitrogen oxides /
- Atmospheric deposition /
- Source-sink budget /
- Erhai Lake basin