-
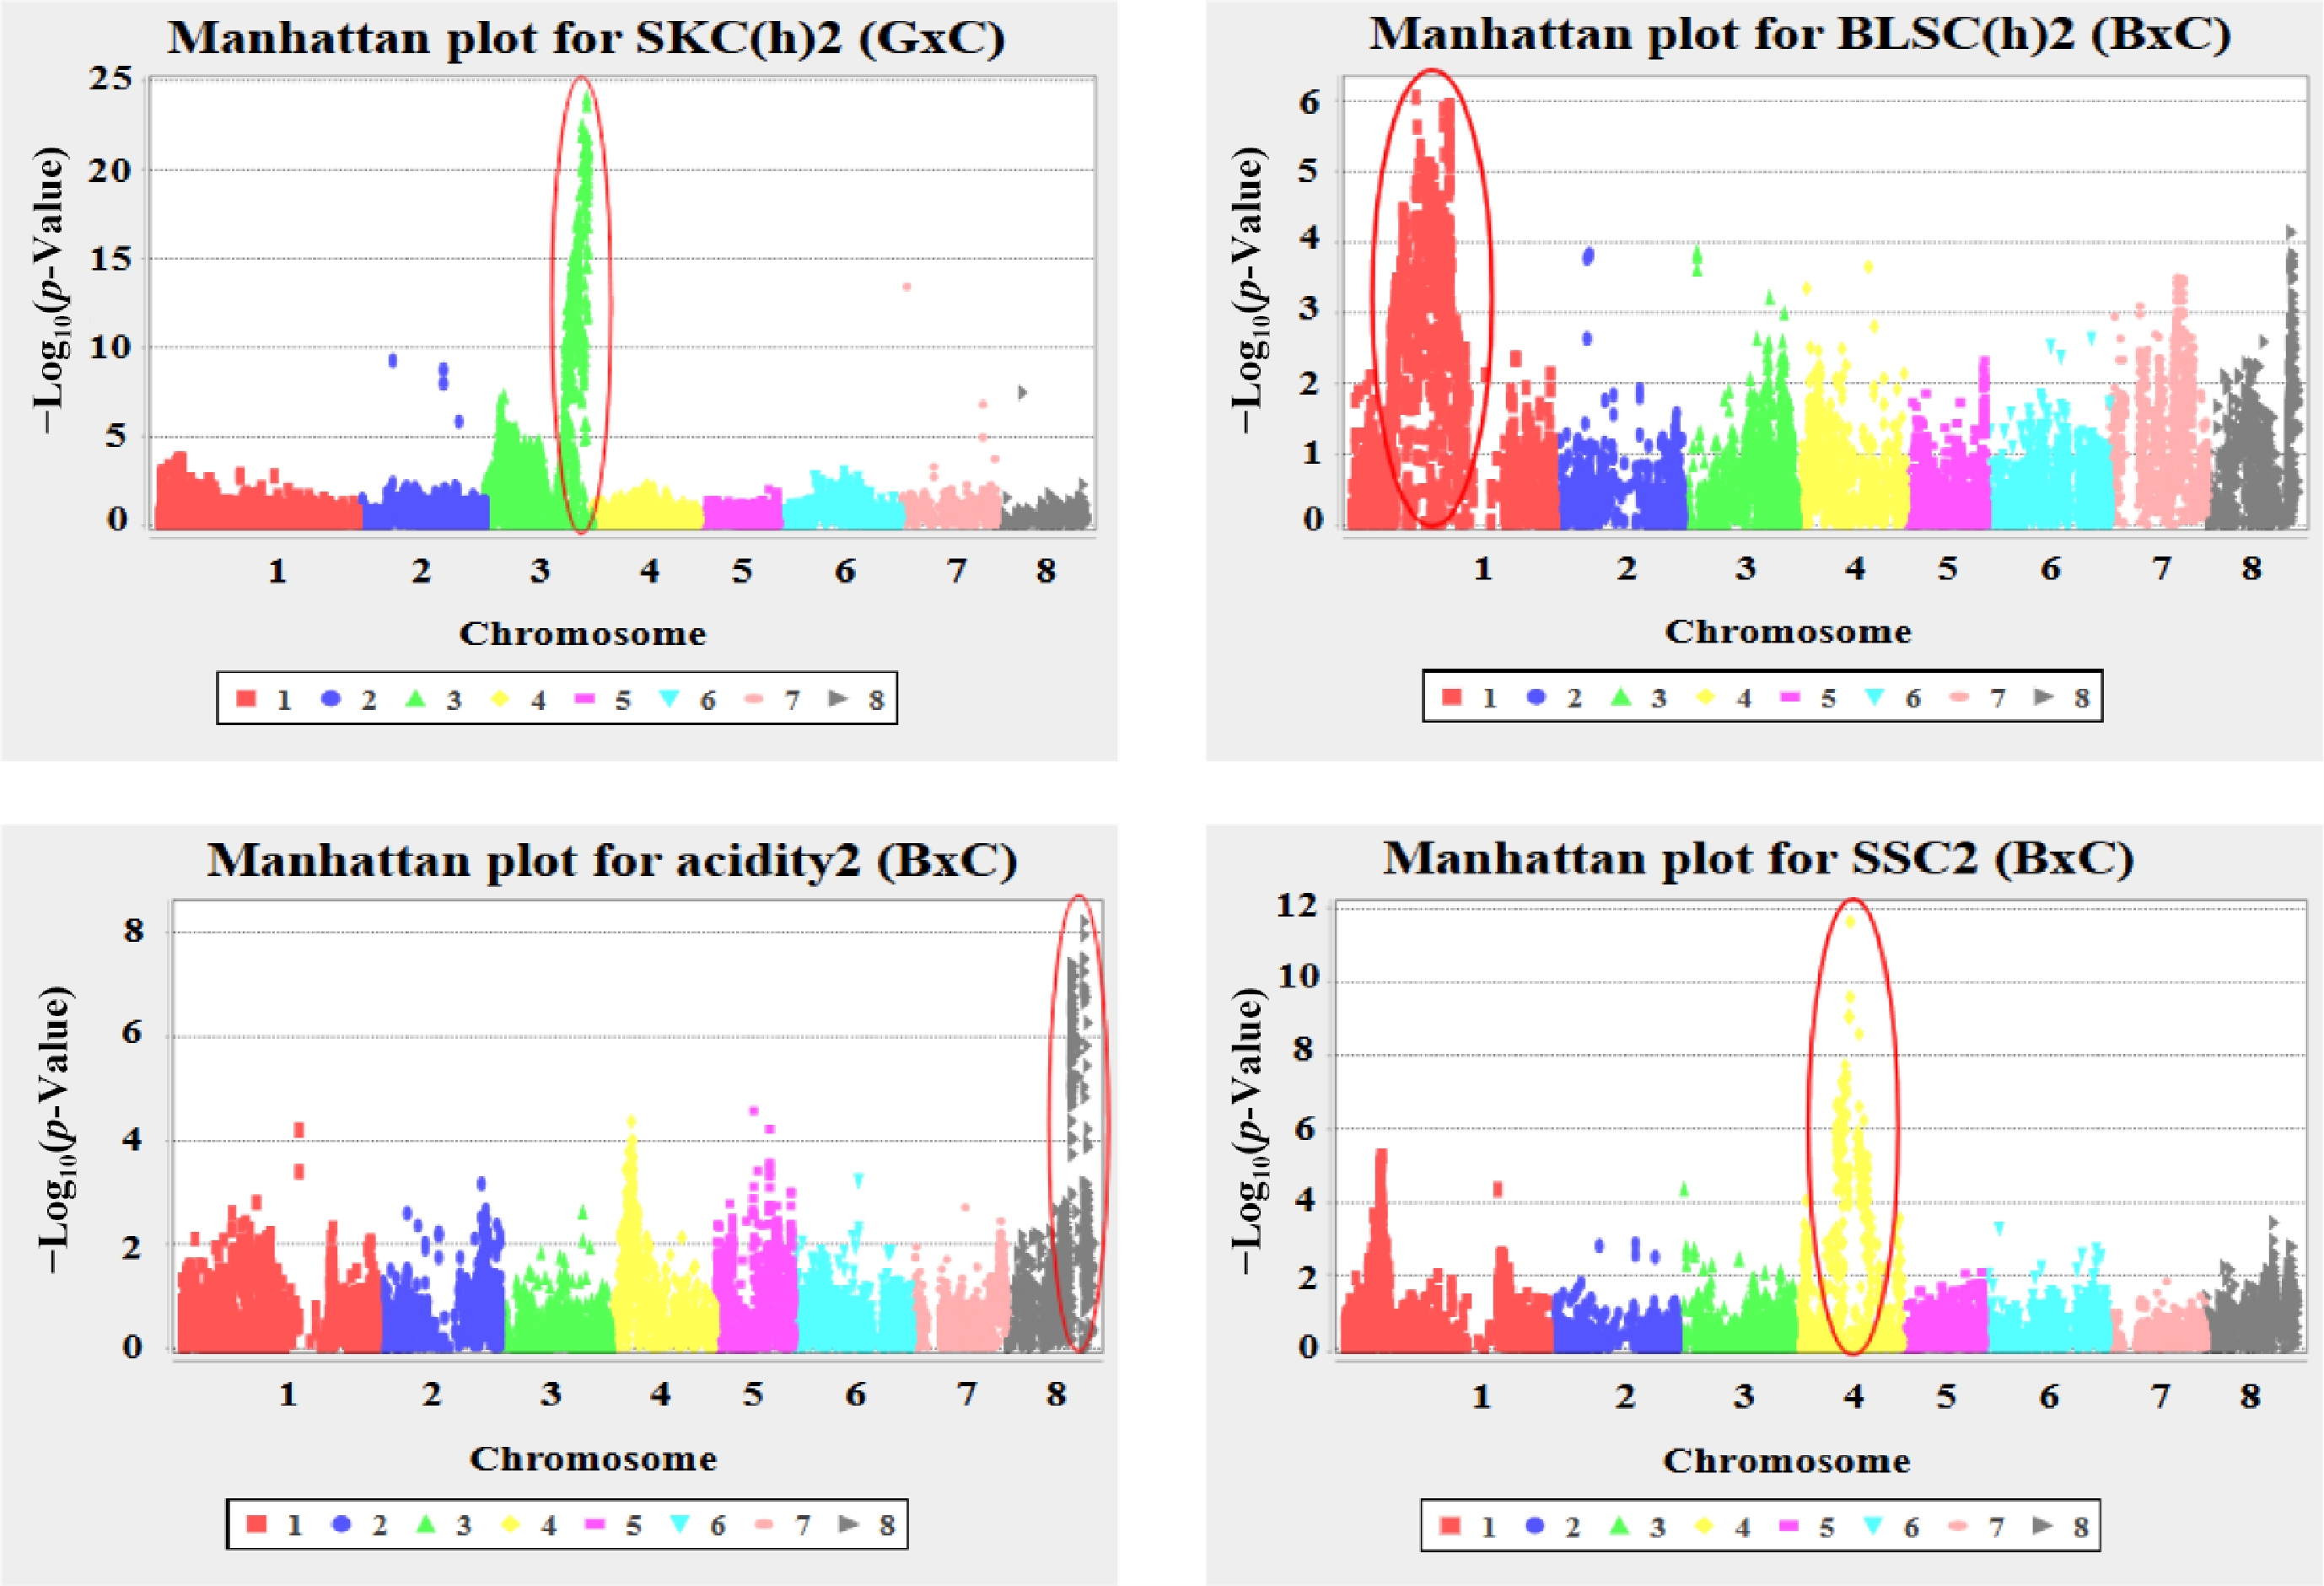
Figure 1.
Manhattan plots of genome-wide association analysis for key fruit quality traits in apricot. Plots show the –log10(p-value) of SNP-trait associations across the eight chromosomes for: SKC(h)13 in 'G × C', and BLSC(h)13, acidity13, and SSC13 in 'B × C'.
-
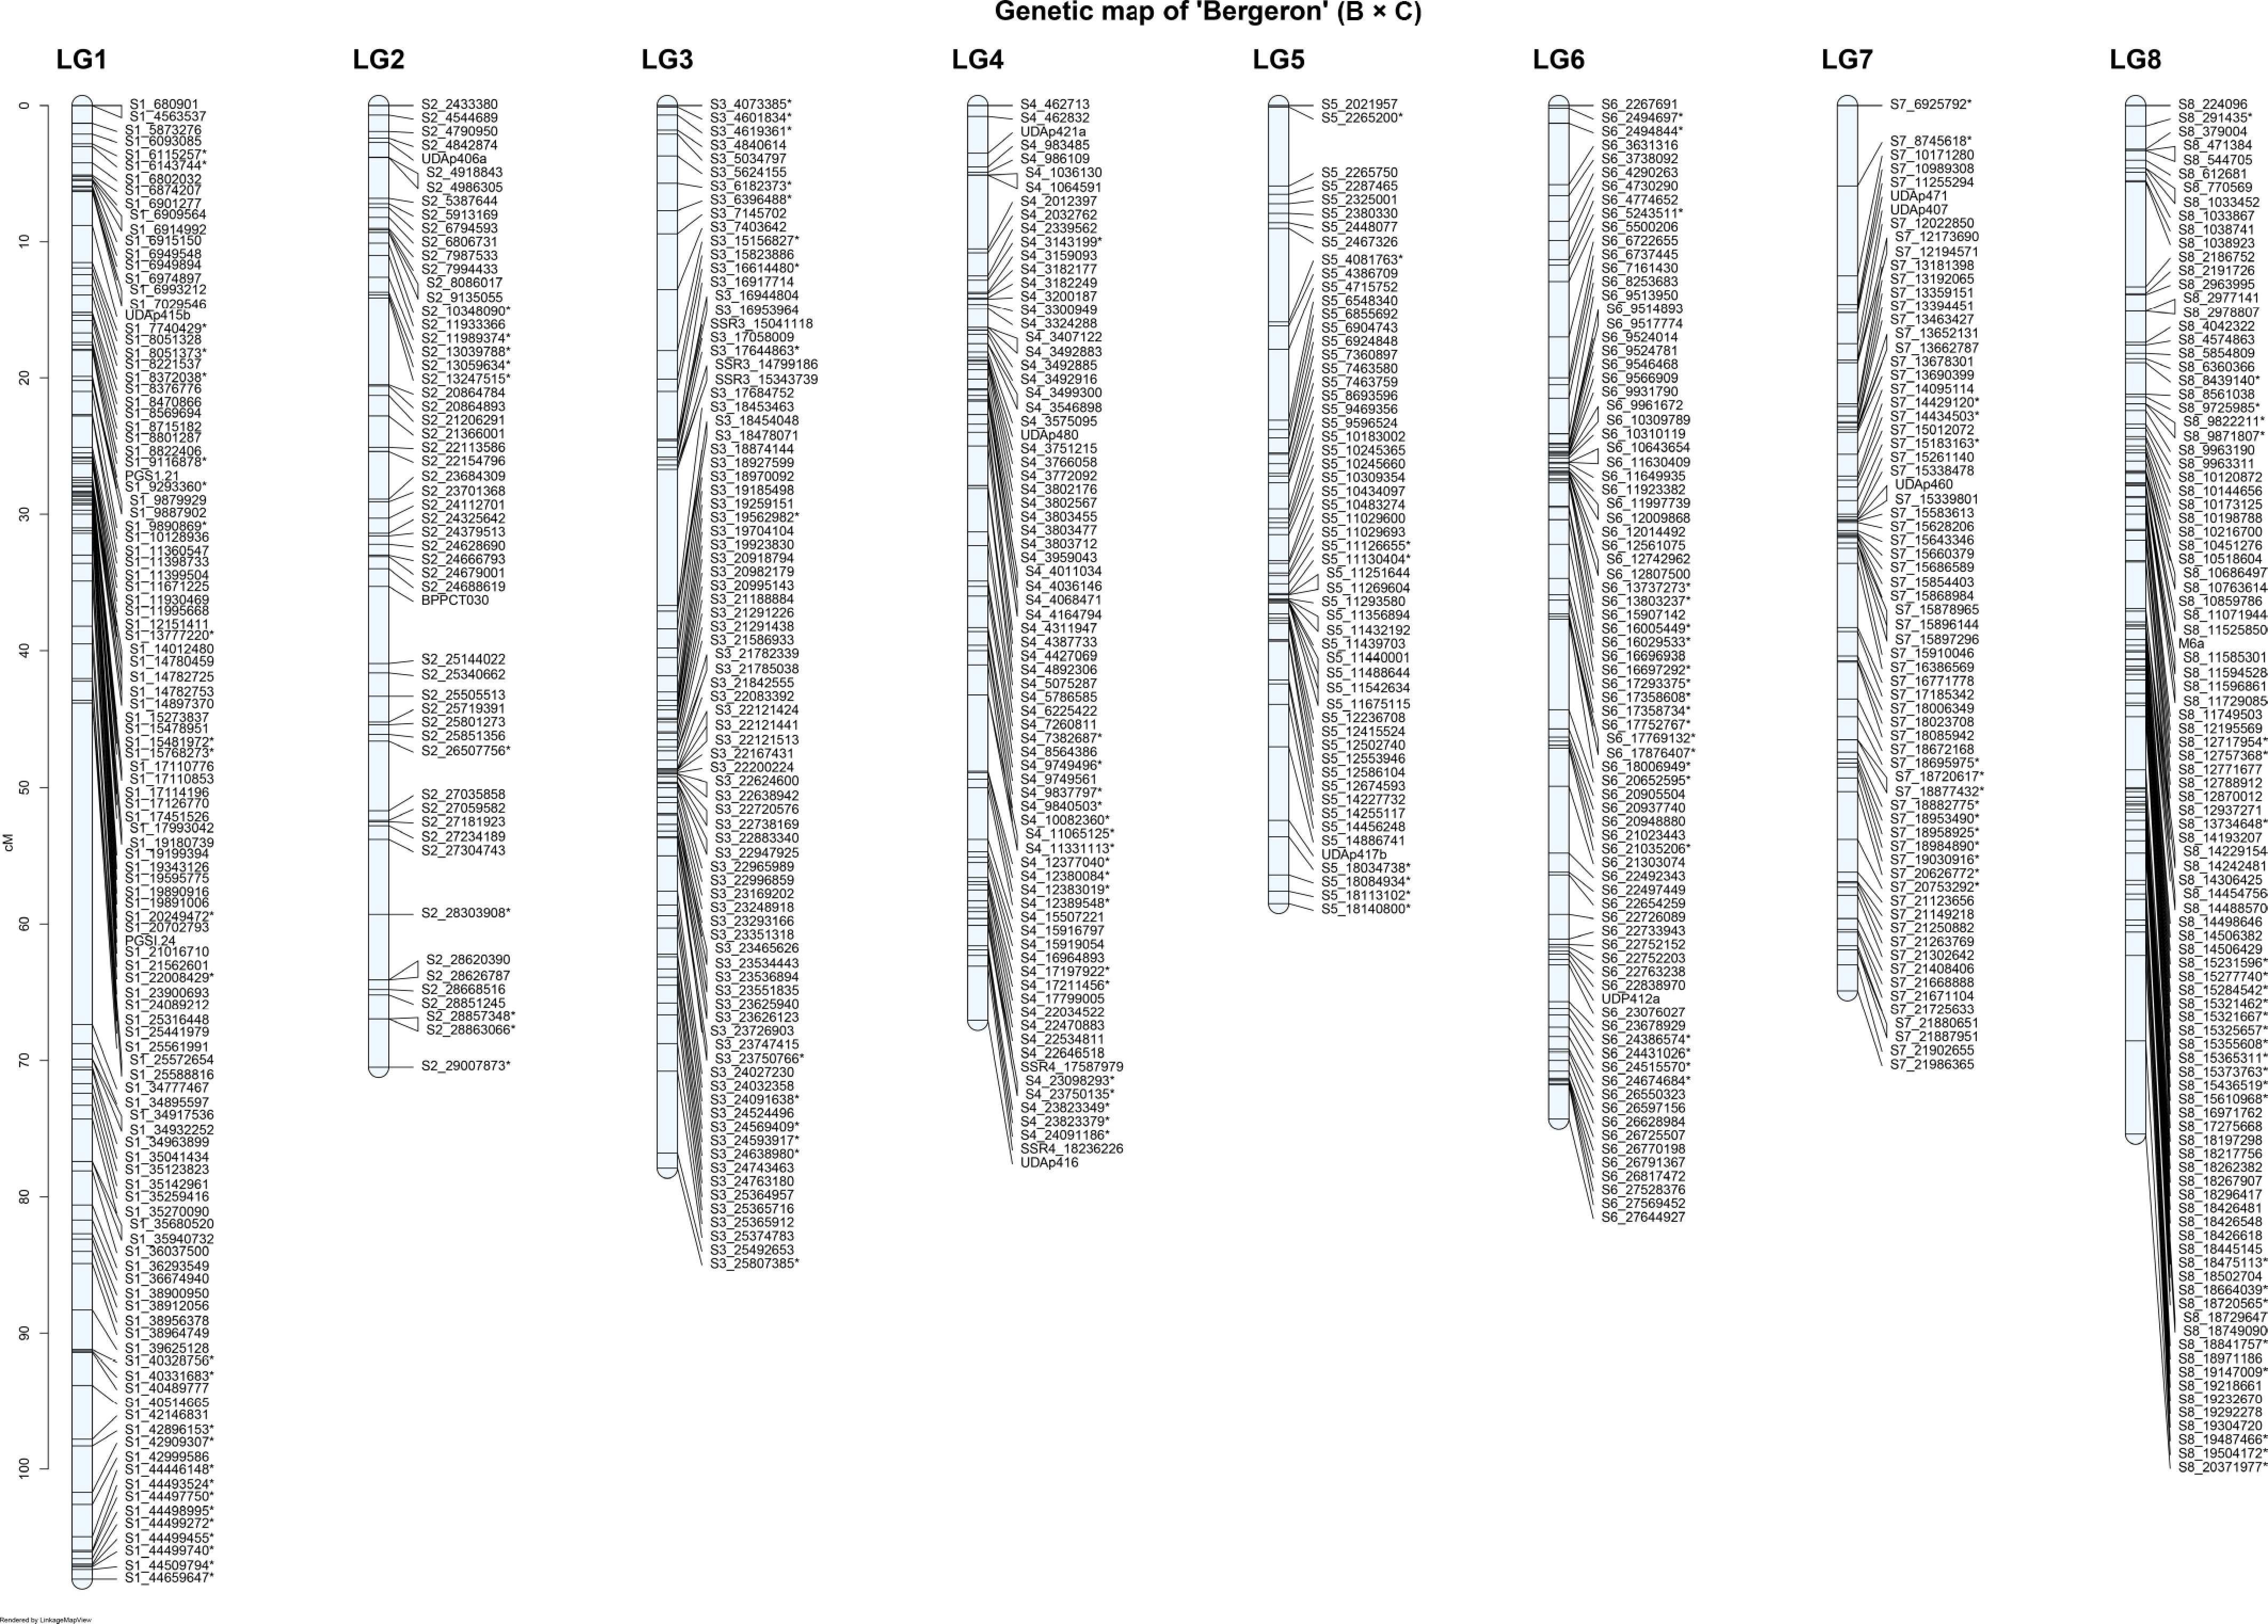
Figure 2.
Genetic linkage map of the 'Bergeron' parent of the 'B × C' apricot population across the eight linkage groups (LG1–LG8). * Common SNPs in both parents.
-
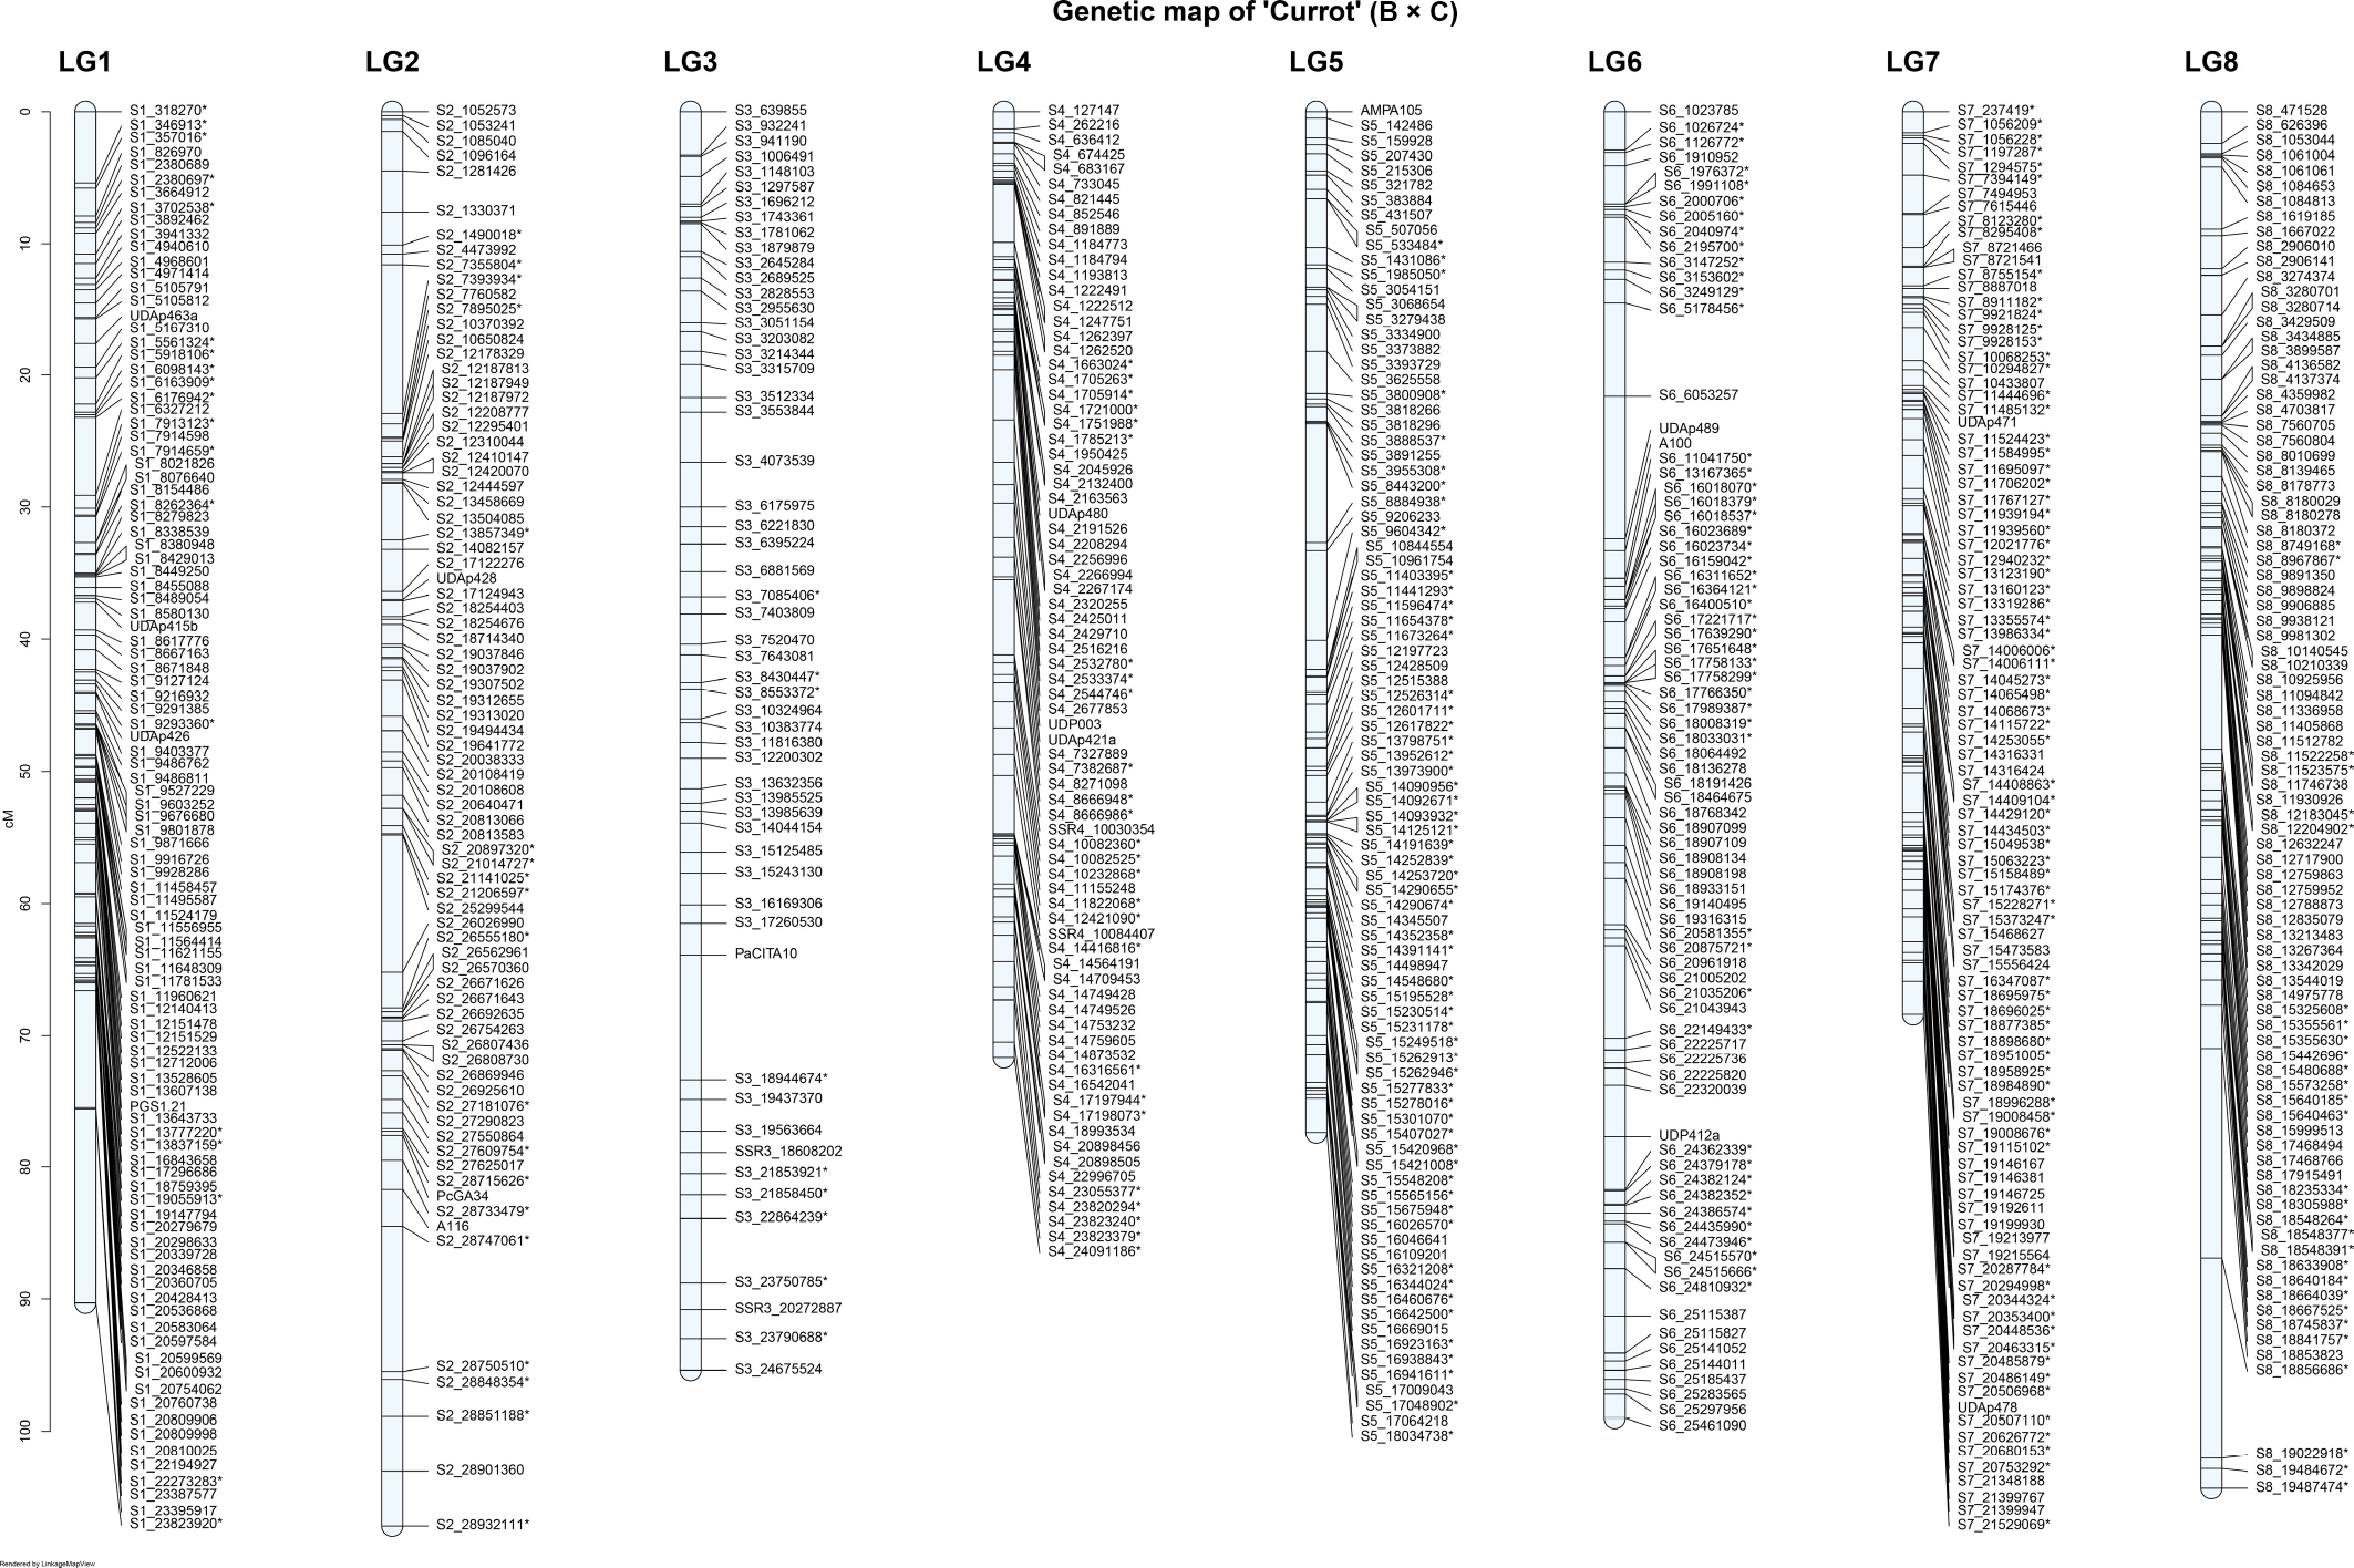
Figure 3.
Genetic linkage map of the 'Currot' parent of the 'B × C' apricot population across the eight linkage groups (LG1–LG8). * Common SNPs in both parents.
-
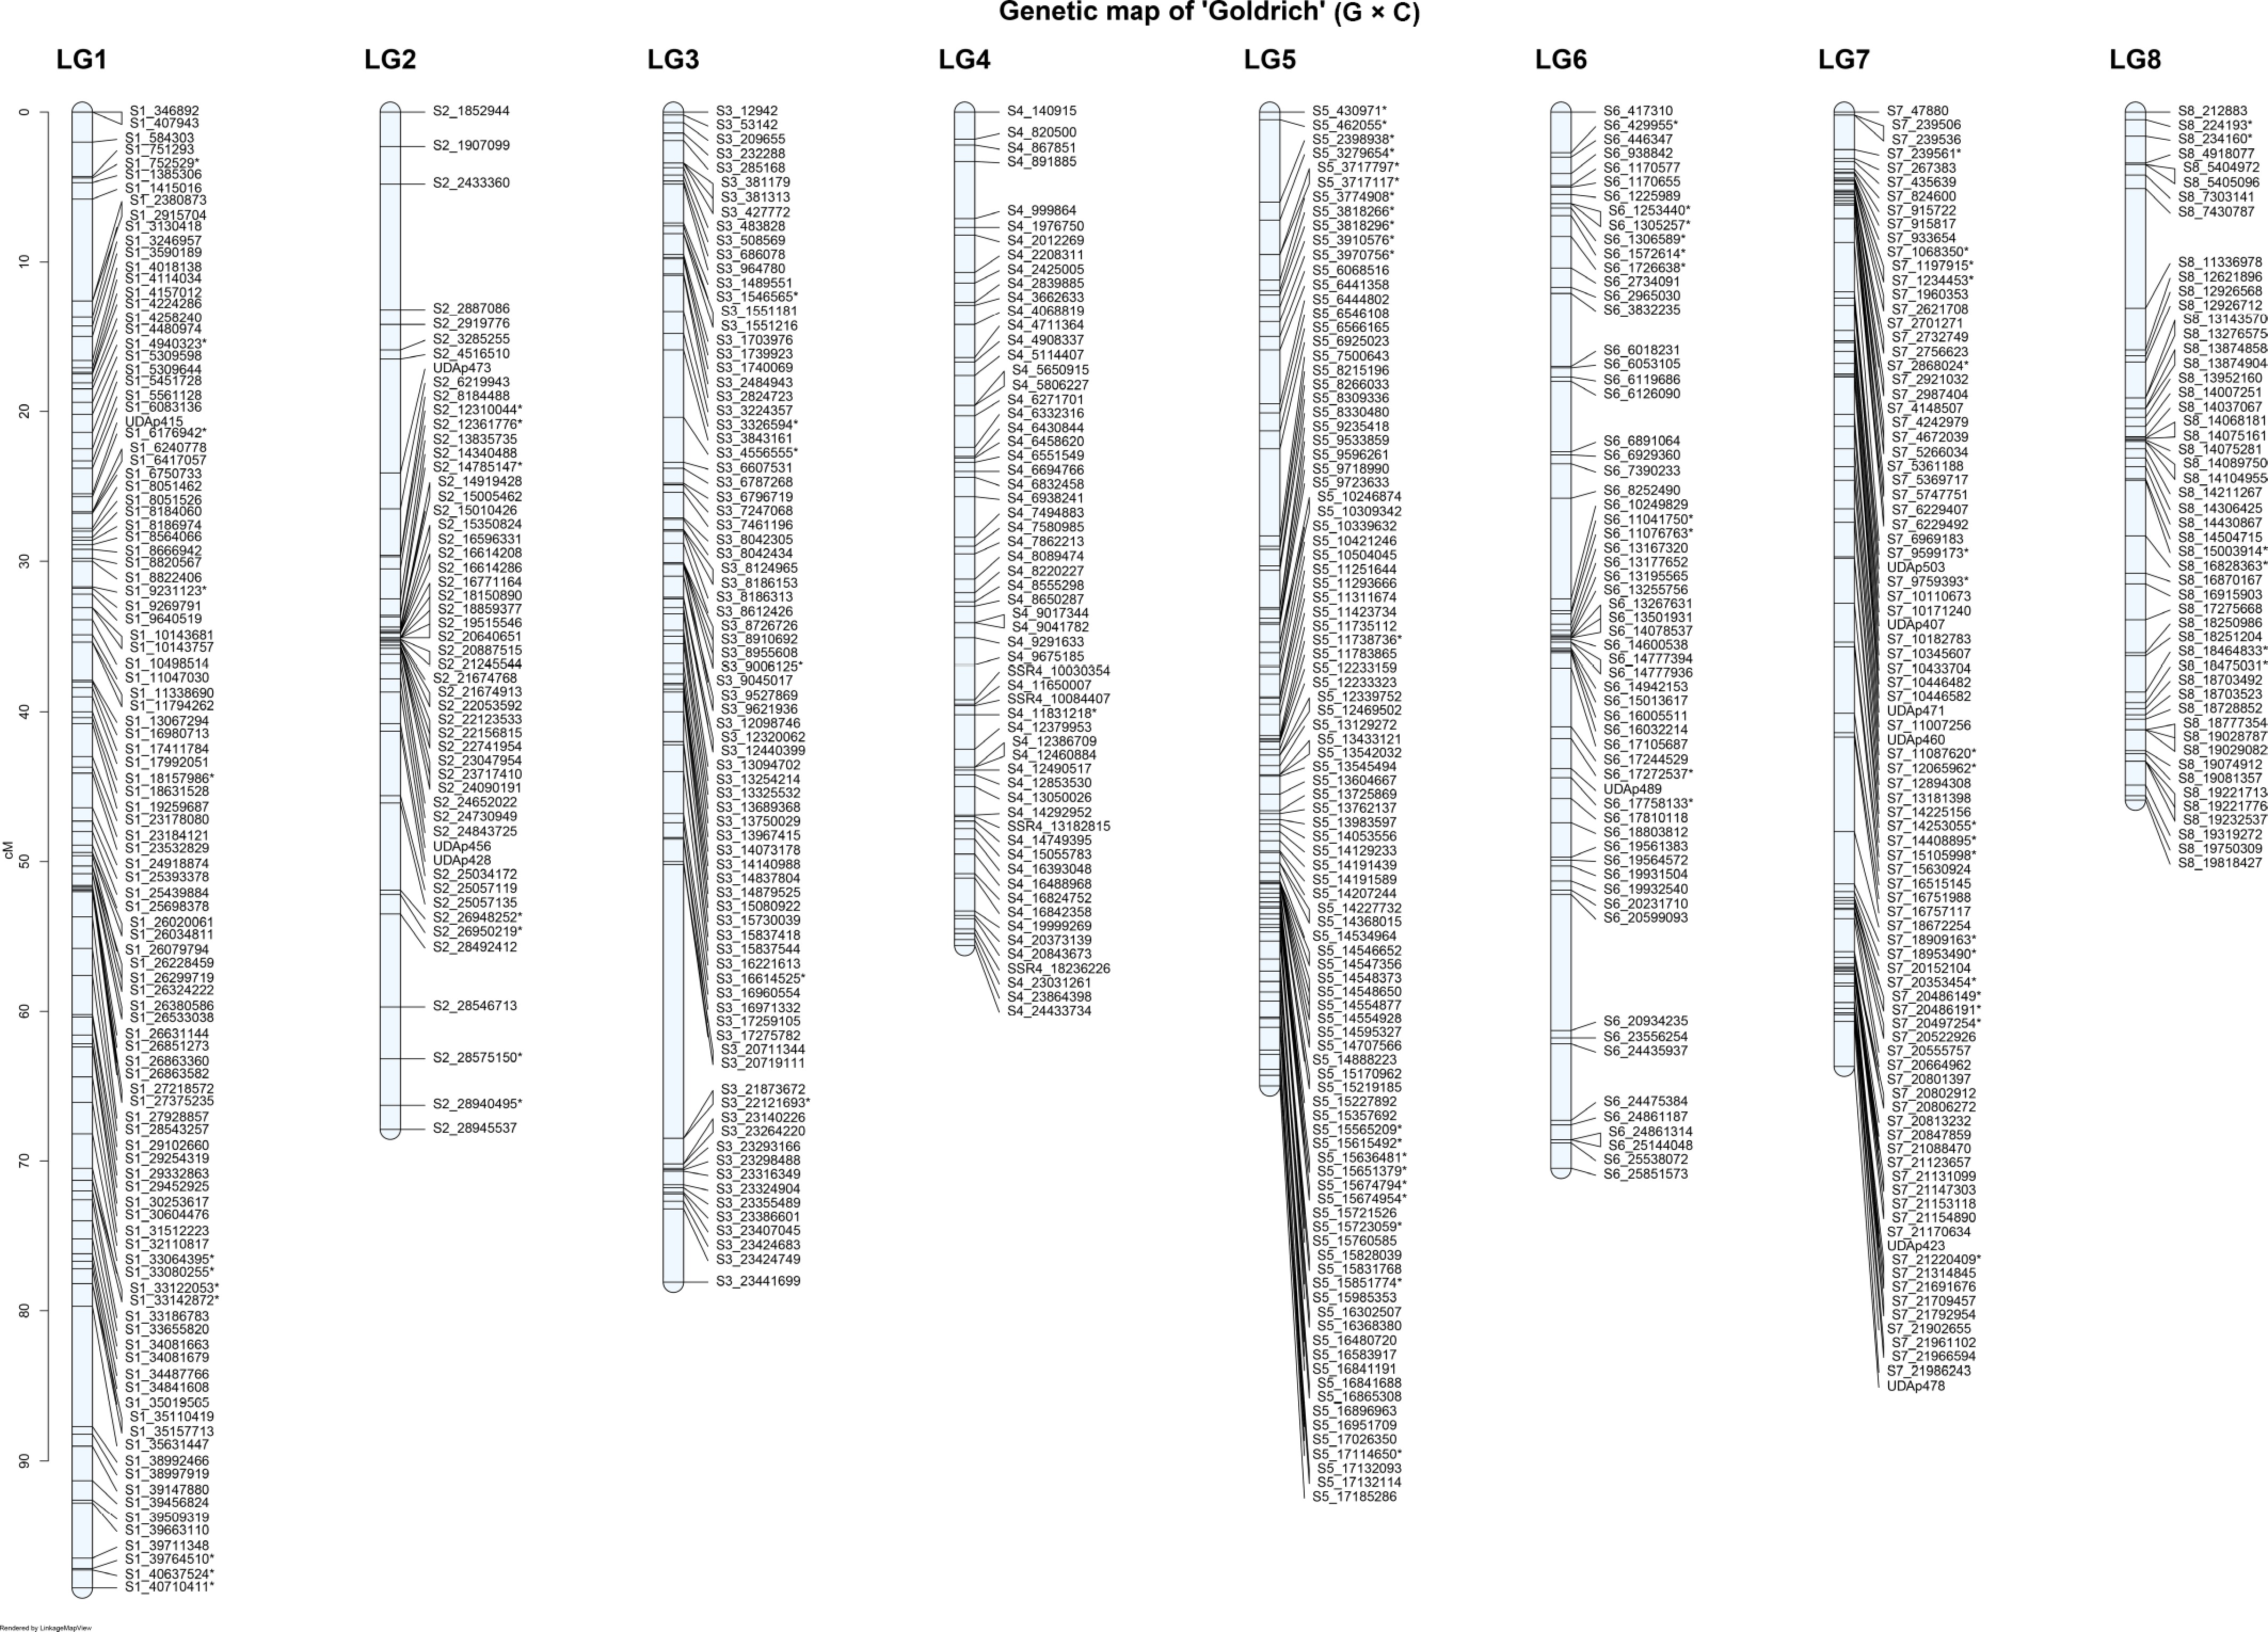
Figure 4.
Genetic linkage map of the 'Goldrich' parent of the 'G × C' apricot population across the eight linkage groups (LG1–LG8). * Common SNPs in both parents.
-
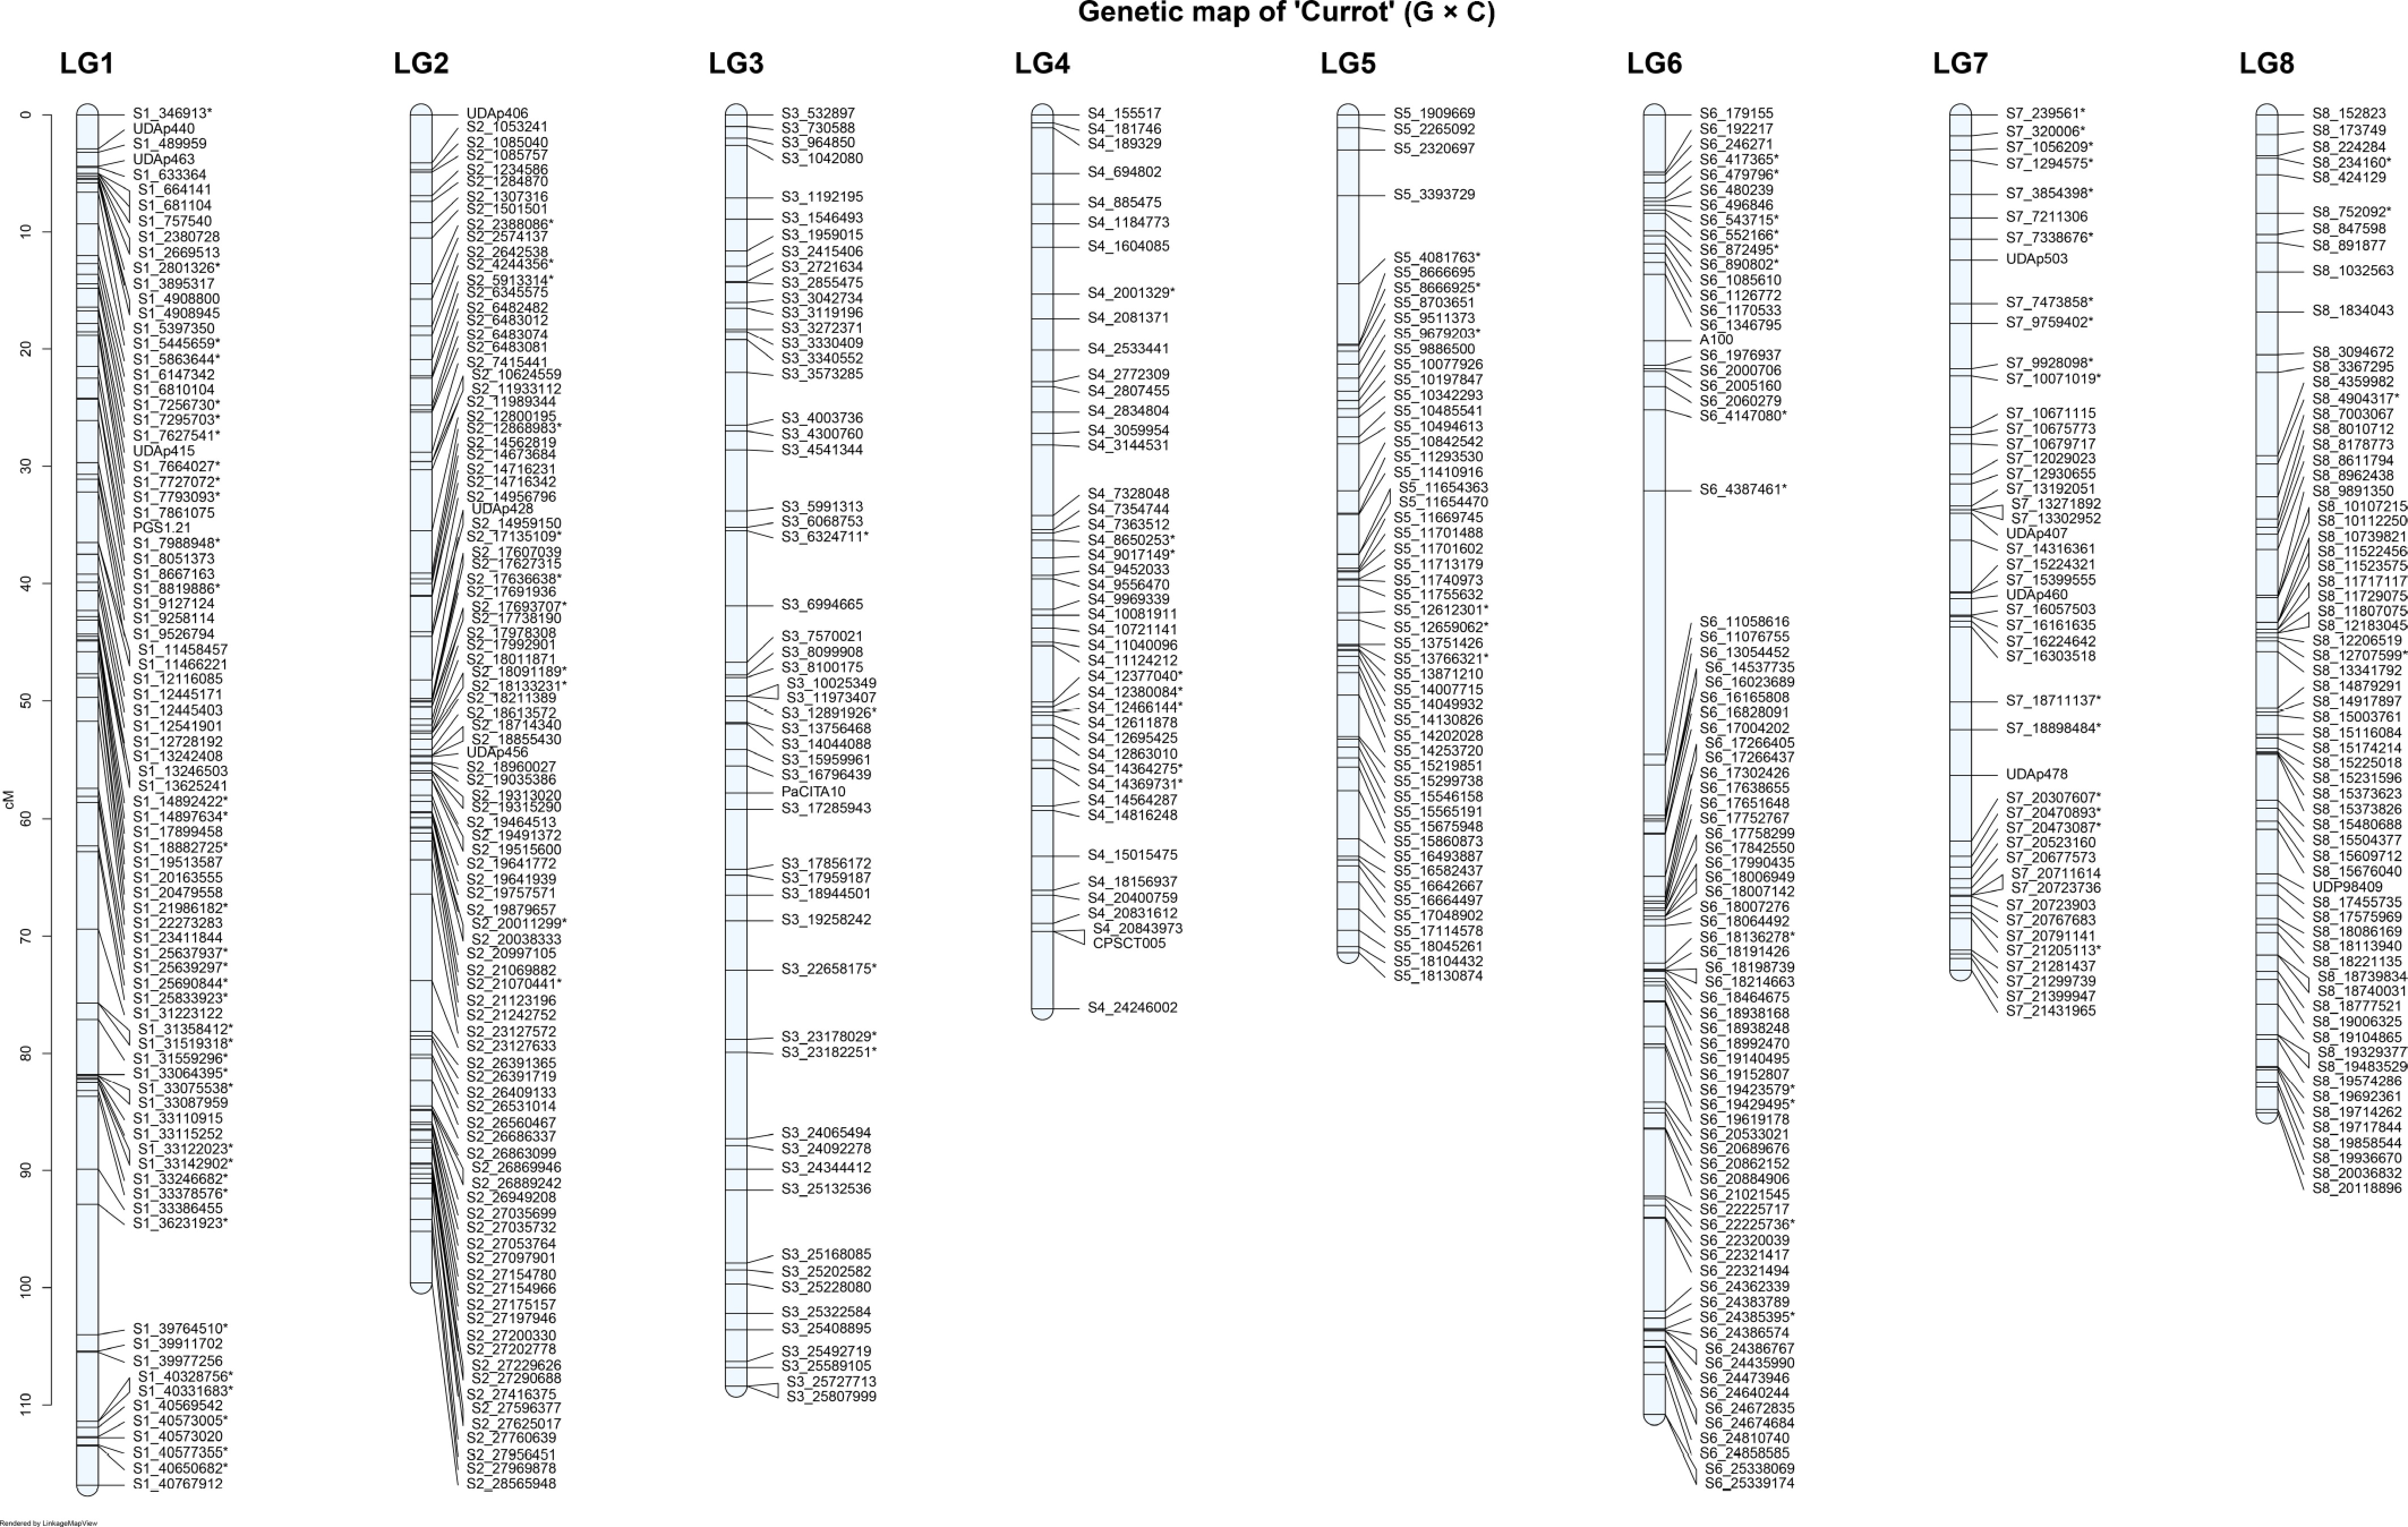
Figure 5.
Genetic linkage map of the 'Currot' parent of the 'G × C' apricot population across the eight linkage groups (LG1–LG8). * Common SNPs in both parents.
-
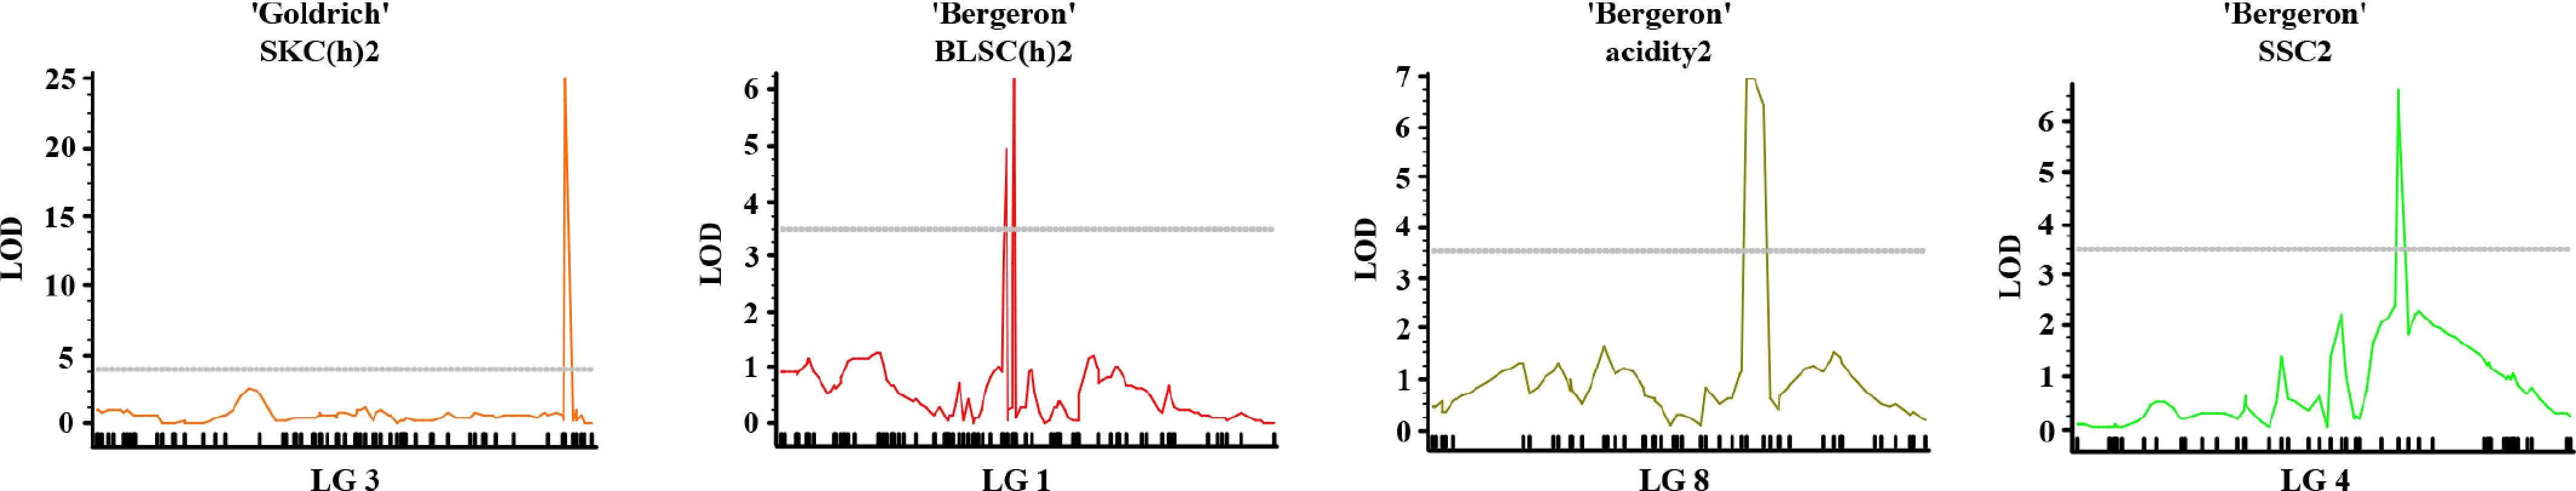
Figure 6.
Multiple-QTL mapping (MQM) profiles for fruit quality traits in apricot. Significant LOD score curves are shown for SKC(h)13 in 'Goldrich' ('G × C'), and for BLSC(h)13, acidity13, and SSC13 in 'Bergeron' ('B × C'), across their respective linkage groups (LG3, LG1, LG8, and LG4).
-
Cultivar SNPs filtered by LGS genomics GmbH Final filtered SNPs LG LOD 8 SNPs Mapped SNPs Distance (cM) Average gap (cM) Density (cM/SNP) 'Bergeron' (B × C') 45,704 (B × C) 13,343 LG1 2,323 115 108.094 0.948 0.93 LG2 1,197 57 70.530 1.259 LG3 1,425 85 77.901 0.927 LG4 1,505 78 67.082 0.871 LG5 1,670 56 58.471 1.063 LG6 2,176 82 74.295 0.917 LG7 1,380 69 64.854 0.954 LG8 1,063 100 75.421 0.762 'Currot' (B × C) 45,704 (B × C) 10,800 LG1 1,346 103 90.254 0.885 1.07 LG2 999 79 107.186 1.374 LG3 1,696 55 95.371 1.766 LG4 1,227 77 71.685 0.943 LG5 1,192 89 77.425 0.880 LG6 1,021 79 99.026 1.270 LG7 812 97 68.422 0.713 LG8 1,384 88 104.276 1.199 Table 1.
Summary statistics of the 'Bergeron' and 'Currot' genetic maps derived from the 'B × C' cross.
-
Cultivar SNPs filtered by LGS genomics GmbH Final filtered SNPs LG LOD 8 SNPs Mapped SNPs Distance (cM) Average gap (cM) Density (cM/SNP) 'Goldrich' (G × C) 52,166 (G × C) 15,113 LG1 3,579 108 98.476 0.920 0.89 LG2 2,083 53 67.898 1.306 LG3 1,810 82 78.056 0.960 LG4 1,969 61 55.614 0.927 LG5 1,235 99 64.980 0.663 LG6 2,231 62 70.453 1.155 LG7 1,190 91 63.712 0.708 LG8 601 51 45.883 0.918 'Currot' (G × C) 52,166 (G × C) 9,032 LG1 1,611 85 116.819 1.391 1.40 LG2 860 97 99.612 1.038 LG3 1,515 55 108.437 2.008 LG4 1,027 44 76.186 1.772 LG5 991 52 71.394 1.400 LG6 846 80 110.788 1.402 LG7 696 47 72.871 1.584 LG8 1,133 66 85.130 1.310 Table 2.
Summary statistics of the 'Goldrich' and 'Currot' genetic maps derived from the 'G × C' cross.
-
Parent Traita LG Position (cM) Locus Segregation LODb Kc PEVd 'Bergeron' ('B × C') FW1 6 56.160 S6_22497449 <lmxll> 5.7 19.9 17.9 SW1 6 46.260 S6_20937740 <lmxll> 5.7 23.4 18.1 SW2 6 27.720 S6_15907142 <lmxll> 5.1 19.3 16.0 FIRM2 4 48.800 S4_12377040 <hkxhk> 5.5 22.9 17.2 SKC(L)1 4 38.312 S4_9749496 <hkxhk> 6.6 15.2 20.7 SKC(L)2 4 38.312 S4_9749496 <hkxhk> 7.8 11.3 24.1 SKC(b)2 6 5.828 S6_3631316 <lmxll> 5.1 13.6 16.3 BLSC(L)1 1 29.724 S1_19890916 <lmxll> 6.4 14.1 20.3 BLSC(L)2 1 29.724 S1_19890916 <lmxll> 8.9 26.1 26.8 BLSC(a)1 1 43.575 S1_25561991 <lmxll> 5.4 16.7 17.4 BLSC(a)2 1 29.724 S1_19890916 <lmxll> 6.0 21.4 19.0 BLSC(b)1 1 30.009 S1_19891006 <lmxll> 6.3 18.1 19.9 BLSC(b)2 1 30.009 S1_19891006 <lmxll> 9.8 29.0 29.2 BLSC(h)1 1 29.724 S1_19890916 <lmxll> 5.9 20.7 18.9 BLSC(h)2 1 29.724 S1_19890916 <lmxll> 7.6 25.7 23.5 FLSC(L)1 4 38.312 S4_9749496 <hkxhk> 5.3 17.4 17.2 FLSC(L)2 4 39.553 S4_9837797 <hkxhk> 9.9 28.5 28.9 FLSC(b)1 6 68.348 S6_24674684 <hkxhk> 5.5 21.7 17.6 Acidity1 8 42.149 S8_15373763 <hkxhk> 5.5 22.7 17.6 Acidity2 8 40.071 S8_15284542 <hkxhk> 7.0 27.1 21.4 SSC1 4 41.021 S4_10082360 <hkxhk> 5.1 19.3 16.5 SSC2 4 39.553 S4_9837797 <hkxhk> 8.3 31.4 25.0 a FW: Fruit weight, SW: stone weight, FIRM: firmness, SKC(L): skin color (L* = lightness), SKC(b): skin color (b* = blue to yellow), BLSC(L): blush color (L* = lightness), BLSC(a): blush color (a* = green to red), BLSC(b): blush color (b* = blue to yellow), BLSC(h): blush color (h° = hue angle), FLSC(L): flesh color (L* = lightness), FLSC(b): flesh color (b* = blue to yellow), SSC: soluble solids content. 1 and 2 represent different years of phenotyping. b 'LOD' represents the statistic obtained from the interval mapping test. c 'K' refers to the statistic derived from the Kruskal-Wallis test. d 'PEV' indicates the percentage of phenotypic variation explained by the marker. Table 3.
QTLs identified in the 'Bergeron' parent from the 'B × C' cross for the evaluated traits.
-
Parent Traita LG Position (cM) Locus Segregation LODb Kc PEVd 'Currot' ('B × C') SW1 6 41.446 S6_16364121 <hkxhk> 6.5 17.3 20.3 SW2 6 41.446 S6_16364121 <hkxhk> 6.1 18.7 18.9 SKC(L)1 4 46.691 S4_11822068 <hkxhk> 7.3 23.4 22.7 SKC(L)2 4 43.277 S4_10232868 <hkxhk> 5.1 16.4 16.4 SKC(b)1 3 19.218 S3_3315709 <nnxnp> 8.6 27.9 26.3 SKC(b)2 3 21.665 S3_3512334 <nnxnp> 5.2 18.2 16.8 BLSC(L)1 1 44.027 UDAp426 <lmxll> 6.4 16.7 20.4 BLSC(L)2 1 44.027 UDAp426 <lmxll> 8.8 29.4 26.6 BLSC(b)2 1 59.290 S1_19055913 <hkxhk> 8.5 22.6 25.8 BLSC(h)1 1 55.032 S1_13777220 <hkxhk> 5.7 18.1 18.3 BLSC(h)2 1 44.027 UDAp426 <lmxll> 7.1 26.1 22.0 FLSC(L)1 4 46.691 S4_11822068 <hkxhk> 6.8 25.9 21.4 FLSC(L)2 4 46.691 S4_11822068 <hkxhk> 8.4 33.9 25.0 FLSC(a)1 6 70.212 S6_22149433 <hkxhk> 5.5 18.1 17.6 FLSC(a)2 6 70.212 S6_22149433 <hkxhk> 6.6 15.1 20.3 FLSC(b)1 6 70.212 S6_22149433 <hkxhk> 7.4 27.6 23.0 FLSC(b)2 6 70.212 S6_22149433 <hkxhk> 6.5 14.4 19.9 FLSC(h)1 6 70.212 S6_22149433 <hkxhk> 5.7 18.4 18.3 FLSC(h)2 6 70.212 S6_22149433 <hkxhk> 5.9 14.8 18.4 Acidity1 8 31.617 S8_10210339 <nnxnp> 6.5 16.7 20.5 SSC1 4 48.669 S4_12421090 <hkxhk> 7.2 15.2 22.6 SSC2 4 46.691 S4_11822068 <hkxhk> 8.9 35.5 26.5 a SW: Stone weight, SKC(L): skin color (L* = Lightness), SKC(b): skin color (b* = blue to yellow), BLSC(L): blush color (L* = lightness), BLSC(b): blush color (b* = blue to yellow), BLSC(h): blush color (h° = hue angle), FLSC(L): flesh color (L* = lightness), FLSC(a): flesh color (a* = green to red), FLSC(b): flesh color (b* = blue to yellow), FLSC(h): flesh color (h° = hue angle), SSC: soluble solids content. 1 and 2 represent different years of phenotyping. b 'LOD' represents the statistic obtained from the interval mapping test. c 'K' refers to the statistic derived from the Kruskal-Wallis test. d 'PEV' indicates the percentage of phenotypic variation explained by the marker. Table 4.
QTLs identified in the 'Currot' parent from the 'B × C' cross for the evaluated traits.
-
Parent Traita LG Position (cM) Locus Segregation LODb Kc PEVd 'Goldrich' ('G × C') FW2 1 79.676 S1_35631447 <lmxll> 7.6 27.8 19.8 SW2 2 33.696 S2_14785147 <hkxhk> 7.6 27.8 19.8 P1 1 64.389 S1_31512223 <lmxll> 6.5 18.6 17.1 FIRM1 3 50.017 S3_17275782 <lmxll> 7.5 27.5 19.8 FIRM2 2 35.633 S2_22156815 <lmxll> 8.8 31.7 22.6 SIZE2 1 79.676 S1_35631447 <lmxll> 9.8 33.7 25.0 SKC(L)1 3 70.722 S3_23316349 <lmxll> 15.7 56.8 36.9 SKC(L)2 3 70.722 S3_23316349 <lmxll> 13.7 48.5 33.6 SKC(a)1 3 70.722 S3_23316349 <lmxll> 24.7 86.2 51.5 SKC(a)2 3 70.722 S3_23316349 <lmxll> 25.5 80.4 53.4 SKC(b)1 3 46.783 S3_16614525 <hkxhk> 11.4 42.4 28.4 SKC(b)2 3 48.522 S3_17259105 <lmxll> 7.8 24.6 20.8 SKC(h)1 3 70.722 S3_23316349 <lmxll> 24.2 85.9 50.9 SKC(h)2 3 70.722 S3_23316349 <lmxll> 25.0 79.2 52.7 BLSC(a)1 3 72.151 S3_23407045 <lmxll> 6.5 22.8 21.6 BLSC(a)2 3 68.462 S3_21873672 <lmxll> 6.7 26.3 18.5 BLSC(b)1 3 39.968 S3_15730039 <lmxll> 7.1 28.0 23.5 BLSC(b)2 3 39.968 S3_15730039 <lmxll> 6.6 26.4 18.2 FLSC(L)1 4 49.499 S4_16488968 <lmxll> 6.2 16.1 16.6 FLSC(L)2 6 23.508 S6_7390233 <lmxll> 5.5 16.2 15.4 FLSC(a)1 3 70.722 S3_23316349 <lmxll> 19.7 67.7 43.9 FLSC(a)2 3 70.204 S3_23140226 <lmxll> 15.8 56.7 37.9 FLSC(b)1 3 70.722 S3_23316349 <lmxll> 11.8 40.6 29.2 FLSC(b)2 3 70.722 S3_23316349 <lmxll> 11.1 38.1 28.5 FLSC(h)1 3 70.722 S3_23316349 <lmxll> 20.1 69.9 44.6 FLSC(h)2 3 70.204 S3_23140226 <lmxll> 15.6 56.5 37.7 pH2 2 32.499 S2_13835735 <lmxll> 5.9 17.3 15.9 Acidity1 8 39.429 S8_18475031 <hkxhk> 5.0 14.3 13.7 Acidity2 2 33.580 S2_14340488 <lmxll> 10.9 41.6 27.5 SSC1 4 40.228 S4_11831218 <hkxhk> 7.6 32.7 20.3 SSC2 4 40.228 S4_11831218 <hkxhk> 11.1 44.4 28.0 PM3 2 24.134 UDAp473 <abxcd> 5.3 22.4 14.1 a FW: Fruit weight, SW: stone weight, P: productivity, FIRM: firmness, SIZE: size, SKC(L): Skin Color (L* = Lightness), SKC(a): skin color (a* = green to red), SKC(b): skin color (b* = blue to yellow), SKC(h): skin color (h° = hue angle), BLSC(a): blush color (a* = green to red), BLSC(b): blush color (b* = blue to yellow), FLSC(L): flesh color (L* = Lightness), FLSC(a): flesh color (a* = green to red), FLSC(b): flesh color (b* = blue to yellow), FLSC(h): flesh color (h° = hue angle), SSC: soluble solids content, PM: powdery mildew. 1, 2, and 3 represent different years of phenotyping. b 'LOD' represents the statistic obtained from the interval mapping test. c 'K' refers to the statistic derived from the Kruskal-Wallis test. d 'PEV' indicates the percentage of phenotypic variation explained by the marker. Table 5.
QTLs identified in the 'Goldrich' parent from the 'G × C' cross for the evaluated traits.
-
Parent Traita LG Position (cM) Locus Segregation LODb Kc PEVd 'Currot' ('G × C') FW2 1 92.908 S1_36231923 <hkxhk> 6.1 22.0 16.3 SW2 2 52.656 S2_18091189 <hkxhk> 8.2 29.8 21.2 P1 1 81.785 S1_33064395 <hkxhk> 6.9 19.4 18.2 FIRM2 2 50.469 S2_17693707 <hkxhk> 7.6 24.0 19.9 SIZE2 1 92.908 S1_36231923 <hkxhk> 7.5 28.2 19.8 SKC(L)1 3 72.859 S3_22658175 <hkxhk> 10.1 33.1 25.6 SKC(L)2 3 72.859 S3_22658175 <hkxhk> 10.8 18.2 27.6 SKC(a)1 3 72.859 S3_22658175 <hkxhk> 18.7 53.9 42.3 SKC(a)2 3 72.859 S3_22658175 <hkxhk> 22.7 56.5 49.2 SKC(b)1 3 50.031 S3_12891926 <hkxhk> 9.2 36.9 23.5 SKC(b)2 3 50.031 S3_12891926 <hkxhk> 6.0 25.4 16.4 SKC(h)1 3 72.859 S3_22658175 <hkxhk> 18.2 53.3 41.4 SKC(h)2 3 72.859 S3_22658175 <hkxhk> 22.3 54.9 48.7 BLSC(a)2 3 72.859 S3_22658175 <hkxhk> 6.9 22.4 19.1 FLSC(L)1 4 51.955 S4_12695425 <nnxnp> 6.5 14.6 17.4 FLSC(L)2 4 51.955 S4_12695425 <nnxnp> 7.1 15.5 19.4 FLSC(a)1 3 72.859 S3_22658175 <hkxhk> 14.7 45.5 35.1 FLSC(a)2 3 72.859 S3_22658175 <hkxhk> 15.3 44.5 37.1 FLSC(b)1 3 72.859 S3_22658175 <hkxhk> 7.5 26.8 19.8 FLSC(b)2 3 72.859 S3_22658175 <hkxhk> 9.9 29.3 25.8 FLSC(h)1 3 72.859 S3_22658175 <hkxhk> 14.2 46.9 34.1 FLSC(h)2 3 72.859 S3_22658175 <hkxhk> 15.3 44.4 37.1 Acidity1 8 58.385 S8_15480688 <nnxnp> 6.2 27.6 16.8 Acidity2 2 52.656 S2_18091189 <hkxhk> 9.4 21.2 24.1 SSC1 4 53.107 S4_12863010 <nnxnp> 8.5 24.9 22.4 SSC2 4 53.107 S4_12863010 <nnxnp> 12.1 35.0 30.1 a FW: fruit weight, SW: stone weight, P: productivity, FIRM: firmness, SIZE: size, SKC(L): skin color (L* = lightness), SKC(a): skin color (a* = green to red), SKC(b): skin color (b* = blue to yellow), SKC(h): skin color (h° = hue angle), BLSC(a): blush color (a* = green to red), FLSC(L): flesh color (L* = Lightness), FLSC(a): flesh color (a* = green to red), FLSC(b): flesh color (b* = blue to yellow), FLSC(h): flesh color (h° = hue angle), SSC: soluble solids content. 1 and 2 represent different years of phenotyping. b 'LOD' represents the statistic obtained from the interval mapping test. c 'K' refers to the statistic derived from the Kruskal-Wallis test. d 'PEV' indicates the percentage of phenotypic variation explained by the marker. Table 6.
QTLs identified in the 'Currot' parent from the 'G × C' cross for the evaluated traits.
-
Population F1 (size) Genotyping technique Map Markers Size (cM) Ref. 'Goldrich' × 'Currot' (81) AFLP, RAPD, RFLP, and SSR 'Goldrich' 139 468 [41] 'Currot' 89 451 'Goldrich' × 'Currot' (82) SSR (LG1*) 'Goldrich' 48 70 [42] 'Bergeron' × 'Currot' (130) SNP and SSR 'Bergeron' 52 394 [30] 'Currot' 55 414 'Goldrich' × 'Currot' (166) SNP and SSR 'Goldrich' 63 353 [30] 'Currot' 56 422 'Bergeron' × 'Currot' (134) SNP and SSR 'Bergeron' 642 596 Present work 'Currot' 667 713 'Goldrich' × 'Currot' (159) SNP and SSR 'Goldrich' 607 545 Present work 'Currot' 526 741 * In this work, only LG1 was mapped. Table 7.
Longitudinal comparison of genetic linkage maps in apricot (Prunus armeniaca L.) from F1 populations of 'Goldrich' × 'Currot' and 'Bergeron' × 'Currot'.
Figures
(6)
Tables
(7)