


-
Apricot (Prunus armeniaca L.) is a fruit species originating from China, possessing significant economic and cultural value[1]. Apricot is a diploid species (2n = 2x = 16) with eight chromosome pairs, whose genetics have been widely studied due to its complex variability. This crop, cultivated in temperate regions, is characterized by its wide genetic variability and valued for its high fruit quality[2].
Nowadays, phenotyping remains essential for understanding the inheritance of key traits related to fruit quality—such as color, sugar content, and acidity—which define the primary sensory attributes of appearance and flavor. A recent study indicates that consumers value both the sweetness and flavor intensity of fruit, along with attributes related to its texture[3]. In addition, phenotyping is critical for identifying genotypes resistant to viral pathogens, including apple chlorotic leaf spot virus (ACLSV) and plum pox virus (PPV)[4,5], as well as fungal diseases like powdery mildew, which significantly impact stone fruit production[6].
Regarding fruit quality traits, soluble solids content (SSC), titratable acidity (TA), and their ratio are crucial indicators of taste. The sugar/acid ratio plays a major role in consumer preference and is widely used to assess eating quality. For instance, a minimum SSC of 10% is required for apricot commercialization in the EU[7]. Additionally, visual appeal remains a key factor—consumers tend to prefer larger fruits with a deep orange skin and pronounced red blush, traits that reflect a high carotenoid content and are closely associated with nutritional and health benefits.[8]
Powdery mildew, caused by Podosphaera pannosa (Wallr.) var. persicae, manifests as circular white spots on leaves and shoots. In severe cases, it affects fruits, causing necrosis, deformities, and premature fruit drop, with particularly high incidence in nurseries. Infected young leaves develop blisters with grayish-white fungal growth, leading to deformation and early leaf fall. Green shoots and flowers are also susceptible, often resulting in bud and blossom failure. Control strategies typically require intensive pesticide application, which poses risks of chemical residues in fruits, soil, and water[9].
On the other side, in recent decades, the development of high-resolution genetic maps has been essential for gaining insights into the genetic determinants associated with traits of interest, which are critical for breeding programs[10]. Genotyping-by-Sequencing (GBS) is a sequencing technique that enables the identification of SNP (Single Nucleotide Polymorphism) markers, providing comprehensive and detailed genetic coverage of the genome at a relatively low cost[11]. This genotyping technology has revolutionized genetic analysis within the Prunus genus, encompassing species such as Prunus armeniaca (apricot)[12], Prunus domestica (European plum)[13], Prunus persica (peach)[14], Prunus avium (sweet cherry)[15], Prunus dulcis (almond)[16], and Prunus salicina (Japanese plum)[17]. Thereby, GBS has become one of the essential tools for marker-trait association studies, offering evidence of polymorphisms strongly linked to agronomically important traits in segregating populations and enabling the identification of quantitative trait loci (QTLs) through the construction of linkage maps. The high marker density provided by GBS greatly enhances the genetic resolution of these linkage maps, making it a valuable resource for genetic breeding programs[18].
Recent advances in linkage mapping and QTL analysis have enabled the identification of genomic regions controlling key agronomic traits. In apricot, QTLs linked to fruit size, color, SSC, total acidity, and firmness have been reported[19,20]. Similarly, associations with resistance to PPV, ACLSV, and powdery mildew have been identified, though often in low-density genetic maps[21−23].
Therefore, the present study aims to perform high-density SNP genotyping in the 'Bergeron' × 'Currot' ('B × C') and 'Goldrich' × 'Currot' ('G × C') populations using the GBS technique. Additionally, the study seeks to identify new marker–trait associations and to develop highly saturated genetic maps for refining QTLs linked to fruit quality and powdery mildew resistance, leading to more accurate locus–trait relationships. It is expected that these findings may contribute to the development of genomic tools useful for genomic selection approaches that can be integrated into apricot breeding programs, facilitating the selection process of the best parents and advancing the obtention of cultivars adapted to current demands[24].
-
The plant material evaluated comprised two F1 populations: 'Bergeron' × 'Currot' ('B × C', n = 134) and 'Goldrich' × 'Currot' ('G × C', n = 159). Both populations were established in 2009 at the CEBAS-CSIC experimental orchard in Cieza-Calasparra, Murcia, Spain (lat. 38°16′ N, long. 1°35′ W; 350 m a.s.l.). The progenies of the two families used in this study were grown on their own roots. Meanwhile, the parents used in the study were grafted onto apricot seedling rootstocks. The descendants of the two populations were planted under a high-density planting system due to the large number of genotypes to be evaluated, with a spacing of 5 × 1.5 m, while the parents had a planting spacing of 5 × 3 m. Cultivation was carried out using fertigation through drip irrigation. The apricot trees were managed using an open-center training system and applying light pruning during winter.
'Bergeron' is a French self-compatible cultivar with balanced sweetness (12–13 °Brix) and acidity (~1.5 g/100 mL)[25], showing low susceptibility to powdery mildew. In contrast, 'Goldrich' is self-incompatible cultivar, with high soluble solid content (13–14 °Brix) but also very high acidity (2.5–3.0 g/100 mL), resulting in a more acidic taste, also showing low susceptibility to powdery mildew. Meanwhile, 'Currot', a traditional Spanish cultivar and the common male parent, is a self-compatible cultivar combining high sweetness (14–15 °Brix) with low acidity (1.0–1.4 g/100 mL) and shows high susceptibility to powdery mildew. Therefore, both populations were segregating for fruit quality traits and the level of susceptibility to powdery mildew[23].
Experimental design and phenotyping analysis
-
Phenotyping included evaluations of agronomic and fruit quality traits, which were analyzed through both physical and biochemical measurements. Agronomic traits included flowering intensity (FI) and productivity (P). Physical fruit characteristics included fruit weight (FW), stone weight (SW), diameter (SIZE), firmness (FIRM), and color, encompassing skin color (SKC), blush color (BLSC), and flesh color (FLSC). Biochemical traits comprised soluble solids content (SSC), acidity (ACIDITY), and pH, measured over two years (Supplementary Table S1). Fruit weight and stone weight were measured using a digital scale. Skin color coverage was visually estimated as a percentage, and detailed color metrics were obtained with a Minolta Chroma Meter (CR-300), including L (lightness), a* (green to red), b* (blue to yellow), and h° (hue angle), applied to skin, blush, and flesh tissues. Fruit firmness was determined using a TAX.plus texturometer (Stable Micro Systems, UK), where individual fruits were compressed with a flat plate to a deformation of 5 mm. Soluble solids content was measured with an Atago PAL-1 handheld refractometer, acidity was determined by acid-base titration using a METROHM 786 DMP Titrino, and pH was measured with a calibrated pH meter. All measurements were performed on 12 fruits per genotype per year. For SSC and acidity, three replicates were prepared by pooling the 12 fruits, following the methodology described in previous studies[25].
Powdery mildew (PM) symptoms were evaluated on leaves over three consecutive years using a scale from zero (absence of symptoms) to five (maximum symptoms) in the two F1 apricot progenies 'B × C' and 'G × C'[25]. The young, newly developed leaves of untreated plants were the most heavily infected when symptoms appeared, showing strong sporulation of the fungus on both the upper and lower surfaces in cases of severe infection. These data (Supplementary Table S2) were collected and used in the current study to implement more accurate marker–trait association studies and quantitative trait locus (QTL) identification using new genetic maps.
Genotyping by sequencing (GBS)
-
DNA extraction and genotyping-by-sequencing (GBS) were performed on two F1 populations: 'Bergeron' × 'Currot' ('B × C', n = 134) and 'Goldrich' × 'Currot' ('G × C', n = 159), accounting for 293 genotypes, as well as DNA from the parents. Young leaves from each plant were collected, frozen at −80 °C, grained by TissueLyzer (QIAGEN), for subsequent DNA extraction following the CTAB protocol[26]. The extracted DNA was sequenced and processed by LGC Genomics GmbH (Berlin, Germany).
The GBS protocol utilized the ApeKI enzyme, known for partial methylation sensitivity, which has been effective in other species[27]. Sequencing was carried out on the Illumina NextSeq 500/550 and NovaSeq 6000 platforms in 150 bp paired-end mode, generating approximately 450 million reads, with an average of 1.5 million reads per sample (Supplementary Table S3). Data processing included adapter clipping, restriction enzyme site filtering, and quality trimming (Phred score ≥ 20). Reads shorter than 20 bases after trimming were discarded, ensuring high-quality sequences across samples. Data preprocessing involved demultiplexing with bcl2fastq v2.20 software, which allowed for a maximum of two mismatches in barcodes for lane-level demultiplexing, and no mismatches in inline barcodes for sample-level accuracy. Clipped and quality-trimmed reads were aligned to the Prunus armeniaca reference genome (GCA 903112645.1) using BWA-MEM v0.7.12, resulting in a high mapping rate of 99.3%. Variant calling was performed using Freebayes v1.0.2-16 with specific filtering parameters, including a minimum base quality of ten, coverage threshold of five, and exclusion of indels (Supplementary Table S4). Additional filters required variants to have a read count above eight, with a minimum allele frequency of 5% across samples and to be present in at least 10% of individuals. This stringent filtering reduced noise and increased the reliability of SNP calls, producing robust variant datasets.
The resulting files included FASTQ files for raw sequences, Adapter Clipped and Quality Trimmed FASTQ files for processed reads, BAM files for alignments, VCF and Hapmap files containing SNP data, and Read counts and FastQC reports for quality assessment. In the 'B × C' dataset, 97,960 SNPs were detected, with 85,836 SNPs meeting the minimum read count of eight. SNP calling for 'G × C', resulted in 81,914 variants, with 69,045 SNPs meeting the read threshold. High-confidence SNPs (quality score ≥ 98) were retained, and biallelic SNPs were converted to PLINK format for downstream analysis, with further filtering based on missingness and allele frequency criteria. This comprehensive GBS data processing pipeline supports reliable marker-trait association studies in both 'B × C' and 'G × C' populations, providing a solid foundation for genetic analysis and QTL mapping.
SNP filtering
-
SNPs were identified and labeled according to a standardized nomenclature, where each SNP was mapped to pseudomolecules (scaffolds) S1 through S8, followed by its precise physical position in base pairs (bp). For the 'B × C' population, 45,704 SNPs were fully covered, meeting the criteria of an allele frequency ≥ 5% and a minimum read count of eight, present in at least 10% of samples. Similarly, the 'G × C' population yielded 52,166 SNPs that met these criteria. To enhance the accuracy of fine mapping, a series of additional stringent filtering steps were applied to the initial SNP dataset after variant discovery and filtering (Supplementary Table S4): (1) SNPs with more than 20% missing data were excluded to avoid biased results; (2) SNPs showing significant under-calling of homozygotes and heterozygotes were removed according to the Mendelian expectation ratio (1:1, 1:2:1); (3) SNPs in the population that were inconsistent based on reference SNPs from the parental genotypes were removed; (4) previously studied microsatellites in Prunus armeniaca L. were integrated into the dataset to enhance marker coverage and analytical depth[28].
These filtering steps resulted in a high-confidence SNP dataset, optimized for subsequent marker-trait association studies and detailed genetic mapping in the populations under study.
Linkage map construction
-
Genetic linkage maps for each parent were constructed using JoinMap v5 software[29], employing the Kosambi mapping function with a recombination frequency threshold of less than 0.4. A high LOD score threshold of eight was applied to ensure reliable SNP clustering within each linkage group (LG). Three rounds of regression mapping were generated. To further refine the genetic map, SNPs displaying unbalanced locus genotype frequencies, as determined by chi-square distribution analysis, were excluded. Each LG was then recalculated after these adjustments to enhance map accuracy and reduce potential errors in marker positioning. This rigorous filtering and recalculation process aimed to achieve a high-quality genetic map with improved precision and reliability in marker alignment across the linkage groups. A detailed analysis of the parameters is provided in Supplementary Table S4.
Fruit quality trait association and QTL analysis
-
Marker-trait association analyses between SNPs and traits were conducted using TASSEL v5. To achieve this, a General Linear Model (GLM) was employed, integrating quantitative phenotypic data with genotypic information and principal component analysis (PCA). Manhattan plots were generated specifically for the most relevant traits, visually representing the significance of SNP associations across the genome for each selected trait and year.
To further refine QTL interval mapping, a combination of parametric and non-parametric approaches was used. Interval mapping provided estimates of QTL locations with confidence intervals, while the Kruskal–Wallis test—a non-parametric method—validated associations without assuming a normal distribution. Additionally, Multiple QTL Mapping (MQM) was performed using MAPQTL v7, providing an enhanced detection of QTL by accounting for genetic background effects. LOD (logarithm of odds) significance thresholds were calculated individually for each trait and year. These thresholds were established through 1,000 permutation tests using the 'Permutation Test' function.
Analysis of candidate genes linked to major QTLs
-
A list of candidate genes was elaborated considering the main QTLs: skin color, blush color, acidity, and SSC. For this purpose, the reference genome of 'Currot', available on the NCBI database[30], which is a common parent in our populations, was used. Therefore, candidate genes were identified using surrounding sequences of each significant SNP and by blast of these sequences in the Prunus persica v2.1 genome using the Phytozome platform (
https://phytozome-next.jgi.doe.gov ) in order to search the functional annotation of each gene and to determine the potential functions of the genes within these significant regions.Data analysis
-
For the visualization of genetic linkage maps, density maps, and QTL mapping, analyses were conducted using the R software environment (R version 4.3.2, RStudio team). Genetic linkage maps and density maps were visualized with the 'LinkageMapView' and 'ggplot2' packages. Data management and preprocessing were facilitated by the 'readxl' and 'dplyr' packages. This integrated approach in R provided a comprehensive and flexible framework for analyzing and visualizing genetic and QTL mapping data.
-
The GBS technique was implemented in order to carry out accurate genetic mapping, marker–trait association analysis, and QTL analysis in 'B × C' and 'G × C' apricot progenies focused on fruit quality traits and resistance to powdery mildew.
Genetic linkage mapping
-
Linkage maps for the populations were constructed by developing specific genetic maps for each parent, as well as density maps (Supplementary Table S5, Supplementary Fig. S1). Using Genotyping by Sequencing (GBS) technology, a total of 45,704 SNPs were obtained for the 'B × C' population and 52,166 SNPs for the 'G × C' population (Fig. 1).
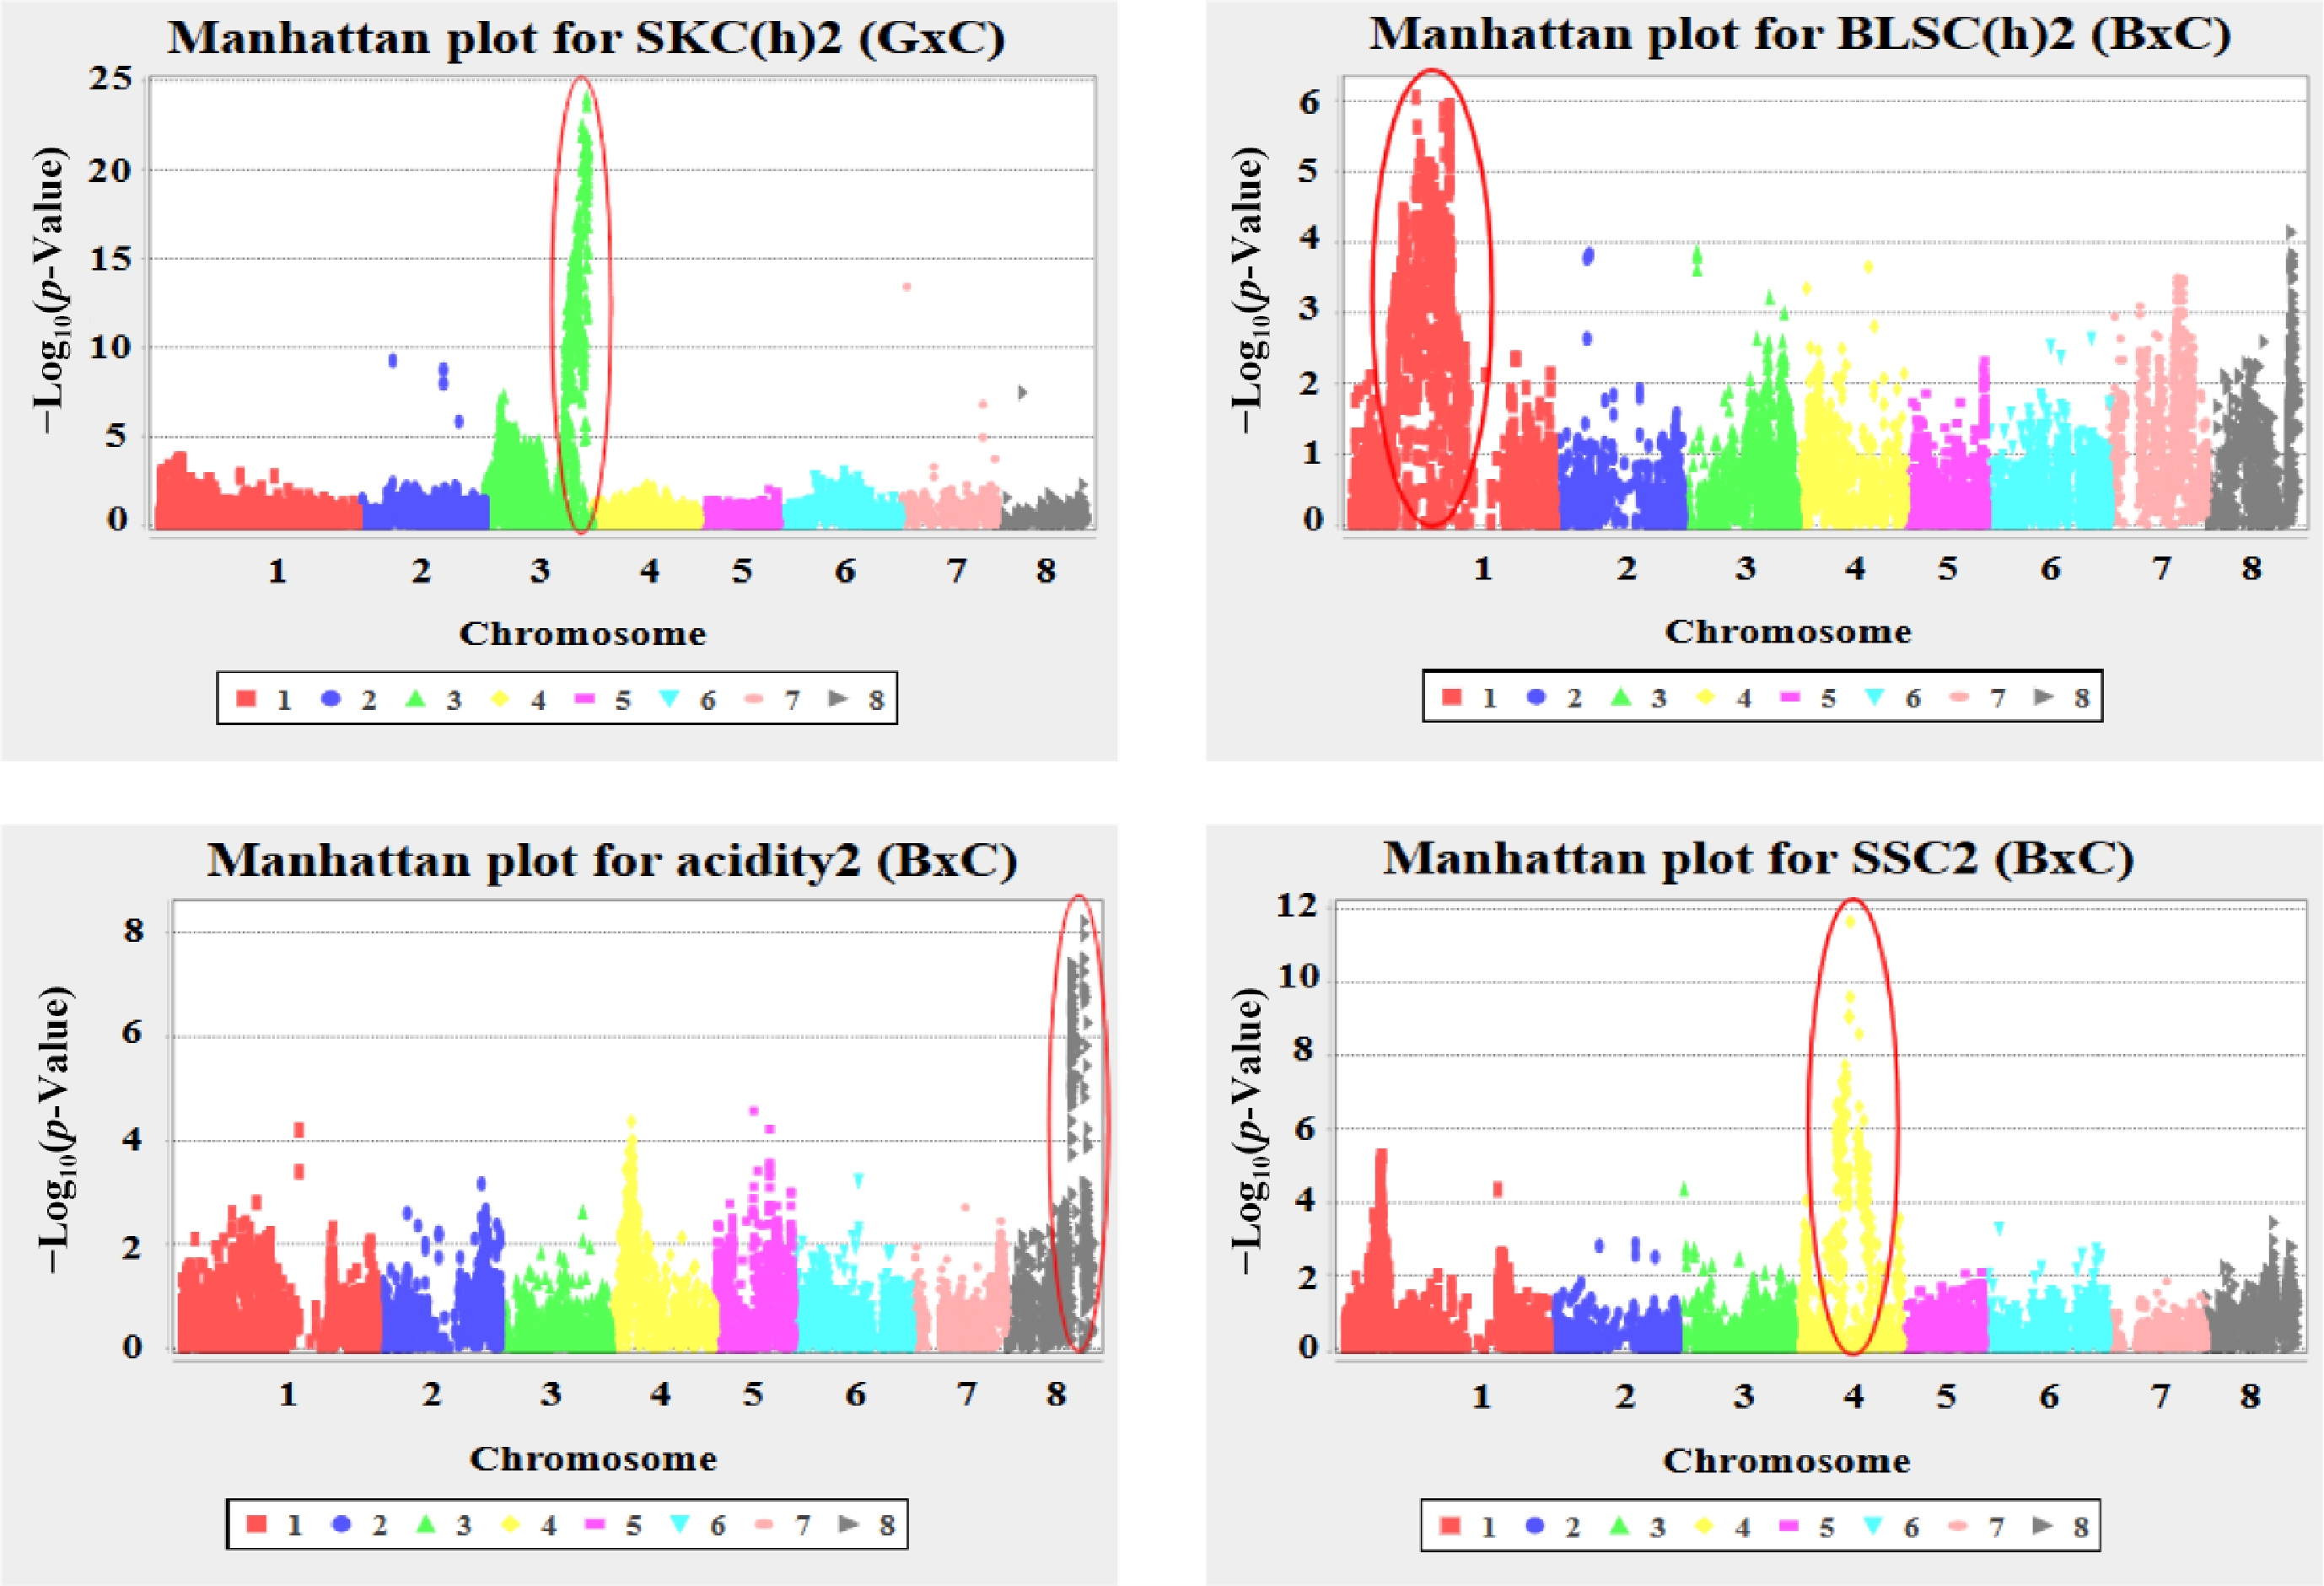
Figure 1.
Manhattan plots of genome-wide association analysis for key fruit quality traits in apricot. Plots show the –log10(p-value) of SNP-trait associations across the eight chromosomes for: SKC(h)13 in 'G × C', and BLSC(h)13, acidity13, and SSC13 in 'B × C'.
'B × C' population
-
For the 'Bergeron' parent, a total of 13,343 SNPs were retained after the final filtering process, of which 642 SNPs were mapped across linkage groups (LGs) one to eight ( Fig. 2). In the 'Bergeron' parental map, the majority of the mapped SNPs (75.2%) were specific to this parent (<lmxll>). To fill gaps, common SNPs shared by both parents (<hkxhk>, 21.9%) were also included, along with previously mapped SSRs[30] as a reference framework ( Supplementary Fig. S2). The total genetic distance covered by SNPs across the LGs ranged from 58 to 108 cM, with an average density of 0.93 cM per SNP (Table 1).
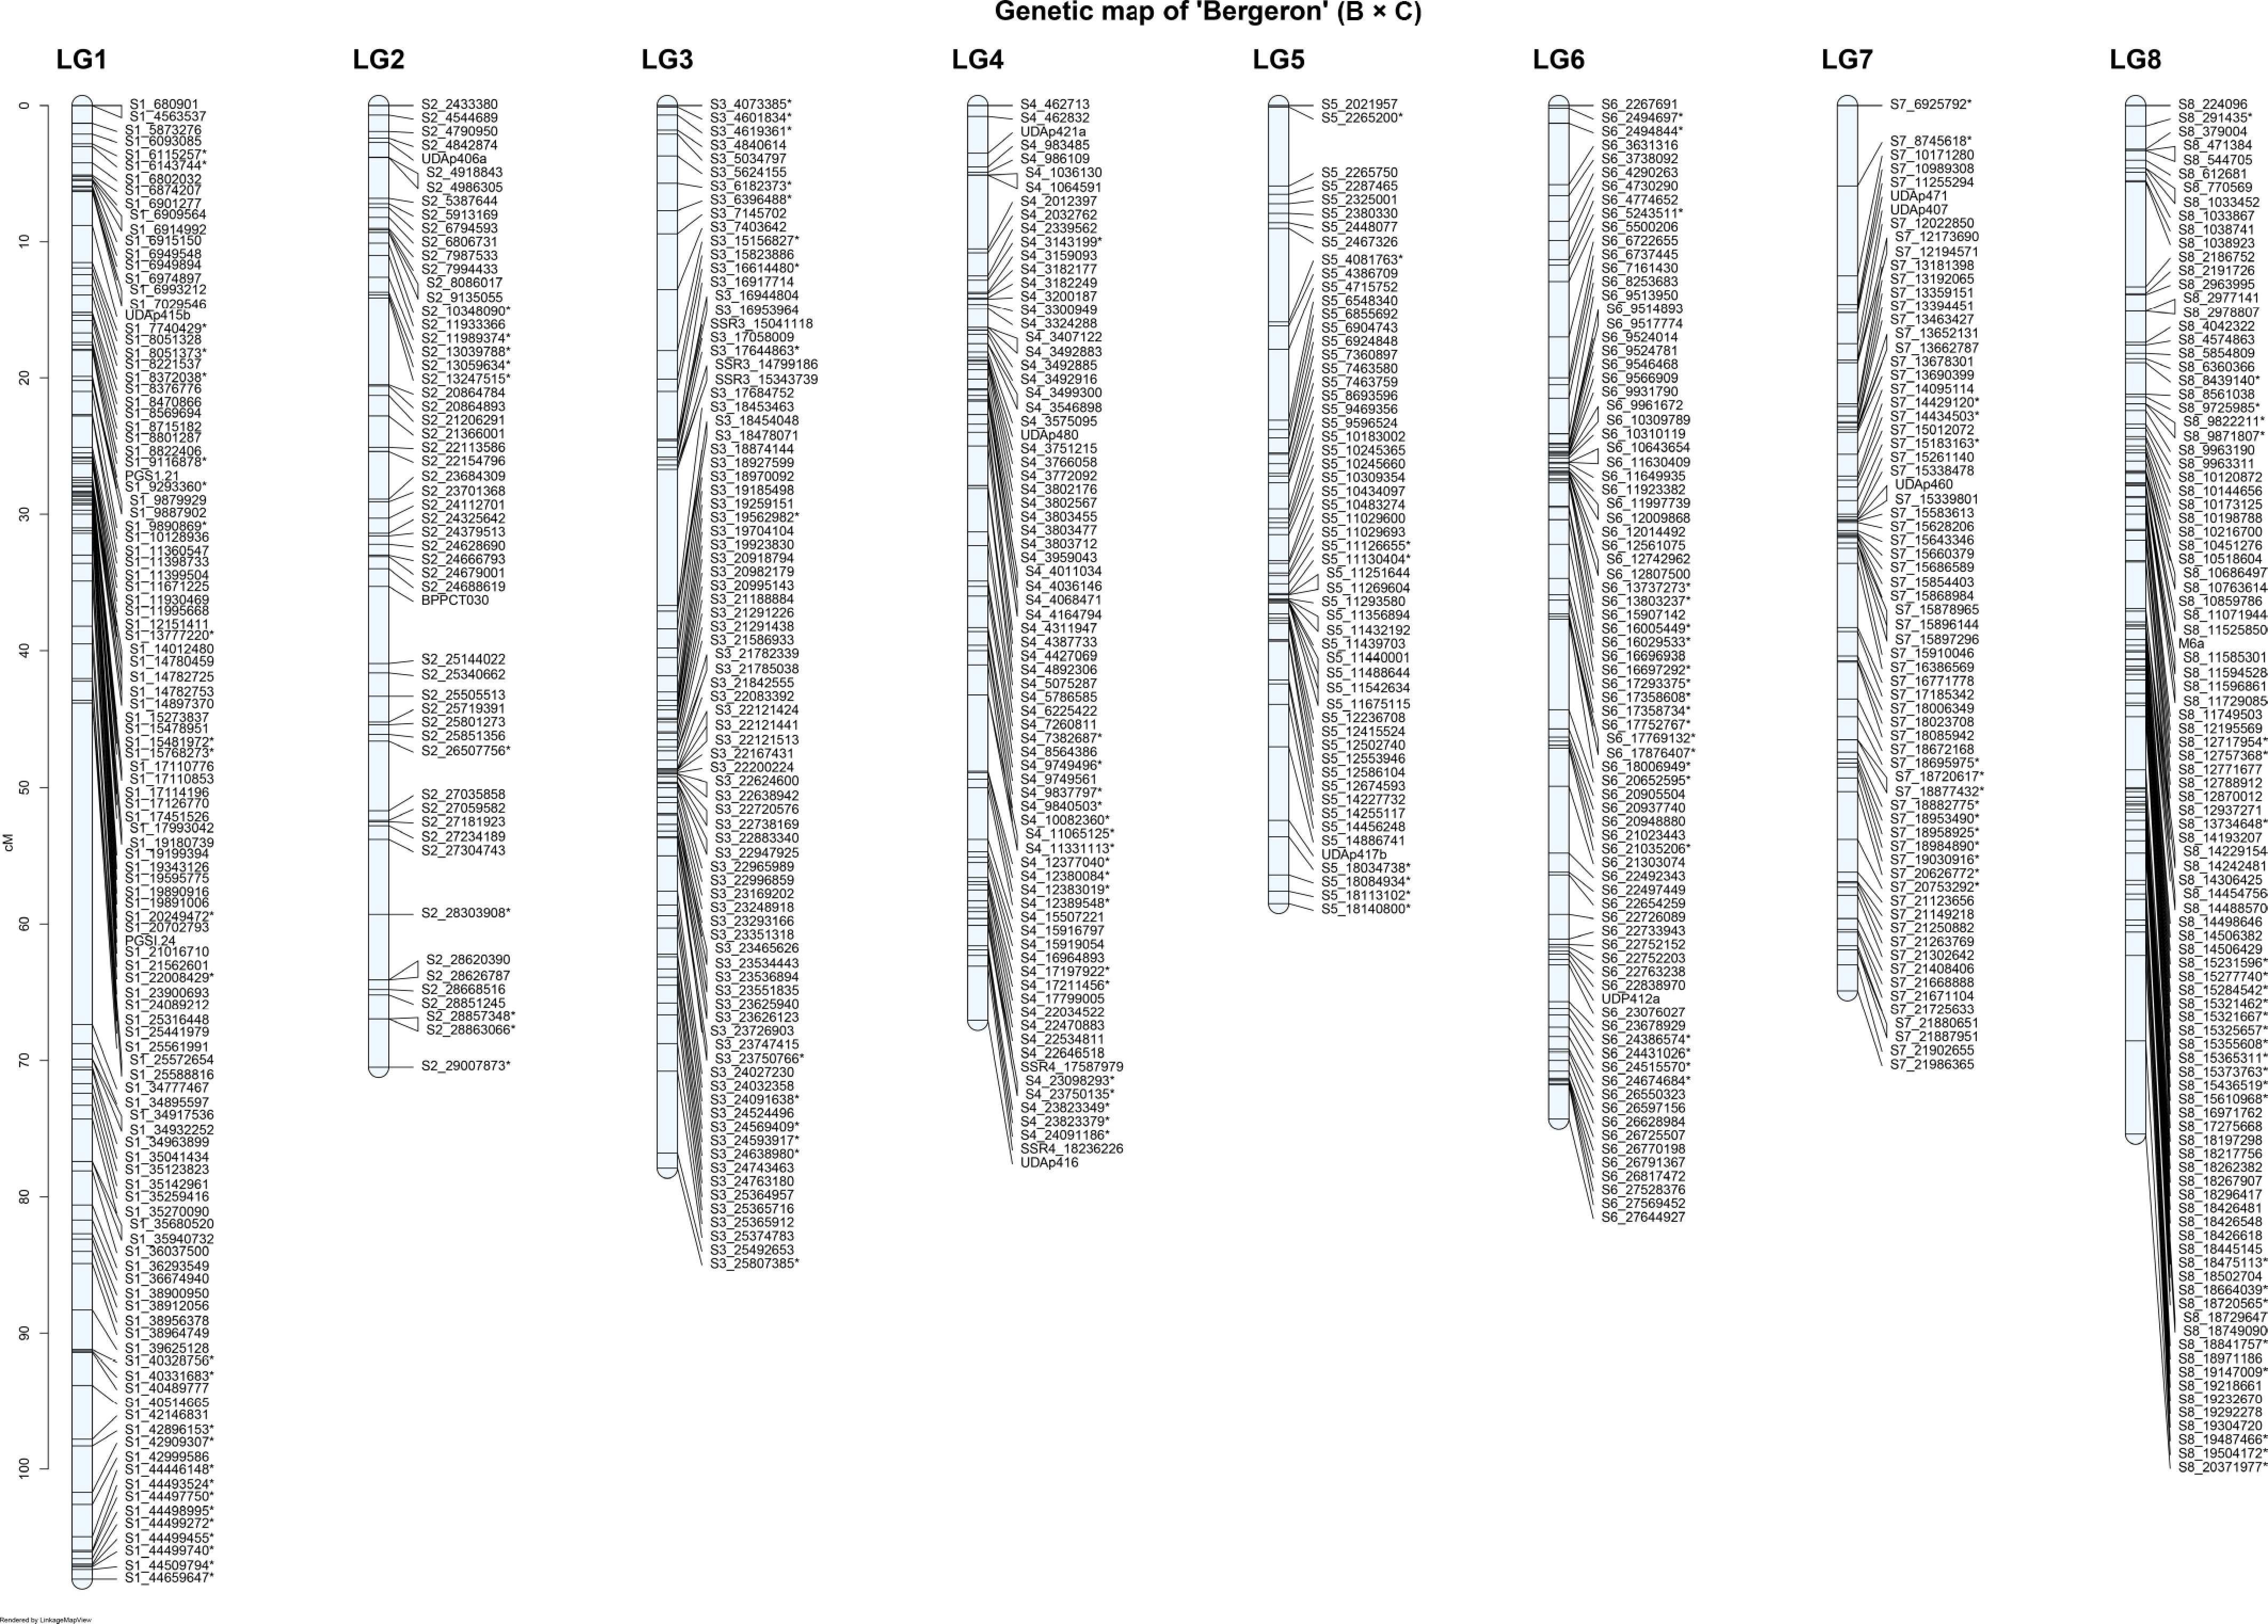
Figure 2.
Genetic linkage map of the 'Bergeron' parent of the 'B × C' apricot population across the eight linkage groups (LG1–LG8). * Common SNPs in both parents.
Table 1. Summary statistics of the 'Bergeron' and 'Currot' genetic maps derived from the 'B × C' cross.
Cultivar SNPs filtered by LGS genomics GmbH Final filtered SNPs LG LOD 8 SNPs Mapped SNPs Distance (cM) Average gap (cM) Density (cM/SNP) 'Bergeron' (B × C') 45,704 (B × C) 13,343 LG1 2,323 115 108.094 0.948 0.93 LG2 1,197 57 70.530 1.259 LG3 1,425 85 77.901 0.927 LG4 1,505 78 67.082 0.871 LG5 1,670 56 58.471 1.063 LG6 2,176 82 74.295 0.917 LG7 1,380 69 64.854 0.954 LG8 1,063 100 75.421 0.762 'Currot' (B × C) 45,704 (B × C) 10,800 LG1 1,346 103 90.254 0.885 1.07 LG2 999 79 107.186 1.374 LG3 1,696 55 95.371 1.766 LG4 1,227 77 71.685 0.943 LG5 1,192 89 77.425 0.880 LG6 1,021 79 99.026 1.270 LG7 812 97 68.422 0.713 LG8 1,384 88 104.276 1.199 For the 'Currot' parent, 10,800 SNPs passed filtering, of which 667 were mapped across LGs one to eight (Fig. 3). In this map, 55.0% of the SNPs were specific to 'Currot' (<nnxnp>), while 41.8% were common SNPs (<hkxhk>). The remaining SNPs corresponded to other segregations derived from previously mapped SSRs[30]. The genetic distance in the LGs of 'Currot' ranged from 68 to 107 cM, with an average density of 1.07 cM per SNP (Table 1).
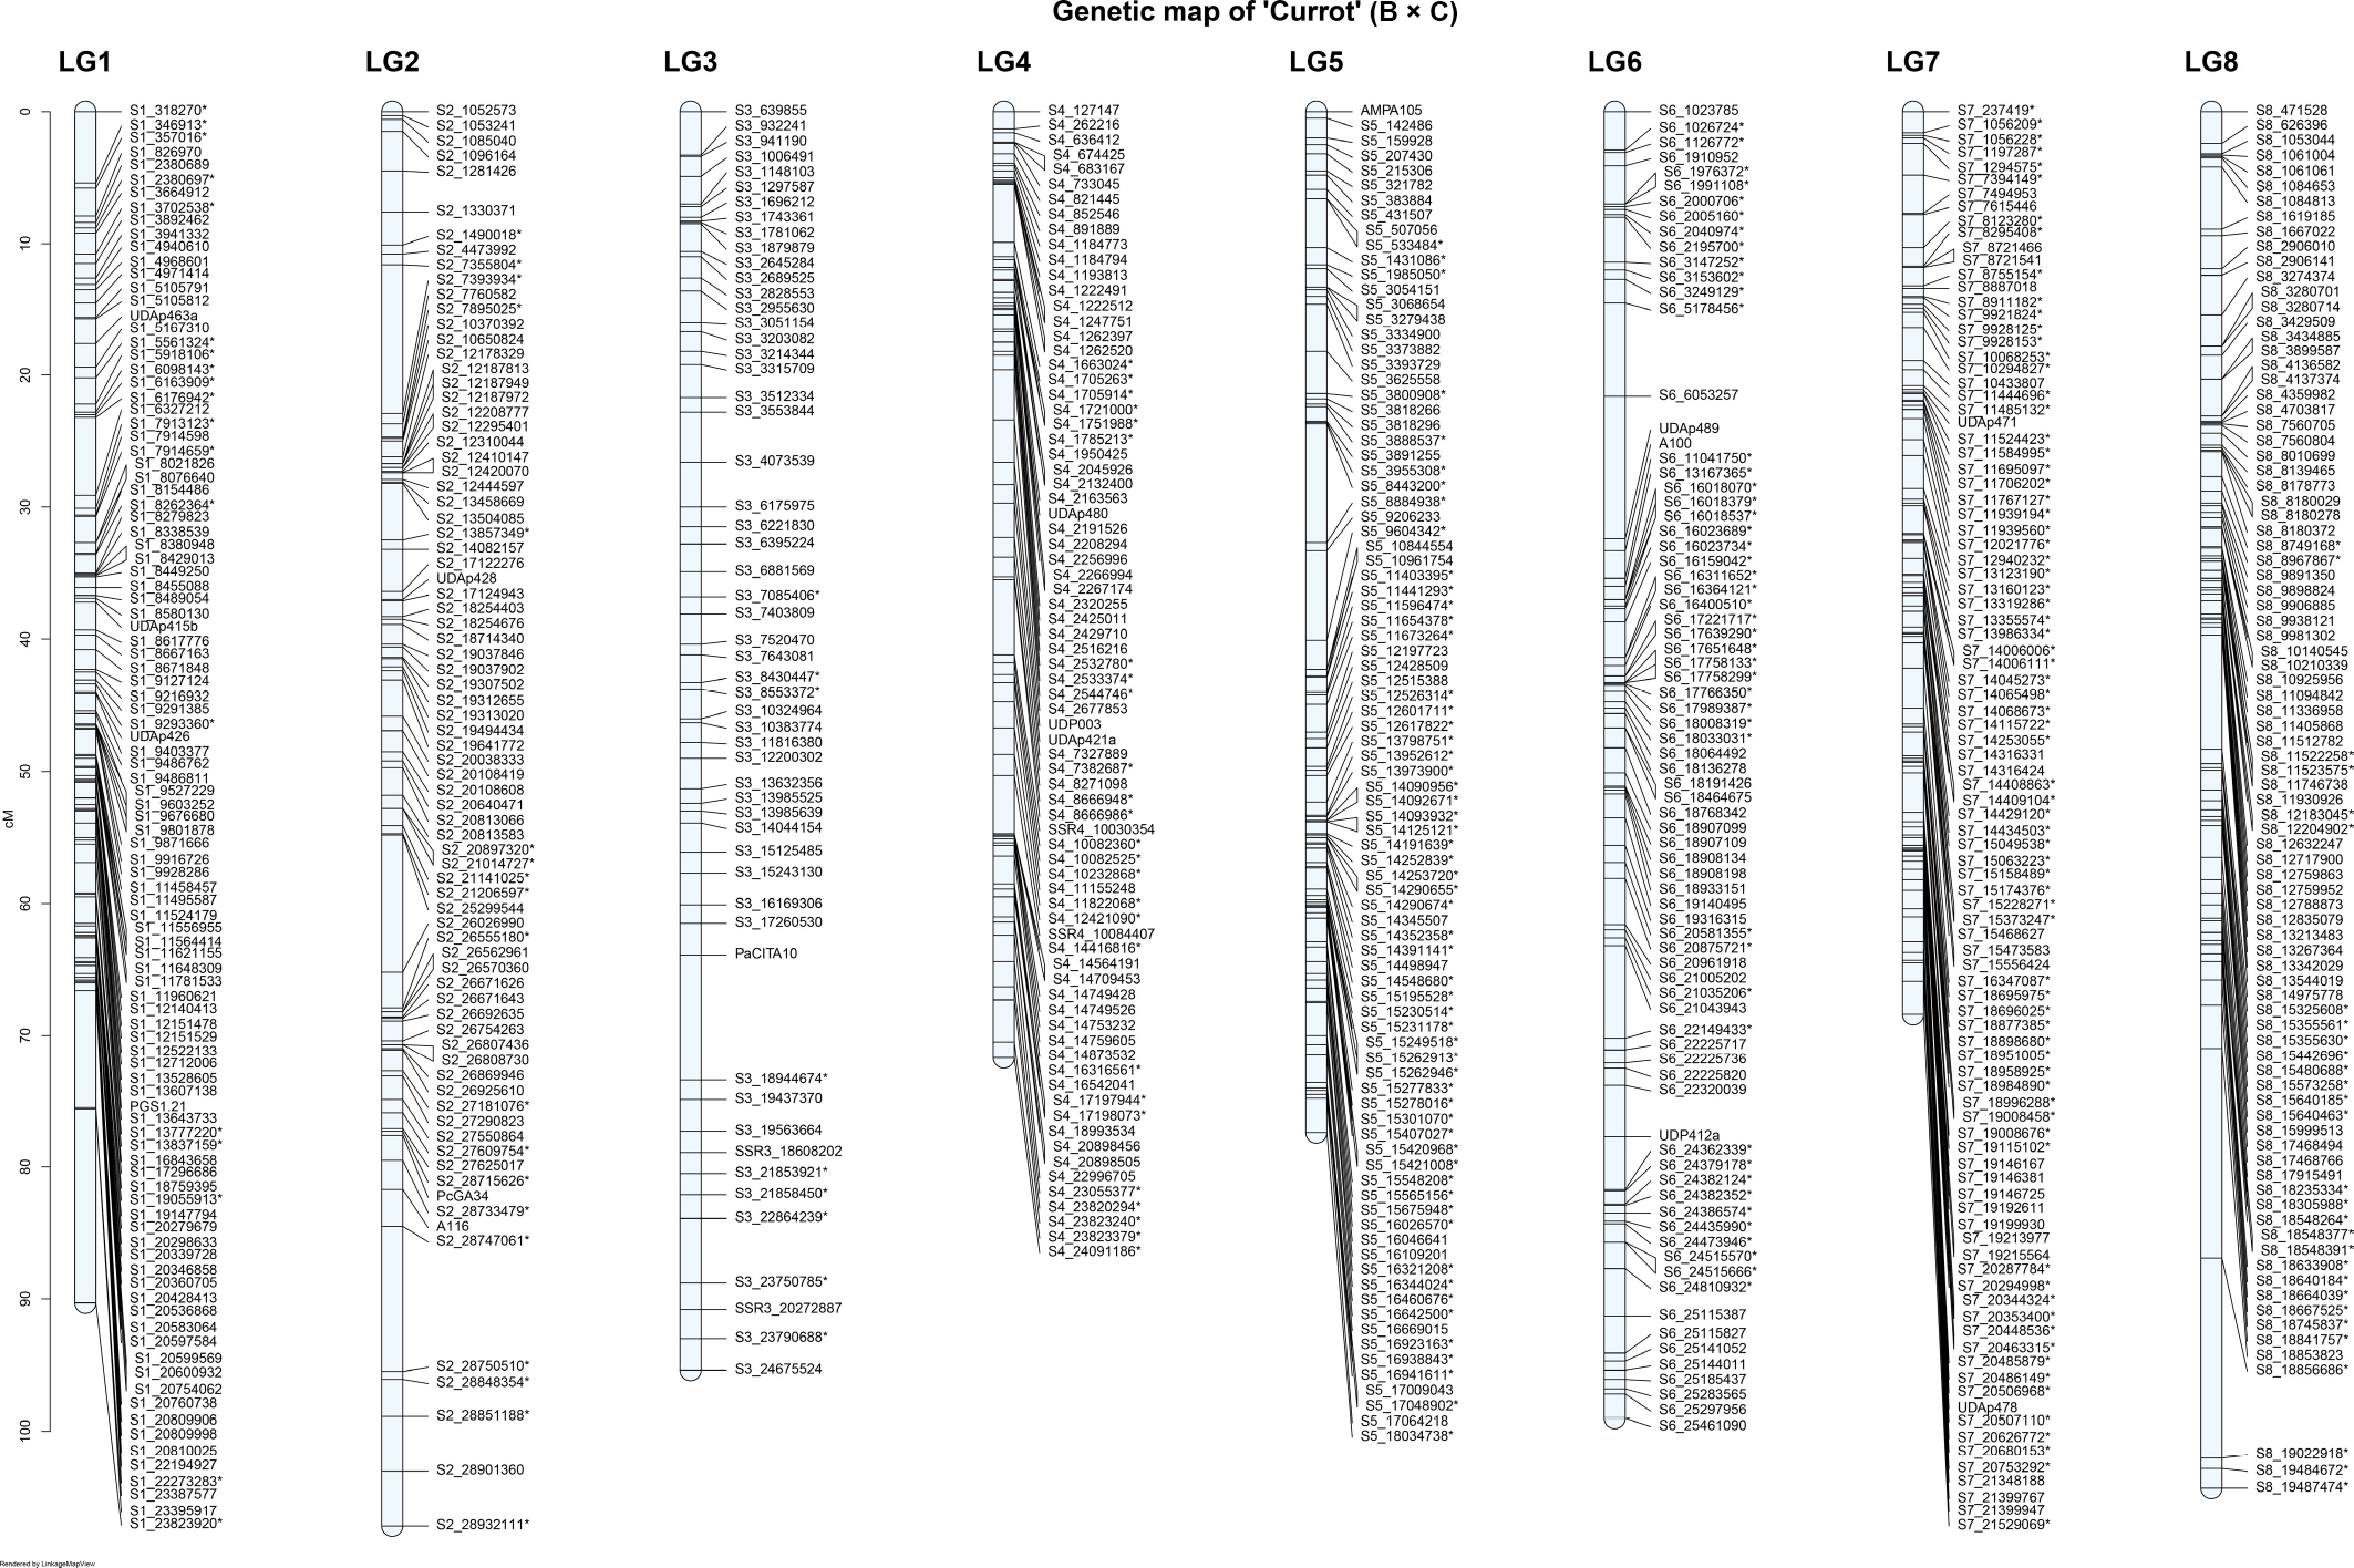
Figure 3.
Genetic linkage map of the 'Currot' parent of the 'B × C' apricot population across the eight linkage groups (LG1–LG8). * Common SNPs in both parents.
'G × C' population
-
For the 'Goldrich' parent, a total of 15,113 SNPs were retained after final filtering, of which 607 were mapped across LGs one to eight ( Fig. 4). In the 'Goldrich' map, 84.0% of the SNPs were specific to this parent (<lmxll>), 13.5% were common SNPs (<hkxhk>), and the remainder corresponded to other segregations from previously mapped SSRs[30]. The total genetic distance spanned by SNPs across the LGs ranged from 45 to 98 cM, with an average density of 0.89 cM per SNP (Table 2).
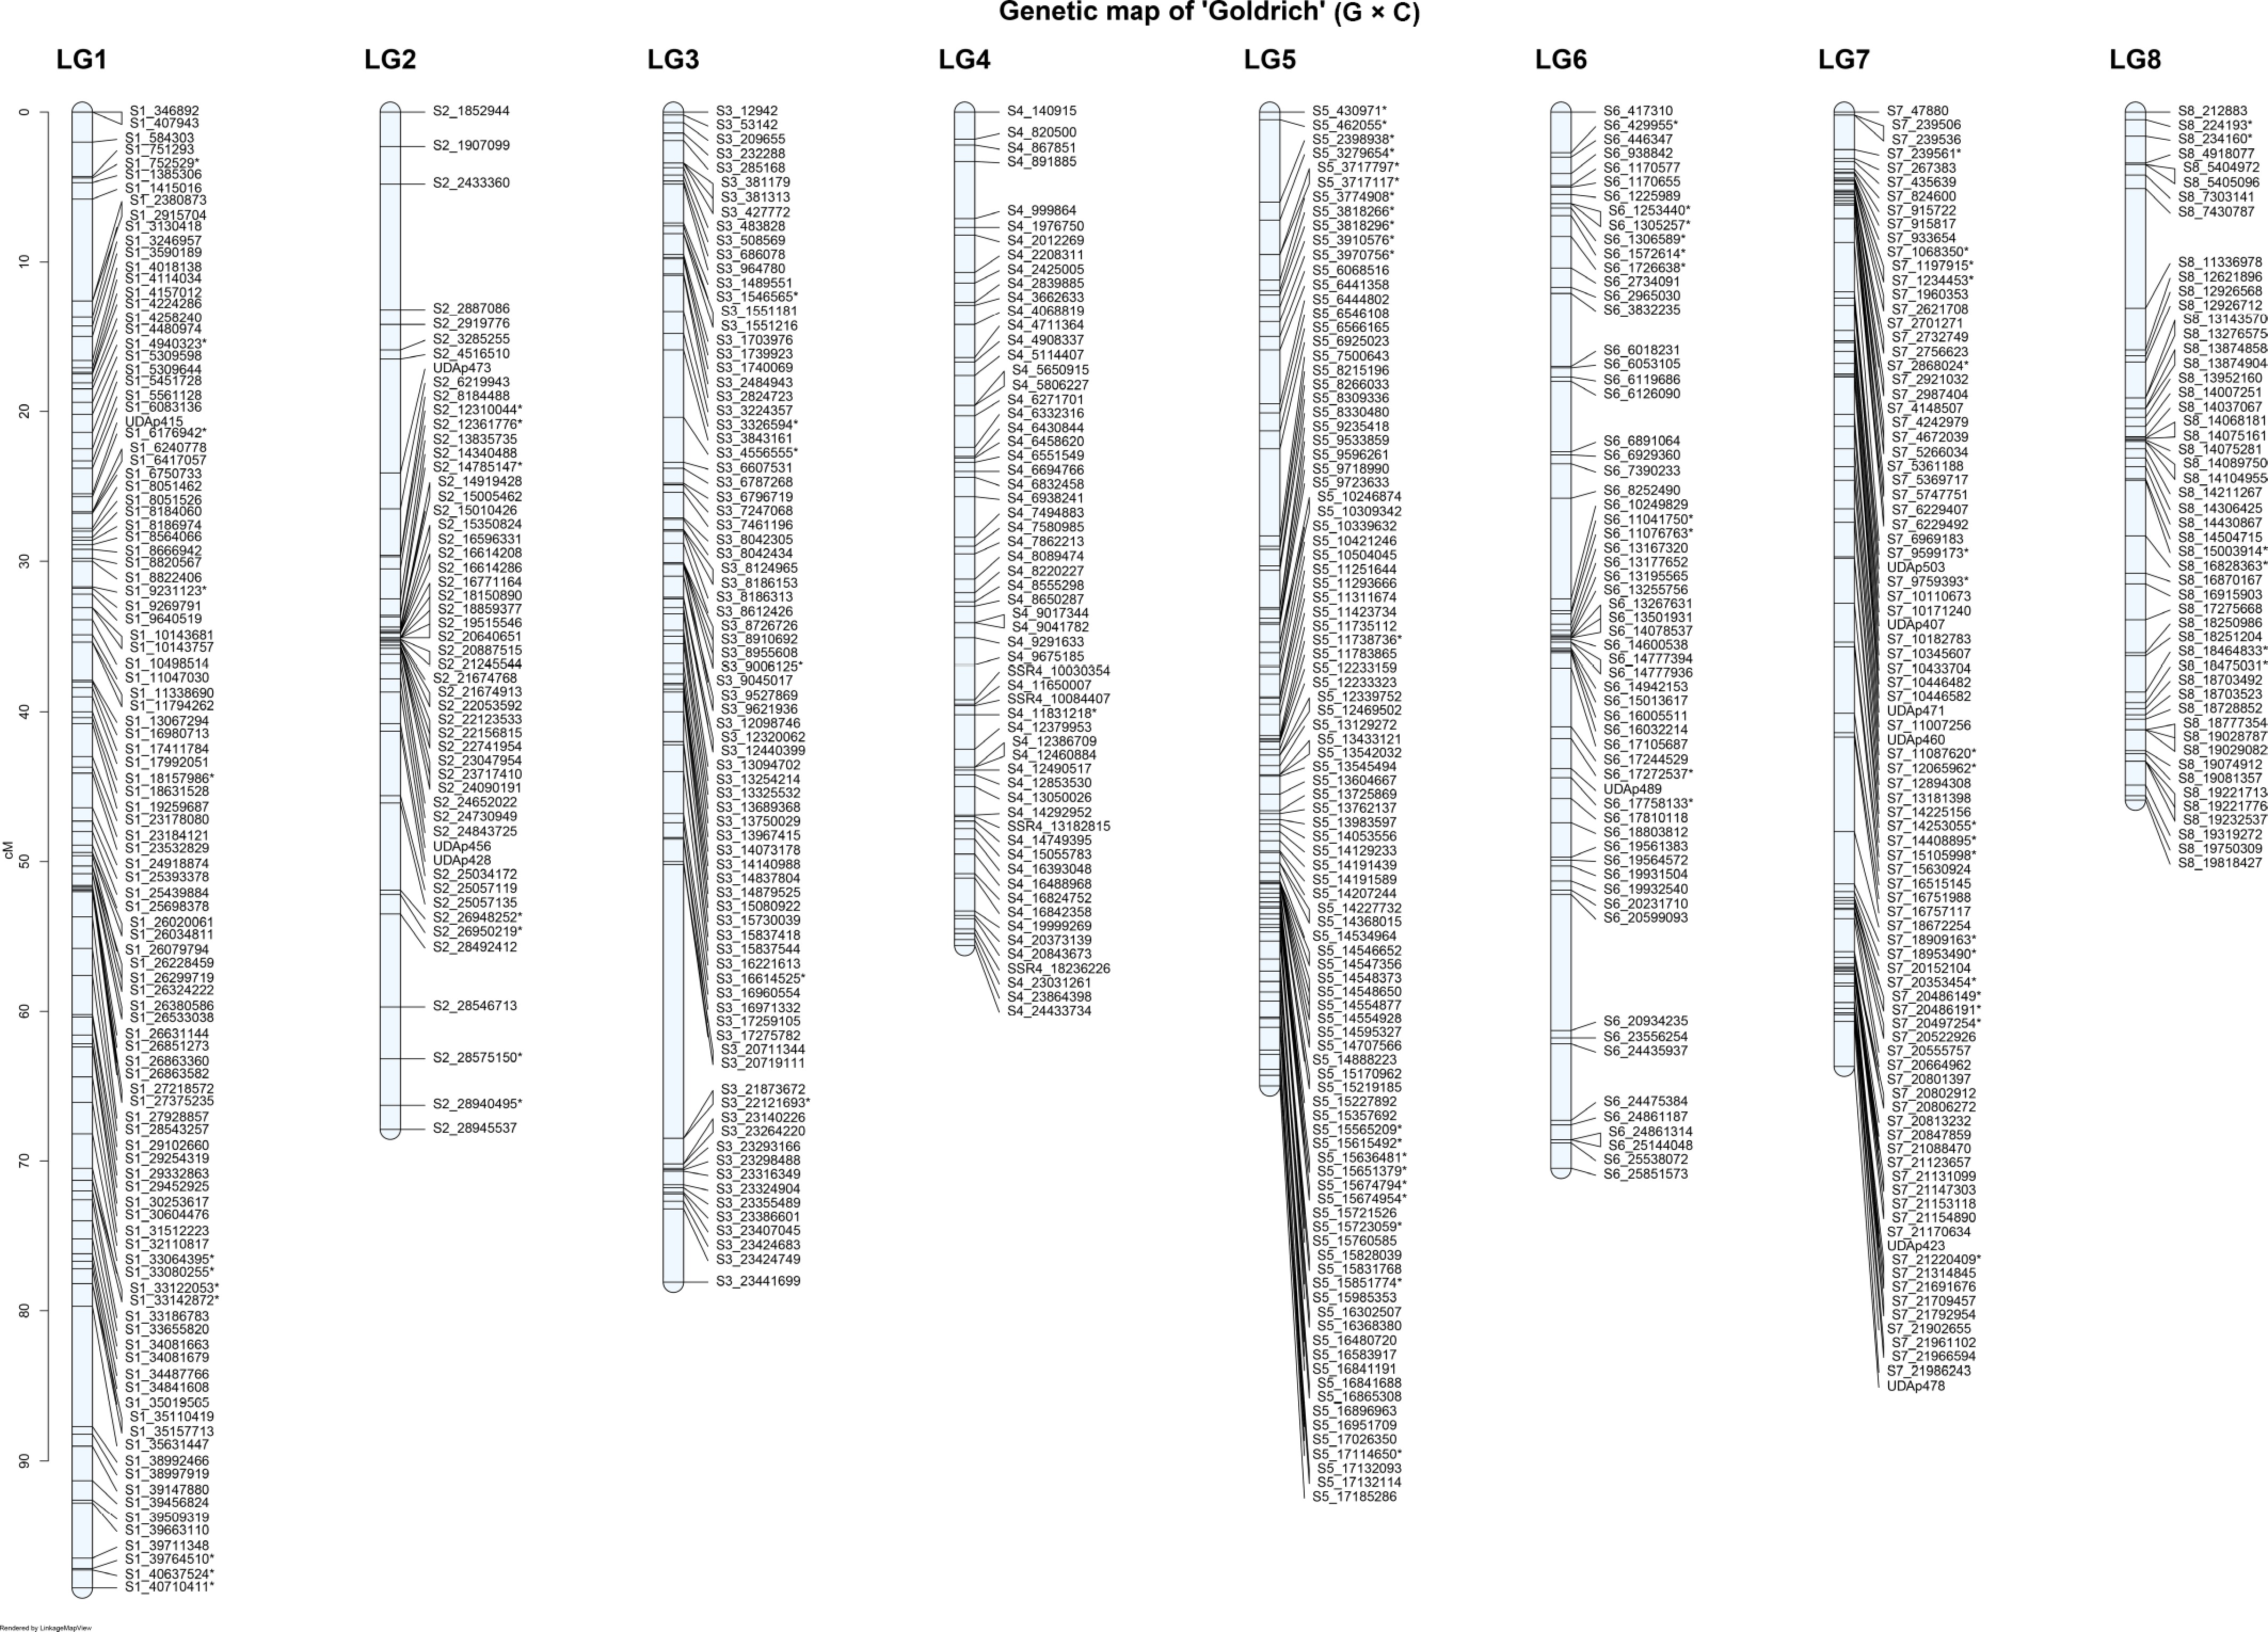
Figure 4.
Genetic linkage map of the 'Goldrich' parent of the 'G × C' apricot population across the eight linkage groups (LG1–LG8). * Common SNPs in both parents.
Table 2. Summary statistics of the 'Goldrich' and 'Currot' genetic maps derived from the 'G × C' cross.
Cultivar SNPs filtered by LGS genomics GmbH Final filtered SNPs LG LOD 8 SNPs Mapped SNPs Distance (cM) Average gap (cM) Density (cM/SNP) 'Goldrich' (G × C) 52,166 (G × C) 15,113 LG1 3,579 108 98.476 0.920 0.89 LG2 2,083 53 67.898 1.306 LG3 1,810 82 78.056 0.960 LG4 1,969 61 55.614 0.927 LG5 1,235 99 64.980 0.663 LG6 2,231 62 70.453 1.155 LG7 1,190 91 63.712 0.708 LG8 601 51 45.883 0.918 'Currot' (G × C) 52,166 (G × C) 9,032 LG1 1,611 85 116.819 1.391 1.40 LG2 860 97 99.612 1.038 LG3 1,515 55 108.437 2.008 LG4 1,027 44 76.186 1.772 LG5 991 52 71.394 1.400 LG6 846 80 110.788 1.402 LG7 696 47 72.871 1.584 LG8 1,133 66 85.130 1.310 For the 'Currot' parent in the 'G × C' population, 9,032 SNPs passed filtering, with 526 mapped across LGs one to eight ( Fig. 5). Of these mapped SNPs, 78.3% were specific to 'Currot' (<nnxnp>), while 18.8% were common SNPs (<hkxhk>) in both parents. The remainder of the map was completed using previously mapped SSRs[30]. The genetic distance in the LGs of 'Currot' ranged from 71 to 116 cM, with an average density of 1.41 cM per SNP (Table 2).
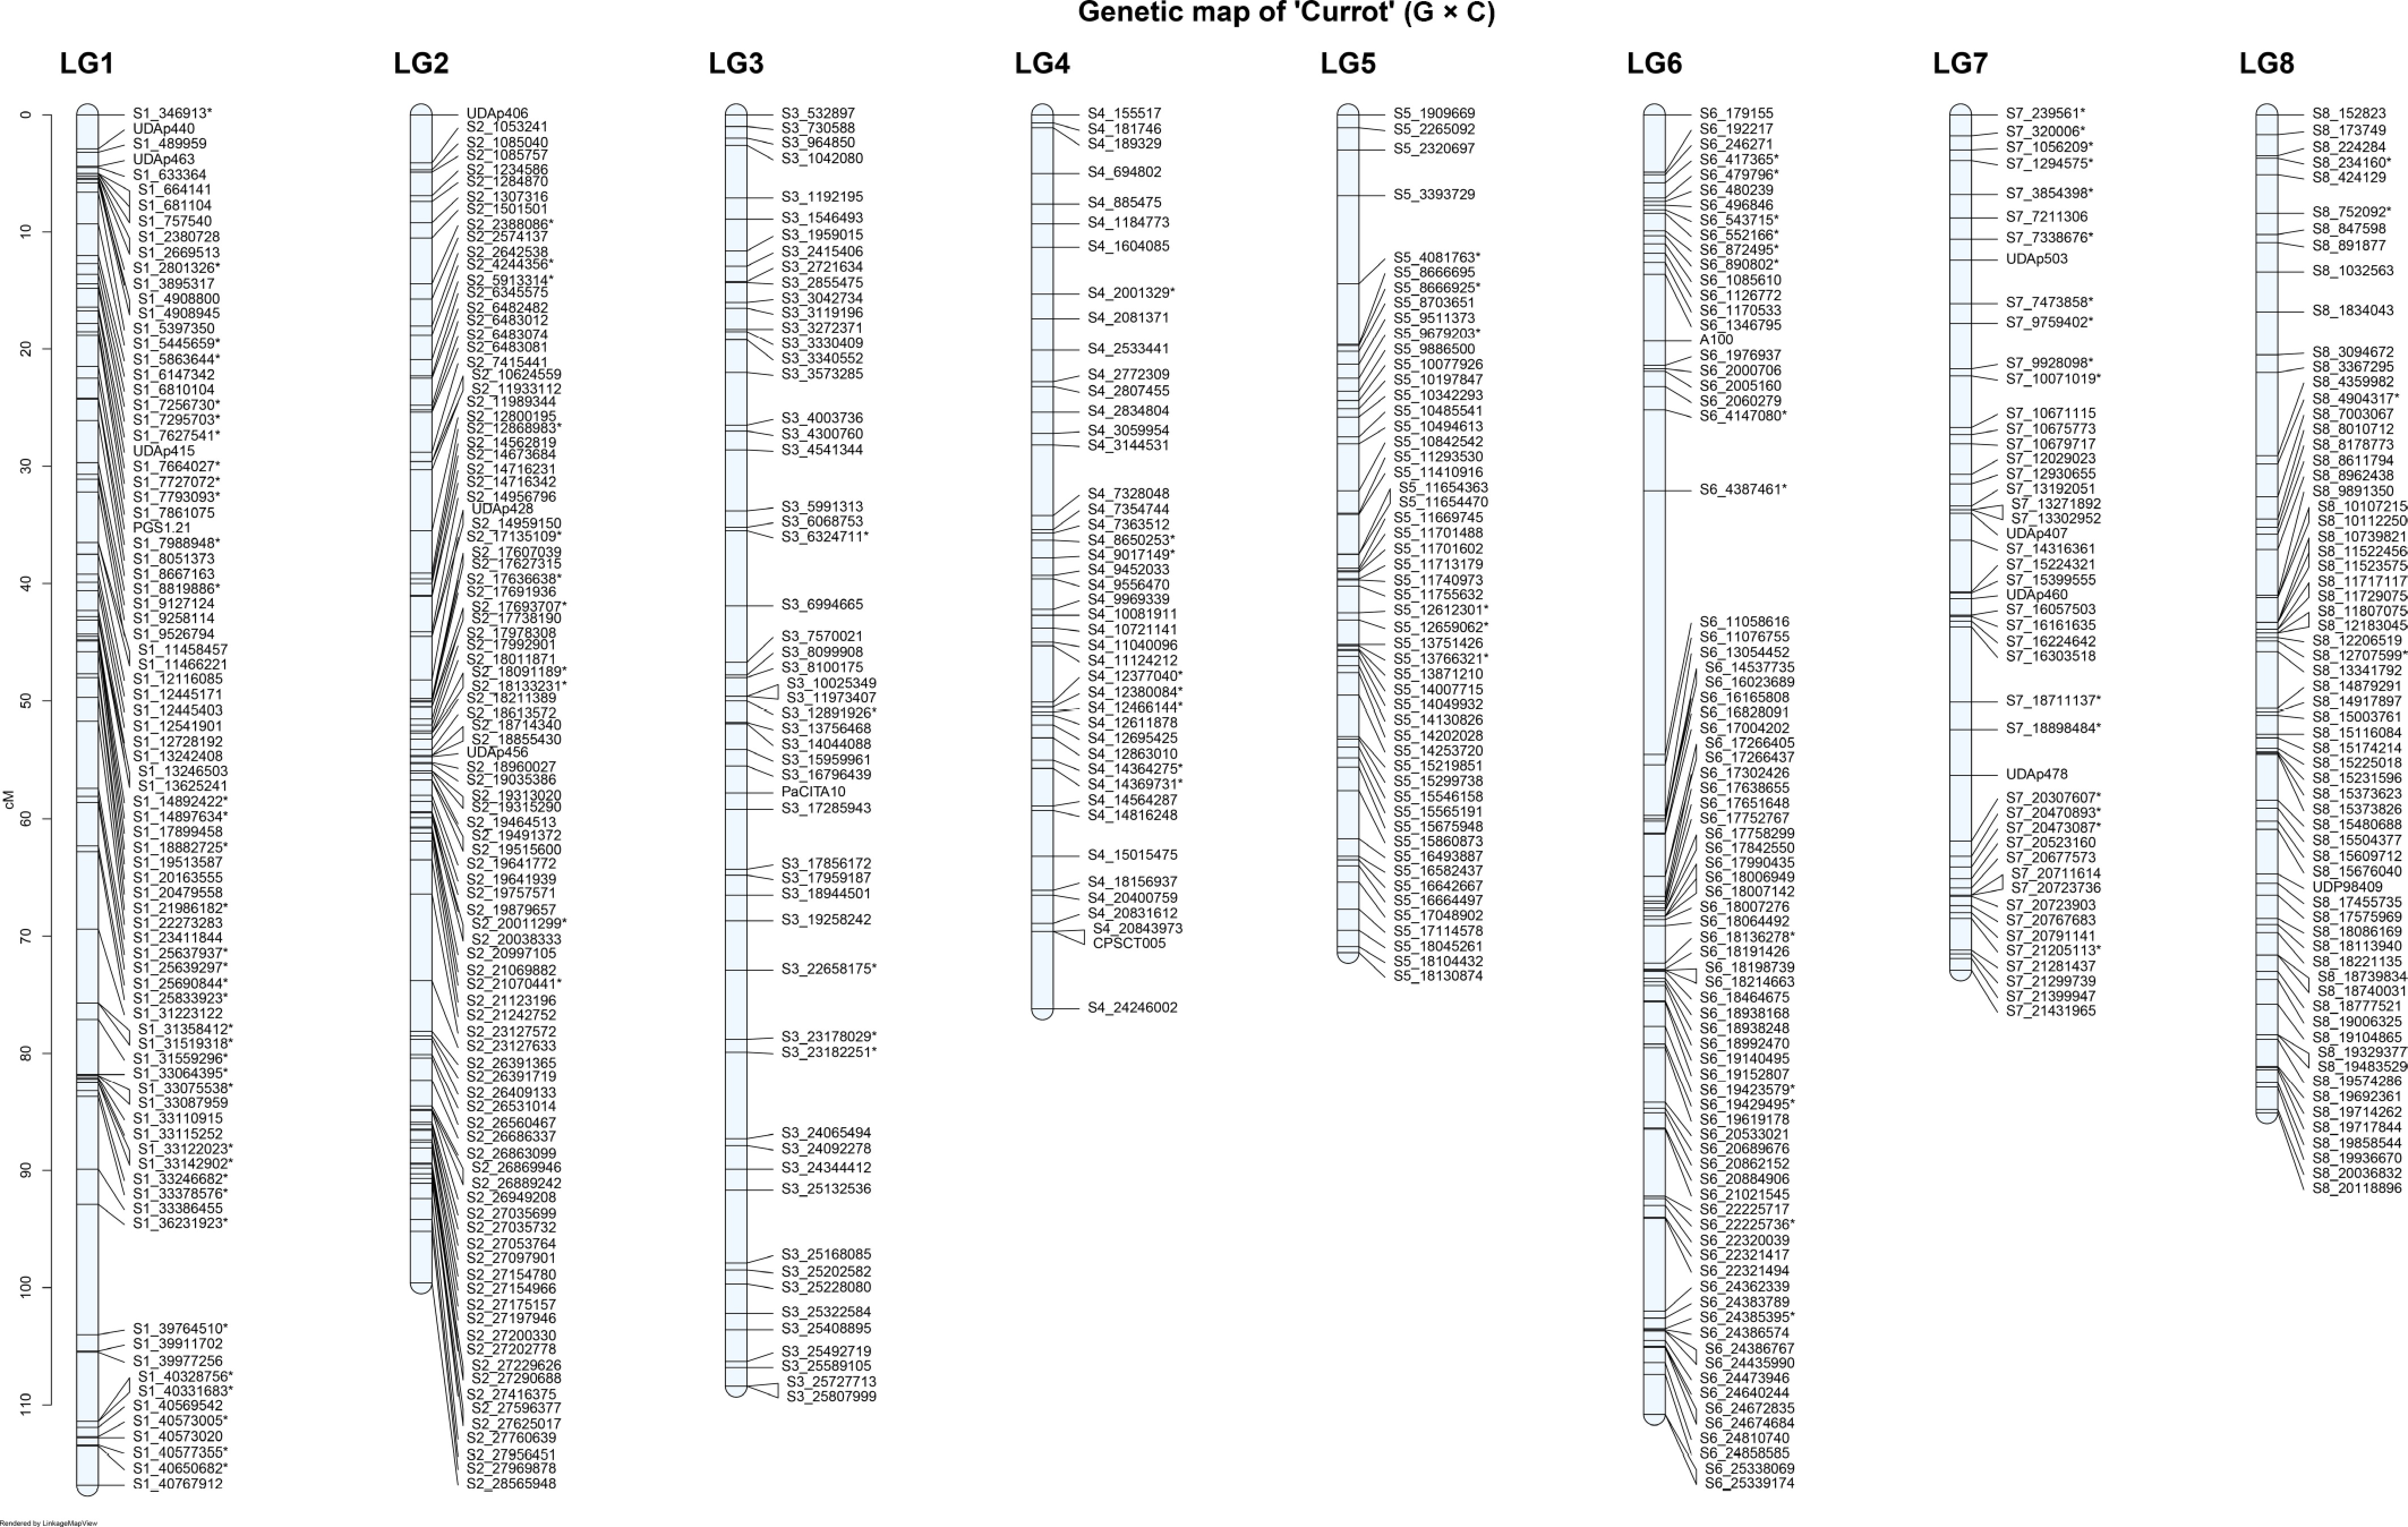
Figure 5.
Genetic linkage map of the 'Currot' parent of the 'G × C' apricot population across the eight linkage groups (LG1–LG8). * Common SNPs in both parents.
Marker-trait association analysis
-
GBS has provided a wide SNP dataset (Supplementary Table S6) for this purpose. The General Linear Model (GLM) analysis was implemented, highlighting five traits of high agronomic relevance: skin color (SKC), blush color (BLSC), soluble solids content (SSC), titratable acidity, and powdery mildew resistance (PM), previously evaluated[20,25]. Notably, these traits exhibited highly significant associations with specific SNP markers in 'B × C' and 'G × C' segregating populations.
In the 'B × C' population, significant associations were identified for soluble solids content (SSC) on chromosome four, linked to S4_12792916 (p-value = 2.34 × 10⁻¹², R2 = 0.36) and S4_12792835 (p-value = 2.63 × 10⁻¹⁰, R2 = 0.31), highlighting the relevance of this region in the sugar metabolism. As for titratable acidity, two markers on chromosome eight—S8_18305988 and S8_18296562—were significantly associated (p-values = 6.18 × 10⁻⁹ and 1.13 × 10⁻⁸, respectively), explaining over 21% of phenotypic explanation variance (R2 = 0.22). Moreover, blush color (BLSC) also exhibited significant associations in the 'B × C' population on chromosome one linked to S1_14222883 (p-value = 8.95 × 10⁻⁷, R2 = 0.15) and S1_21740475 (p-value = 1.18 × 10⁻⁶, R2 = 0.15) which were found to be strongly linked to this characteristic reddish skin color. In addition, in terms of powdery mildew resistance (PM), the LG1 and LG8 were the most relevant chromosomes for S8_6921372 and S1_4507678 (p-value = 8.74 × 10⁻⁶ and 2.69 × 10⁻⁵; R2 = 0.15 and 0.16).
Regarding 'G × C' population, three significant SNPs were identified on chromosome two for powdery mildew resistance (PM) linked to S2_7569982 (p-value = 1.04 × 10⁻⁴), S2_14082026 (p-value = 1.75 × 10⁻⁴), and S2_26602019 (p-value = 2.23 × 10⁻⁴), indicating a relevant genetic control of this trait on this chromosome. However, the most significant associations were found for skin color (SKC), in 'G × C' population, where two markers were tightly linked on chromosome 3—S3_23264061 and S3_23264124—showed extremely significant associations with p-values of 8.77 × 10⁻²⁵ and 2.19 × 10⁻²⁴, respectively. These markers explained a high phenotypic variance, with R2 values of 0.43 and 0.44, respectively (Fig. 1).
QTL mapping
-
QTL analysis for fruit quality traits resulted in several significant QTLs, especially linked to fruit color, soluble solid content, and acidity. To improve the accuracy of QTL detection, a threshold LOD score of 4.5 was established based on a permutation test. Additionally, QTL intervals were represented on genetic maps for the different parental lines: 'Bergeron' (Supplementary Fig. S2), 'Currot' from 'B × C' (Supplementary Fig. S3), 'Goldrich' (Supplementary Fig. S4), and 'Currot' from 'G × C' (Supplementary Fig. S5). The most significant QTLs are presented below:
'B × C' population
-
In terms of 'Bergeron' parent, the most relevant QTLs were identified for soluble solid content (SSC2) and flesh color [FLSC(L)2] (Table 3), both located on linkage group four at the 39.553 cM position and linked to the marker S4_9837797. This locus exhibited high LOD scores of 8.3 and 9.9, explaining 25.0% and 28.9% of the phenotypic explanation variance (PEV), respectively, highlighting it as a key genomic region for fruit quality traits. Additionally, a stable and significant QTL was detected for blush color [BLSC(b)2 and BLSC(h)2], consistently identified across two years of phenotyping, and mapped to SNPs S1_19891006 and S1_19890916 on LG1. These loci showed LOD values of 9.8 and 7.6, accounting for 29.2% and 23.5% of the PEV, respectively, confirming their relevance for external fruit appearance. Moreover, a relevant QTL for acidity (Acidity2) was detected on LG8 at 40.071 cM (SNP S8_15284542), with a LOD of 7.0 and explaining 21.4% of the PEV, indicating its potential impact on taste perception.
Table 3. QTLs identified in the 'Bergeron' parent from the 'B × C' cross for the evaluated traits.
Parent Traita LG Position (cM) Locus Segregation LODb Kc PEVd 'Bergeron' ('B × C') FW1 6 56.160 S6_22497449 <lmxll> 5.7 19.9 17.9 SW1 6 46.260 S6_20937740 <lmxll> 5.7 23.4 18.1 SW2 6 27.720 S6_15907142 <lmxll> 5.1 19.3 16.0 FIRM2 4 48.800 S4_12377040 <hkxhk> 5.5 22.9 17.2 SKC(L)1 4 38.312 S4_9749496 <hkxhk> 6.6 15.2 20.7 SKC(L)2 4 38.312 S4_9749496 <hkxhk> 7.8 11.3 24.1 SKC(b)2 6 5.828 S6_3631316 <lmxll> 5.1 13.6 16.3 BLSC(L)1 1 29.724 S1_19890916 <lmxll> 6.4 14.1 20.3 BLSC(L)2 1 29.724 S1_19890916 <lmxll> 8.9 26.1 26.8 BLSC(a)1 1 43.575 S1_25561991 <lmxll> 5.4 16.7 17.4 BLSC(a)2 1 29.724 S1_19890916 <lmxll> 6.0 21.4 19.0 BLSC(b)1 1 30.009 S1_19891006 <lmxll> 6.3 18.1 19.9 BLSC(b)2 1 30.009 S1_19891006 <lmxll> 9.8 29.0 29.2 BLSC(h)1 1 29.724 S1_19890916 <lmxll> 5.9 20.7 18.9 BLSC(h)2 1 29.724 S1_19890916 <lmxll> 7.6 25.7 23.5 FLSC(L)1 4 38.312 S4_9749496 <hkxhk> 5.3 17.4 17.2 FLSC(L)2 4 39.553 S4_9837797 <hkxhk> 9.9 28.5 28.9 FLSC(b)1 6 68.348 S6_24674684 <hkxhk> 5.5 21.7 17.6 Acidity1 8 42.149 S8_15373763 <hkxhk> 5.5 22.7 17.6 Acidity2 8 40.071 S8_15284542 <hkxhk> 7.0 27.1 21.4 SSC1 4 41.021 S4_10082360 <hkxhk> 5.1 19.3 16.5 SSC2 4 39.553 S4_9837797 <hkxhk> 8.3 31.4 25.0 a FW: Fruit weight, SW: stone weight, FIRM: firmness, SKC(L): skin color (L* = lightness), SKC(b): skin color (b* = blue to yellow), BLSC(L): blush color (L* = lightness), BLSC(a): blush color (a* = green to red), BLSC(b): blush color (b* = blue to yellow), BLSC(h): blush color (h° = hue angle), FLSC(L): flesh color (L* = lightness), FLSC(b): flesh color (b* = blue to yellow), SSC: soluble solids content. 1 and 2 represent different years of phenotyping. b 'LOD' represents the statistic obtained from the interval mapping test. c 'K' refers to the statistic derived from the Kruskal-Wallis test. d 'PEV' indicates the percentage of phenotypic variation explained by the marker. In the 'Currot' parent, one of the most significant QTL was identified for soluble solid content (SSC2) (Table 4), located on LG4 at 46.691 cM and linked to marker S4_11822068, with a LOD score of 8.9 and explaining 26.5% of the PEV. A strong QTL was also associated with flesh color (FLSC(L)2) on LG4 at 46.691 cM, linked to marker S4_11822068, showing the highest LOD value (8.4) and explaining 25.0% of the PEV, confirming this locus as a hotspot for quality-related traits. Moreover, blush color (BLSC(b)2) also showed significant QTLs, particularly on LG1 at 59.290 cM, linked to marker S1_19055913, with a LOD score of 8.5 and explaining 25.8% of the PEV. Although the LOD value was moderate, the consistency across years and marker associations suggests its relevance in blush pigmentation. Additionally, important loci for acidity were detected on LG8 at 31.617 cM (SNP S8_10210339), with a LOD score of 6.5 (Acidity1), explaining 20.5% of the PEV.
Table 4. QTLs identified in the 'Currot' parent from the 'B × C' cross for the evaluated traits.
Parent Traita LG Position (cM) Locus Segregation LODb Kc PEVd 'Currot' ('B × C') SW1 6 41.446 S6_16364121 <hkxhk> 6.5 17.3 20.3 SW2 6 41.446 S6_16364121 <hkxhk> 6.1 18.7 18.9 SKC(L)1 4 46.691 S4_11822068 <hkxhk> 7.3 23.4 22.7 SKC(L)2 4 43.277 S4_10232868 <hkxhk> 5.1 16.4 16.4 SKC(b)1 3 19.218 S3_3315709 <nnxnp> 8.6 27.9 26.3 SKC(b)2 3 21.665 S3_3512334 <nnxnp> 5.2 18.2 16.8 BLSC(L)1 1 44.027 UDAp426 <lmxll> 6.4 16.7 20.4 BLSC(L)2 1 44.027 UDAp426 <lmxll> 8.8 29.4 26.6 BLSC(b)2 1 59.290 S1_19055913 <hkxhk> 8.5 22.6 25.8 BLSC(h)1 1 55.032 S1_13777220 <hkxhk> 5.7 18.1 18.3 BLSC(h)2 1 44.027 UDAp426 <lmxll> 7.1 26.1 22.0 FLSC(L)1 4 46.691 S4_11822068 <hkxhk> 6.8 25.9 21.4 FLSC(L)2 4 46.691 S4_11822068 <hkxhk> 8.4 33.9 25.0 FLSC(a)1 6 70.212 S6_22149433 <hkxhk> 5.5 18.1 17.6 FLSC(a)2 6 70.212 S6_22149433 <hkxhk> 6.6 15.1 20.3 FLSC(b)1 6 70.212 S6_22149433 <hkxhk> 7.4 27.6 23.0 FLSC(b)2 6 70.212 S6_22149433 <hkxhk> 6.5 14.4 19.9 FLSC(h)1 6 70.212 S6_22149433 <hkxhk> 5.7 18.4 18.3 FLSC(h)2 6 70.212 S6_22149433 <hkxhk> 5.9 14.8 18.4 Acidity1 8 31.617 S8_10210339 <nnxnp> 6.5 16.7 20.5 SSC1 4 48.669 S4_12421090 <hkxhk> 7.2 15.2 22.6 SSC2 4 46.691 S4_11822068 <hkxhk> 8.9 35.5 26.5 a SW: Stone weight, SKC(L): skin color (L* = Lightness), SKC(b): skin color (b* = blue to yellow), BLSC(L): blush color (L* = lightness), BLSC(b): blush color (b* = blue to yellow), BLSC(h): blush color (h° = hue angle), FLSC(L): flesh color (L* = lightness), FLSC(a): flesh color (a* = green to red), FLSC(b): flesh color (b* = blue to yellow), FLSC(h): flesh color (h° = hue angle), SSC: soluble solids content. 1 and 2 represent different years of phenotyping. b 'LOD' represents the statistic obtained from the interval mapping test. c 'K' refers to the statistic derived from the Kruskal-Wallis test. d 'PEV' indicates the percentage of phenotypic variation explained by the marker. 'G × C' population
-
In the 'Goldrich' parent, significant QTLs were identified for key fruit quality traits, including skin color (SKC), flesh color (FLSC), acidity, soluble solids content (SSC), firmness, and powdery mildew (PM) resistance (Table 5). QTLs for SKC were primarily located on LG3, between positions 48.522 and 70.722 cM, linked to markers S3_17259105 and S3_23316349. These regions exhibited high LOD scores ranging from 7.8 to 25.5, which explained between 20.8% and 53.4% of the phenotypic variation (PEV), indicating a strong genetic control of this trait. Similarly, FLSC-related QTLs co-localized in the same region (LG3, 70.722 cM), with LOD values between 11.1 and 20.1 and PEV ranging from 28.5% to 44.6%, confirming this as a major locus for internal fruit pigmentation. A notable QTL for acidity was detected on LG2 at 33.580 cM, associated with marker S2_14340488, with a LOD of 10.9 and explaining 27.5% of the PEV. For SSC, a significant QTL was found on LG4 at marker S4_11831218, with a LOD of 11.1 and accounting for 28.0% of the PEV. Importantly, a strong QTL for firmness (FIRM2) was detected on LG2 at 35.633 cM, linked to marker S2_22156815, showing a LOD of 8.8 and explaining 22.6% of the PEV, highlighting its contribution to texture-related traits. Additionally, disease resistance was addressed through the identification of a QTL associated with powdery mildew (PM3) on LG2 at 24.134 cM (marker UDAp473), which showed a moderate LOD score of 5.3 and explained 14.1% of the PEV.
Table 5. QTLs identified in the 'Goldrich' parent from the 'G × C' cross for the evaluated traits.
Parent Traita LG Position (cM) Locus Segregation LODb Kc PEVd 'Goldrich' ('G × C') FW2 1 79.676 S1_35631447 <lmxll> 7.6 27.8 19.8 SW2 2 33.696 S2_14785147 <hkxhk> 7.6 27.8 19.8 P1 1 64.389 S1_31512223 <lmxll> 6.5 18.6 17.1 FIRM1 3 50.017 S3_17275782 <lmxll> 7.5 27.5 19.8 FIRM2 2 35.633 S2_22156815 <lmxll> 8.8 31.7 22.6 SIZE2 1 79.676 S1_35631447 <lmxll> 9.8 33.7 25.0 SKC(L)1 3 70.722 S3_23316349 <lmxll> 15.7 56.8 36.9 SKC(L)2 3 70.722 S3_23316349 <lmxll> 13.7 48.5 33.6 SKC(a)1 3 70.722 S3_23316349 <lmxll> 24.7 86.2 51.5 SKC(a)2 3 70.722 S3_23316349 <lmxll> 25.5 80.4 53.4 SKC(b)1 3 46.783 S3_16614525 <hkxhk> 11.4 42.4 28.4 SKC(b)2 3 48.522 S3_17259105 <lmxll> 7.8 24.6 20.8 SKC(h)1 3 70.722 S3_23316349 <lmxll> 24.2 85.9 50.9 SKC(h)2 3 70.722 S3_23316349 <lmxll> 25.0 79.2 52.7 BLSC(a)1 3 72.151 S3_23407045 <lmxll> 6.5 22.8 21.6 BLSC(a)2 3 68.462 S3_21873672 <lmxll> 6.7 26.3 18.5 BLSC(b)1 3 39.968 S3_15730039 <lmxll> 7.1 28.0 23.5 BLSC(b)2 3 39.968 S3_15730039 <lmxll> 6.6 26.4 18.2 FLSC(L)1 4 49.499 S4_16488968 <lmxll> 6.2 16.1 16.6 FLSC(L)2 6 23.508 S6_7390233 <lmxll> 5.5 16.2 15.4 FLSC(a)1 3 70.722 S3_23316349 <lmxll> 19.7 67.7 43.9 FLSC(a)2 3 70.204 S3_23140226 <lmxll> 15.8 56.7 37.9 FLSC(b)1 3 70.722 S3_23316349 <lmxll> 11.8 40.6 29.2 FLSC(b)2 3 70.722 S3_23316349 <lmxll> 11.1 38.1 28.5 FLSC(h)1 3 70.722 S3_23316349 <lmxll> 20.1 69.9 44.6 FLSC(h)2 3 70.204 S3_23140226 <lmxll> 15.6 56.5 37.7 pH2 2 32.499 S2_13835735 <lmxll> 5.9 17.3 15.9 Acidity1 8 39.429 S8_18475031 <hkxhk> 5.0 14.3 13.7 Acidity2 2 33.580 S2_14340488 <lmxll> 10.9 41.6 27.5 SSC1 4 40.228 S4_11831218 <hkxhk> 7.6 32.7 20.3 SSC2 4 40.228 S4_11831218 <hkxhk> 11.1 44.4 28.0 PM3 2 24.134 UDAp473 <abxcd> 5.3 22.4 14.1 a FW: Fruit weight, SW: stone weight, P: productivity, FIRM: firmness, SIZE: size, SKC(L): Skin Color (L* = Lightness), SKC(a): skin color (a* = green to red), SKC(b): skin color (b* = blue to yellow), SKC(h): skin color (h° = hue angle), BLSC(a): blush color (a* = green to red), BLSC(b): blush color (b* = blue to yellow), FLSC(L): flesh color (L* = Lightness), FLSC(a): flesh color (a* = green to red), FLSC(b): flesh color (b* = blue to yellow), FLSC(h): flesh color (h° = hue angle), SSC: soluble solids content, PM: powdery mildew. 1, 2, and 3 represent different years of phenotyping. b 'LOD' represents the statistic obtained from the interval mapping test. c 'K' refers to the statistic derived from the Kruskal-Wallis test. d 'PEV' indicates the percentage of phenotypic variation explained by the marker. As for the 'Currot' parent, relevant QTLs were identified for key fruit traits including skin color (SKC), flesh color (FLSC), acidity, soluble solids content (SSC), firmness, and disease resistance (Table 6). The QTLs for SKC were primarily located on LG3, position 72.859 cM, linked to SNP S3_22658175, which is common across years and consistent with both parents. These loci exhibited significant LOD scores ranging from 10.1 to 22.7, explaining between 25.6% and 49.2% of the PEV, underlining their importance for skin pigmentation. Similarly, QTLs for FLSC were also detected on LG3, especially around 72.859 cM, associated with marker S3_22658175. These loci showed LOD values between 7.5 and 15.3, explaining 19.8% to 37.1% of the PEV. A major QTL for acidity was also found on LG2 at 52.656 cM (SNP S2_18091189), with a LOD score of 9.4 and a PEV of 24.1%. Moreover, though less significant, an acidity QTL was observed on LG8 (SNP S8_15480688), with a LOD score of 6.2 and 16.8% PEV. In contrast, for SSC, a strong QTL was identified on LG4 at 53.107 cM, linked to S4_12863010, showing a LOD score of 12.1 and explaining 30.1% of the PEV. Finally, firmness (FIRM2) was also associated with this same genomic region on LG2 (SNP S2_17693707), with a LOD of 7.6 and 19.9% PEV.
Table 6. QTLs identified in the 'Currot' parent from the 'G × C' cross for the evaluated traits.
Parent Traita LG Position (cM) Locus Segregation LODb Kc PEVd 'Currot' ('G × C') FW2 1 92.908 S1_36231923 <hkxhk> 6.1 22.0 16.3 SW2 2 52.656 S2_18091189 <hkxhk> 8.2 29.8 21.2 P1 1 81.785 S1_33064395 <hkxhk> 6.9 19.4 18.2 FIRM2 2 50.469 S2_17693707 <hkxhk> 7.6 24.0 19.9 SIZE2 1 92.908 S1_36231923 <hkxhk> 7.5 28.2 19.8 SKC(L)1 3 72.859 S3_22658175 <hkxhk> 10.1 33.1 25.6 SKC(L)2 3 72.859 S3_22658175 <hkxhk> 10.8 18.2 27.6 SKC(a)1 3 72.859 S3_22658175 <hkxhk> 18.7 53.9 42.3 SKC(a)2 3 72.859 S3_22658175 <hkxhk> 22.7 56.5 49.2 SKC(b)1 3 50.031 S3_12891926 <hkxhk> 9.2 36.9 23.5 SKC(b)2 3 50.031 S3_12891926 <hkxhk> 6.0 25.4 16.4 SKC(h)1 3 72.859 S3_22658175 <hkxhk> 18.2 53.3 41.4 SKC(h)2 3 72.859 S3_22658175 <hkxhk> 22.3 54.9 48.7 BLSC(a)2 3 72.859 S3_22658175 <hkxhk> 6.9 22.4 19.1 FLSC(L)1 4 51.955 S4_12695425 <nnxnp> 6.5 14.6 17.4 FLSC(L)2 4 51.955 S4_12695425 <nnxnp> 7.1 15.5 19.4 FLSC(a)1 3 72.859 S3_22658175 <hkxhk> 14.7 45.5 35.1 FLSC(a)2 3 72.859 S3_22658175 <hkxhk> 15.3 44.5 37.1 FLSC(b)1 3 72.859 S3_22658175 <hkxhk> 7.5 26.8 19.8 FLSC(b)2 3 72.859 S3_22658175 <hkxhk> 9.9 29.3 25.8 FLSC(h)1 3 72.859 S3_22658175 <hkxhk> 14.2 46.9 34.1 FLSC(h)2 3 72.859 S3_22658175 <hkxhk> 15.3 44.4 37.1 Acidity1 8 58.385 S8_15480688 <nnxnp> 6.2 27.6 16.8 Acidity2 2 52.656 S2_18091189 <hkxhk> 9.4 21.2 24.1 SSC1 4 53.107 S4_12863010 <nnxnp> 8.5 24.9 22.4 SSC2 4 53.107 S4_12863010 <nnxnp> 12.1 35.0 30.1 a FW: fruit weight, SW: stone weight, P: productivity, FIRM: firmness, SIZE: size, SKC(L): skin color (L* = lightness), SKC(a): skin color (a* = green to red), SKC(b): skin color (b* = blue to yellow), SKC(h): skin color (h° = hue angle), BLSC(a): blush color (a* = green to red), FLSC(L): flesh color (L* = Lightness), FLSC(a): flesh color (a* = green to red), FLSC(b): flesh color (b* = blue to yellow), FLSC(h): flesh color (h° = hue angle), SSC: soluble solids content. 1 and 2 represent different years of phenotyping. b 'LOD' represents the statistic obtained from the interval mapping test. c 'K' refers to the statistic derived from the Kruskal-Wallis test. d 'PEV' indicates the percentage of phenotypic variation explained by the marker. Genes linked to major QTLs
-
Based on QTL analysis by IM, Multiple QTL Mapping (MQM) refined the QTL interval associated with key fruit quality traits in apricot (Fig. 6). In 'Goldrich', a major QTL for skin color (SKC(h)2) was identified on linkage group three, exhibiting a pronounced LOD peak clearly exceeding the significance threshold, indicating a strong and stable genetic effect. In 'Bergeron', a prominent QTL for blush color (BLSC(h)2) was detected on LG1, with a high and narrow LOD peak, suggesting a major locus controlling red pigmentation in the fruit skin. Additionally, a QTL for acidity (Acidity2) was mapped on LG8, with a clear LOD peak surpassing the threshold, supporting its relevance in the regulation of fruit taste. For soluble solids content (SSC2), a notable QTL was identified on LG4, where the LOD curve revealed a significant peak, reflecting a genetic region involved in sugar accumulation. Therefore, in order to explore the genetic basis of the traits mapped through QTL analysis, gene annotation was performed within the most relevant physical intervals (Supplementary Table S7). This analysis aims to generate a hypothetical list of candidate genes, which should be considered as a starting point for future validation through functional assays and gene expression studies.
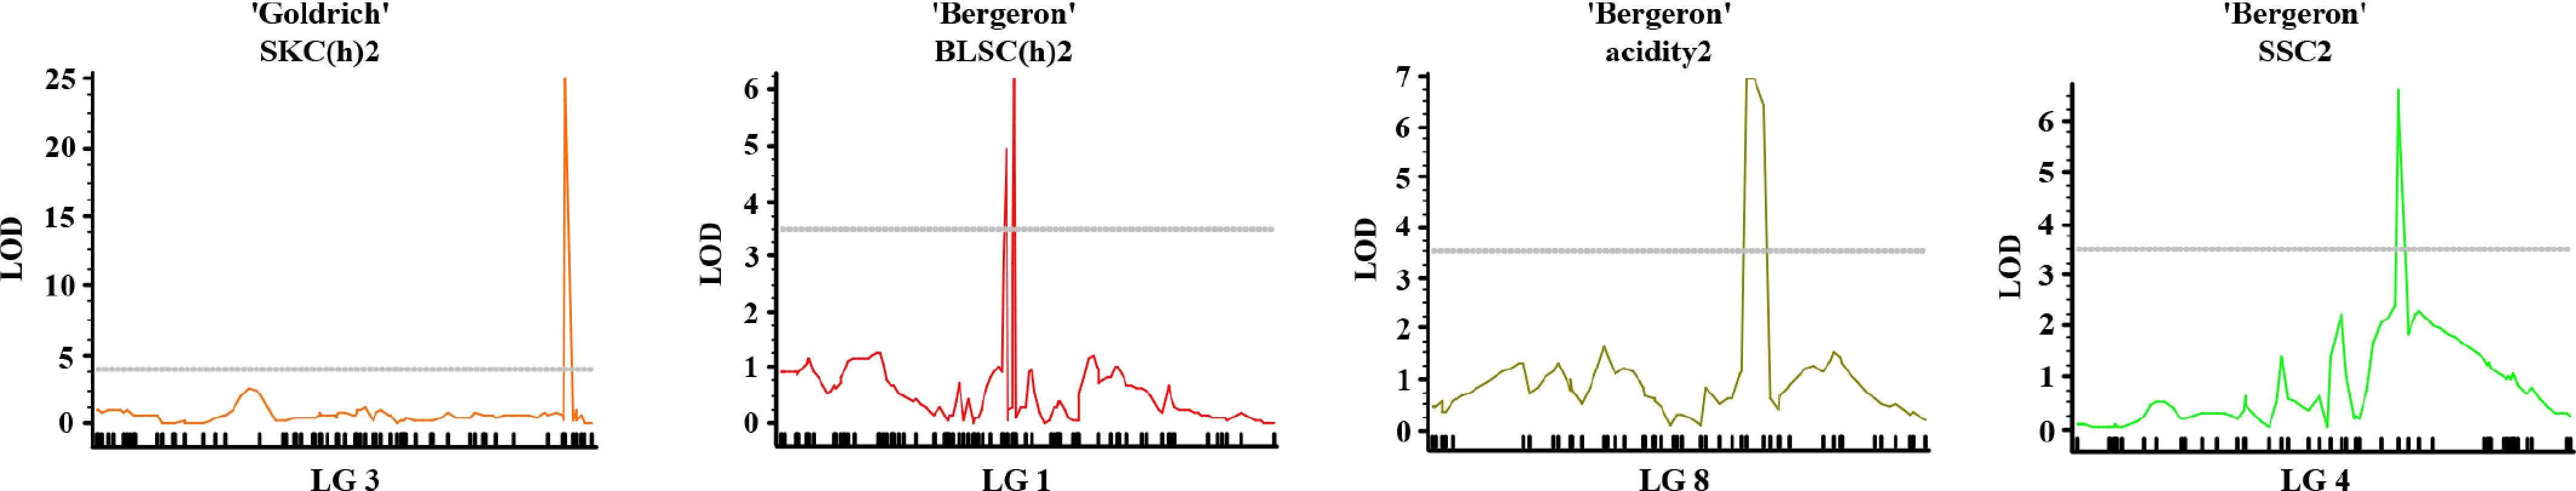
Figure 6.
Multiple-QTL mapping (MQM) profiles for fruit quality traits in apricot. Significant LOD score curves are shown for SKC(h)13 in 'Goldrich' ('G × C'), and for BLSC(h)13, acidity13, and SSC13 in 'Bergeron' ('B × C'), across their respective linkage groups (LG3, LG1, LG8, and LG4).
As for skin color (SKC), 155 genes were identified in the region spanning 22.0 to 23.3 Mbp on CAEKDK010000003.1 (LG3). Among these, key candidates include PRUPE.3G264500 (positions 22,996,632–22,998,537 bp), encoding a MYB-like DNA-binding protein, a known transcriptional regulator of anthocyanin biosynthesis. Also, PRUPE.3G264800 and PRUPE.6G340000 (positions 23,018,595–23,049,652 bp) encode zeta-carotene desaturases, enzymes involved in carotenoid formation, potentially explaining variations in yellow to orange pigmentation. Another MYB-domain protein, PRUPE.3G268000 (23,177,785–23,179,228 bp), further supports the involvement of transcriptional regulation in peel color expression.
Regarding blush color (BLSC), 217 genes were detected across two intervals: 14.0–14.6 Mbp and 20.0–21.7 Mbp on CAEKDK010000001.1 (LG1). Genes of interest include PRUPE.1G197500 (14,464,812–14,476,255 bp), coding for an ETF-ubiquinone oxidoreductase, and PRUPE.1G216100 (20,888,927–20,891,212 bp), containing a Myb/SANT-like DNA-binding domain, likely contributing to the regulation of anthocyanin accumulation. In the higher interval, PRUPE.1G225700 (21,590,151–21,591,516 bp) encodes LHCA2, a chlorophyll-binding protein, potentially linking light signaling with pigment expression. Additionally, PRUPE.1G231900 (21,098,577–21,100,952 bp) encodes an NADH-ubiquinone oxidoreductase, which may influence redox-related pathways in fruit coloration.
In terms of acidity, 111 genes were annotated between 15.0 and 16.0 Mbp on CAEKDK010000008.1 (LG8). A prominent candidate is PRUPE.8G167400 (15,482,651–15,491,327 bp), which codes for a FAD/NAD(P)-binding oxidoreductase, implicated in organic acid metabolism. Its presence in multiple isoforms suggests functional redundancy or regulatory diversity. Also notable is PRUPE.8G168500 (15,579,237–15,582,879 bp), which encodes a subunit of ATP synthase, a protein potentially involved in vacuolar acidification, influencing organic acid accumulation in fruit tissues.
In the case of soluble solids content (SSC), 213 genes were identified within the interval 10.0–12.7 Mbp on CAEKDK010000004.1 (LG4). Several genes are directly or indirectly related to sugar metabolism and transport. PRUPE.4G167100 (11,038,063–11,040,548 bp) encodes UDP-N-acetylglucosamine enoylpyruvyltransferase, while PRUPE.2G069100 (11,250,735–11,251,382 bp) is involved in nucleotide biosynthesis (CTP synthase). Noteworthy are PRUPE.4G171700 and PRUPE.4G171900 (11,715,843–11,761,390 bp), which encode ionotropic glutamate receptors, possibly involved in signaling or metabolic regulation. Genes like PRUPE.4G173600 and PRUPE.4G173700 (11,846,831–11,862,643 bp) encode anthocyanidin 3-O-glucoside xylosyltransferase-related proteins, suggesting an interaction between sugar conjugation and flavonoid metabolism. Additionally, PRUPE.4G174300 (11,917,666–11,920,078 bp) codes for D-aspartic aminotransferase, while PRUPE.4G180700 (12,400,288–12,402,568 bp) and PRUPE.4G182100 (12,476,020–12,476,562 bp) are involved in protein glycosylation and vacuolar transport, respectively, processes potentially impacting sugar allocation in fruit tissues.
-
The phenotypic characterization of two apricot progenies ('B × C' and 'G × C') revealed that fruit quality traits and resistance to powdery mildew had a polygenic and quantitative inheritance, with significant effects of genotype and year[23]. Disease resistance showed a continuous distribution, with 'G × C' displaying a more normal pattern and 'B × C' skewed toward the resistant 'Bergeron' parent. While 'Bergeron' and 'Goldrich' showed no symptoms, 'Currot' was highly susceptible. In 'B × C', most seedlings were resistant for two years, but disease incidence increased in the final year, leaving only a few healthy individuals. The 'G × C' population showed weaker resistance, reflected in a more balanced disease distribution.
These results highlight the variability in trait distribution even among sibling populations, as well as differences in inheritance patterns. Based on these findings, a dual approach was implemented to better understand the genetic control of these quantitative traits: (1) marker–trait association analysis without distinction between parental lines, and (2) QTL mapping using parental-specific genetic maps. The following sections present and discuss the results of both the parental maps and the marker–trait association and QTL mapping analyses.
Genetic linkage mapping
-
Genetic linkage maps are essential tools for identifying key genomic regions involved in the genetic control of both qualitative and quantitative traits, providing valuable support for breeding programs[31]. Advances in high-throughput sequencing have enabled whole-genome sequencing and linkage analysis to effectively identify genetic polymorphisms associated with complex traits across various species. GBS efficiently generates a large number of SNPs across numerous individuals at a relatively low cost, while also producing sequence tags that serve as genetic markers for scaffold assembly and mapping genomic fragments using a reference genome[32].
The construction of high-density genetic linkage maps is essential for understanding the inheritance of complex traits and for facilitating marker-assisted selection in crop breeding programs. In this study, the application of GBS enabled the generation of highly saturated genetic maps for two F1 apricot populations ('Bergeron' × 'Currot' and 'Goldrich' × 'Currot'). The resulting parental maps comprised 526 to 667 SNP markers and spanned total genetic distances ranging from 545 to 741 cM, with average marker densities between 0.89 and 1.41 cM/SNP. This level of saturation represents a significant improvement over earlier apricot maps, which were constructed using less informative marker systems such as AFLPs, RAPDs, and SSRs[22,23,33−40] (Supplementary Table S8). For instance, the first 'Goldrich' × 'Currot' map reported included 451 markers and spanned 468 cM[41], while other early maps[22,23], featured fewer markers and lower density, with larger average intervals and notable gaps (Table 7). In contrast, the present maps demonstrate a substantial increase in resolution, with more than 600 markers per parent and much narrower average marker intervals. Previous maps had densities ranging from 3.3 to over 7.5 cM/marker, whereas the current maps achieve densities below 1.5 cM/marker—down to 0.90 cM/marker in the 'Goldrich' parent. These improvements significantly enhance QTL detection power and mapping accuracy, providing a robust framework for marker-assisted selection and genetic studies in apricot.
Table 7. Longitudinal comparison of genetic linkage maps in apricot (Prunus armeniaca L.) from F1 populations of 'Goldrich' × 'Currot' and 'Bergeron' × 'Currot'.
Population F1 (size) Genotyping technique Map Markers Size (cM) Ref. 'Goldrich' × 'Currot' (81) AFLP, RAPD, RFLP, and SSR 'Goldrich' 139 468 [41] 'Currot' 89 451 'Goldrich' × 'Currot' (82) SSR (LG1*) 'Goldrich' 48 70 [42] 'Bergeron' × 'Currot' (130) SNP and SSR 'Bergeron' 52 394 [30] 'Currot' 55 414 'Goldrich' × 'Currot' (166) SNP and SSR 'Goldrich' 63 353 [30] 'Currot' 56 422 'Bergeron' × 'Currot' (134) SNP and SSR 'Bergeron' 642 596 Present work 'Currot' 667 713 'Goldrich' × 'Currot' (159) SNP and SSR 'Goldrich' 607 545 Present work 'Currot' 526 741 * In this work, only LG1 was mapped. Compared to recent SNP-based maps in apricot[29,41,42], the present study still offers higher resolution and more uniform marker distribution. Notably, the use of the 'Currot' reference genome and the application of rigorous SNP filtering and parental-specific segregation analysis contributed to minimizing gaps and improving recombination estimates. Furthermore, the inclusion of previously validated SSRs as anchor markers enabled the alignment and comparison of these new maps with historical genetic resources in apricot.
When compared to GBS-based genetic maps developed in other Prunus species[15,43], the maps presented in this study demonstrate the robust capacity of GBS technology to generate a high number of informative SNP markers suitable for genetic mapping. For example, in sweet cherry (Prunus avium)[15], genetic maps were constructed using a 'Rainier' × 'Rivedel' F1 population, successfully mapping 462, 489, and 985 SNP markers across eight linkage groups in the 'Rainier', 'Rivedel', and consensus maps, respectively. Notably, approximately 80% of these SNPs were located within genic regions, contributing to their functional relevance. The genetic distances covered were 549.5 cM for 'Rainier', 582.6 cM for 'Rivedel', and 731.3 cM for the consensus map, with average marker intervals of 1.2 cM for the individual parental maps and 0.7 cM for the consensus map. Similarly, in Japanese plum (Prunus salicina)[43], a consensus linkage map was reported comprising 732 SNPs distributed over 617 cM, with an average inter-marker distance of 0.96 cM. These features enhance the resolution and reliability of the maps, confirming the effectiveness of GBS for generating dense marker datasets suitable for high-precision QTL detection and fine-scale genetic dissection in apricot and other Prunus crops.
Marker-trait association and QTL mapping
-
It's important to note that the marker–trait associations previously generated by GLM using the filtered SNP dataset generally coincided with the QTL intervals. This adds greater consistency to these genome–trait associations.
On the other side, the high-resolution linkage maps developed in this study enabled the precise identification of QTLs for several key fruit quality traits in apricot. Notably, skin color (SKC) was consistently associated with major QTLs on linkage group three (LG3) across different years and genotypes of 'G × C' population, reinforcing previous findings and confirming this region as a stable genomic hotspot for pigmentation control[20]. Blush color (BLSC) was primarily mapped to LG1 in the 'B × C' population, consistent with earlier reports, and demonstrated reproducibility across years. These findings suggest that both traits may be under the regulatory influence of transcription factors located in these specific genomic regions, such as MYB-like genes.
Soluble solids content (SSC) was strongly associated with QTLs located on LG4, a region frequently reported in previous studies[20], further supporting its role in sugar accumulation and metabolism. Fruit firmness, another key quality parameter, showed robust QTLs on LG2 and LG3, which likely correspond to genes involved in cell wall structure and modification.
In the case of acidity, two main QTLs were detected—one on LG8, corresponding to a major locus recently described[19], and a second one on LG2. The locus on LG8 (designated qMCr8.1) was reported to exert a Mendelian-like effect[44], classifying accessions into citrate-, malate-dominant, or balanced types based on organic acid profiles. While this locus largely determines the qualitative nature of acid composition, the quantitative variation of total organic acid content, closely correlated with titratable acidity, appears to be polygenic, involving minor QTLs on multiple chromosomes and influenced by seasonal variation and maturity stage. These findings align with this model and validate the presence of both major and minor components controlling fruit acidity in apricot.
As for powdery mildew resistance, a significant QTL was identified on LG2, confirming results previously reported for apricot[25] and closely matching the location of the Vr3 resistance gene in peach. In peach, Vr3 was fine-mapped to a 270 kb region containing 27 candidate genes, including PRUPE.2G111700, encoding a disease resistance protein (RGA2), and PRUPE.2G112800, involved in cuticular wax biosynthesis[45]. Only RGA2 carried a high-impact variant and was overexpressed in resistant lines, making it a strong candidate for functional resistance. The conservation of this region across Prunus species, including apricot, highlights its importance as a target for pyramiding resistance alleles in breeding programs.
In summary, after analyzing these results, it is important to note that not all QTLs were consistent across years or between populations, with the exception of SSC on LG4, which remained stable in both populations and across all years. In contrast, skin color QTLs were primarily associated with LG3, mainly in the 'G × C' population, while blush color (linked to red skin coverage) was significant only on LG1 in the 'B × C' population. However, both traits showed consistent expression across all years. Acidity QTLs, on the other hand, were identified on different chromosomes (LG2 and LG8), while the QTL for powdery mildew resistance was significant in only one year and in a single parent ('Goldrich'). These results suggest different modes of inheritance for certain traits, such as fruit color between populations, and highlight the impact of variable environmental conditions on the annual detection of QTLs for powdery mildew resistance.
Genes linked to major QTLs
-
The most consistent marker–trait associations and QTL mapping were considered to identify the main genes involved in the traits of interest.
As for skin color, a set of genes within the 22.0 to 23.3 Mbp region on chromosome CAEKDK010000003.1 (LG3) were identified, suggesting a strong involvement of transcription factors and biosynthetic enzymes in determining fruit skin color. Firstly, PRUPE.3G264500, which encodes a MYB-type protein, stands out as a key regulator of anthocyanin biosynthesis. MYB proteins are widely recognized as essential transcriptional regulators in this metabolic pathway[46,47]. In particular, R2R3-type MYB transcription factors have been associated with the activation of structural genes responsible for the accumulation of red and purple pigments in plant tissues. In addition, PRUPE.3G264800 and PRUPE.6G340000 encode ζ-carotene desaturases (ZDS), enzymes that catalyze critical steps in the carotenoid biosynthetic pathway. These enzymes are essential for the formation of yellow and orange pigments, as demonstrated in functional studies on tomato and other species[48,49]. Their presence in this region suggests that variation in the expression or functionality of these genes could account for differences in the intensity or hue of yellow skin pigmentation. Lastly, PRUPE.3G268000, another gene encoding a MYB-domain protein, reinforces the hypothesis that transcriptional regulation plays a central role in skin color expression. This gene also belongs to the R2R3-MYB family, members of which have been reported to participate in responses to hormonal and environmental cues that influence pigmentation[50]. Taken together, these genes represent a functional network that integrates transcriptional regulation and pigment biosynthesis, providing a strong molecular framework for understanding phenotypic variability in skin color among Prunus species.
Regarding blush color (BLSC), several genes were identified within the 14.0–14.6 Mbp and 20.0–21.7 Mbp intervals on chromosome CAEKDK010000001.1 (LG1), revealing a diverse functional network potentially involved in the regulation of red pigmentation in fruit. PRUPE.1G197500, which encodes an ETF-ubiquinone oxidoreductase, is part of the ETF/ETFQO system that transfers electrons from flavoproteins to ubiquinone in the mitochondrial respiratory chain. This system has been implicated in modulating energy metabolism under stress conditions and in regulating redox pathways in plants[51,52]. Its possible role in pigmentation may be linked to the redox balance required for the biosynthesis of phenolic compounds such as anthocyanins. On the other side, PRUPE.1G216100 contains a Myb/SANT-like domain, characteristic of transcription factors that regulate the expression of structural genes in the anthocyanin biosynthesis pathway. MYB factors have been extensively documented as key regulators of pigment accumulation in fruits[46,53]. Its presence in this region suggests a direct role in the activation of genes responsible for blush color development. In the upper interval, PRUPE.1G225700 encodes the LHCA2 protein, a subunit of the photosystem I light-harvesting complex. LHCA proteins not only participate in photosynthesis but are also involved in light signalling that regulates the expression of pigment-related genes[54]. Finally, PRUPE.1G231900, encoding a NADH-ubiquinone oxidoreductase (mitochondrial complex I), contributes to the generation of proton-motive force and the maintenance of cellular redox status. This complex has been shown to be a major source of reactive oxygen species (ROS), which can act as signals to activate pigment biosynthetic pathways[55]. Together, these genes suggest that blush color expression in fruit may be regulated through an interplay of transcriptional factors, mitochondrial redox pathways, and light-mediated signals—reflecting a complex integration of metabolic and environmental cues.
In terms of acidity, a region spanning 15.0 to 16.0 Mbp on chromosome CAEKDK010000008.1 (LG8) contains 111 annotated genes related to fruit acidity, among which two candidates stand out for their potentially key roles in organic acid metabolism and accumulation. PRUPE.8G167400, which encodes a FAD/NAD(P)-binding oxidoreductase, emerges as a relevant player in organic acid metabolism. Enzymes in this family participate in essential redox reactions involved in the synthesis and degradation of compounds such as malic and citric acids, which are the main contributors to acidity in fleshy fruits[56,57]. On the other hand, PRUPE.8G168500 encodes a subunit of ATP synthase, a crucial enzyme for generating proton gradients across the vacuolar membrane. This gradient is essential for vacuolar acidification, a process that facilitates organic acid accumulation via protonation and compartmentalization[58]. Recent studies have shown that vacuolar proton pumps, including P-type ATPases such as MdPH5 in apple, are directly involved in the regulation of vacuolar pH and, consequently, fruit acidity[59]. Altogether, these genes support the hypothesis that fruit acidity depends not only on organic acid metabolism but also on their transport and storage in the vacuole, governed by a complex network of redox enzymes and proton pumps.
As for soluble solid content, a region spanning 10.0 to 12.7 Mbp on chromosome CAEKDK010000004.1 (LG4), associated with soluble solids content (SSC), contains 213 genes, several of which are directly or indirectly related to sugar metabolism and transport, as well as to complementary regulatory pathways. The primary function of UDP-sugars (Uridine Diphosphate-sugars) in organisms such as plants is to act as activated sugar donors in glycosylation reactions[60]. PRUPE.4G167100 encodes a UDP-N-acetylglucosamine enolpyruvyltransferase; however, its function in plants is not clearly associated with sugar metabolism in fruits such as apricot. On the other side, in other studies, UDP-N-acetylglucosamine (UDP-GlcNAc) is a key substrate for N- and O-linked glycosylation, which are essential for protein folding, stability, and function, especially in membrane and secretory proteins[61]. PRUPE.2G069100, involved in the synthesis of nucleotides such as CTP, encodes a CTP synthase, a rate-limiting enzyme in the de novo biosynthesis pathway of cytidine triphosphate. Downregulation of CTP synthases (CTPS) has been previously linked to defects in chlorophyll accumulation and photosynthetic performance early in development[62], which could indirectly influence sugar storage in fruit tissues. PRUPE.4G171700 and PRUPE.4G171900 encode ionotropic glutamate receptors (iGluRs), a family of ligand-activated channels that, in plants, have been linked to the perception of environmental signals and the regulation of carbon and nitrogen metabolism. In plants, GLRs are involved in glutamate- and calcium-dependent signaling, which may affect metabolic pathways related to sugar transport and storage[63]. PRUPE.4G173600 and PRUPE.4G173700 encode proteins related to anthocyanidin 3-O-glucoside xylosyltransferase, enzymes involved in flavonoid glycosylation. This modification not only stabilizes pigments but may also compete for substrates with sugar conjugation pathways, indicating a potential interaction between sugar and flavonoid metabolism[64]. PRUPE.4G174300, encoding a D-aspartic aminotransferase, may be involved in transamination pathways that affect amino acid balance and energy metabolism, thereby indirectly influencing sugar accumulation.
Finally, PRUPE.4G180700 and PRUPE.4G182100 encoding 6-N-acetylglucosaminyltransferase and a vacuolar protein are associated with protein glycosylation and vacuolar transport, respectively. These processes are crucial for the proper localization and functionality of sugar transporters, as well as for their storage in the vacuole—a key compartment for sugar accumulation in fruits[65]. Altogether, these genes represent a complex functional network that integrates primary metabolism, signaling, post-translational modification, and compartmentalization—all of which are essential processes for the regulation of soluble solids content in fruits.
Many of the genes described were selected due to their functional annotation suggesting a potential involvement in the traits of interest. Nonetheless, it is important to emphasize that this analysis remains exploratory. Comprehensive validation through functional assays and gene expression studies will be essential to confirm their biological roles and assess their true applicability in marker-assisted selection strategies.
It is important to highlight that, in the last decade, there has been rapid growth in the genomic information available for fruit crops. One example of this is the Genomic Database of Fruits (TGDF)[66]. Resources like TGDF not only facilitate access to millions of gene annotations and bioinformatics tools but also enable more in-depth comparative and functional studies. This work aims to contribute to this trend by advancing genomic studies in fruit species, supporting future breeding and agricultural improvements.
-
Genotyping-by-sequencing (GBS) has become a cornerstone technology in marker–trait association studies. It enables the detection of polymorphisms closely linked to agronomically important traits in segregating populations and facilitates the identification of quantitative trait loci (QTLs) through the development of high-resolution linkage maps. The dense marker coverage provided by GBS significantly improves the genetic resolution of these maps, making it a powerful tool for modern plant breeding programs. In this study, GBS-based QTL mapping in apricot allowed the identification of robust and stable QTLs associated with essential fruit quality traits mainly linked to skin color, flesh color, blush color, acidity, soluble solids content, and resistance to powdery mildew across three parental lines ('Goldrich', 'Currot', and 'Bergeron'). Notably, major QTLs were consistently detected on LG3 for skin color, LG1 for blush color, and LG4 for SSC. However, other QTLs, although statistically significant—such as those associated with acidity (LG2 and LG8) and powdery mildew resistance (LG2)—showed lower stability across years. This variability may be attributed to the precise timing of fruit ripening in the case of acidity, and to differences in climatic conditions affecting disease manifestation in the case of powdery mildew. Candidate gene analysis within these intervals revealed the presence of key transcription factors (e.g., MYBs), enzymes involved in skin color and sugar biosynthesis (e.g., zeta-carotene desaturases, glycosyltransferases), and stress-related proteins, providing a foundation for functional validation. Overall, the new genetic maps produced in this study constitute one of the most complete and saturated resources currently available for apricot and represent a significant advancement over earlier linkage efforts. Therefore, these results represent a robust framework for the identification of QTLs associated with fruit quality and disease resistance traits, and a valuable genomic resource to support future marker-assisted and genomic selection strategies within Prunus breeding programs.
JAS acknowledges the Ministry of Science and Innovation (Spain) for its support through the 'Ramon y Cajal' postdoctoral contract (Grant No. RYC2022-038101-I) and GO-H for its support through the predoctoral fellowship (FPU21/03563). This research was funded by the Ministry of Science and Innovation (Spain) through the 'Apricot breeding' project (Grant No. PID2022-137392OB-100). This study formed part of the AGROALNEXT programme and was supported by MCIN with funding from European Union Next Generation EU (Grant No. PRTR-C17.I1) and by Fundación Séneca with funding from Comunidad Autónoma Región de Murcia (CARM).
-
The authors confirm contribution to the paper as follows: study conception and design: Salazar JA; methodology, data curation and writing − review and editing: Ortuño-Hernández G, Salazar JA; formal analysis, draft manuscript preparation: Ortuño-Hernández G; supervision and review: Salazar JA, Martínez-Gómez P, Rubio M; resources and funding acquisition: Ruiz D, Salazar JA. All authors reviewed the results and approved the final version of the manuscript.
-
The datasets generated during and/or analyzed in the current study are available from the corresponding author on reasonable request.
-
The authors declare that they have no conflict of interest.
-
# Authors contributed equally: Juan Alfonso Salazar, Germán Ortuño-Hernández
- Supplementary Table S1 Phenotypic data for fruit quality traits in the 'B×C' and 'G×C' apricot populations.
- Supplementary Table S2 Phenotypic data for powdery mildew resistance in the 'B×C' and 'G×C' apricot populations.
- Supplementary Table S3 Summary of the GBS project report provided by LGC Genomics GmbH.
- Supplementary Table S4 Variant SNP discovery, filtering and Mapping.
- Supplementary Table S5 Genetic linkage map of each apricot parental genotype showing SNP marker positions along the eight linkage groups.
- Supplementary Table S6 Summary of GWAS results for all studied traits in the 'B×C' and 'G×C' apricot populations using TASSEL.
- Supplementary Table S7 Annotated genes located within the most significant genomic regions associated with SKC, BLSC, acidity, and SSC in apricot.
- Supplementary Table S8 Summary of genetic linkage maps of apricot derived from F1 populations.
- Supplementary Fig. S1 SNP marker density maps across the eight linkage groups for each parental in 'B×C' and 'G×C' populations.
- Supplementary Fig. S2 QTL analysis for the ‘Bergeron’ parent in ‘B×C’ across the entire genetic map for quality traits.
- Supplementary Fig. S3 QTL analysis for the 'Currot' parent in 'B×C' across the entire genetic map for quality traits.
- Supplementary Fig. S4 QTL analysis for the 'Goldrich' parent in 'G×C' across the entire genetic map for quality traits.
- Supplementary Fig. S5 QTL analysis for the 'Currot' parent in 'G×C' across the entire genetic map for quality traits.
- Copyright: © 2026 by the author(s). Published by Maximum Academic Press, Fayetteville, GA. This article is an open access article distributed under Creative Commons Attribution License (CC BY 4.0), visit https://creativecommons.org/licenses/by/4.0/.
-
About this article
Cite this article
Salazar JA, Ortuño-Hernández G, Rubio M, Martínez-Gómez P, Ruiz D. 2026. GBS-based marker–trait association and genetic mapping for enhanced QTL significance in apricot progenies (Prunus armeniaca L.). Fruit Research 6: e002 doi: 10.48130/frures-0025-0038 

GBS-based marker–trait association and genetic mapping for enhanced QTL significance in apricot progenies (Prunus armeniaca L.)
- Received: 23 July 2025
- Revised: 30 October 2025
- Accepted: 12 November 2025
- Published online: 20 January 2026
Abstract: Genotyping by sequencing (GBS) offers a powerful tool for high-resolution mapping by identifying single-nucleotide polymorphisms (SNPs) aligned to a reference genome. This study aimed to construct high-density genetic maps for two apricot populations, 'Bergeron' × 'Currot' ('B × C') and 'Goldrich' × 'Currot' ('G × C'), to identify marker-trait associations linked to fruit quality traits and resistance to powdery mildew. A total of 134 'B × C' and 159 'G × C' seedlings were genotyped, resulting in 2,442 mapped markers—642 for 'Bergeron', 667 for 'Currot' ('B × C'), 607 for 'Goldrich', and 526 for 'Currot' ('G × C')—covering genetic distances of 596.6, 713.6, 545.1, and 741.2 cM, respectively. This high-resolution mapping enabled the detection of the most significant QTLs for traits such as skin color (LG3, LOD 25), blush color (LG1, LOD 7.6), and soluble solids content (LG4, LOD 12.1), along with other minor QTLs. However, the acidity and the powdery mildew resistance QTLs showed lower and inconsistent significance across different years. Additionally, several candidate genes associated with these traits were identified within the most significant genomic regions using the 'Currot' reference genome available in NCBI. These findings provide valuable resources for the development of molecular markers that aim to improve breeding strategies in apricot breeding programs, particularly those focused on enhancing fruit quality. These results lay a promising foundation for mid-term implementation in marker-assisted and genomic selection, pending further validation across diverse genetic backgrounds and environmental conditions.
-
Key words:
- Apricot /
- Breeding program /
- Fruit quality /
- GBS /
- Genetic map /
- Prunus armeniaca /
- QTL /
- SNP