-
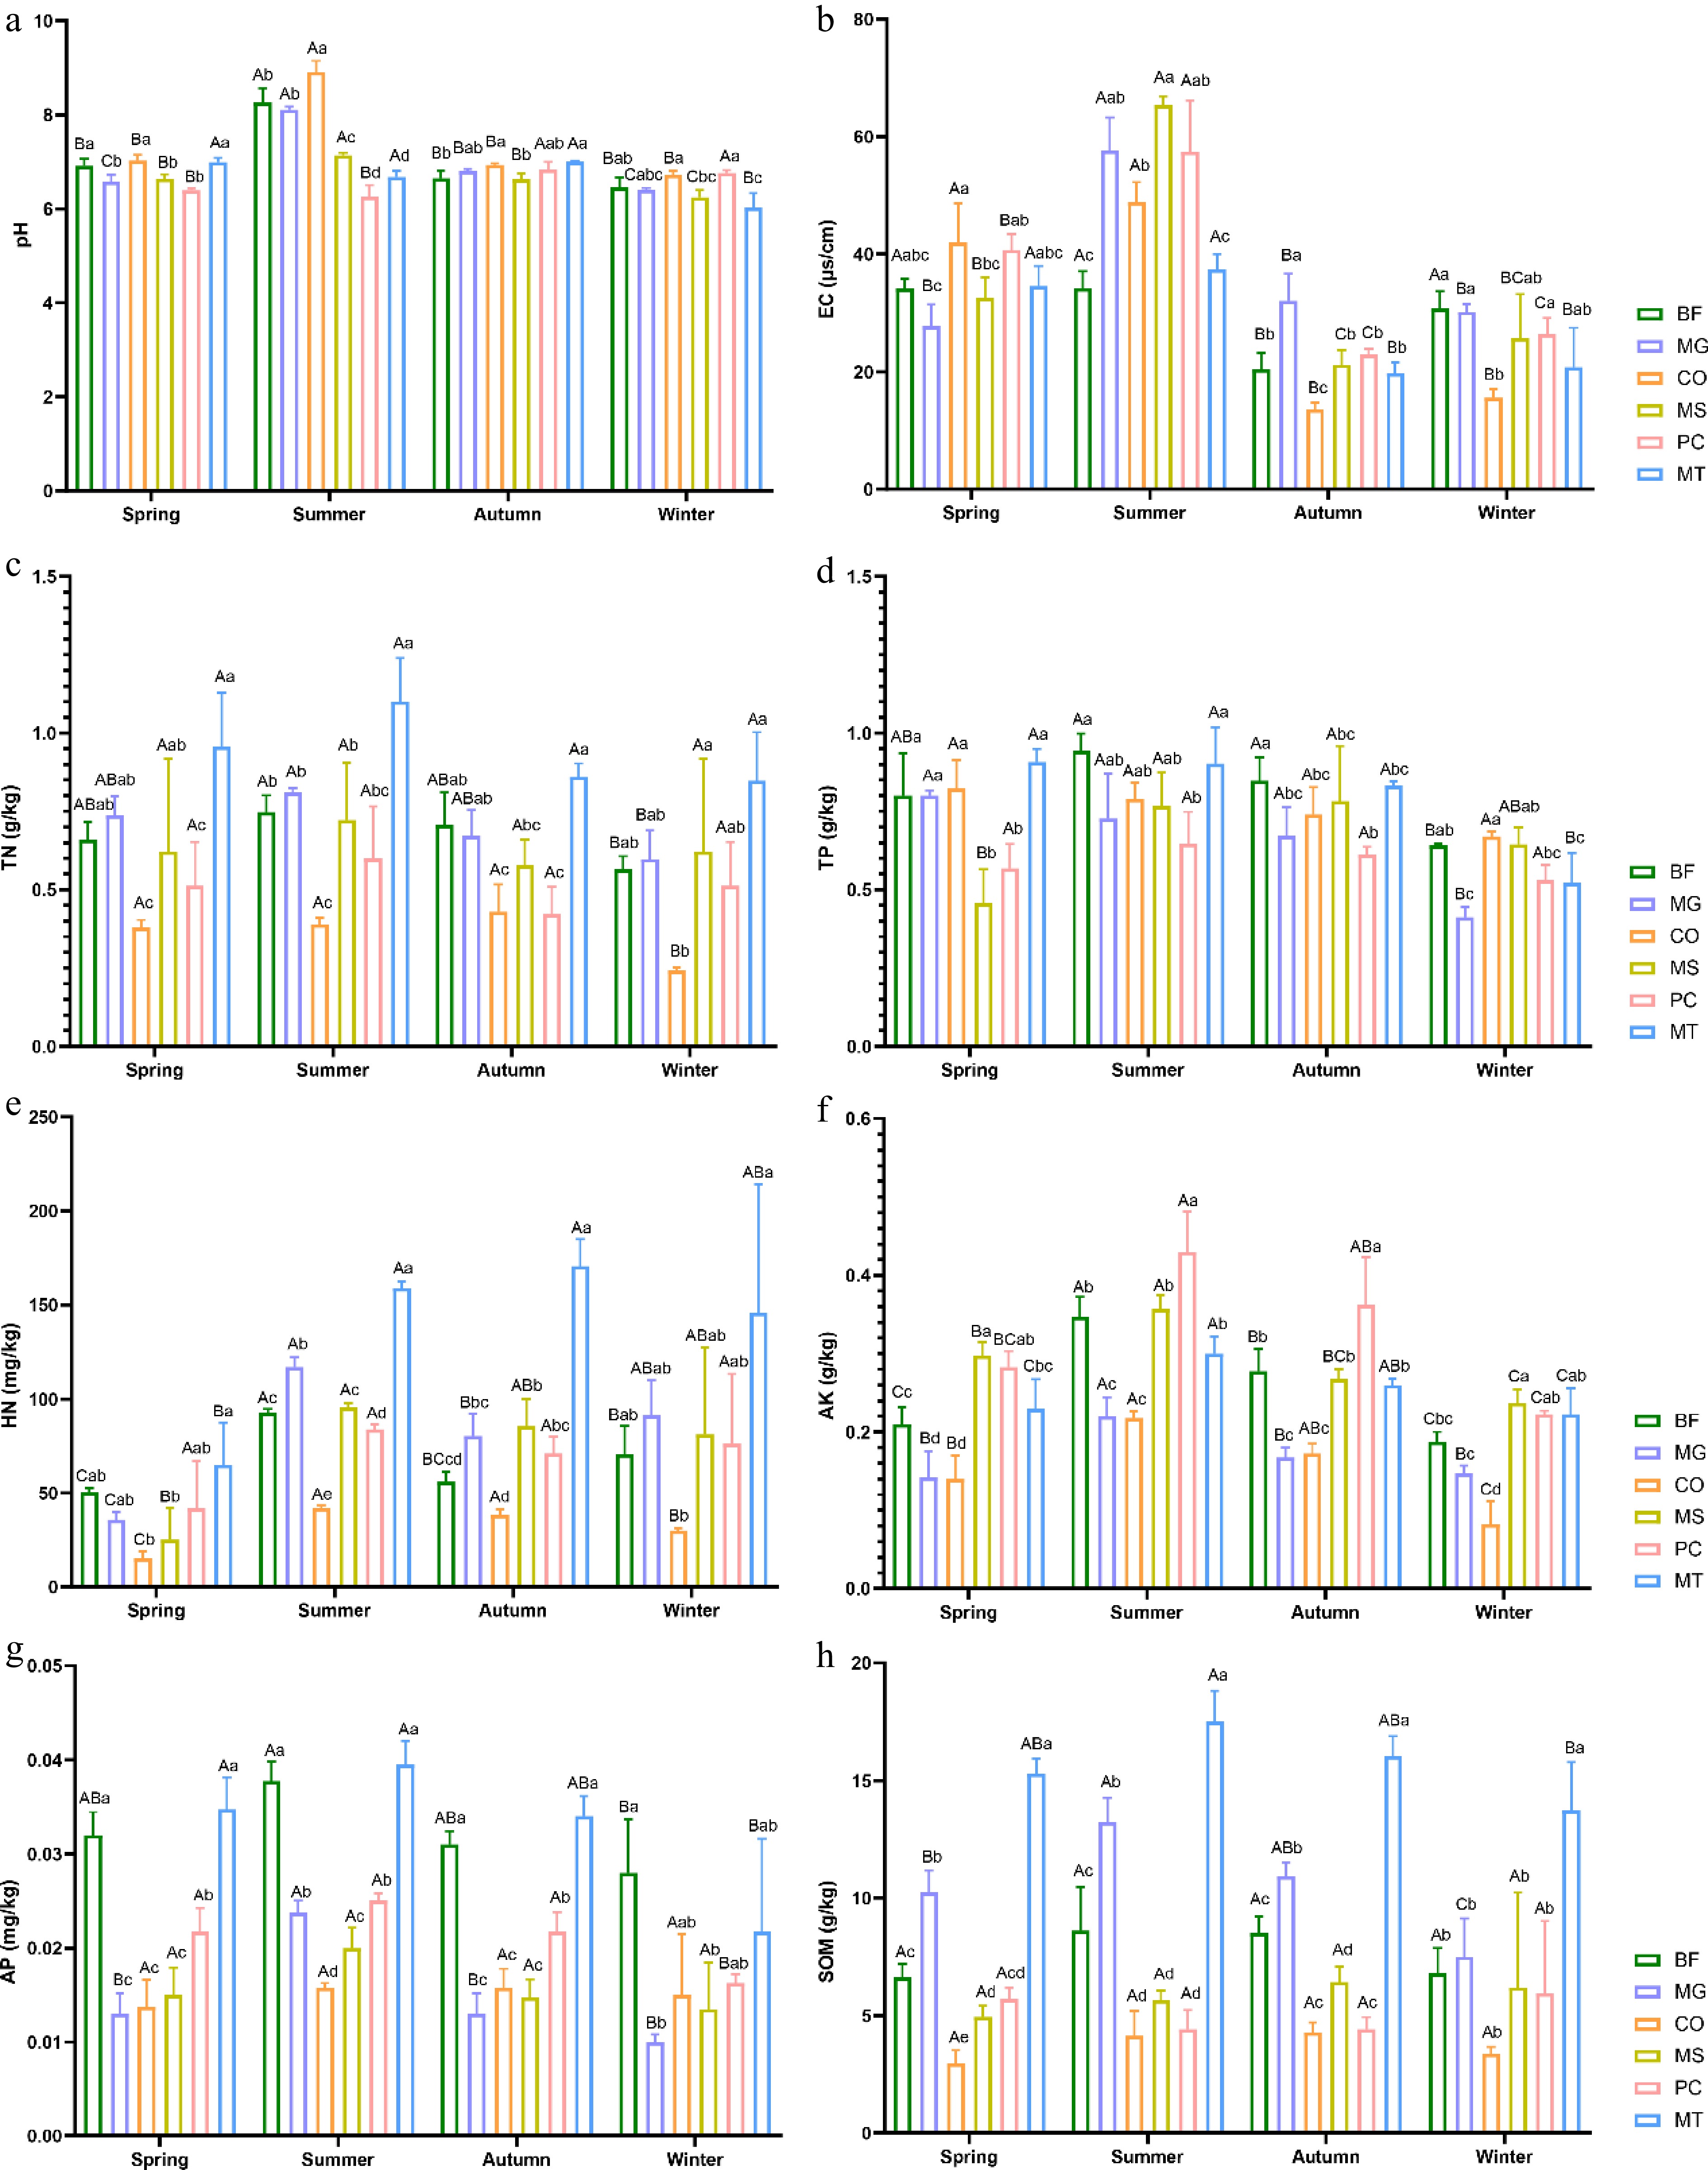
Figure 1.
Seasonal variations in the soil's physicochemical factors across six forest types. (a) pH; (b) electrical conductivity (EC); (c) total nitrogen (TN); (d) total phosphorus (TP); (e) hydrolyzable nitrogen (HN); (f) available potassium (AK); (g) available phosphorus (AP); (h) soil organic matter (SOM). The six forest types are bamboo forest (BF), Metasequoia glyptostroboides forest (MG), Cornus officinalis forest (CO), mixed broadleaf shrub forest (MS), mixed pine and cypress forest (PC), and mixed broadleaf tree forest (MT) Lowercase letters indicate significant differences among different forest types within the same season (p < 0.05), whereas uppercase letters indicate significant differences among different seasons within the same forest type (p < 0.05).
-
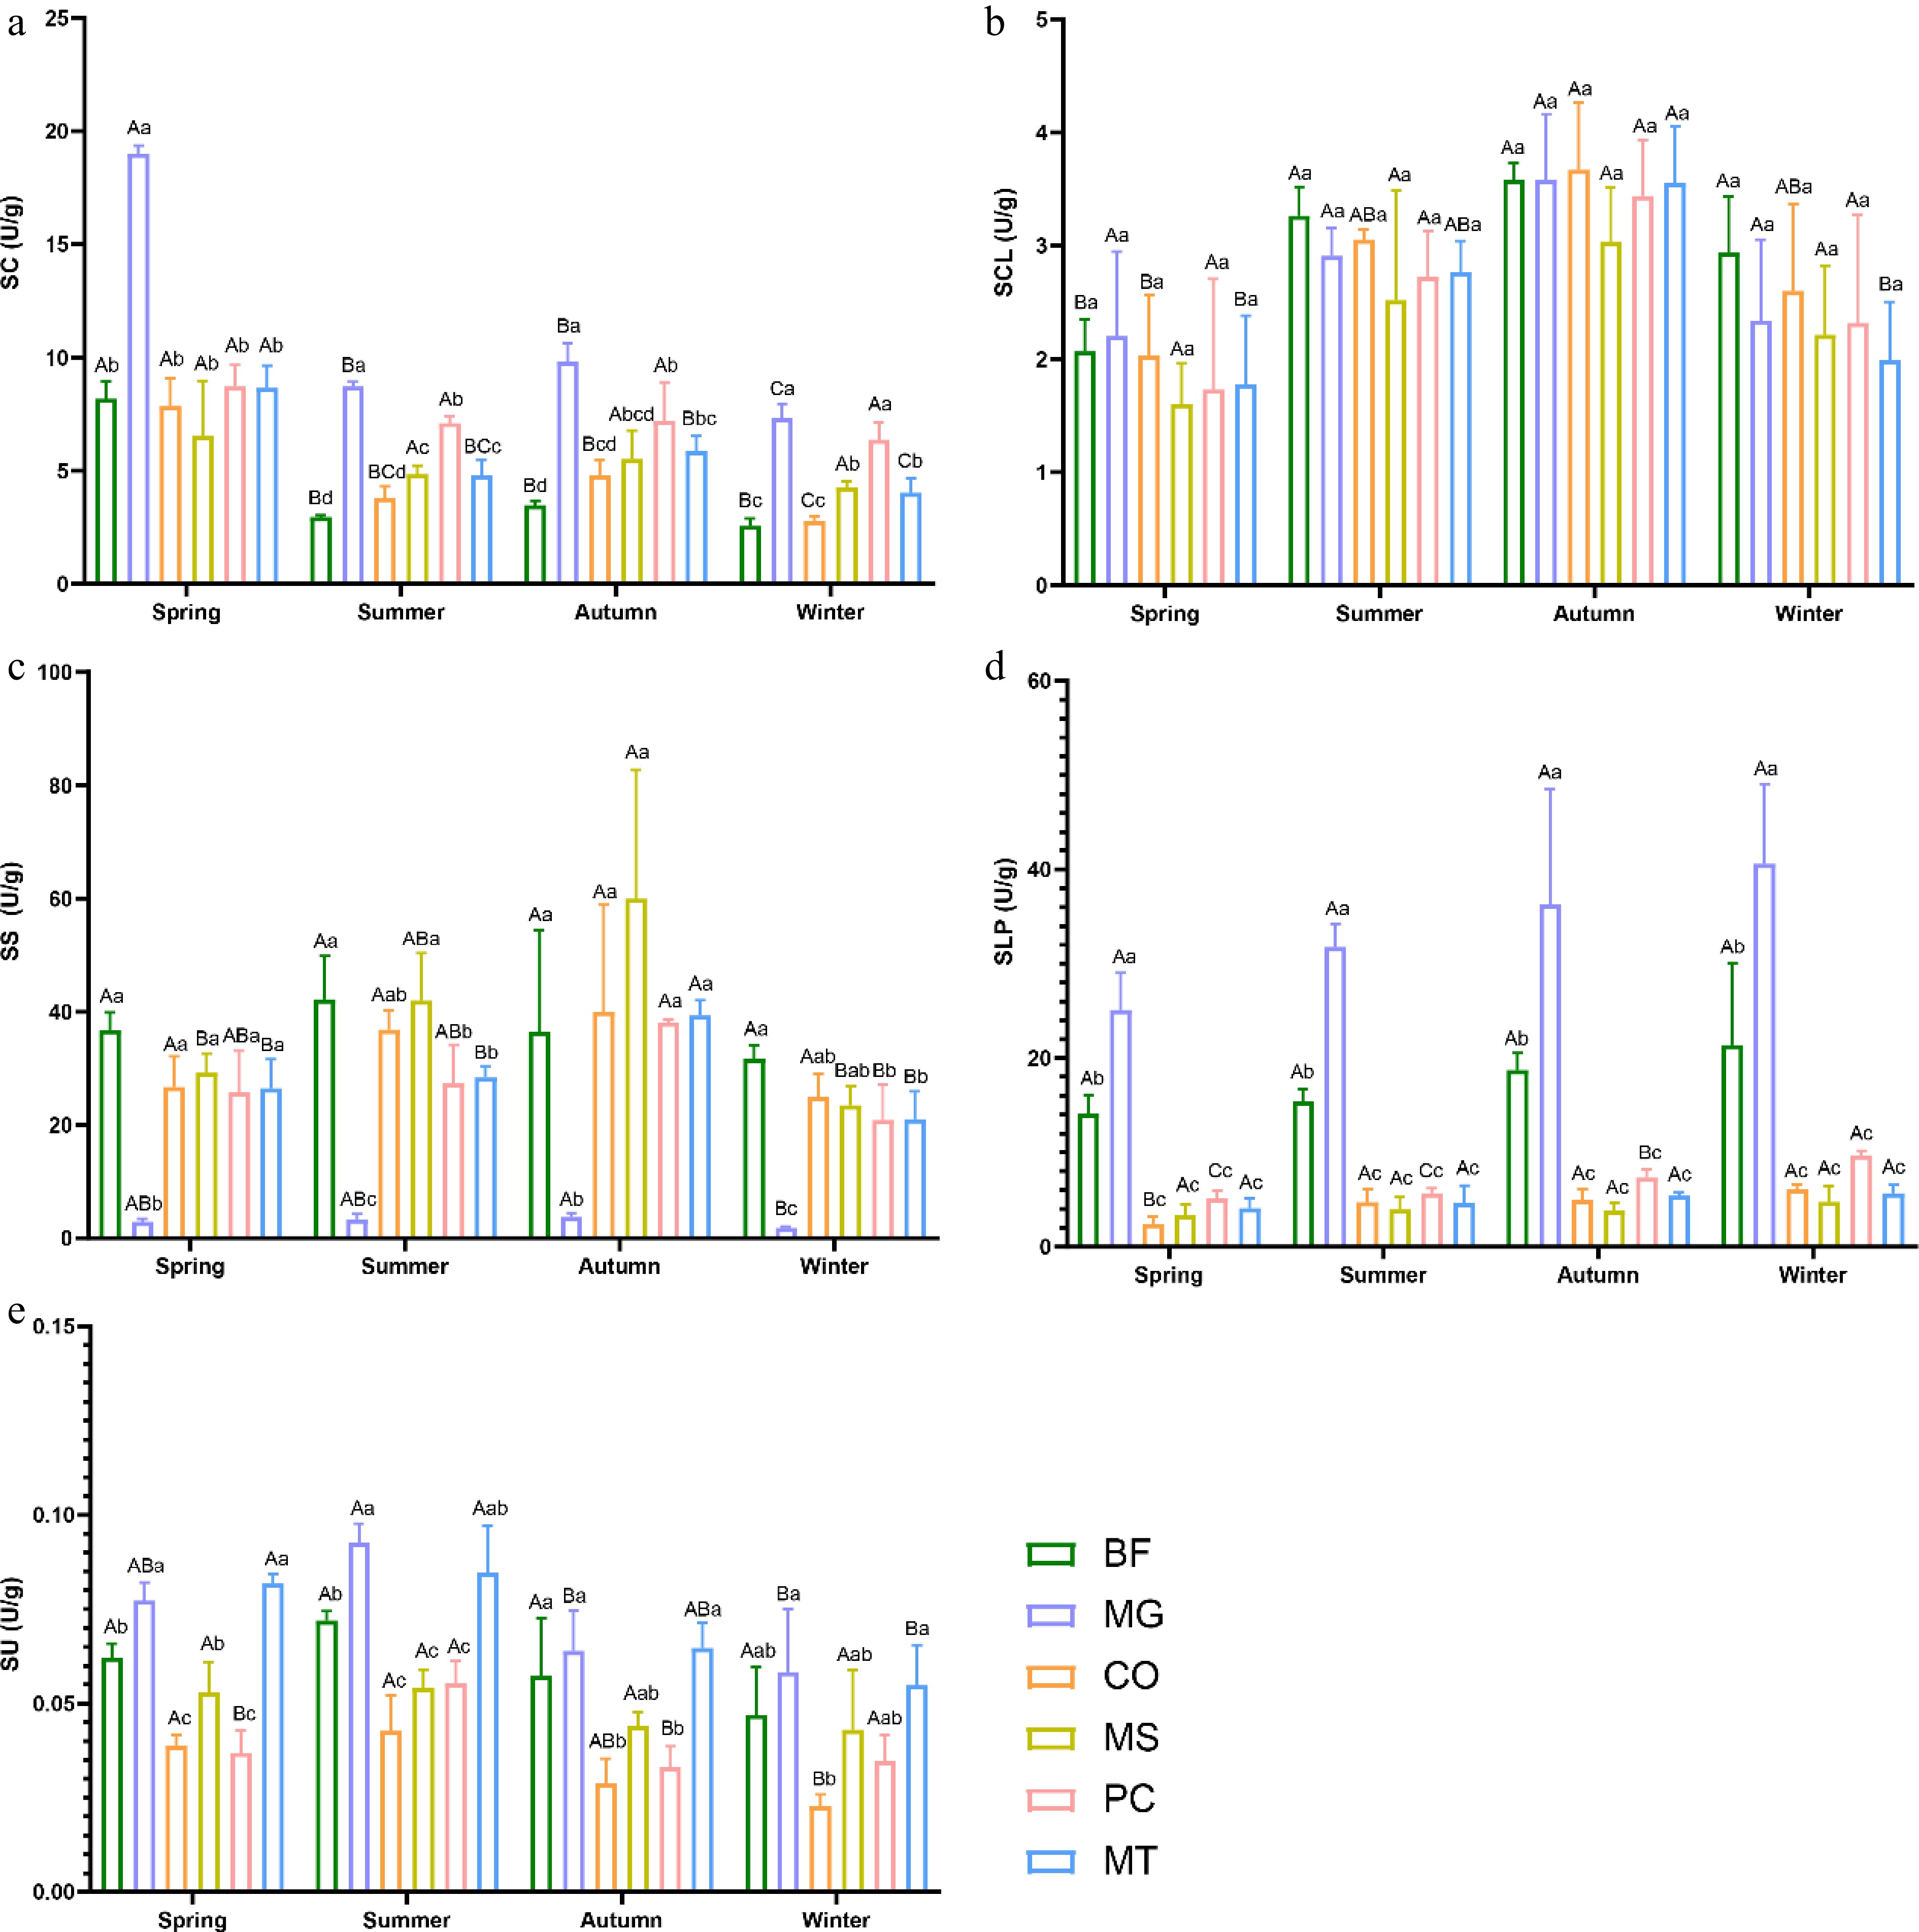
Figure 2.
Seasonal variations in soil enzyme activity in six forest types. (a) Catalase (SC); (b) cellulase (SCL); (c) sucrase (SS); (d) alkaline phosphatase (SLP); (e) urease (SU). The six forest types are the same as in Fig. 1. Lowercase letters indicate significant differences among different forest types within the same season (p < 0.05); uppercase letters indicate significant differences among different seasons within the same forest type (p < 0.05).
-
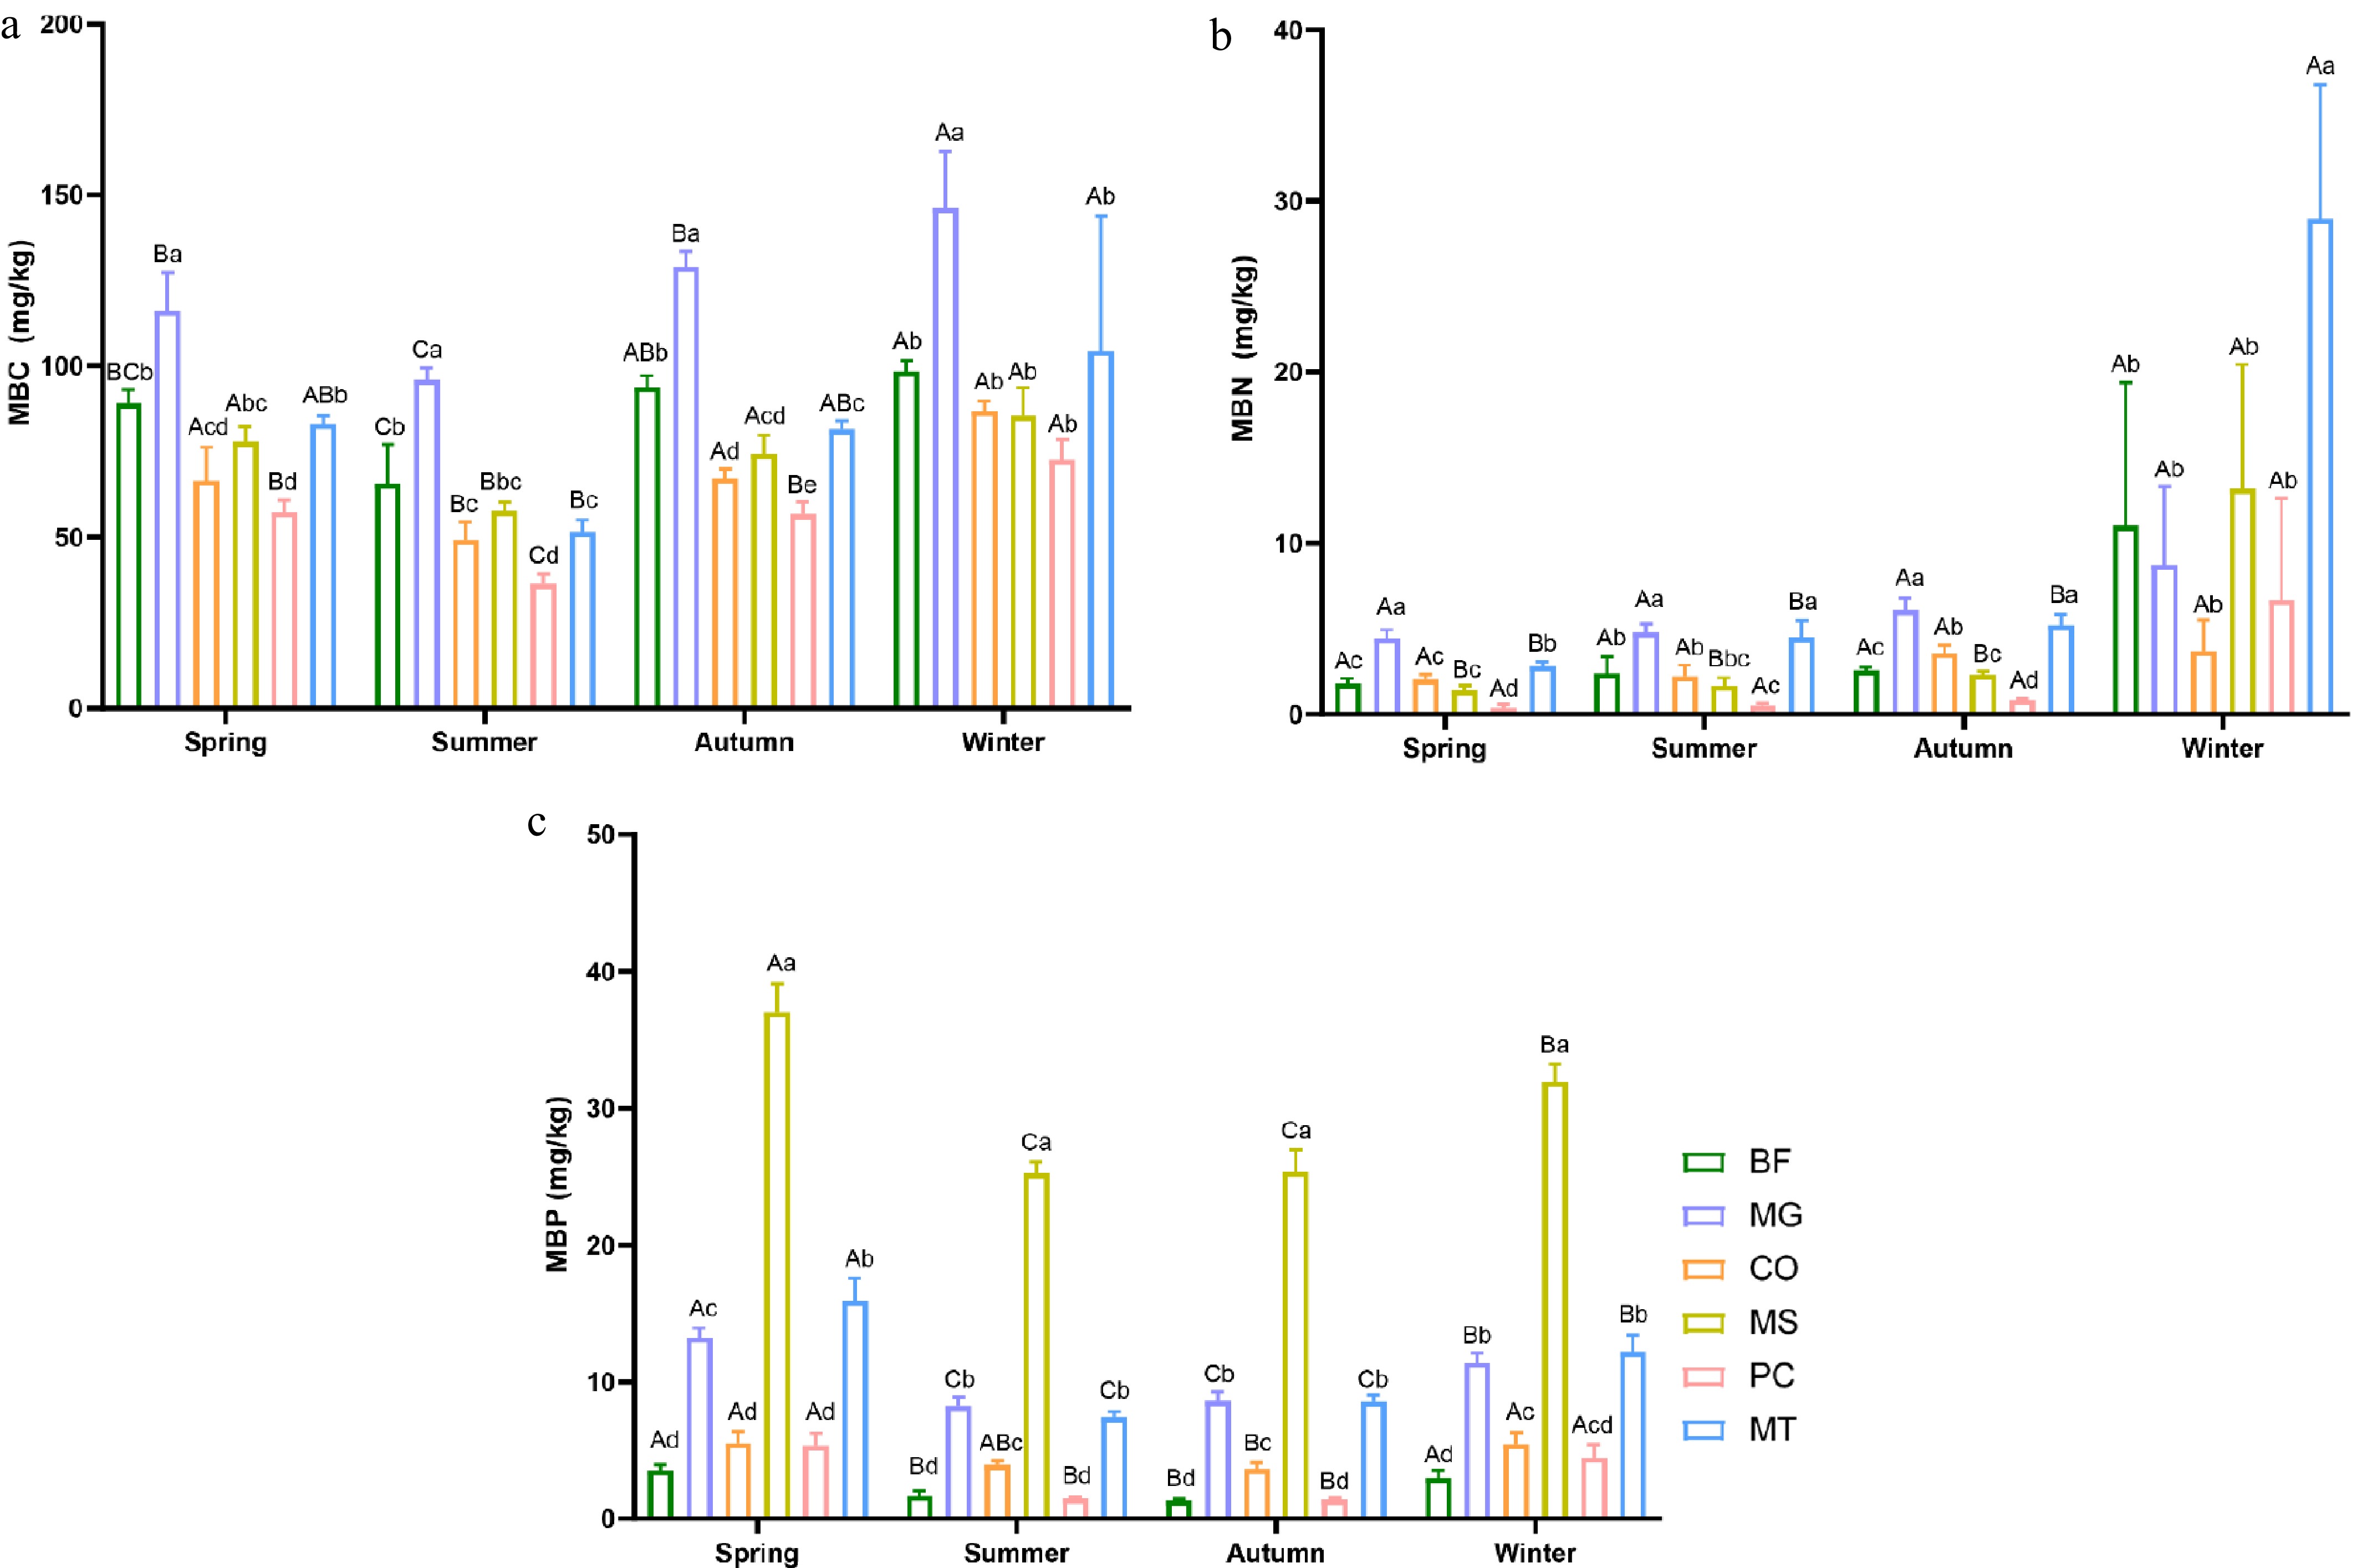
Figure 3.
Seasonal variations in soil microbial biomass in six forest types. (a) Soil microbial biomass carbon (MBC); (b) soil microbial biomass nitrogen (MBN); (c) soil microbial biomass phosphorus (MBP). The six forest types are the same as those in Fig. 1. Lowercase letters indicate significant differences among different forest types within the same season (p < 0.05); uppercase letters indicate significant differences among different seasons within the same forest type (p < 0.05).
-
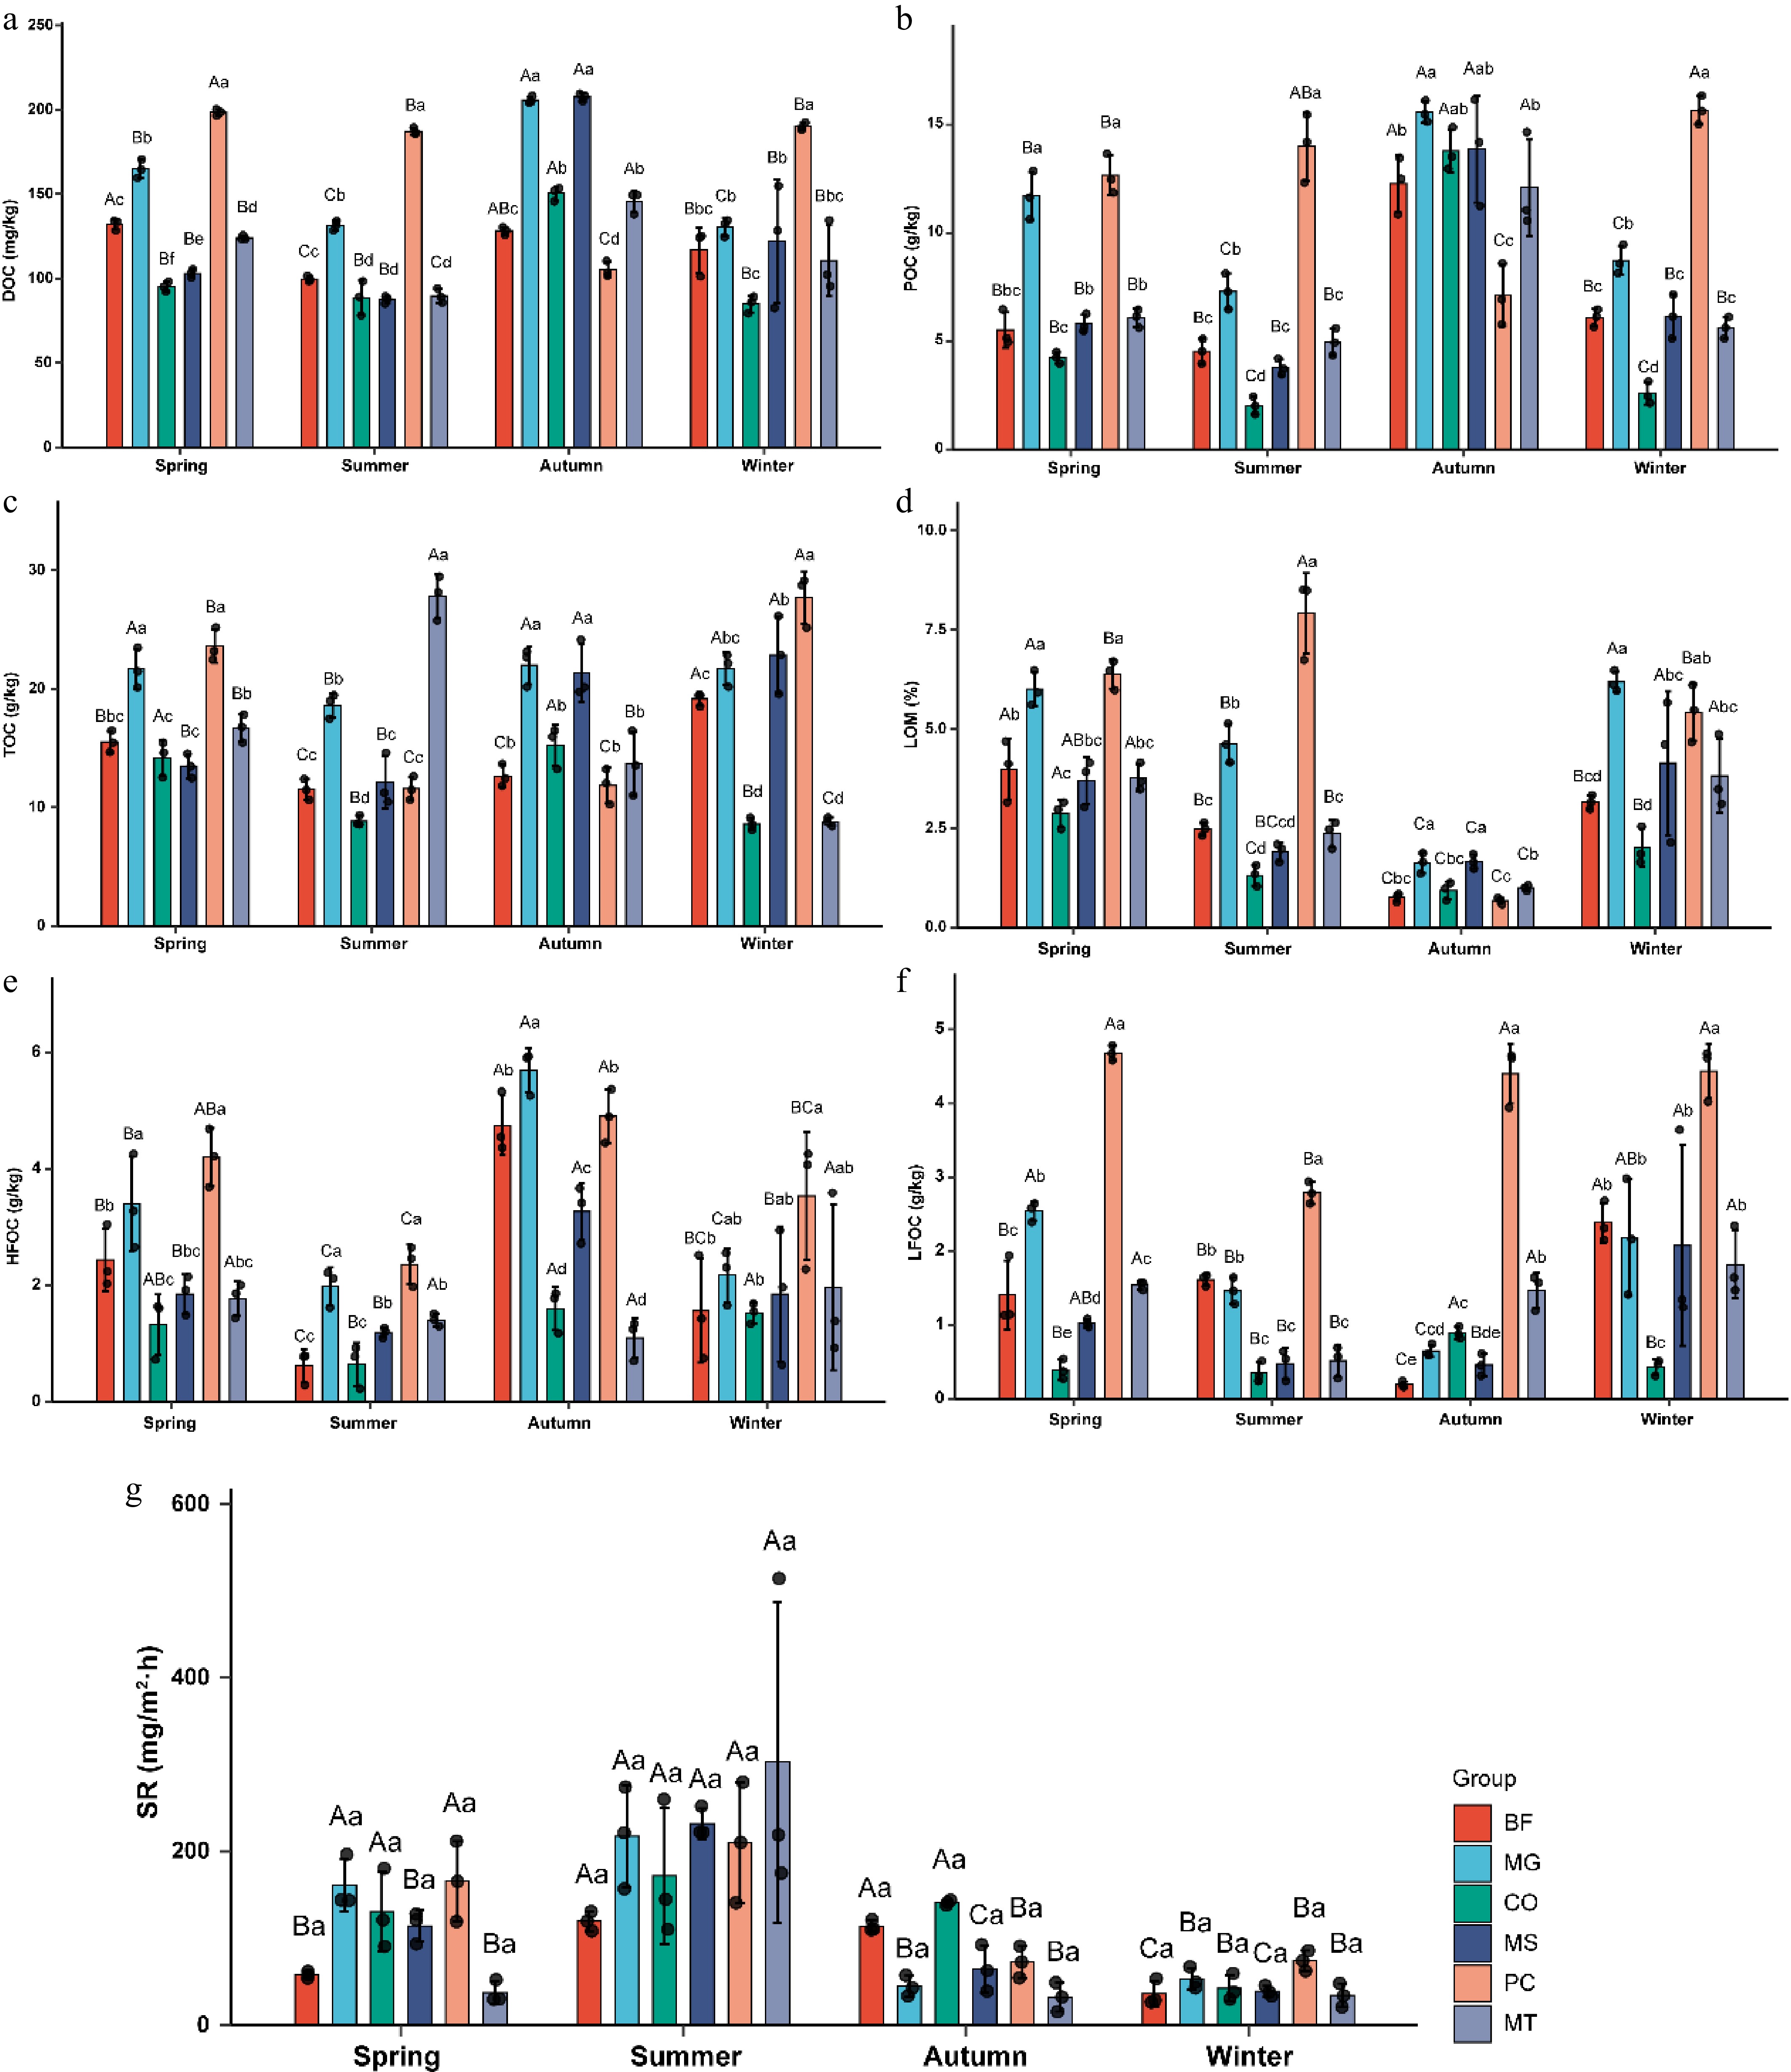
Figure 4.
Seasonal variations of carbon composition and soil respiration in six forest types. (a) Dissolved organic carbon (DOC); (b) particulate organic carbon (POC); (c) total carbon (TC); (d) labile organic matter (LOM); (e) heavy fraction organic carbon (HFOC); (f) light fraction organic carbon (LFOC); (g) soil respiration (SR). The six forest types are the same as in Fig. 1. Lowercase letters indicate significant differences among different forest types within the same season (p < 0.05); uppercase letters indicate significant differences among different seasons within the same forest type (p < 0.05).
-
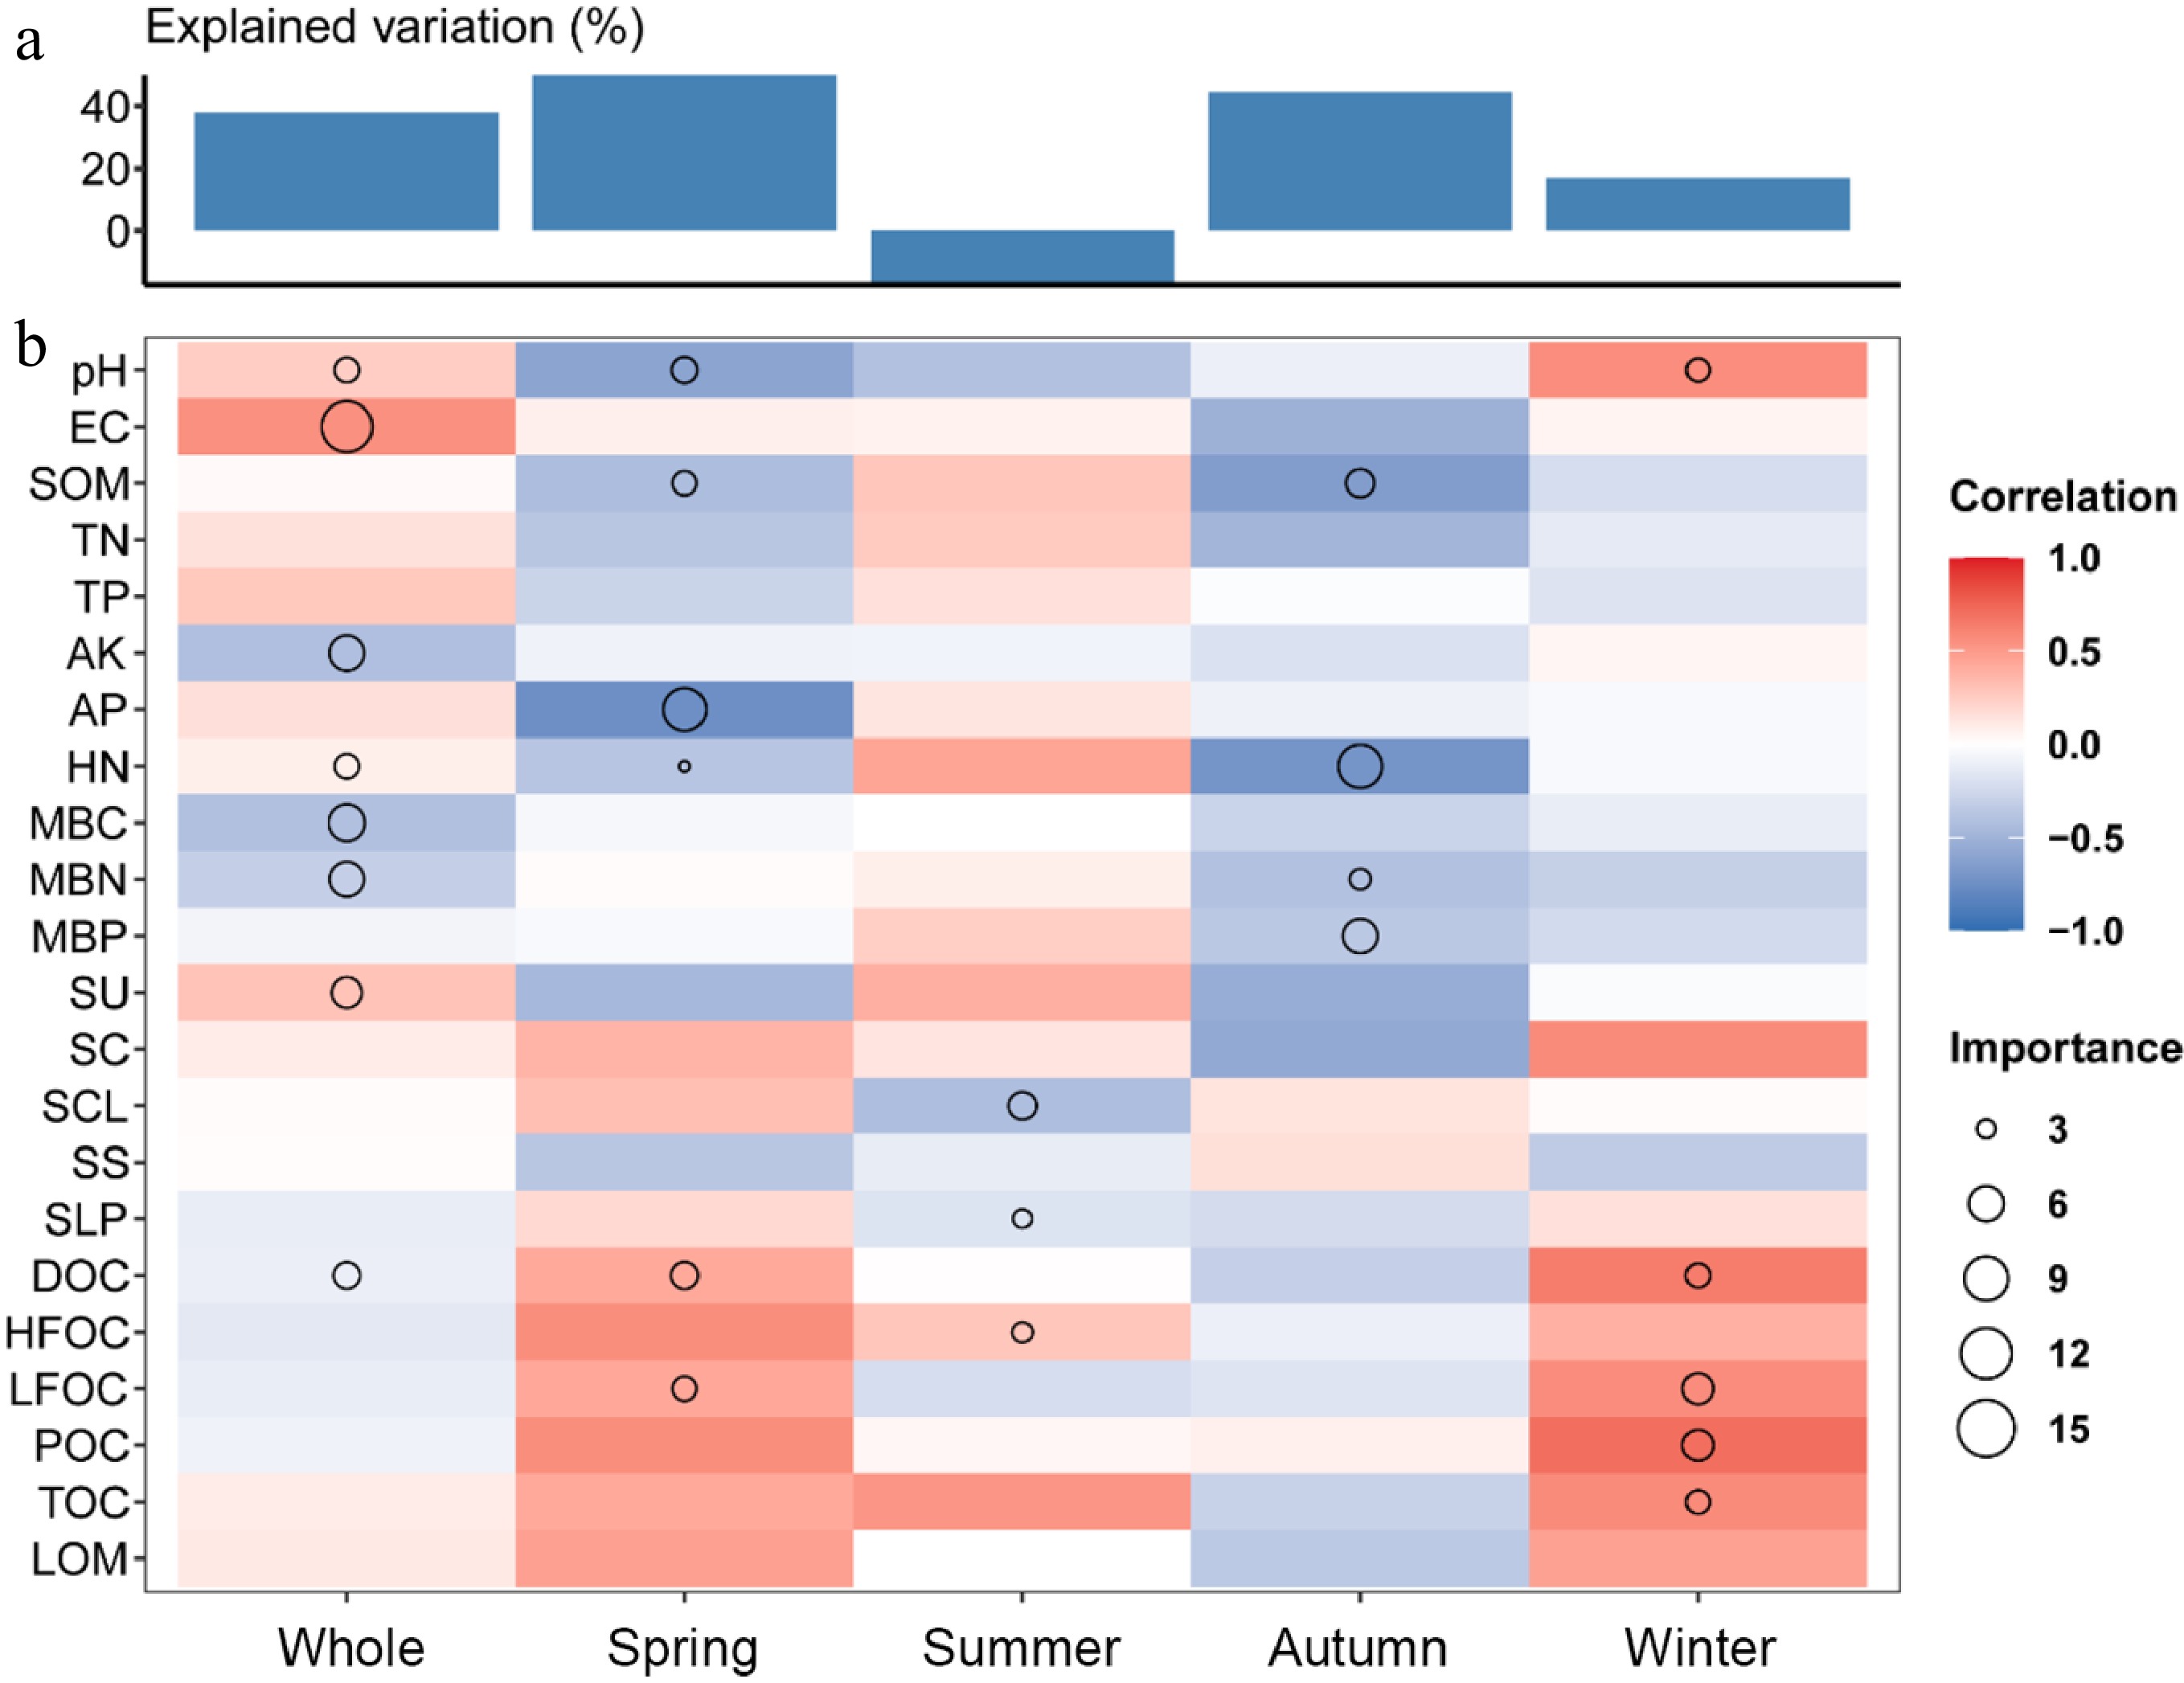
Figure 5.
Random Forest analysis of explanatory variables for soil respiration. (a) Explanation and analysis of environmental factors. (b) Importance scores and correlation coefficients of each environmental factor to soil respiration.
-
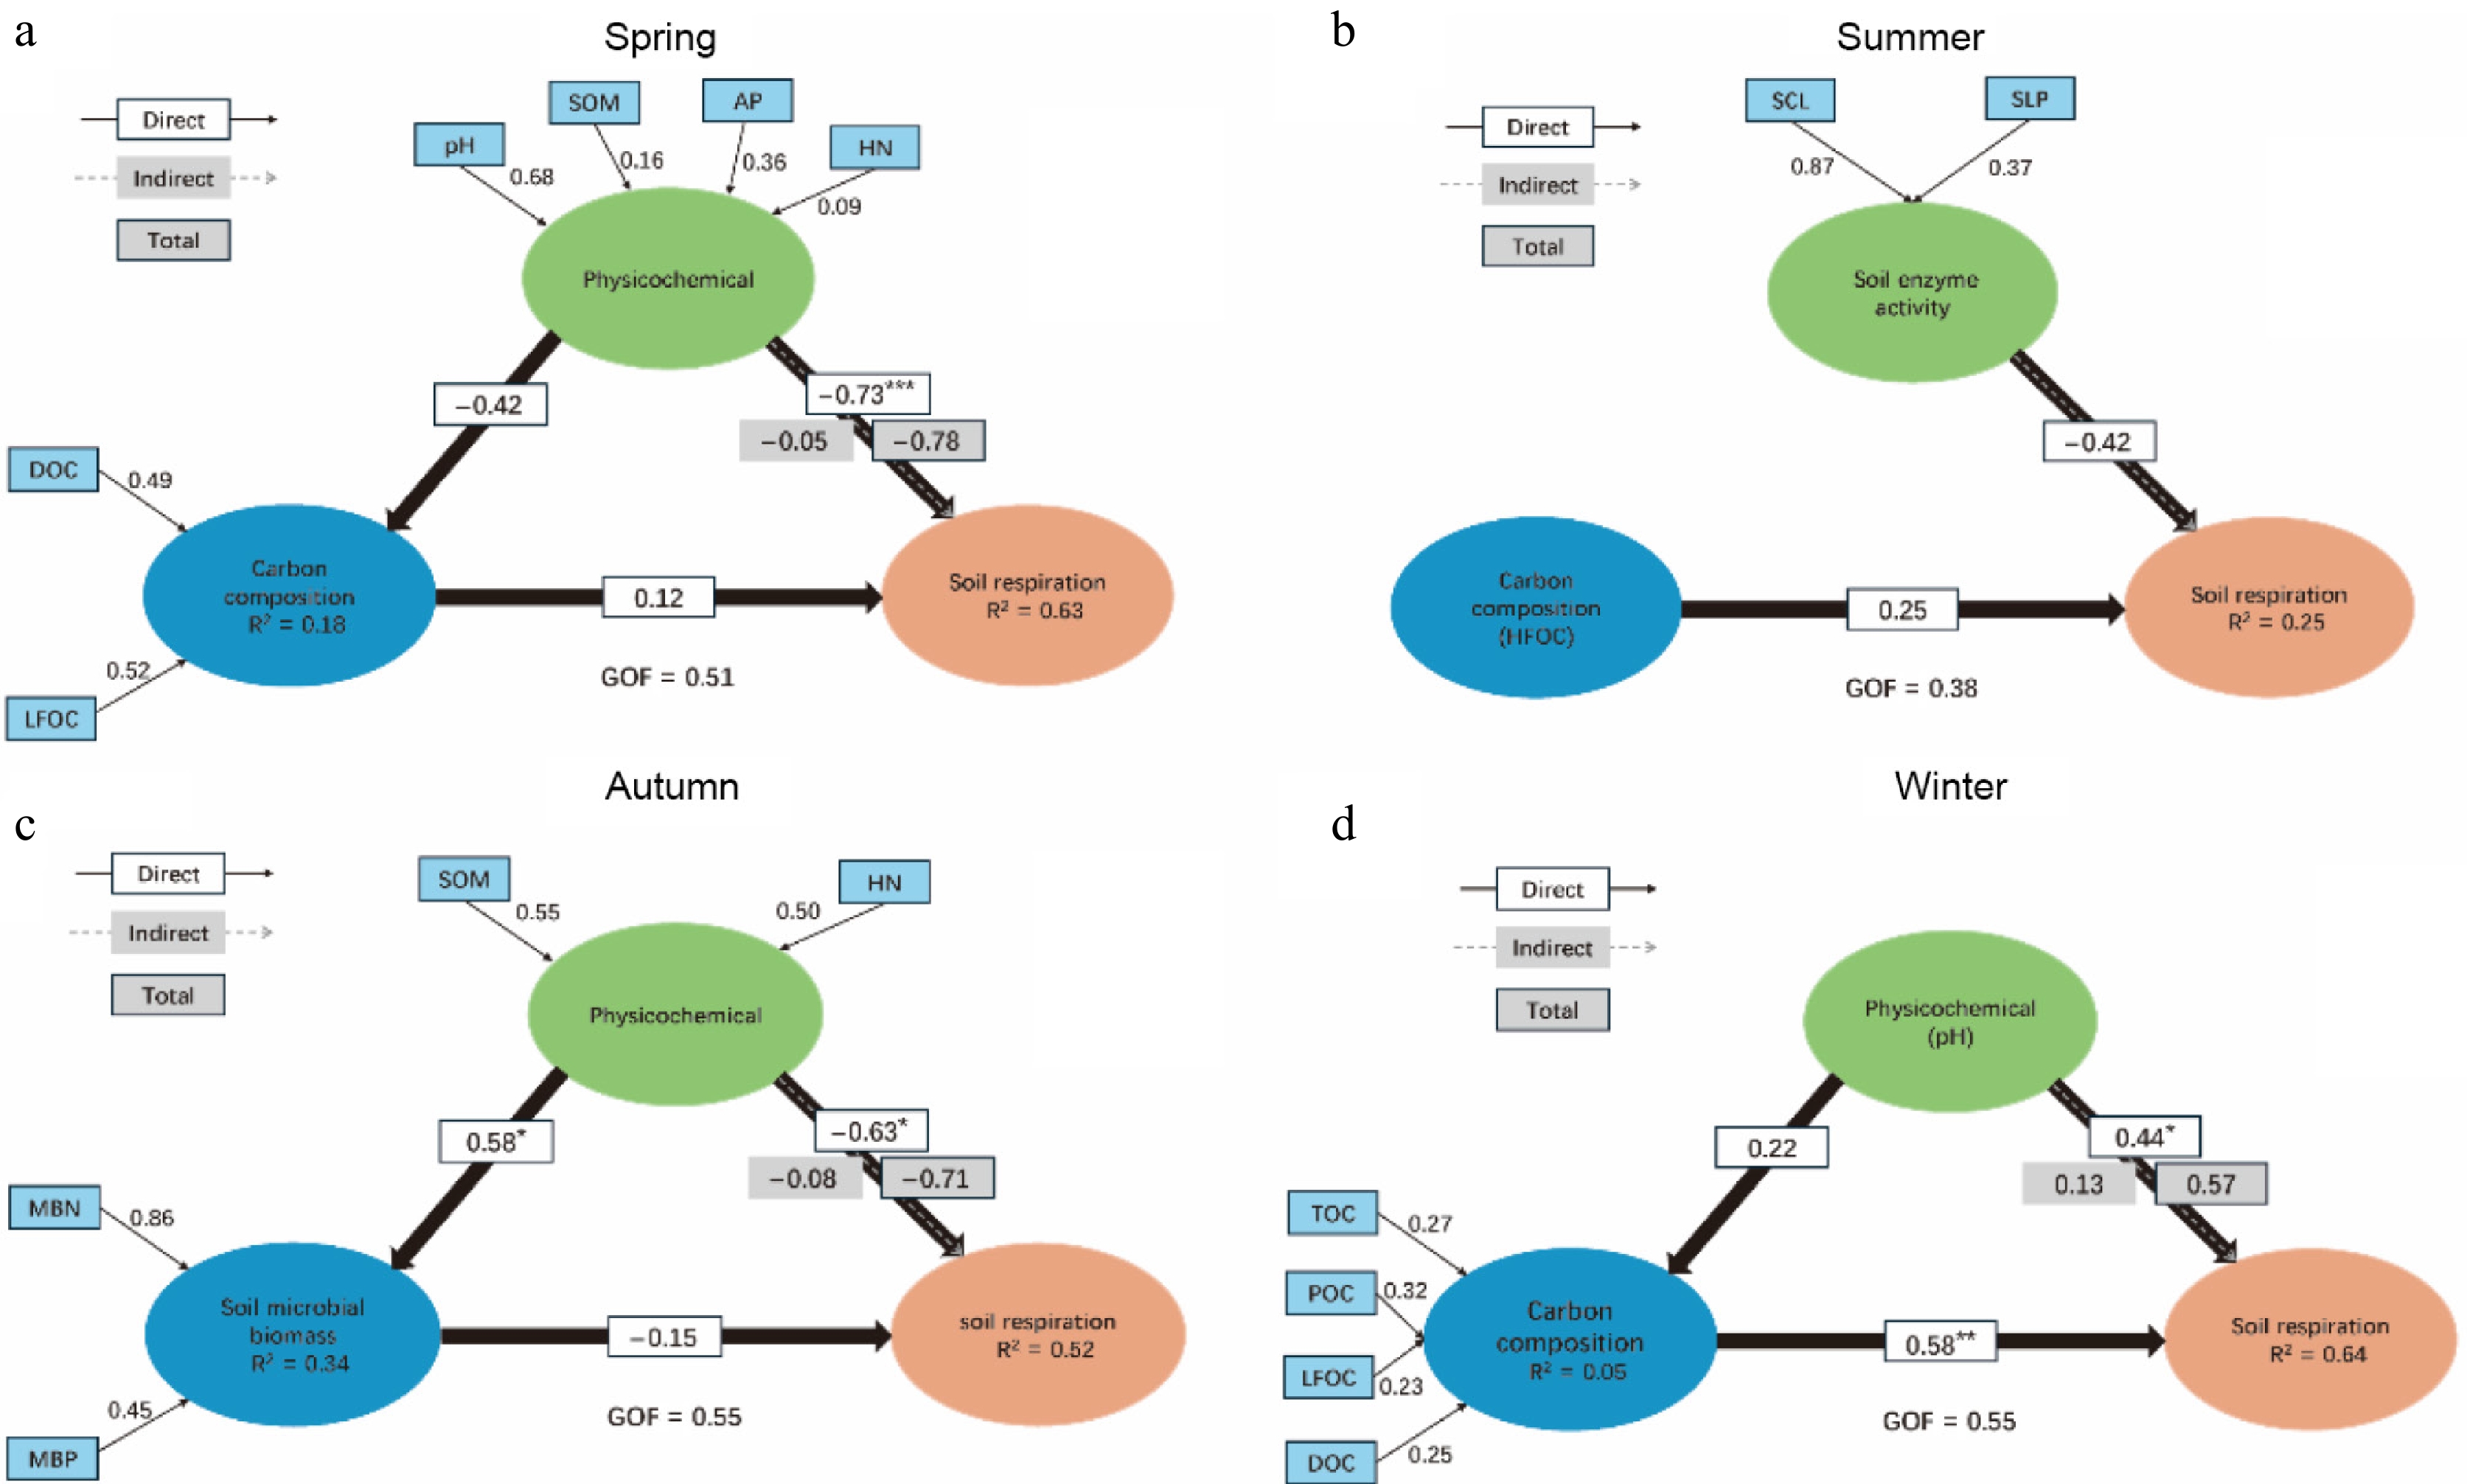
Figure 6.
PLSPM analysis of the effects of different factors on soil respiration in various seasons: (a) Spring; (b) summer; (c) autumn; (d) winter. The numbers on the arrows represent path coefficients. "Direct" stands for direct effects, "Indirect" denotes indirect effects, and "Total" represents total effects. Significance levels: *** p < 0.001, ** p < 0.01, * and p < 0.05. The goodness of fit (GOF) index was used to assess model performance.
Figures
(6)
Tables
(0)